
 Home/Blog
UPDATE: This post has been superseded by this one in which I remove inter-station biases with a new station merging strategy.
This is the Tmin (daily minimum temperature) version of the Canada temperature trend results I posted yesterday , which were for Tmax (daily maximum temperatures). These results are quite different: whereas the high temperatures have seen essentially no warming trends across southern Canada since 1900, the nighttime temperatures have warmed in each one of the 6 provinces. In the next few days I will post just how much these observed Canadian temperature trends depart from the CMIP6 climate model simulations, which are the primary tool being used to change energy policy.
SUMMARY
- Over the period 1900-2023, the average summer (JJA) daily low temperatures across the six southernmost large provinces of Canada (British Columbia, Alberta, Saskatchewan, Manitoba, Ontario, and Quebec) show warming trends, averaging +0.14 C/decade.
- The strongest warming (+0.18 C/decade) occurred for the coolest summer nights (coolest 3 days per summer month), while the warmest summer nights warmed at +0.10 C/decade.
- Whereas 7 of the 10 warmest summer daytime (high) temperatures occurred in the 1930s, 8 of 10 of the warmest nighttime (low) temperatures have occurred since 2003.
- Results for the 6 provinces separately are also presented.
Introduction
Below I present analyses of summertime daily low temperature (Tmin) trends from all available stations in the 6 southernmost large provinces, based upon the daily Global Historical Climate Network (GHCNd) dataset. These are the 6 provinces that border the Lower 48, and contain 86% of Canada’s population. (The results for daily high temperatures [Tmax] were posted yesterday.)
I simply averaged together the relevant statistics (monthly average Tmin, average of the warmest 3 days’ Tmin in each month, and average of the coolest 3 days’ Tmin in each month) from all available stations. Each station had to have at least 90% of the days in a month reporting data for that month to be included in the analysis.
Since stations come and go over the years, and since there are some large terrain elevation variations in western Canada, I performed an elevation correction to these Tmin metrics, in all provinces, using the departure of each year’s station-average elevation from the all-year (1900-2023) station average elevation, using a lapse rate of 6.5 deg. C per km. Corrections for average changes in station-average latitude were not done, which might be necessary in the winter since there are large North-South gradients in air temperature then. Such corrections in the summer would likely be small, but I can revisit that nuance at a later time.
Results
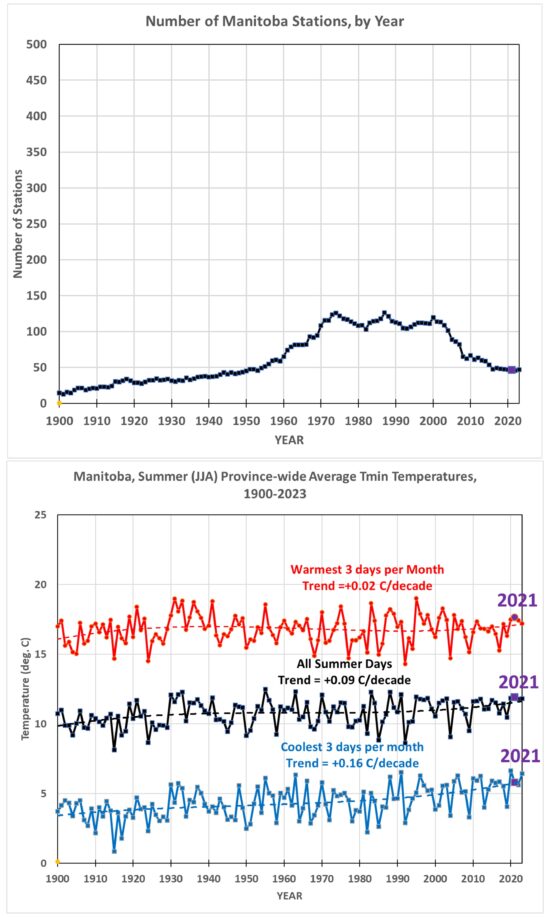
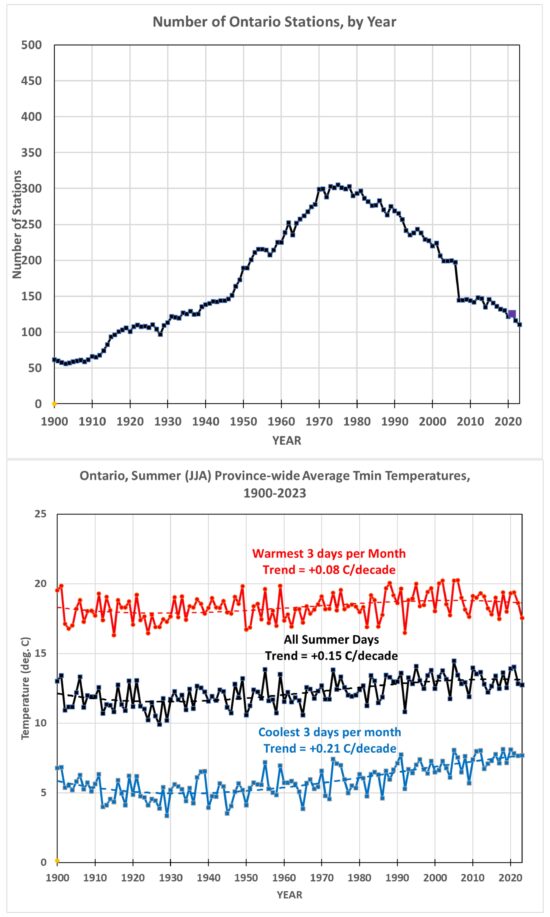
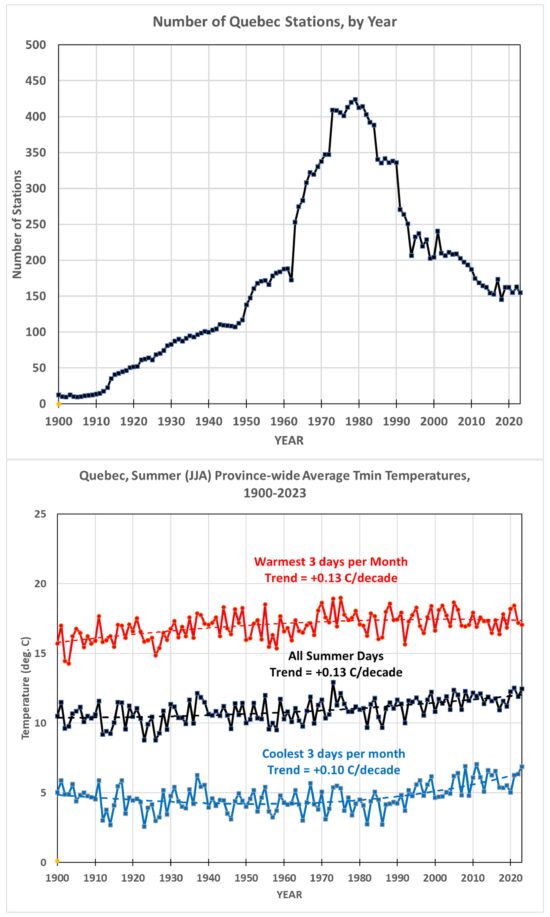
I’ll start with the 6-province average Tmin temperature time series, along with the total number of stations available in each year. In all plots that follow, I list the linear temperature trends, but plot a 3rd order polynomial fit to the data to help capture any multi-decadal variations not well reflected in simple linear trends. In all provinces the number of stations increases from 1900 to the 1970s, then decreases substantially in recent years.
As can be seen in the first plot (averages for all 6 major provinces), there has been an average summertime warming trend of +0.14 C/decade
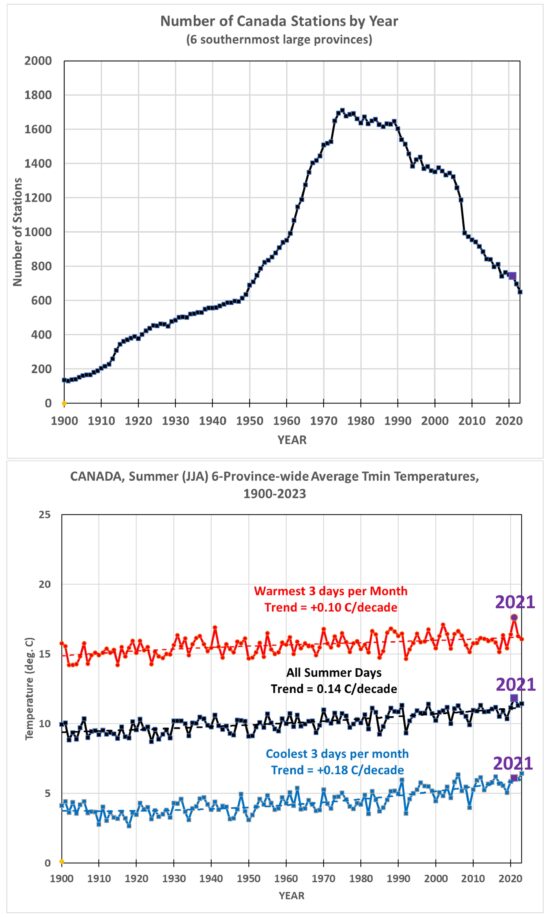
I have also annotated 2021, which experienced the extreme heatwave in late June in western Canada. That event helped to push the warmest 3-day average Tmin metric (red curve) to the highest average temperature of any year since 1900. (Just to be clear, this is the warmest 3 days in each month in *minimum* daily temperature [Tmin]).
Notably, 8 of the 10 warmest summers in the all-days average Tmin have occurred since 2003. But, as I will show in the next few days, numbers matter: these warming trends are well below what the CMIP6 climate models produce for the same region of Canada.
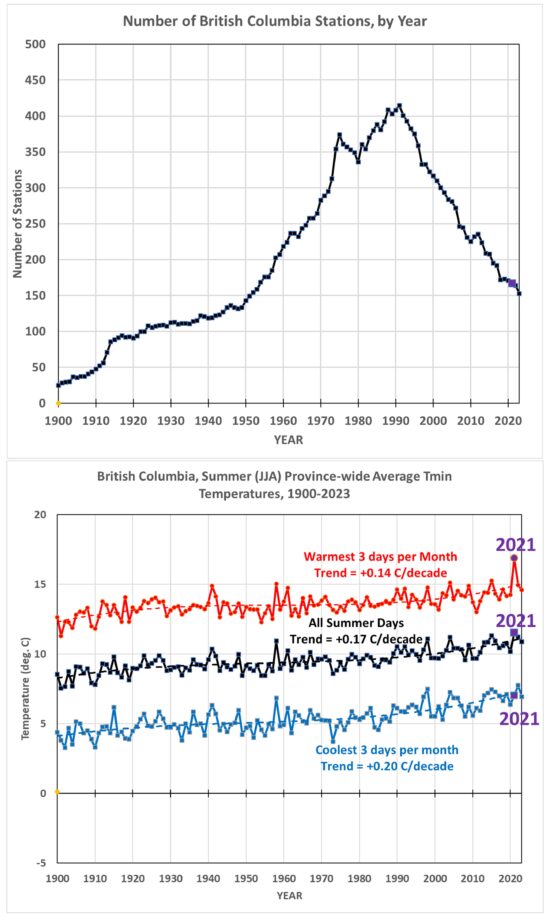
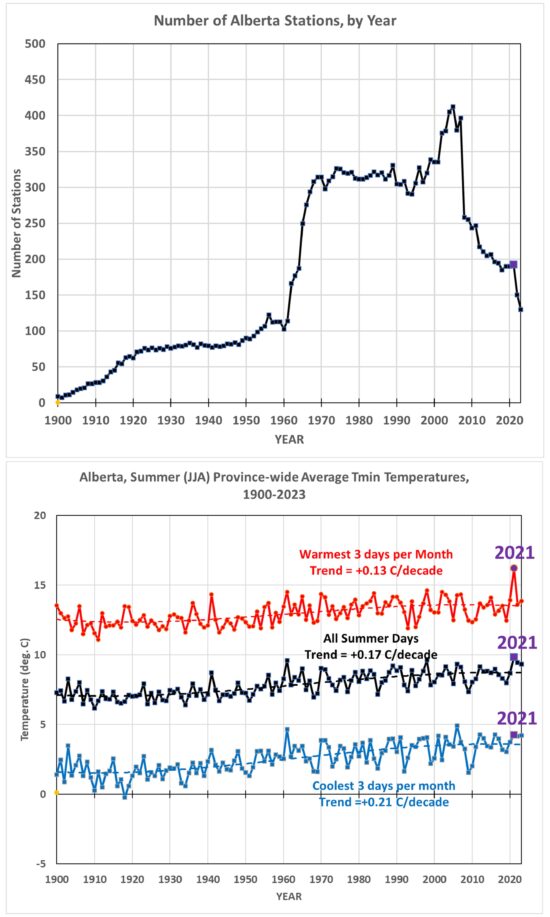
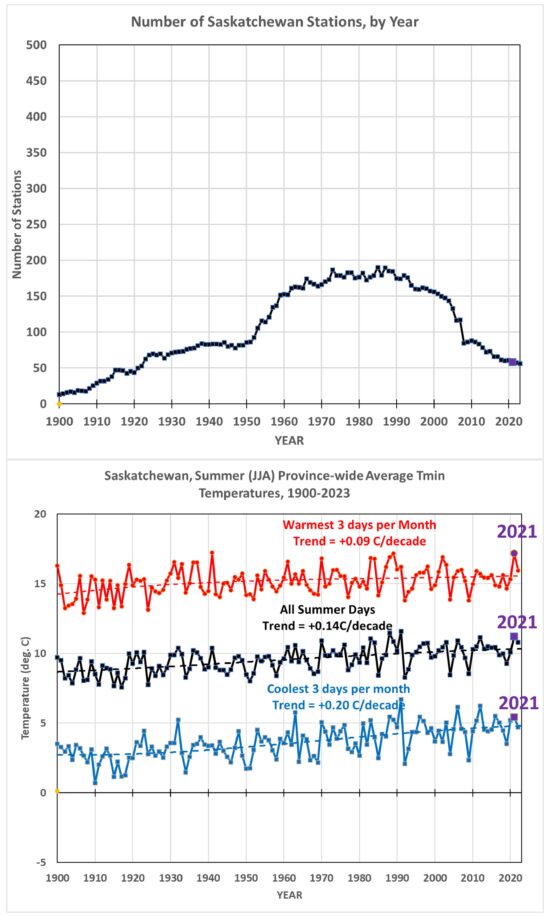
Individual Provinces
The results for the individual provinces follow. I present them without comment; my Canadian friends can peruse the results for their home province if they wish. These are presented from West to East:


Again, none of this is meaningful, because it traces a long term average of inhomogeneous quantities. Anomalies are the standard way of avoiding that. The stations reporting in 2025 are not at all the same as the stations reporting in 1925. They are on average colder places, as development creeps north. This change in the selection of stations looks like a cooling, but does not indicate that any pleace is getting colder.
I commented on that here, for maxima:
https://www.drroyspencer.com/2025/12/canada-summer-daily-high-temperature-trends-1900-2023/#comment-1725021. Here is the quantification for Alberta:
https://s3-us-west-1.amazonaws.com/www.moyhu.org/2025/12/alberta.png
It shows the progress of the average climate normal for Alberta in July. There is up to a degree of cooling, which just reflects that the places reporting in successive months are colder places.
It appears this research was done to address items in the Canadian news media. The general public has a much better understanding of actual recorded temperatures than they do of anomalies. I believe in terms of public reports anomalies have been abused when it comes to scale, which is the biggest bone of contention between believers and skeptics (the religious term usage is intentional).
Your point about the claim of new stations being further north is interesting to me. I wondered about the large increase in stations from 1960 to 1980 (government policy decision?) and then the precipitous drop from 1980 til now. You actually are touching on one of the biggest concerns that skeptics have of AGW – the influence of the urban/suburban location and even very poor choices of the sites for weather stations. Global warming is real. So is the urban heat island effect.
BTW, my usage of skeptic and believers is somewhat tongue-in-cheek. I prefer to be called a critic, which is a needed role in seeking truth, is it not?
To provide more of a perspective, could you please also show on the same graph the results for:
the 1 day warmest/coolest
the 2 day warmest/coolest
and the 4 day coolest warmest ?
I am sure the comparisons would be fascinating.
For the record, the Canadian weather folks report a summertime warming of 2.1 C for the period 1948-2024 or about 0.27 C/decade for the 77 year period.
https://www.canada.ca/en/environment-climate-change/services/environmental-indicators/temperature-change.html#DSM