
 Home/Blog
UPDATE: Criticism of the Following Post from The Daily Sceptic
Due to the holidays, I just now saw the post at The Daily Sceptic criticizing my support of the UK Met Office methodology for combining temperature monitoring stations’ data. In retrospect, I should have made it clear that my comments that follow only address the UKMO method for combining stations of various lengths of record, how they “replace” closed stations with surrounding stations, and the use of urbanization-influenced stations. I do not mean to suggest that there are no other time-dependent changes (say, in instrumentation types) that could cause spurious warming in the record. Nor do I claim there are no time-dependent increases in urban heat island spurious biases in the record. I only address (1) the fact that a closed station being replaced with a surrounding station does not necessarily cause problems with long-term monitoring; (2) that the UKMO creation of a fine (1×1 km) grid of UK temperatures from extremely sparse data does not seem to cause spurious trends in the record, and (3) just because a station is poorly-sited doesn’t mean it can’t be used for long-term monitoring. I agree that there are other issues I did not address which impact long-term trends in the UK (or elsewhere). In other words, I was not trying to be comprehensive in my analysis.
SUMMARY
- My analysis of UK daily high (Tmax) and low (Tmin) temperatures during 1960-2025 using a station relative bias removal method produces UK-average summer temperature variations essentially identical to the very different UKMO methodology.
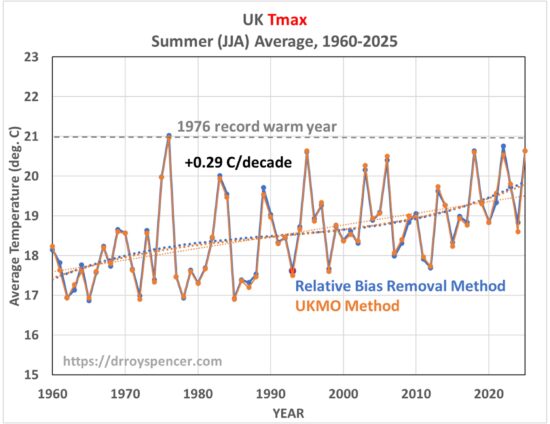
- In both my and the UKMO analysis, 1976 (not 2025) was the hottest summer in daily high temperatures (Tmax), with 2025 taking 3rd or 4th place; the “record” hot year of 2025 was due to nightly low temperatures (Tmin) being anomalously warm.
- The average of the three hottest daytime temperatures in each summer month put the summer of 2025 in 4th place since 1960, behind 1976, 1995, and 2022 (which were essentially identical).
There has been criticism of the UK Met Office’s methodology for monitoring long-term changes in UK-average temperatures, starting with Tallbloke’s (Ray Sanders’) blog post on 31 October 2024. A major criticism that Tallbloke has is the fact that most UK stations do not meet the World Meteorological Organization (WMO) criteria for a good climate monitoring station. The UKMO doesn’t actually use the WMO quality classification system, but their own 4-tiered system. Another criticism is that many UK stations have closed in recent years, and so those stations are, in effect, estimated (“fabricated”?) from surrounding stations.
No Station is Perfect
On the subject of which WMO (or UKMO) class of station is suitable for long-term climate monitoring, I think it’s important to note that a station could be placed in a non-natural, anomalously warm urban environment, but as long as that environment stays the same over time, it can probably still be used for climate change monitoring.
For example, the urban heat island (UHI) effect of London was described over 200 years ago by Luke Howard. Even if London is significantly warmer than the surrounding rural areas, it might be that there has been little additional UHI warming since then, and so a downtown London weather station might be adequate for monitoring large-scale climate change, since I have no reason to believe that (say) 1 deg. C of large-scale warming will lead to city warming substantially different from 1 deg. C.
On the additional subject of replacing a closed station with estimates from surrounding stations (which NOAA also does because so many of their UNHCN stations in the U.S. have closed, a process that has also been criticized), I believe it is a little disingenuous to claim those data are “fabricated”. Rather than continuing the closed station record with estimates from surrounding stations, one could just use the surrounding stations, which is the same thing.
The UKMO’s Fancy High-Resolution Mapping of UK Temperatures
The Met Office divides the UK land mass into tiny (1×1 km) grid cells, and the temperature in each one is estimated from the nearest station(s) using average, regression-based adjustments for elevation, latitude, longitude, terrain shape, coastal proximity, and land use variations. The result is a seemingly complete coverage of UK for the purpose of temperature monitoring:
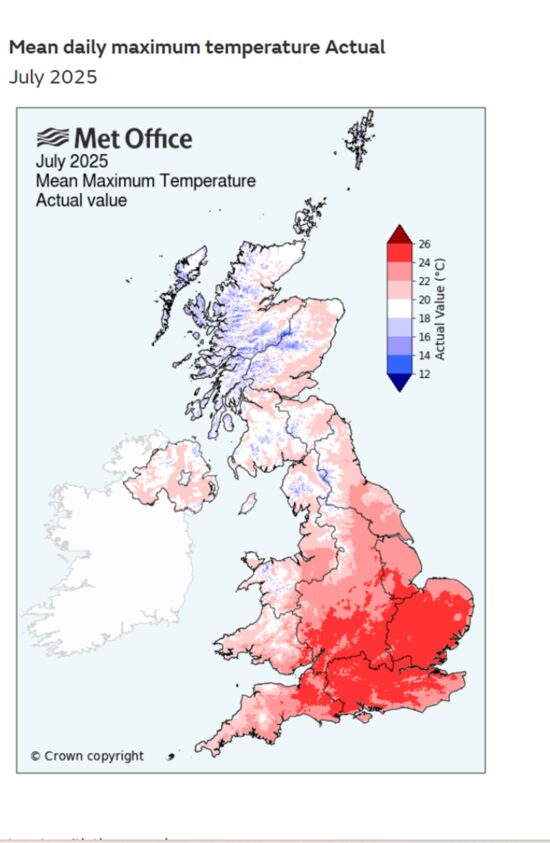
And I get why this is done: the UKMO primary mission is to provide daily weather monitoring and forecasts, and given limited station data providing actual measurements, their system provides useful temperature estimates in areas far removed from actual weather stations.
Of course, all of this high-resolution fanciness must be anchored by actual measurements, and in the daily Global Historical Climate Network (GHCNd) database, only ~100 stations exist across the UK in recent years. (There were very few GHCNd stations before 1960, so I will address temperature change only since then here). This means only 1 in ~2,400 UK grid cells has an actual temperature monitoring station in the GHCNd dataset, which is the dataset all global temperature monitoring efforts rely upon. While the UKMO might have access to somewhat more stations than are included in the GHCNd dataset, my point will remain valid.
Nevertheless, this doesn’t mean that long-term climate change can’t be monitored with the existing station network. What complicates matters is that stations come and go over time, and this can introduce biases that change over time and corrupt long-term estimates of temperature change. How one accounts for, and adjusts for, these changes is not a settled matter.
Removing Relative Biases Between Stations
From what I’ve been able to glean, the UKMO does not actually calculate and remove relative biases between stations. Instead, they use the above-described strategy to evaluate how station temperatures vary with latitude, longitude, elevation, proximity to the coast, land use (e.g. urbanization), etc., then apply regression-based techniques to estimate temperatures on the 1×1 km grid. This has no doubt involved considerable effort, and having done similar kinds of data analysis myself, it’s a complex task.
A simpler way of monitoring climate change is to assume that long-term (in the current example, 65 years) warming trends that actually exist in nature are pretty uniform across the UK. If this assumption holds, we can just take whatever stations exist over time, no matter where they are located or what their local microclimate-induced biases are, and quantify how the temperatures at each one varies over time, and then average all of those variations together. This methodology is somewhat similar to that of Hansen and Lebedeff, 1987, as well as our UAH satellite global temperature dataset.
In my implementation of this relative bias removal method, I start with the stations having the longest periods of record. In the UK, only 3 stations have had continuous records in all 126 years from 1900 to 2025: CET Central England, Armagh, and Stornoway Airport. (Only 31% of the UK stations had periods of record at least half as long, 63+ years). I average those 3 stations together. Then, I take the station(s) with the next-longest record (Oxford, 124 years), compute the average difference with the original series, and add it to the series to make a new 4-station average. This is done sequentially for all (148) stations in the UK since 1900 that have at least 2 years of record, going down the list from the longest periods of record to the shortest. Again, since there were few stations before 1960, the following plots cover variations since 1960.
Amazingly, the result using this simple relative bias removal method produces yearly summer-average temperatures (average of daily high [Tmax] and daily low [Tmin]) that are nearly identical to the much fancier UKMO methodology:
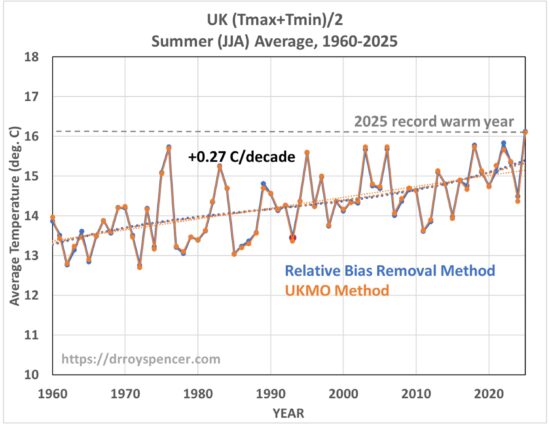
In this plot (as well as the others, below) for display purposes I have removed a small (~1-2 deg C) temperature offset due to my use of the original 3 stations for an absolute temperature baseline, whereas the UKMO uses their gridded estimate of the entire area of the UK. The linear trends in the above plot are essentially identical, at +0.27 C/decade.
But that record high did not exist for the daytime high temperatures. As seen in the next plot, 2025 was very similar to several years since 1995, while 1976 holds the record for hottest summertime daily high temperatures:
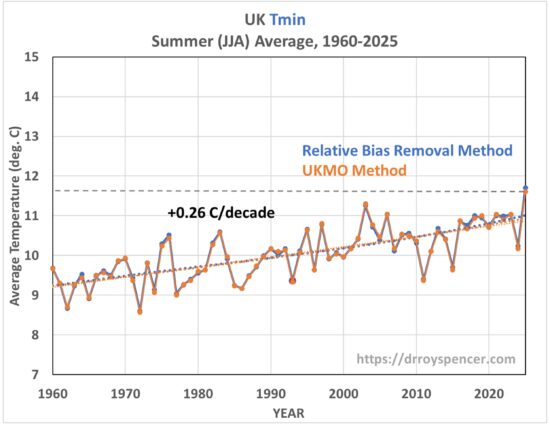
So, where did the 2025 record come from? It was due to the nighttime temperatures being so warm (although I don’t see how 53 deg. F is is insufferably warm). This was true in both analyses of the station data:
Finally, since I am analyzing daily temperature data, I can compute the average of the three hottest daytime temperatures in each summer month, which produces this:
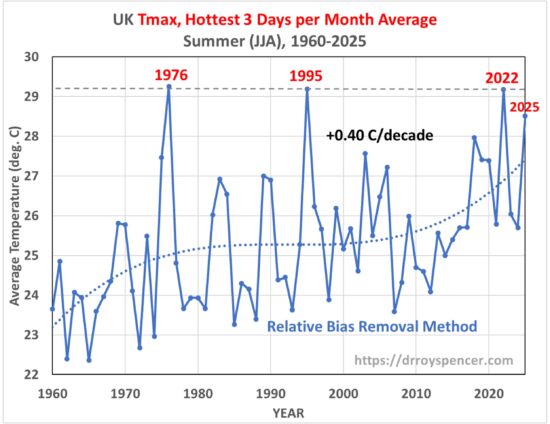
For this statistic we see that the record is a 3-way tie between 1976, 1995, and 2022. We also see a stronger warming trend (+0.40 C/decade vs ~+0.26 C/decade in all-days average Tmax and Tmin). I suspect this is due to more Saharan air intrusions in recent decades, which are the primary cause of excessively hot days in the UK.
Conclusions
Despite criticisms of the UKMO data and methods for computing UK-average temperatures, I find that a simple bias-removal method of combining all available UK stations produces essentially identical results to the much more complex UKMO methodology. It should provide some vindication for the UKMO methodology in the context of climate temperature trend monitoring.
The record hot summer of 2025 in the UK was in the nightly minimum temperatures, not in the daytime maximum temperatures. This is true in both my analysis and that of the UKMO.
Finally, neither my nor the UKMO method accounts for possible changes in stations over time, such as an increasing urban heat island (UHI) effect at some stations. Based upon our work on this in recent years I suspect this effect since 1960 would be small, but I don’t know that for sure.


For interest, here are graphically displayed Met Office records going back over a hundred years for each region of the UK (England, Wales, Scotland and Northern Ireland).
https://www.metoffice.gov.uk/research/climate/maps-and-data/uk-temperature-rainfall-and-sunshine-time-series
I wonder if Robert Frost read Luke Howard’s observations?
Thanks, Dr. Roy, interesting. However, you say:
“Even if London is significantly warmer than the surrounding rural areas, it might be that there has been little additional UHI warming since then”
Given that there were no cars and thus no burning of gasoline/diesel 200 years ago, and that the buildings in London block far more wind than they did back then, and that there is much more concrete to absorb heat in the daytime and radiate it at night, and that there are far more humans each putting out 100W or so constantly …
… I find the idea that there has been little additional UHI warming since 1825 to be tenuous at best.
Do you have data to back that claim up?
It’s particularly worrisome because you claim that the record is in nighttime temperatures, and UHI is known to raise nighttime temperatures more than daytime temperatures.
For example, a US Environmental Protection Agency synthesis of observational studies reports that in US cities, typical daytime air temperatures are about 1–7 °F (0.6–3.9 °C) higher than nearby outlying areas, while nighttime air temperatures are about 2–5 °F (1.1–2.8 °C) higher. These values are based on measured air temperatures at urban and rural stations rather than model projections.
https://www.epa.gov/heatislands/what-are-heat-islands
My very best to you as always,
w.
I didn’t claim that. I said, “It might be that..”. I was using an extreme example to make the point that the mere presence of UHI doesn’t mean temperature trends are corrupted. And I agree, there probably has been urban warming in downtown London since the early 1800s.
Roy,
I think your method works for getting an estimate for the numerical average, which is not much affected by the changing station population. As you say, it is similar to that of Hansen and Lebedeff, within grid cells.
But unlike the UKMO method, it does not do area weighting. That is not so important for a small region like the UK (or Hansen’s grid cells), where the GHCN stations are reasonably evenly distributed. But it would not be good for global.
I use a simple method, which works for global (I use it every month). You just write down a stat model for what you want, for each month of the year. It is
T_st=L_s+G_t+ε_st
where the subscripts are s for station and t for time. L_s is a station offset representing its climate ( a “normal”) and constant in t. And G is an overall time varying average, which is what you want. You find L and G by least squares fitting (minimise ε). That sounds hard, but is here very easy. You just start with a guess, which could be L=G=0. Then you fit L, say, holding G constant. That is just an average of L-G over time. Then you fit G by averageing T-L over stations, and iterate. 5-10 iterations should do.
I used this method with the GHCNd data for Alberta, and got basically the same answers as you (part 2). And I use it globally, regularly, and get much the same as GISS and NOAA. But there is art to how to average L-G over stations. You use a uniform average, but it should really be area-weighted.
I have written a more detailed exposition on my blog here:
https://moyhu.blogspot.com/2025/12/averaging-temperature-over-timeregion.html
“That is just an average of L-G over time. Then you fit G by averageing T-L over stations, and iterate. 5-10 iterations should do.”
Sorry, typo. L-G should be T-G. Same in next para.
Since 1870 the UK population has doubled, the energy consumed and wasted into the environment has increased, farms have increased, industry has increased.
To hope that the urban heat island is relatively small is not really tenable. The UK Met office is well known for fudging data.
I do wonder if the UK Met office data has a disproportionate affect on the world data.
no matter where the MET office place 2025. as far as English Summers go, if you ask anyone of age from farming , horticultural or forestry to name one Summer they will all say 1976 was the one that stands out, even today it was still the warmest and driest since the Summer of 1868 .not only for the remarkable no of days over 30c this year Northumberland only recorded 3. that includes one day when temperature reached 33c, 1976 also recorded the lowest soil moisture content of any year at Kew.all rivers in the UK were severely short of water , it was so warm in Newcastle that barristers were allowed to remove their wigs during trials, that year you could walk across any river in England without getting your feet wet, my amateur records put 2025 as the fourth warmest. because the UK climate varies between north and south , you can almost draw a line across the country from Norwich , the Southern part predominately dry and warm, and the north cooler and damp. the south is influenced by the continent,urban sprawl now dominates the south east.hardly surprising with a UK population now close to 70 million and its proximity to France a little over 20 miles.this makes temperature comparisons with the past difficult.
I remember summer 1976 being very warm in Lincoln, Lincolnshire but
recently the high temperature record was broken with a value of about 29 centigrade which I found amazing. How did it not get warmer than that before?
Still no idea about why Roy Spencer keeps so deeply fixated on his summer JJA tmax series; but he is the professional guy, and perfectly knows what he does.
*
Here is my simple layman view on UK (to which Ireland aka Eire was added for practical reasons), based as always on the raw GHCN daily data.
*
1. Tmin/Tmax anomalies wrt the mean of 1981-2010, starting in Jan 1900
https://drive.google.com/file/d/1mStjWhW6nmtJAT3CDby33J2dGQaqRXsB/view
*
*
GHCN stations having sufficient data during the reference period (99) have an own baseline and hence strictly local anomalies; those stations lacking a baseline but located in the very x/y/z near to baselined stations (65) inherited their baselines.
I’m not primarily interested in continuous records; my personal interest is in collecting as much anomaly-based data as possible.
*
Oxford data starts in 1815, you really ‘see’ the Tambora eruption within it.
*
2. Tmean anomalies wrt the mean of 1991-2020, starting in Dec 1978 and compared to a UAH 6.1 LT time series generated out of a 2.5 degree grid cell rectangle encompassing the land surfaces
https://drive.google.com/file/d/15raB8bwc_cEty4p17gcGcmgNAmWLEiOR/view
Of course: the UAH data is a trivial grid cell average without land/water separation.
*
Trends till Oct 2025 in °C / decade for GHCN daily and UAH data
– 1900
GHCN: 0.11 +- 0.02
– 1950
GHCN: 0.21 +- 0.03
– 1980
GHCN: 0.34 +- 0.04
UAH: 0.16 +- 0.04
– 2000
GHCN: 0.31 +- 0.06
UAH: 0.30 +- 0.08
*
As always the same effect when comparing UAH LT to surface station sets: UAH temperatures start high and end low, what partly explains UAH’s eternally lower trends over the entire sat era.
For 2000-2025 however, the trends are nearly equal.
As always too, it was onece more interesting to see how often surface and LT anomalies match, but also their running means showing similar ups and downs despite averaging two 100% different data sources…
*
A last chart: the yearly average of GHCN’s UK+EI data, which looks a bit as it was a global Had~CRUT time series :–)
https://drive.google.com/file/d/1TvGdx5awonQGDvZ-E-qTIAO2z_NiFpol/view
It’s funny to observe all that!
To answer your first question, I fixate on summertime high temperatures because for global warming, that is what most people are concerned about. Warmer nights or warmer winters, not so much.
Thank you for the reply which of course raises the question:
Which people exactly do you mean with ‘… because for global warming, that is what most people are concerned about’ ?
Most of what I have read about global warming in the last decade rather was concentrating about increasing minima, especially in big cities…
Thank you Dr Spencer for your great work over the years.
Unfortunately you are on a looser trying to justify the well known political corruption of the Met Office.
Presumably you are familiar with Nut Zero as most call our corrupt governments efforts to bludgeon us back to the stone age. The met office’s main function is to achieve that.
So long as you don’t start justifying the existence of that other government Marxist mouthpiece – the lyin’ bee bee cee, you are forgiven.
Happy Christmas
Very interesting study.
I am close to commencing my own, non-professional study of temperatures in Greater Cincinnati, where I have lived for all but 2 of my 77 years on earth. We have a very long temperature record. The great Cleveland Abbe established our first station before moving to Washington. WLW radio and TV had a very professional staff of meteorogists who maintained a station beginning in the 1920s. And then, two airport stations opened at different times.. I am going to attempt something a bit like what Roy did in England, but just for Cincinnati. A preliminary exploration – not really anything I will stand on YET – was pretty startling. Average temps by decade, showed no trend at all… average, max, and min for each decade. These were very rough numbers, though. I did not even look yet at station location, which stations were added, which ones dropped or closed. Altitude is not much of a factor, except for a few stations that are in river valleys, 300 to 400 feet below the surrounding terrain.
I will say, if you look at the current and prior normals, we only saw a +0.4F change in the max and +0.3F In the average at the station closest to my old house. Of course, that’s only 10 years, not enough to imply any trend, but it was a period that the news media hyped quite a bit. I remain underwhelmed.
NOAA has an online tool for visualizing temperature series that includes a number of cities. Cincinnati curiously appears under Kentucky, presumably because the airport is on the Covington side of the Ohio River.
Their record for Cincinnati goes back to 1948. It shows an average summer (JJA) temperature trend since 1970 of 0.5 F/decade to present. The average low temperature trend is higher and the average high lower.
https://www.ncei.noaa.gov/access/monitoring/climate-at-a-glance/city/time-series/USW00093814/tavg/3/8/1948-2025?base_prd=true&begbaseyear=1991&endbaseyear=2020&trend=true&trend_base=10&begtrendyear=1970&endtrendyear=2025&filter=true&filterType=loess
Thanks, that’s helpful. Those numbers make sense for that time period, with other data I have been looking at. I’m going to cover the entire period where warming has been an issue – 1880s to the present. The station is at CVG airport which is in northern Kentucky, part of “the tristate”. Air passengers coming to Cincinnati sometimes express a moment of panic when then land in Kentucky, thinking they somehow boarded the wrong plane, plane was diverted, etc.
I am going to try to use several seemingly reliable stations over each decade (I am going to calculate or use median, max, and min for decades and see what results).
Suddenly everyone wants to express some opinion about Cincinnati, especially those who have never been there, hehe.
No no no: I don’t want to be left out of this either!
https://drive.google.com/file/d/1nQlmAVgPDUeglJXlXpIVrxyWLX-1xAxU/view
Brrr… it was quite cold there in January 1977.
In Cincinnati, February 1936 was also bitterly cold… yet, according to ‘skeptics’, the 1930s were all about scorching heat.
https://www.facebook.com/groups/977072337382029/posts/1405335244555734/
I have a couple brothers in the region near Cincinnati and grew up not far from there myself before moving to central NY state many decades ago.
My reply to Thomas was really to point out prior art on what he proposed doing. While I encourage people to dig into data, it’s important to understand what work has already been done. More importantly if one comes up with results that differ significantly from what presumed subject matter experts have produced its important to fairly reconcile why that might be. That is, self skepticism is a key trait of anyone hoping to practice credible scientific analysis.
Mark B
Although my comment wasn’t directed at you at all (I meant myself, ironically), I still thank you for this insightful response, which, however, should primarily be addressed to the group of arrogant, pseudo-skeptical ignoramuses who shamelessly discredit and denigrate Roy Spencer’s work:
https://dailysceptic.org/2025/12/23/dr-roy-spencers-backing-of-uk-met-office-temperature-record-draws-furious-counter-reaction/
simply because it doesn’t fit their narrative, which, as is so often the case, is based on incredibly superficial weather station data ‘analyses’, and is most likely influenced in some way by the Heritage Foundation, the Heartland Institute, or the Global Warming Policy Foundation.
I am curious how the Atlantic Multidecadal Oscillation (AMO) might play into the warming shown. Busy with Christmas and sick relatives so I don’t have the time to look into this at the moment. I believe Berkeley Earth, in their initial report, found that AMO could potentially be more of a factor in long term warming than ENSO. Don’t know much about it, but if it can affect global temps, surely it must have quite an impact on Merry Old England.
Which actual dataset did you use? Can I check your workings?
Just a minor quibble about your analysis, almost certainly not invalidating it in any way. CET is not a station, it is an average over 3 stations, which vary in time, with homogenization (done badly IMO) to remove UHI and artifacts that occur when the station composition changes.
Either by luck or judgement or lack of expertise the UK Met Office has otherwise avoided the homogenization errors that plague other institutions, but there are some small errors in CET:
https://diymetanalysis.wordpress.com/2025/09/26/hadcetv2/
Roy,
My brother worked for the UK Met Office until a few years ago. He assures me that whilst they have their own weather station standards, they are fully signed up to and use the WMO 5 tier classification as a matter of routine
Regards
did he mention the junk stations the MET office are using that are rated no better than four or five by the wMO, many stations in the Southern counties that were once rural are now surrounded by Urban sprawl, Stonebridge is a very different place today than it was in 1868 when it set the disputed temperature of 38c, Kew is buried in Cambridge,and Heathrow has grown over the years.taking into account the Continental influence, it is easy to see why the Southern part of the UK shows the most of the warming, lamb noted that a change in Atlantic weather systems from a southerly track to a more northerly track, may play some part in changing climatic conditions.
Ian Brown is known as a very opinionated person and hence should read this document:
https://weather.metoffice.gov.uk/learn-about/how-forecasts-are-made/observations/in-depth-classifying-land-based-observations
Have you considered this?https://tallbloke.wordpress.com/2025/12/21/mystifying-met-office-advocacy-defending-the-indefensible-and-disparaging-the-talkshop-not-on-my-watch/
https://dailysceptic.org/2025/12/23/dr-roy-spencers-backing-of-uk-met-office-temperature-record-draws-furious-counter-reaction/
AI summary of criticism:
The article highlights strong opposition from climate skeptics who have long criticized the Met Office for using poorly sited stations (e.g., near airports, buildings, or urban developments) and alleged data adjustments that inflate warming trends.
Ray Sanders, who has conducted detailed audits of nearly all ~400 Met Office sites, dismissed Spencer’s analysis as “a load of twaddle,” arguing that flawed raw data cannot be reliably corrected through modeling—no matter how sophisticated.
Sanders and others (including Dr. Eric Huxter and Paul Homewood) pointed to issues like station relocations, changes from traditional thermometers to electronic sensors (which can add artificial warming spikes), and ongoing urban development that invalidates assumptions of “stable” environments.
They contend that Spencer’s defense overlooks these fundamental data quality problems.
I think I am onto something with the oscillation effect on UK climate over the late 1970s thru the rest of the period studied. Before 76, it looks like there was no trend. Then NAO may have driven (or added to) the record heat. Then, AMO looks to have been in a warming phase for most of the rest of the period. If you are looking for causation, I don’t know how you can separate out CO2 warming from AMO (and sometimes NAO).
” Before 76, it looks like there was no trend. ”
This is of course 100% correct when looking e.g. at a trend period from 1900 to 1976:
https://drive.google.com/file/d/1KtmqDRjnxV7bTk1kFRLNw8O_m0FK9Sn8/view
But do only those trends matter which are computed from the start of a time series?
What about looking at the complementary side?
https://drive.google.com/file/d/1hBkDxs4aZ4nqgDiZXA0zz0BbjU37Uo6e/view
That’s the question…
Just in front of Xmas a little hint…
Below you will find the same charts as above, however, the TMIN/TMAX trends for the UK+EI data are no longer calculated in terms of absolute temperatures, but in terms of the usual ‘anomalies with removal of the annual cycle’.
*
Fixed start running trends
https://drive.google.com/file/d/1g6Yr5z9rillm6Q_pVlNhTKPaBpxYlQez/view
Fixed end running trends
https://drive.google.com/file/d/1tMCw_Sqo7EyIaLOPMDOw6BUtkdkNJzKp/view
You are not going to post my response are you. That’s fine by me but you really have not enhanced your reputation at all. In case you missed it here it is
https://tallbloke.wordpress.com/2025/12/21/mystifying-met-office-advocacy-defending-the-indefensible-and-disparaging-the-talkshop-not-on-my-watch/
Roy,
This is all interesting number play, but why do you wish to deviate from the standard uncertainty analysis as in GUM from BIPM?
GUM allows for measured deviations to be incorporated into a total uncertainty, whereas the methods here from the Met Office, your good self, Nick Stokes, Bindidon et al all rely upon guesses about the size of each correction, even when the reason for the correction and/or its magnitude are usually not known.
Your guesswork corrections have to be able to cope validly with measured errors, such as those documented by Pat Frank for drift in early LIG thermometers.
https://doi.org/10.3390/s23135976
Next, you adjust using daily Tmax and Tmin which is dicey given that real data show a large range of distributions with different ratios of Tmax to Tmin.
https://www.geoffstuff.com/dists.jpg
One more next, I regard it as invalid to derive Taverage from Tmax and Tmin because the processes in Nature that lead to the capture of one or the other value on a given day are quite different.
Do you have a reluctance to use the GUM level of formality, or are you offering a different methodology for those with an interest to compare with GUM? Geoff S
Part two of two
Geoff Sherrington
To have a meaningful discussion about (Tmin+Tmax)/2 versus the 24-hour average, you would need to eliminate all these spatiotemporal dependencies using statistical tools like regression.
I’m a retired engineer and have no knowledge, let alone professional experience, in statistics.
However, through my exposure to climate data processing via specialists like Roy Spencer’s blog, I’ve learned how useful anomalies that eliminate seasonal dependencies can be for resolving other local dependencies, such as station location in x/y/z.
*
Here’s an example of how the differences between (Tmin+Tmax)/2 and the 24-hour average disappear in time series data when you switch from absolute data to such anomalies: the ones you get from Meteostat for stations in the Tropics.
Absolute daily data:
https://drive.google.com/file/d/1_0TthnCtcX6y9YiNsr0p-jSNg4khTOso/view
365-day baselines from daily data for the period 1981-2010:
https://drive.google.com/file/d/1Wi6txsE12XAyiUv0Gi0piKTGHmkOGPhx/view
Daily anomalies calculated from the respective 365-day baselines:
https://drive.google.com/file/d/1wHlBuzb4fGn9w-PVwpM3wCLNHdffgUNq/view
*
You might do the same job with all the NOAA hourly data available for Australia:
https://www.ncei.noaa.gov/data/global-hourly/access/
No idea why the comment’s first part didn’t pass thru…
Maybe this way:
https://drive.google.com/file/d/1_jwDuEEzNbwrr_ouZgFpWXuYSzcUcufl/view
Geoff Sherrington
” GUM allows for measured deviations to be incorporated into a total uncertainty, whereas the methods here from the Met Office, your good self, Nick Stokes, Bindidon et al all rely upon guesses about the size of each correction, even when the reason for the correction and/or its magnitude are usually not known. ”
It would be, by the way, very interesting to see how you manage to successfully point out one of my alleged correctionss in any data I have processed.
Bindidon,
If you use anything but raw historic temperatures data, such as homogenised data used by many bodies these days, then you are among those reliant upon guesses. Science or non-science? Acceptable guesswork should be allowed or not allowed? Geoff S
Geoff,
The Berkley Earth temperature anomaly process does not use homogenized station data in the conventional sense. I’m curious how you feel about their process and results, particularly given that the whole BE effort and approach was driven by the sort of complaints about station data manipulation that you seem to be making here.
Met-office…aka Hadcrut…closely aligned to NOAA and NASA GISS. both known cheaters and data fabricators, especially retroactively.
Example, Phil Brown, recent head of Hadcrut. In the Climategate emails he was discovered….
1)bragging about his proposal as a Coordinating Lead Author with the IPCC, in cahoots with ‘Kevin’, of seeing to it that certain skeptical papers did not reach the review stage. Kevin is the name of his CLA partner at IPCC reviews.
Let’s add the IPCC to known cheaters and data fabricators. They tell good fairly tales as well, like the fable that the Little Ice Age was pertinent only to Europe. Also, that it is very likely that humans have caused global warming since 1850.
In a subsequent investigation, by his peers (cronies), and those on his side, Jones was absolved of any wrong-doing.
2)bragging that he had used Michael Mann’s method of hiding declining temperatures in his own work. Of course, Mann is associated with GISS through Gavin Schmidt, his partner at the uber-alarmist site realclimate. Mann had used his ‘trick’ to hide declining proxy temperature by conveniently snipping them off and replacing them with real temperatures that were increasing at the time.
Mind you, Mann’s action was a moot point since an investigating body from the National Academy of Science ruled his use of pine bristlecone as the sole proxy for the 20th century was inadmissable.
Imagine, Hadcrut has done the same kind of cheating.
3)discussing climate issues in private that contradicted his alarmist view in public.
Yes. we can really rely on Hadcrut to tell it like it is. [/sarc off]
Speaking of NOAA and NASA GISS and their cheating, both announced 2014 as the hottest year ever. You can see from the UAH graph that 2014 was nowhere close to being a record setting year.
When the fine print was fleshed out, it became apparent that both NOAA and GISS had used probabilities for making their claim, with NOAA at 48% likelihood and GISS at 38%. No reputable scientists would dare to make such ludicrous claims based on probability, with NOAA’s 48% indicating the same outcome from flipping a coin.
In the past, GISS was caught quietly trying to replace 1998 as the hottest year at the time over 1934. Steve McIntyre caught them and GISS quietly moved back to 1934. Today the experts in chicanery have quietly replaced hot years in the distant past with more modern years.
https://climateaudit.org/2007/08/08/a-new-leaderboard-at-the-us-open/
Google AI, when asked about this, ignores the climteaudit articles and reference people to climate alarmist sites. So much, of AI and objectivity.
The point to note is that the 1930s had years that were as hot or hotter than anything today. Furthermore, they had far more heat waves in North America.
When the IPCC announced in 2013, that no warming had occurred between 1998 and 2012, NOAA went back and fabricated a slight warming trend by manipulating sea surface temps.
Why have outfits like NOAA, GISS, and Hadcrut resorted to cheating in order to implant in the minds of the public a false narrative re past warming events?
Because they’re inculcated with leftists. And if leftists can implant that there is a problem in peoples’ minds then they can implant that their solution is the only solution. Then if your response is that their solution is ridiculous, then they will say for you to come up with a better solution. So, you’re stuck arguing solutions to a problem that never existed.
Gordo,
The Minnesota state flag was recently changed, and it now resembles the flag of Somalia. The leftists took over science and now they’re attempting to take over the rest. That is why they hate Trump. He stands in their way.
Robertson’s hatred against all climate data processing people (except UAH of course, but only because they show low temperatures everywhere since evah) is beyond the imaginable.
He is as always an incompetent, ignorant liar.
*
When he writes:
” The point to note is that the 1930s had years that were as hot or hotter than anything today. ”
then he doesn’t even understand that this is valid only for July’s maximum temperatures in the contiguous US states:
https://www.ncei.noaa.gov/access/monitoring/climate-at-a-glance/national/time-series/110/tmax/1/7/1895-2025
If you move to global data, you obtain of course something quite different:
https://www.ncei.noaa.gov/access/monitoring/climate-at-a-glance/global/time-series/globe/land/tavg/1/7/1895-2025
*
This is perfectly corroborated by a comparison of maxima and minima measured at thousands of GHCN daily stations, and processed in exactly the same way as made by John Christy in 2020.
CONUS
https://drive.google.com/file/d/1rno0fot3CYmeaNFk8W-ekGtRvtCAeXi4/view
Globe
https://drive.google.com/file/d/1pExxoH5V2t-BK2xuijU1thtmuoj-VSES/view
Anyone can observe how great the dirfference is between the 1930’s in CONUS and the same decade worldwide.
binny’s statement is much like the IPCC assessment that the Little Ice Age was local to Europe only. In the 1930s, there were no satellite records and the surface record was relatively non-existent.
How would we know what was happening in the rest of the planet when much of it was inaccessible? Russia was closed, China was closed, and none of the rest of the planet gave a hoot about the mythical anthropogenic global warming meme. I can’t imagine any decent data coming out of Africa or South America.
GHCN is propaganda re in the 1930s, mainly because it has been seriously fudged by climate alarmists. I would not be surprised if they have not hired you to further their propaganda.
Gordon, tell the people who want to re write history that he LIA was global evidence was found in caves in New Zealand, it was well documented in China, people like Sabine wrote of it, Sabine himself was ice bound south of Greenland for many weeks, while monitoring Earths magnetism, he also noted ice flows of the coast of Argentina, Both Manley and Lamb accepted it was world wide, but in a world of couch potatoes glued to google, moving goal posts is easy.
Bindidon,
If you use anything but raw historic temperatures data, such as homogenised data used by many bodies these days, then you are among those reliant upon guesses. Science or non-science? Acceptable guesswork should be allowed or not allowed? Geoff S
Geoff Sherrington
” If you use anything but raw historic temperatures data… ”
Thank you for the reply, but… it shows that you know about the raw GHCN daily data corner as much as does ignoramus Robertson, namely absolutely nothing: this is, I am really sorry, no compliment at all.
*
2. ” … such as homogenised data used by many bodies these days… ”
Here too, you express things similar to ignoramus Robertson.
*
Were you familiar to GHCN daily and to UAH’s grid data, you then would be able to compare the two to those you discredit as ‘reliant upon guesses’.
Here is for example a comparison I made months ago of
– GHCN daily
– NOAA Climate at a Glance
with regard to temperatures in, around an 4 km above Vancouver, British Columbia, Canada (the corner where ignoramus Robertson lives) since 1937:
https://drive.google.com/file/d/1tybkryQS0YDNisurUdAv9Gb62QZCSc6Z/view
In addition, the same data, now compared in the sat era to
– UAH 6.1 LT
https://drive.google.com/file/d/1AOnVvwB9Hp3Maz_C4a6JIIz-QWzlGaip/view
*
Please don’t waste your time in polemically discrediting what I did; try to technically contradict it instead.
*
Sources for the Vancouver graph
GHCN daily: 15 stations in/around Vancouver
https://www1.ncdc.noaa.gov/pub/data/ghcn/daily/
UAH 6.1 LT: 2.5 degree grid cell above Vancouver (48.75N, 123.75W)
https://vortex.nsstc.uah.edu/data/msu/v6.1/tlt/
NOAA Climate at a Glance for 49N-123W
https://www.ncei.noaa.gov/access/monitoring/climate-at-a-glance/global/time-series/49,-123/land_ocean/tavg/1/0/1937-2025/data.csv
Geoff Sherrington (cntnd)
I read again this strange stuff:
” If you use anything but raw historic temperatures data, such as homogenised data used by many bodies these days, then you are among those reliant upon guesses. ”
Why strange?
Simply because you started on December 24, 2025 at 7:02 PM a discussion centred around hourly data, to which I correspondingly replied on December 26, 2025 at 1:01 PM with exclusively hourly data processing.
But a few days later, you suddenly start the all-time known, usual pseudo-skeptic discussion centred on ‘homogenised data’.
Are you serious?
Do you really think and would you claim that anyone anywhere on Earth, including myself, would waste huge amounts of time in homogenising hourly data, like for example NOAA’s USCRN ‘hourly02’ data set?
And I thought you would discuss about (TMIN+TMAX)/2 versus 24 h averages!
Maybe you restart thinking from scratch by drawing personal conclusions about these following four graphs comparing the two daily averaging methods for two USCRN stations during their common activity period.
1. USCRN station Kenai
26563 60.7237 -150.4484 86.0 AK_Kenai_29_ENE (2011-2025)
1.1 Daily absolute data
https://drive.google.com/file/d/16EC1CsalB_h7_MEi_hsnozyVXUIYKF5D/view
1.2 Daily anomalies wrt the mean of 2011-2020
https://drive.google.com/file/d/1V-2SfWOCXBOpFQ4HN8MJK_5aS8frHCpi/view
2. USCRN station Everglades
92826 25.8996 -81.3183 1.2 FL_Everglades_City_5_NE
2.1 Daily absolute data
https://drive.google.com/file/d/1nTcIeHzTCQm9ibk9w_oPoX0Er5YL7_n5/view
2.2 Daily anomalies wrt the mean of 2011-2020
https://drive.google.com/file/d/1EJdowZcDGHn4ThKroSI4ONhh0hprxc8n/view
*
And maybe you think about
– the differences in absolute data between (TMIN+TMAX)/2 versus 24 h averages – depending on the latitude of the observed USCRN station, and about
– how much of these differences disappear when computing out of daily absolute time series the daily anomaly time series by subtracting from each day the corresponding value found for the same day in the stations’ respective daily baselines.
*
And then you’ll be welcome to disprove my claim that your statement
” One more next, I regard it as invalid to derive Taverage from Tmax and Tmin because the processes in Nature that lead to the capture of one or the other value on a given day are quite different ”
though being in theory correct, is in practice completely useless when constructing time series out of hourly data.
*
Maybe you finally have a look at this graph I made last year?
https://drive.google.com/file/d/1Zp4zDnMoyO3ZrQ1tXtngnV3F2t73sPkr/view
binny to geoff Sherrington…”Do you really think and would you claim that anyone anywhere on Earth, including myself, would waste huge amounts of time in homogenising hourly data, like for example NOAA’s USCRN ‘hourly02’ data set”?
***
Perfect example of why I have called you an ijit for several years now. Geoff is not claiming you are homogenizing data, he is inferring that NOAA, GISS, and Hadcrut are homogenizing data. In other words, you are using fudged data that is no better than a guess.
Geoff omitted an early step in the homogenization process, which is interpolation. If they don’t have data for a certain region, they take adjacent stations up to 1200 miles apart and interpolate the data to project a temperature for a third station. When the final results are in for all such stations, then they homogenize the data, which means smoothing ti to remove inconsistencies.
In the end, the data is completely fudged.
Your main source, GHCN has been seriously fudged since 1990, with 90% of the stations no longer used. In California, there are only three reporting stations, all near the ocean. The Canadian Arctic is covered by one station.
NOAA even admitted to slashing its 6000 global surface stations to less than 1500. When I posted a link to that revelation, you pointed to the date, around 2015, and claimed the data was out of date. You did not prove that NOAA’s claim is wrong.
The sad truth is that the surface stations have one thermometer to cover 100,000 km^2 of land area. The oceans are just as poorly covered.
roy…”I just now saw the post at The Daily Sceptic criticizing my support of the UK Met Office…”
***
Roy…the media in general is currently out of control. The way is being led by national bodies like our CBC (Canadian Broadcasting Corporation) who present lie after lie and distortion after distortion.
Don’t know if you recall the day our CBC invited Fred Singer to talk about his skepticism then ambushed him with claims that he supported the tobacco lobby in the 1960s. Those kinds of sleazeball news distortions are still used at CBC albeit in a more disguised and gently manner.
With regard to the Daily Skeptic article, they had this to say about you…
“Dr Roy Spencer is a brilliant sceptical scientist who is behind the valuable UAH satellite temperature record – an uncorrupted series that since 1979 shows less global warming than (frequently-adjusted) global surface datasets. He is one of the authors of the excellent climate report published recently by the US Department of Energy that has helped push back the notion of ‘settled’ political science. He is also an authority on urban heat island corruption. In a recent peer-reviewed paper with fellow Energy Department report author Professor John Christy it was calculated that the UHI effect accounted for about 22% of the observed summer warming across all US stations since 1895. For some of the suburban and urban locations – stations that Ray Sanders might refer to as “crap” – the UHI warming bias was no less than 65%”.
I would hardly call the article critical of you, the main beef is that you are supporting scumbags like Hadcrut.
The following are comments from the Daily Skeptic article that Roy thought was critical of him…I thought some were humorous, especially the one about the prostitutes nickers…
“varmint
Spencer has done some great work in the past and has drawn attention to the problems with recording temperatures. But the temperature record of earth remains a jumble of adjusted and manipulated data that has been fiddled about with more times a prostitutes knickers”.
***
“sskinner
And that jumbled and adjusted data is then averaged with a precision of 100ths of a degree C. Then that data is put into extremely expensive publicly funded super computers to ‘calculate’ average temperatures 20, 30, 50 years in the future. And all driven by individuals with University degrees”.
***
JXB
It’s a true miracle to produce precision output from imprecise input, which averages will always do.
Averages can always produce a decimal point not present in the input. 7 + 4 = 11, average 5.5.
***
varmint
Funny—–Here is the row of prostitutes knickers that are proof positive of global warming.
https://dailysceptic.org/wp-content/uploads/2025/12/image001-1766571954.2995.jpg
Wide margins of error for measurements at a few stations? The point is the headlines made possible: “Britain swelters. The highest ever reading for a July day was recorded at…”
Highest July temperature recorded in the UK, was nothing more than a spike, recorded on a super sensitive digital thermometer , a device that did not exist a few decades ago.many old stations in the UK have long gone, making it almost impossible to record trends. my records show very little change in summer, but an increase in mild wet winters. since 1989.
“…Saharan air intrusions…”
A particular sort of “Spanish plume.” Cars get a sticky film of red dust carried from the desert. Very hot weather but does not last long. Not really productive of drought as it usually ends with thunderstorms.