 Home/Blog
…posted without comment:
The Independent, March 2000: “Snowfalls are now just a thing of the past“

…posted without comment:
The Independent, March 2000: “Snowfalls are now just a thing of the past“
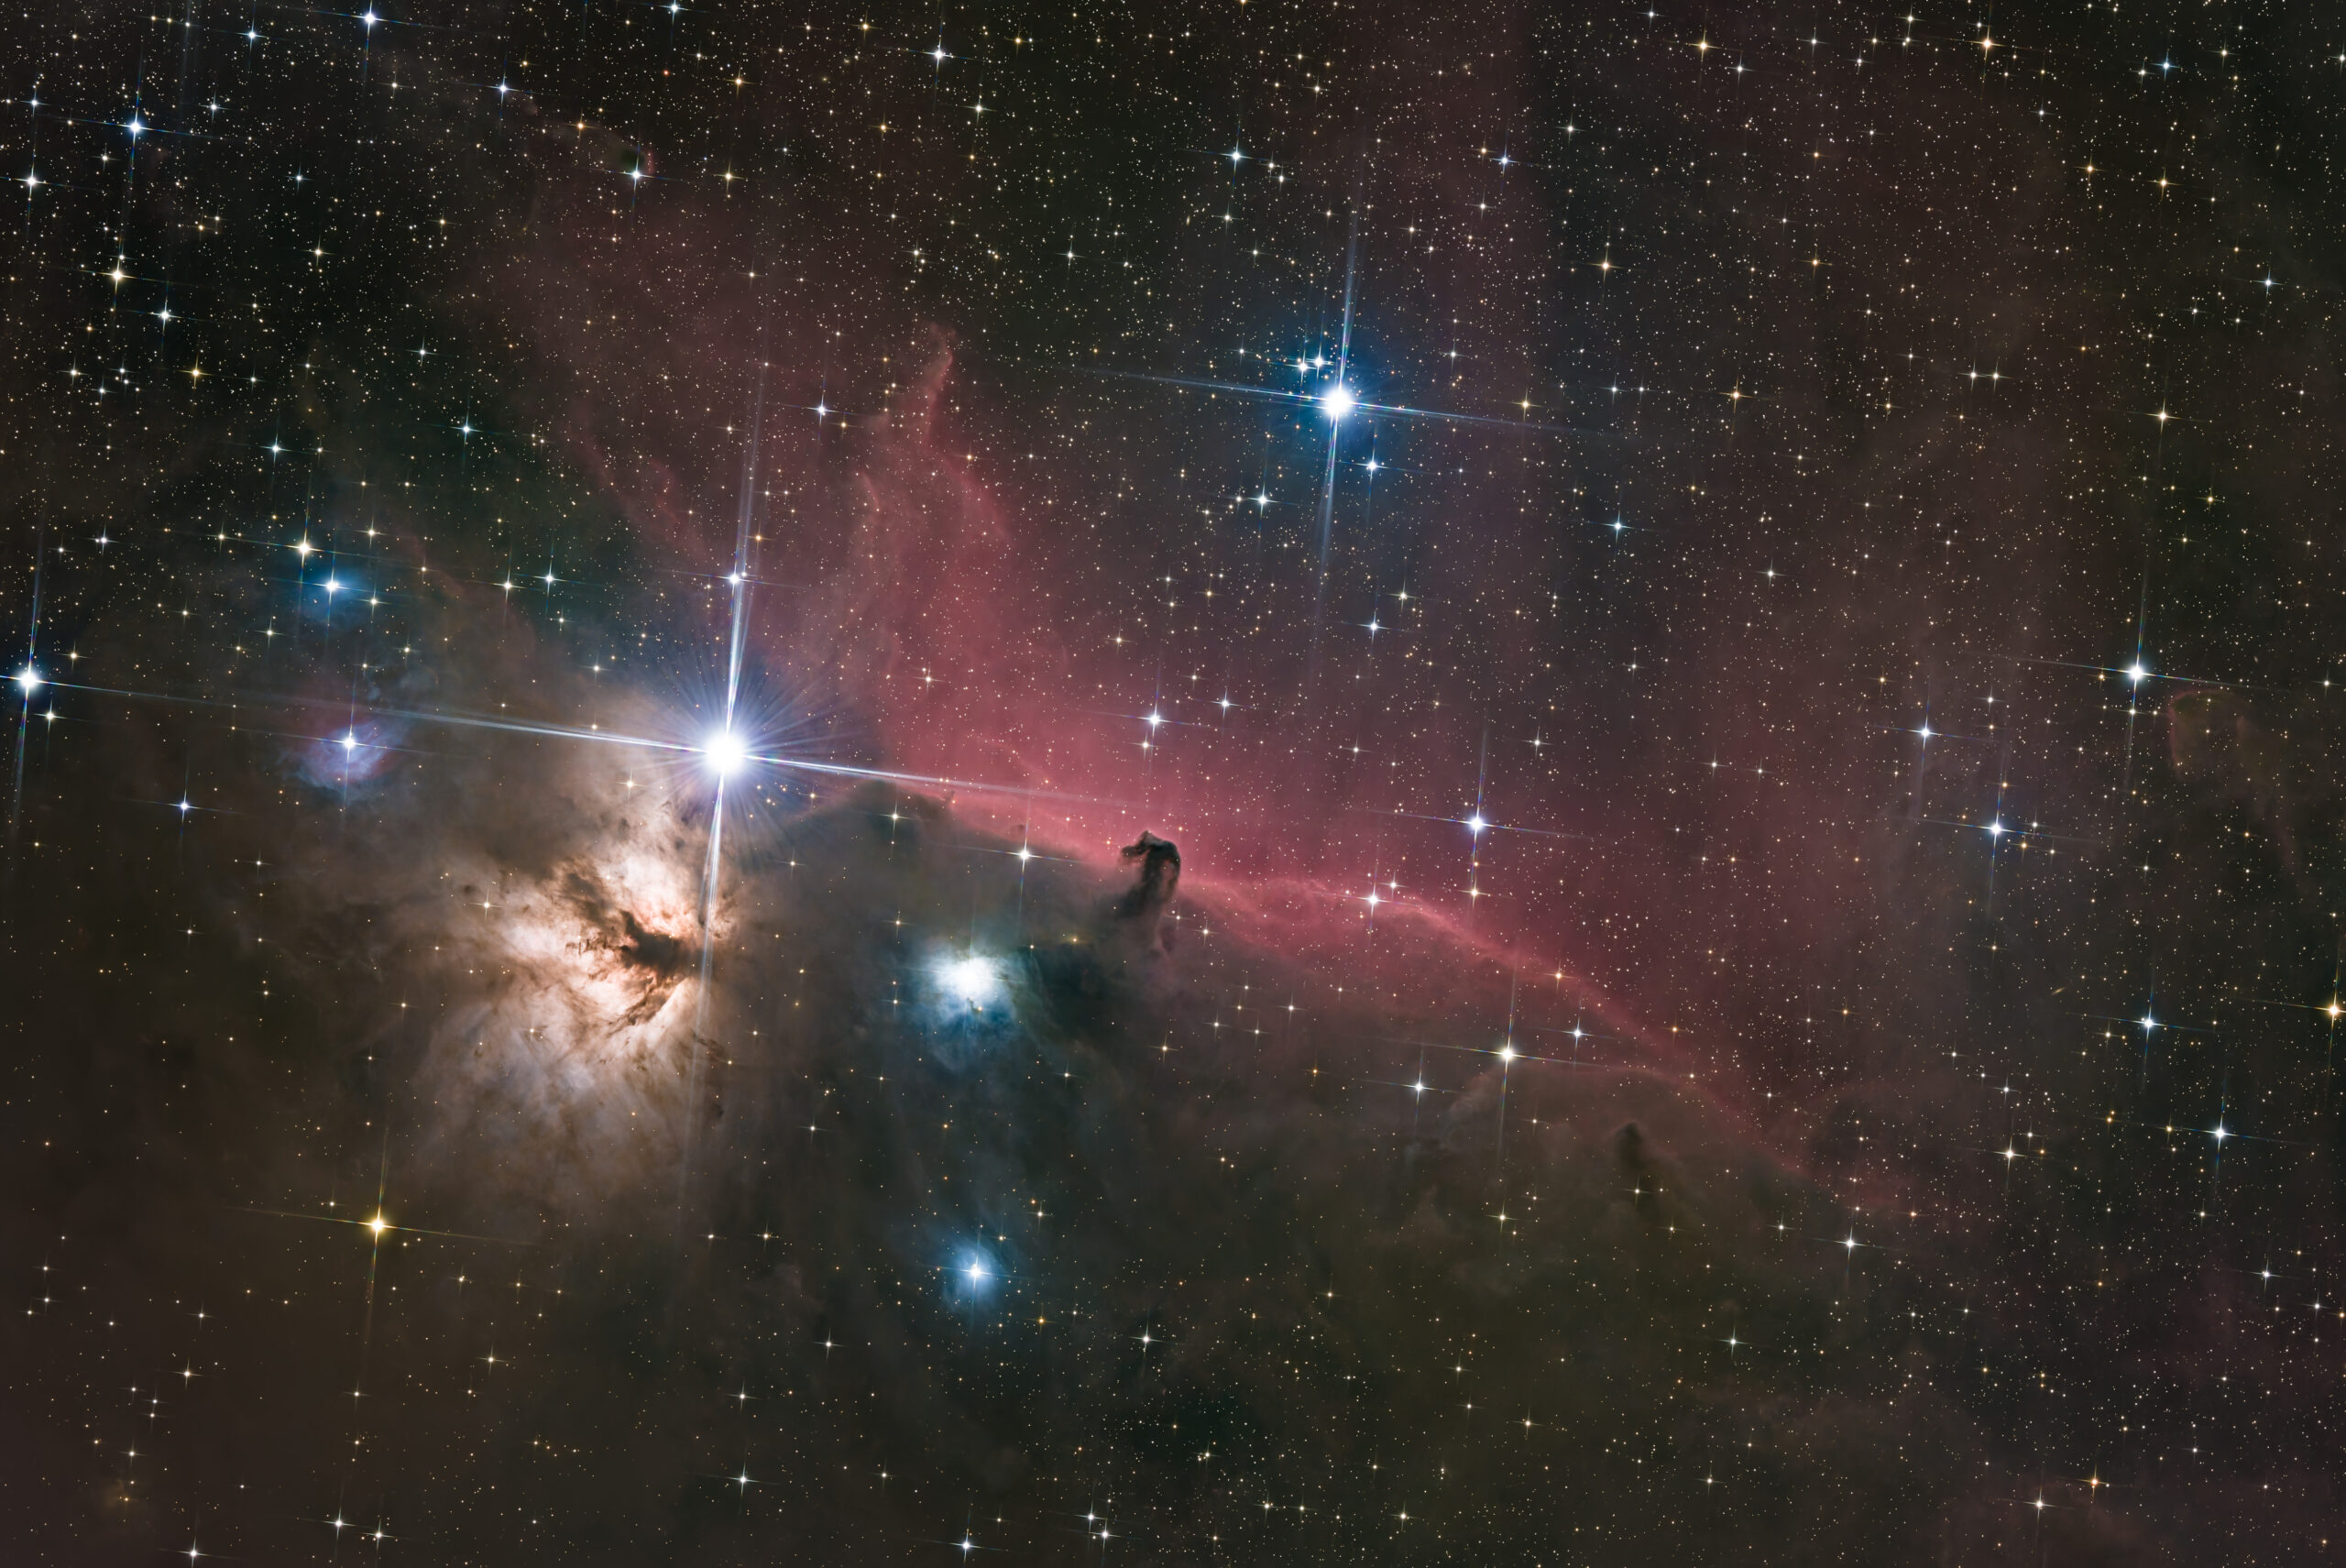
I got sucked back in when I learned about the ZWO ASIAir controller that “simplifies” some of the tasks that kept me from improving my telescope skills, so the telescope just sat for several years.
But the learning curve was still pretty steep. I now have an autofocuser, a guide scope and camera, and it took me forever to get the autoguiding to work (which I had to make myself understand and use because my new telescope mount has a periodic error in the gears that makes little star streaks back and forth).
Anyway, after I practiced enough in my suburban, moderately light-polluted backyard with some pretty good results, last night I took the rig out to a dark sky location on Alabama’s Lake Guntersville. This is the result: 4.25 hours of 5-minute images processed in Pixinsight and stretched and color-enhanced in Adobe Camera Raw. I was blown away… click on it to do some pixel-peeping.
As a follow-on to my recent post regarding global surface air temperature trends (1979-2025) and how they compare to climate models, this is an update on a similar comparison for tropical tropospheric temperature trends, courtesy of tabulations made by John Christy. It also represents an update to my popular “epic fail” blog post from 2013.
As most of you know, climate models suggest that the strongest warming response the climate system has to increasing anthropogenic greenhouse gas (GHG) emissions (mainly CO2 from fossil fuel burning) is in the tropical upper troposphere. This produces the model-anticipated “tropical hotspot”.
While the deep oceans represent the largest reservoir of heat energy storage in the climate system during warming, that signal is exceedingly small (hundredths of a degree C per decade) and so its uncertainty is rather large from an observational standpoint. In contrast, the tropical upper troposphere has the largest temperature response in climate models (up to 0.5 deg. C per decade).
This shown in the following plot of the decadal temperature trends from 39 climate models (red bars) compared to observations gathered from radiosondes (weather balloons); satellites; and global data reanalyses (which use all kinds of available meteorological data).
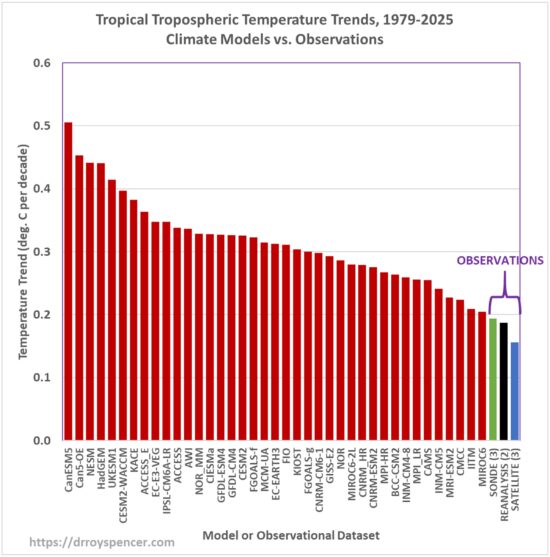
The sonde trend bar in the above plot (green) is the average of 3 datasets (radiosonde coverage of the tropics is very sparse); the reanalysis trend (black) is from 2 datasets, and the satellite trend (blue) is the average of 3 datasets. Out of all types of observational data, only the satellites provide complete coverage of the tropics.
Amazingly, all 39 climate models exhibit larger warming trends than all three classes of observational data.
Time Series, 1979-2025
If we compare the average model warming to the observations in individual years, we get the following time series (note that complete reanalysis data for 2025 are not yet available); color coding remains the same as in the previous plot:
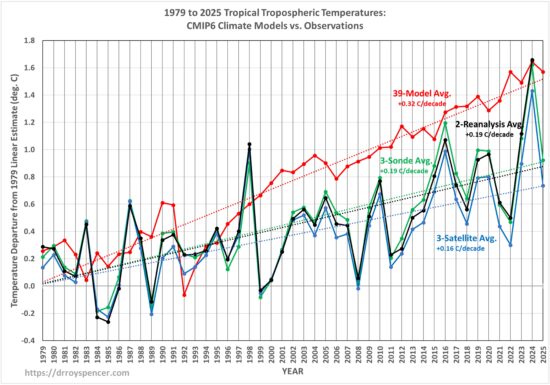
The unusually warm year of 2024 really stands out (likely due to a decrease in cloud cover letting in more sunlight), but in 2025 the satellites and radiosondes show a “return to trend”. Of course, what happens in the future is anyone’s guess.
“So What? No One Lives In the Tropical Troposphere”
What is going on that might explain these discrepancies, not only between the models and the observations, but even between the various models themselves? And why should we care, since no one lives up in the tropical troposphere, anyway?
Well, the same argument can be made about the deep oceans (no one lives there), yet they are pointed to by many climate researchers as the most important “barometer” of the positive global energy imbalance of the climate system caused by increasing GHGs (and maybe by natural processes… who knows?).
The excessive warming of the tropical troposphere is no doubt related to inadequacies in how the models handle convective overturning in the tropics, that is, organized thunderstorm activity that transports heat from the surface upward. That “deep moist convection” redistributes not only heat energy, but clouds and water vapor, both of which have profound impacts on tropical tropospheric temperature. While moistening of the lowest layer of the troposphere in response to warming no doubt contributes to positive water vapor feedback, precipitation microphysics governs how much water vapor resides in the rest of the troposphere, and as we demonstrated almost 30 years ago, that leads to large uncertainties in total water vapor feedback.
My personal opinion has always been that the lack of tropical warming is because positive water vapor feedback, the primary positive feedback that amplifies warming in climate models, is too strong. Climate models actually support this interpretation because it has long been known that those models with the strongest “hotspot” in the upper troposphere tend to have the largest positive water vapor feedback.
Will Climate Models Ever Be “Fixed”?
I find it ironic that climate models are claimed to be based upon fundamental “physical principles”. If that were true, then all models would have the same climate sensitivity to increasing GHGs.
But they don’t.
Climate models range over a factor of three in climate sensitivity, a disparity that has remained for over 30 years of the climate modeling enterprise. And the main reason for that disparity is inter-model differences in the moist convective processes (clouds and water vapor) which cause positive feedbacks in the models.
Maybe if the modelers figured out why their handling of moist convection is flawed, models would then produce warming more in line with observations, and more in line with each other.
Much of global warming alarmism arises from scientific publications biased toward (1) the models that produce the most warming, and (2) the excessive GHG increases (“SSP scenarios“) they assume for the most dire climate change projections. Those scenarios are now known to be excessive compared to observed rates of global GHG emissions (and to the reviewer of our DOE report who said this conclusion was in error because I didn’t account for land use changes, no, I removed land use changes from the SSP scenarios… it was an apples-to-apples comparison).
Finally, I don’t want to make it sound like I’m against climate modeling. I am definitely not. I just think the models, as a tool for energy policy guidance, have been misused.
This is just a short update regarding how global surface air temperature (Tsfc) trends are tracking 34 CMIP6 climate models through 2025. The following plot shows the Tsfc trends, 1979-2025, ranked from the warmest to the coolest.
“Observations” is an average of 4 datasets: HadCRUT5, NOAAGlobalTemp Version 6 (now featuring AI, of course), ERA5 (a reanalysis dataset), and the Berkeley 1×1 deg. dataset, which produces a trend identical to HadCRUT5 (+0.205 C/decade).
I consider reanalyses to be in the class of “observations” since they are constrained to match, in some average sense, the measurements made from the surface, weather balloons, global commercial aircraft, satellites, and the kitchen sink.
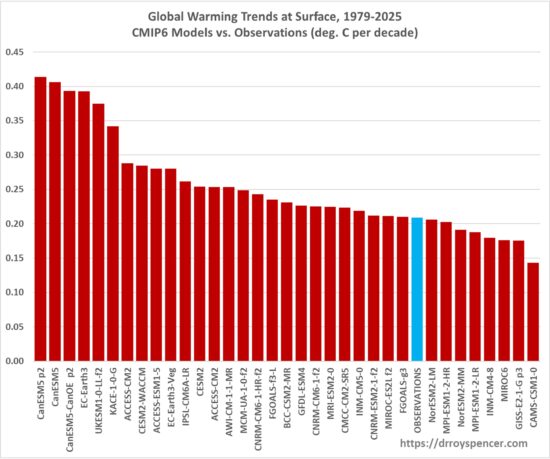
The observations moved up one place in the rankings since the last time I made one of these plots, mainly due to an anomalously warm 2024.
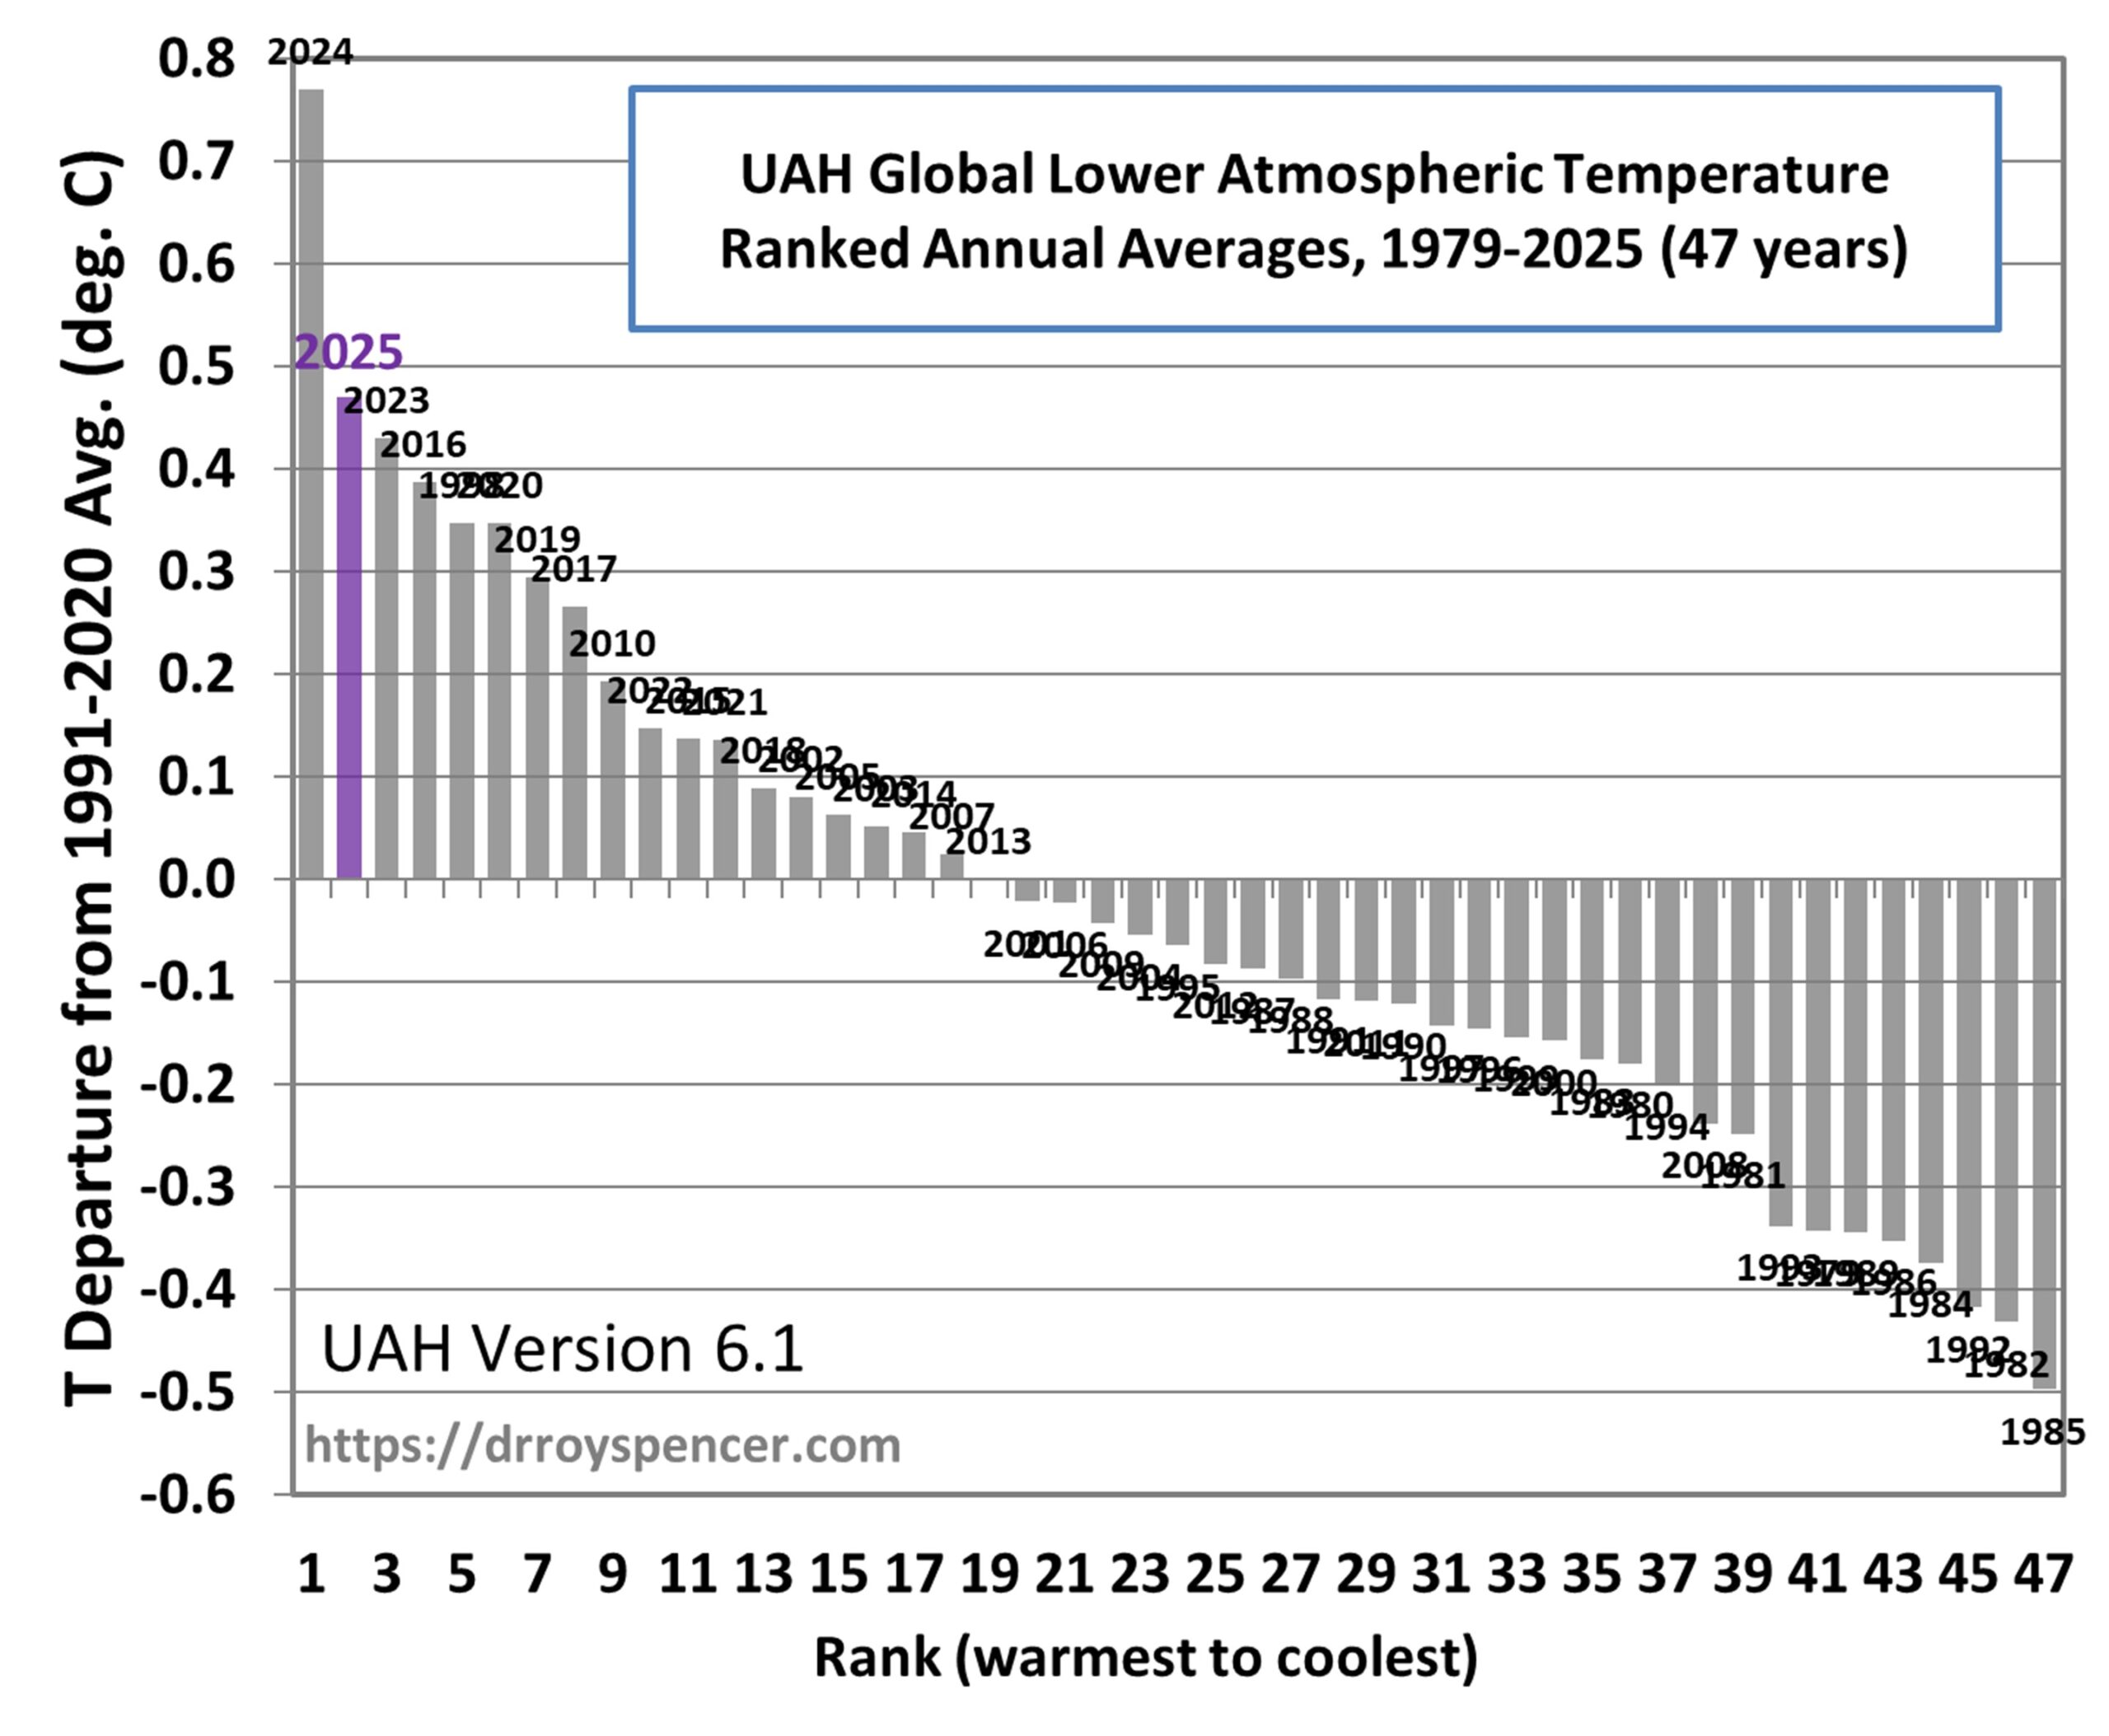
2025 was the 2nd warmest year (a distant 2nd behind 2024) in the 47-year satellite record
The Version 6.1 global average lower tropospheric temperature (LT) anomaly for December, 2025 was +0.30 deg. C departure from the 1991-2020 mean, down from the November, 2025 value of +0.43 deg. C. (In the following plot note that the 13-month centered-average trace [red curve] has now been updated after several months of not being updated).
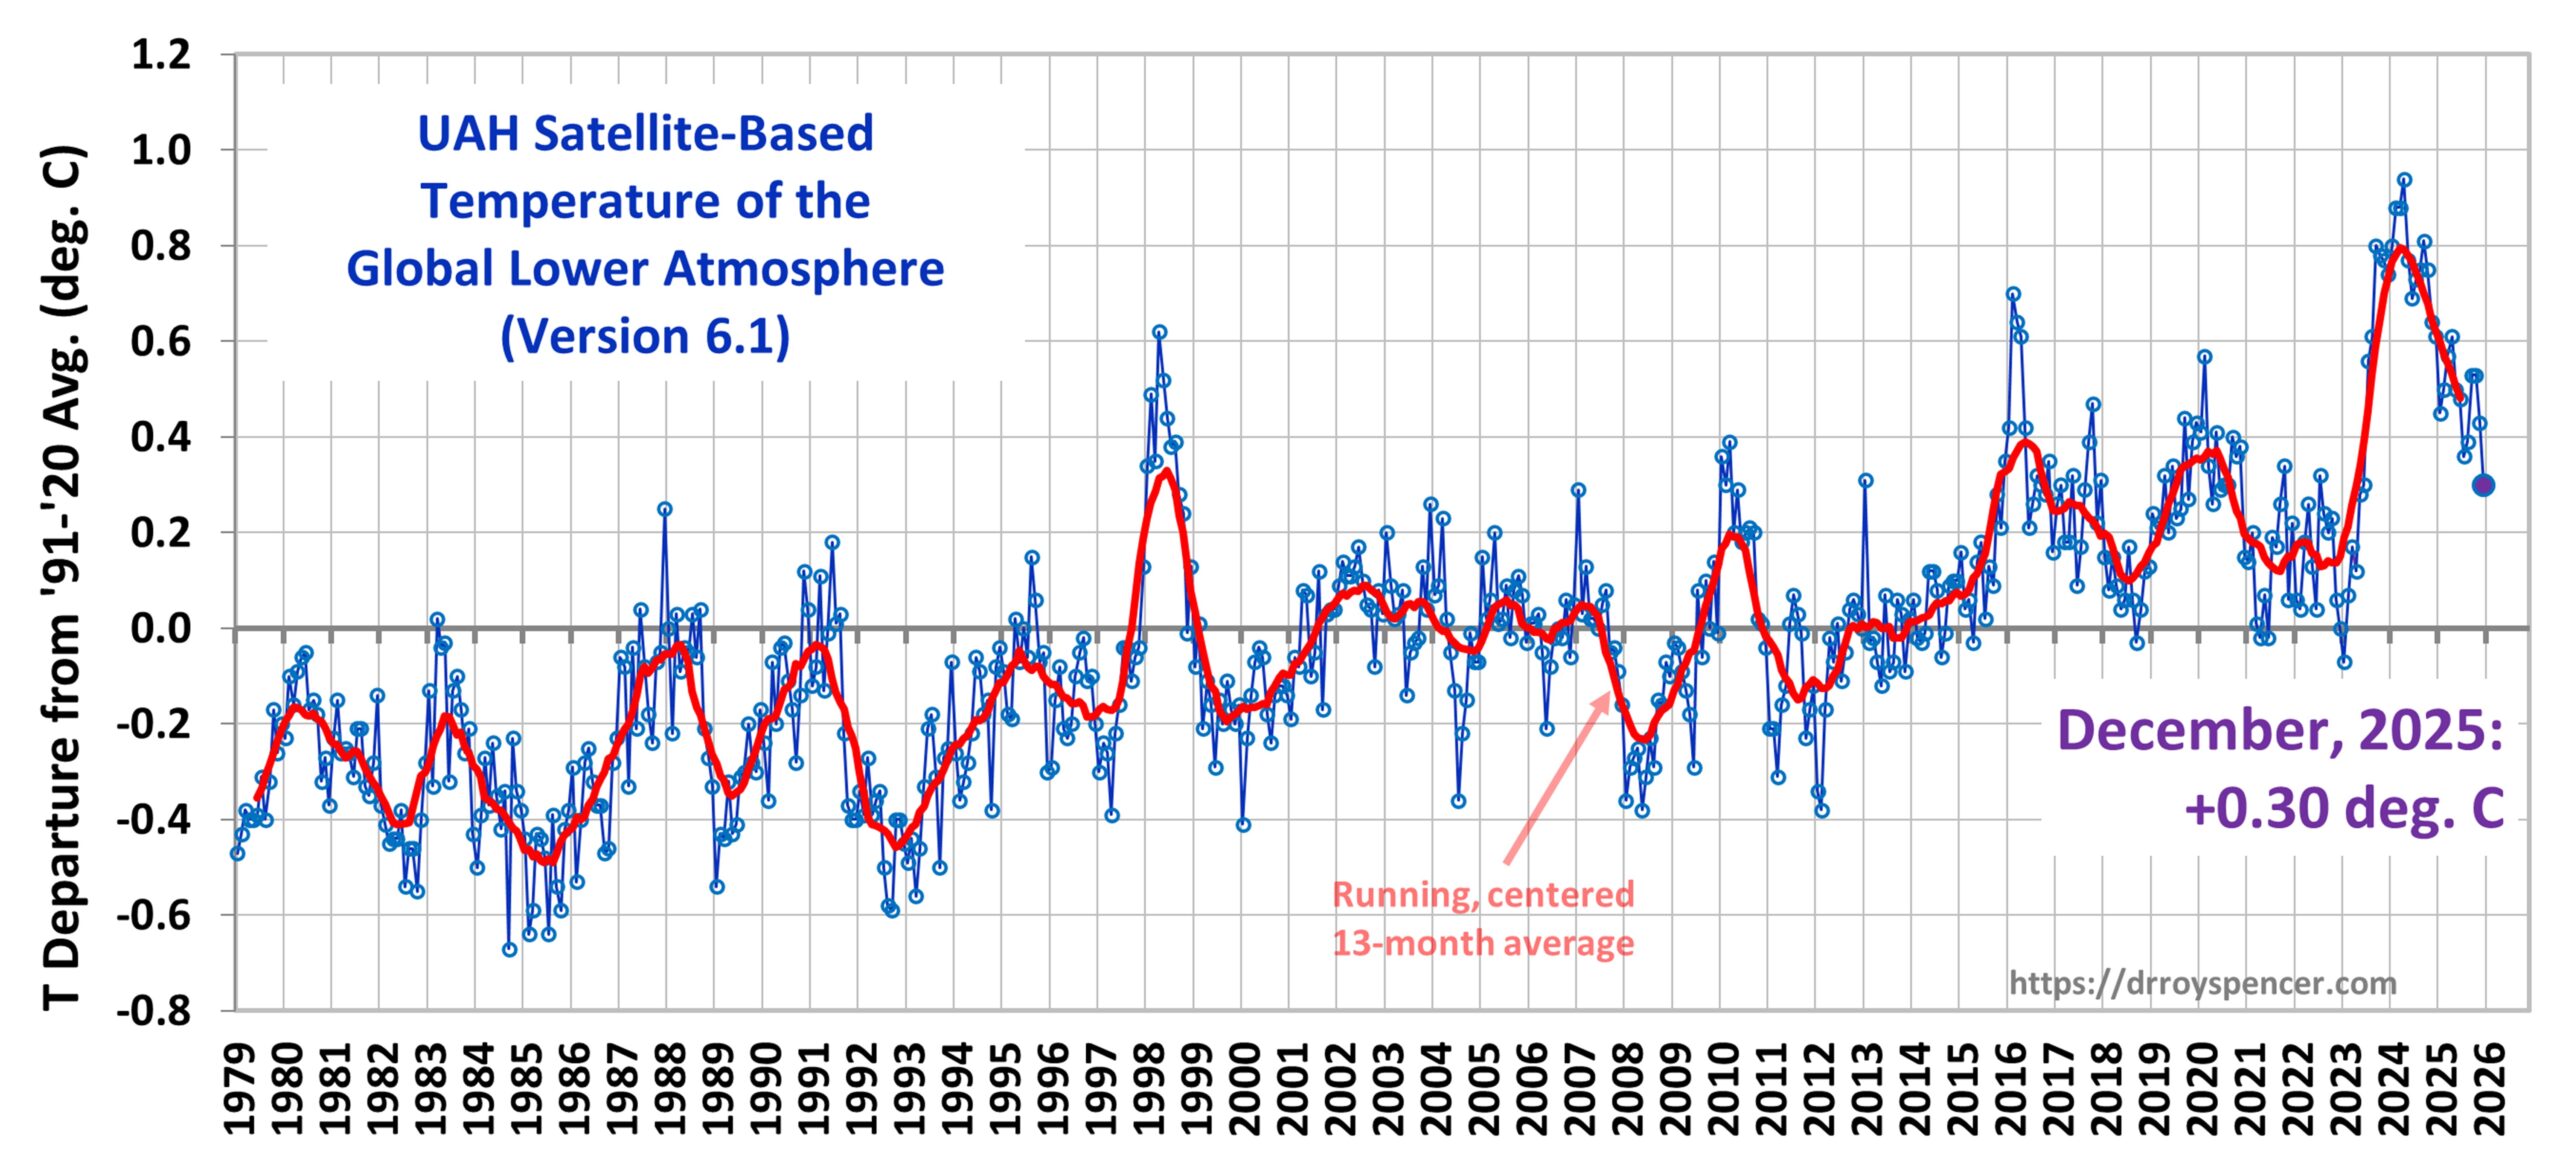
The Version 6.1 global area-averaged linear temperature trend (January 1979 through December 2025) remains at +0.16 deg/ C/decade (+0.22 C/decade over land, +0.13 C/decade over oceans).
2025 Ended the Year as a Distant 2nd Warmest Behind 2024
The following plot shows the ranking of the 47 years in the UAH satellite temperature record, from the warmest year (2024) to the coolest (1985). As can be seen, 2024 really was an anomalously warm year, more than can be attributed to El Nino alone.
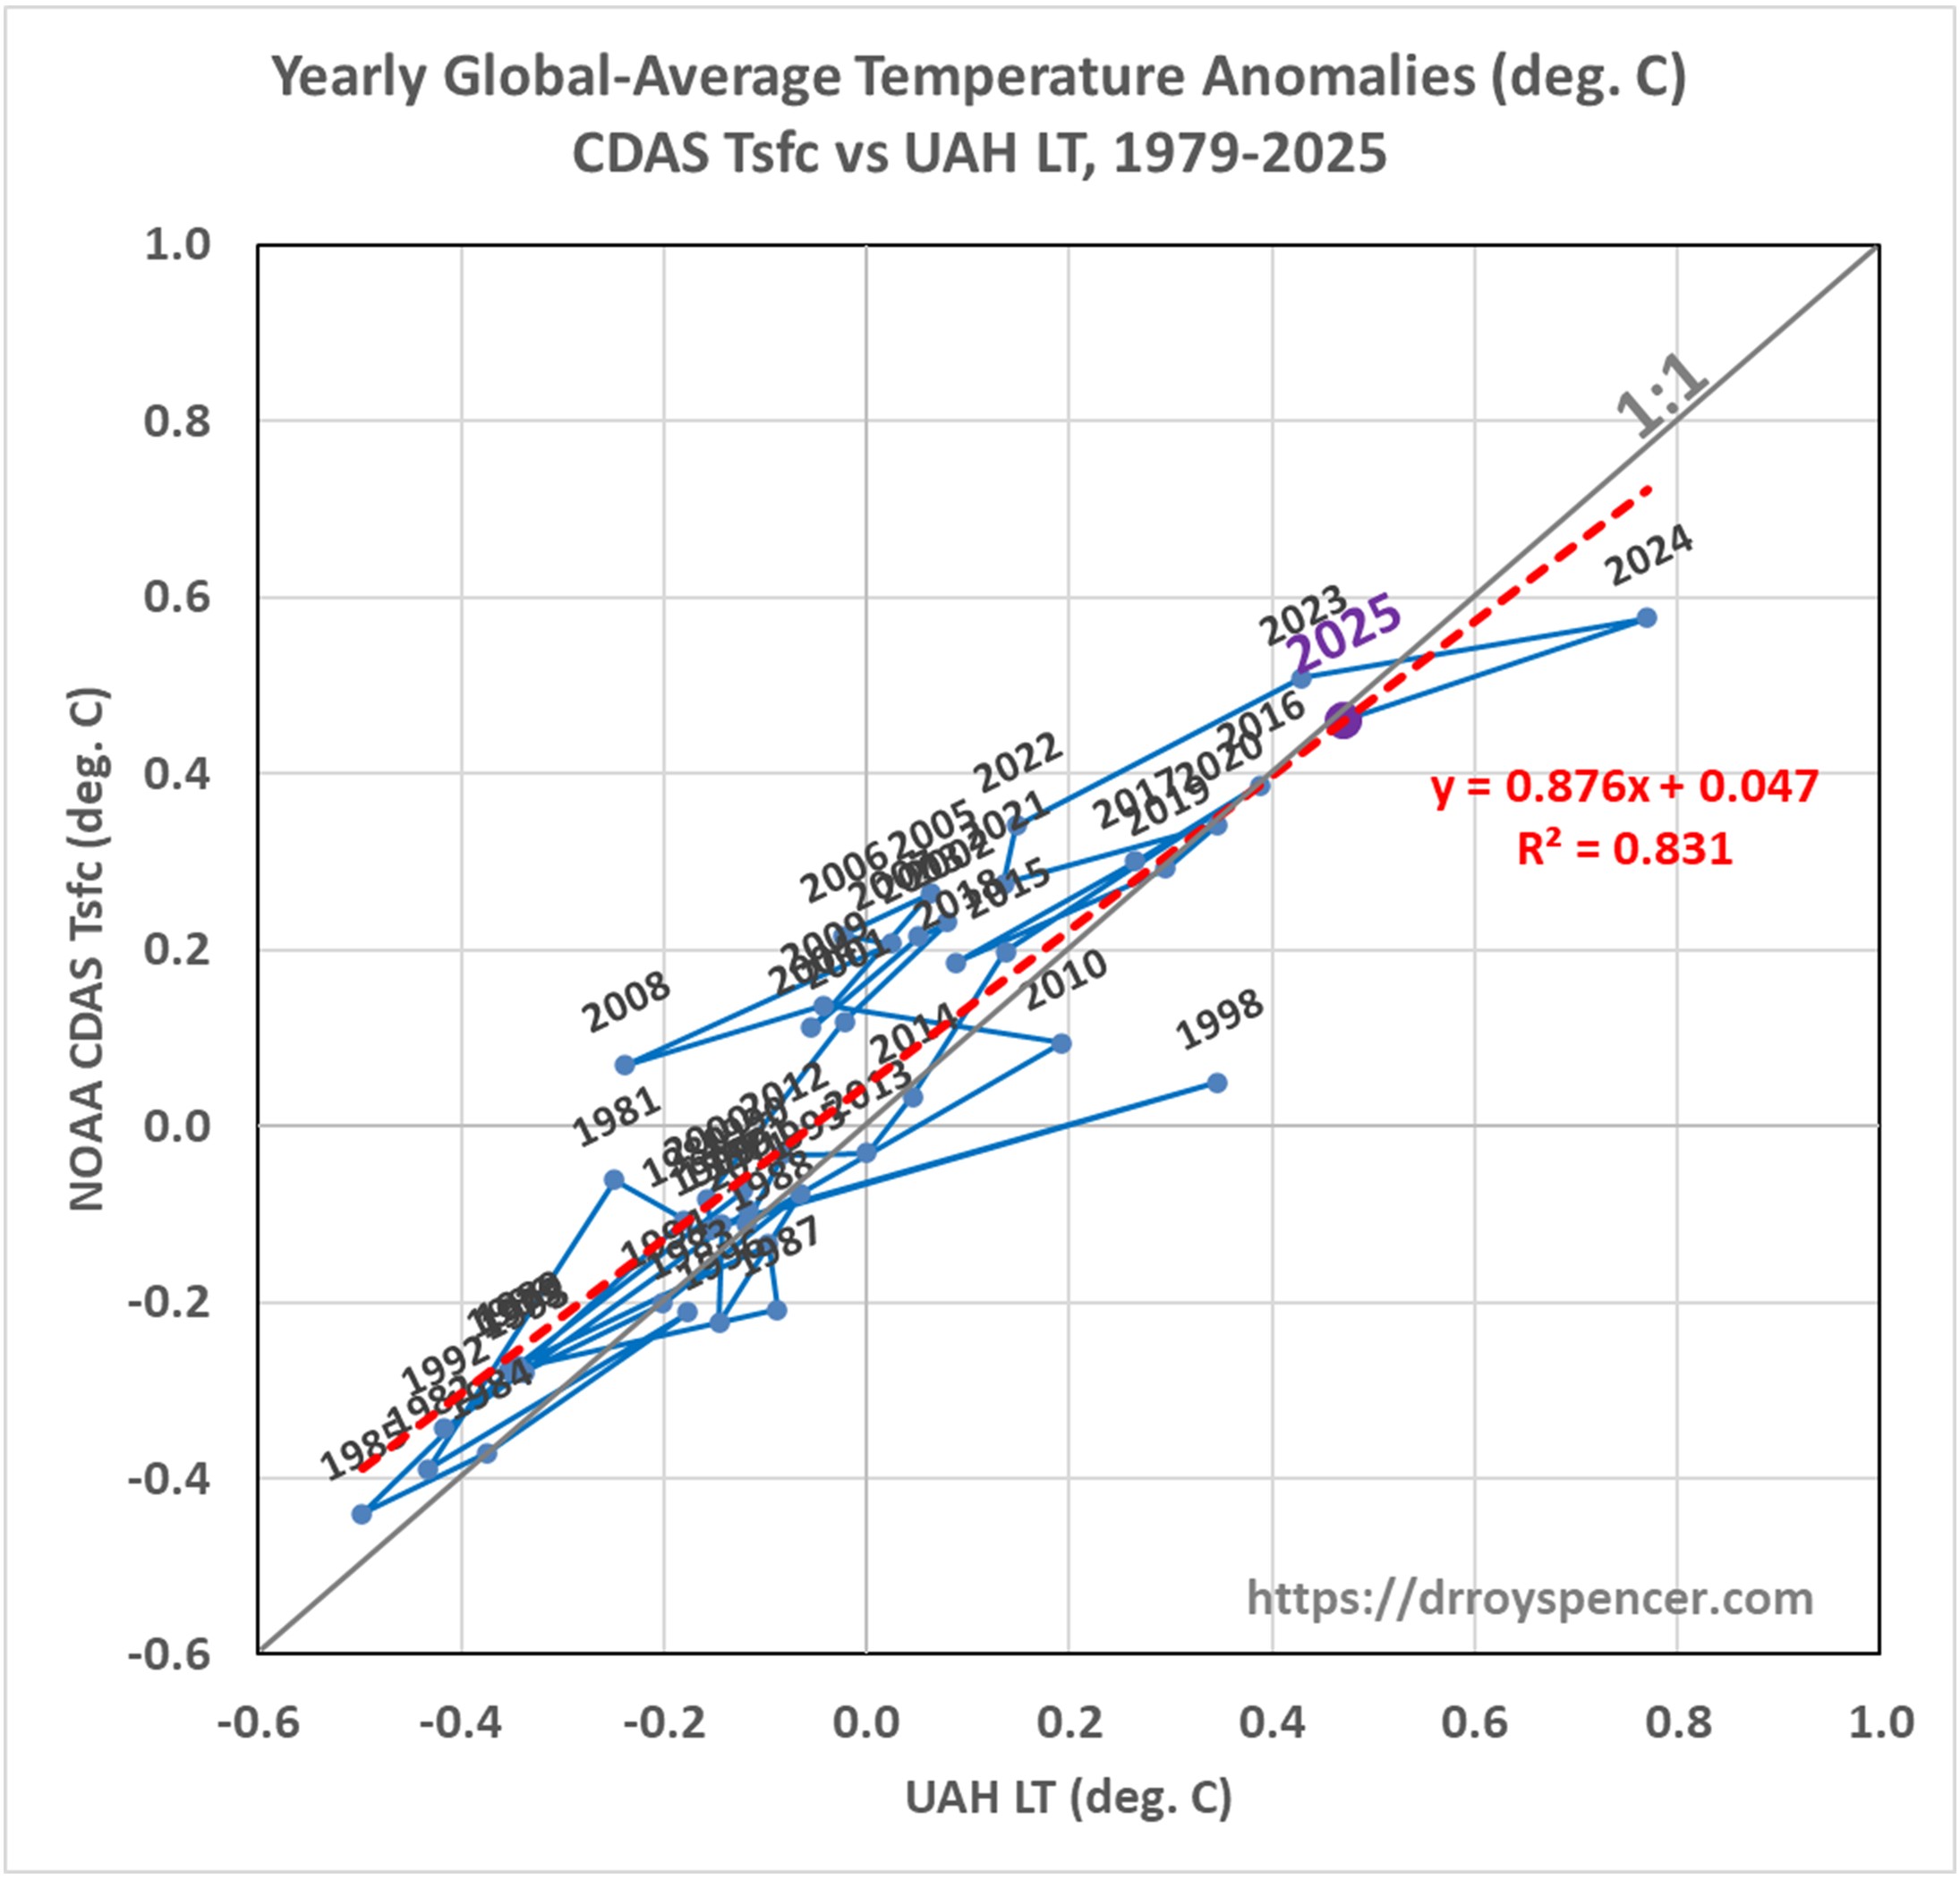
The next plot shows how our UAH LT yearly anomalies compare to those posted on the WeatherBell website (subscription required) for the surface air temperatures from NOAA’s Climate Data Assimilation System (CDAS). There is pretty good correspondence between the two datasets, with LT having warm outliers during major El Ninos (especially 1987, 1998, 2010, and 2024). This behavior is due to extra heating of the troposphere (which LT measures) during El Nino by enhanced deep moist convection in the tropics when the tropical Pacific Ocean surface warms from reduced upwelling of cold water from below, an effect exaggerated by the several-month lag of tropospheric warming behind surface warming during El Nino:
The following table lists various regional Version 6.1 LT departures from the 30-year (1991-2020) average for the last 24 months (record highs are in red).
| YEAR | MO | GLOBE | NHEM. | SHEM. | TROPIC | USA48 | ARCTIC | AUST |
| 2024 | Jan | +0.80 | +1.02 | +0.57 | +1.20 | -0.19 | +0.40 | +1.12 |
| 2024 | Feb | +0.88 | +0.94 | +0.81 | +1.16 | +1.31 | +0.85 | +1.16 |
| 2024 | Mar | +0.88 | +0.96 | +0.80 | +1.25 | +0.22 | +1.05 | +1.34 |
| 2024 | Apr | +0.94 | +1.12 | +0.76 | +1.15 | +0.86 | +0.88 | +0.54 |
| 2024 | May | +0.77 | +0.77 | +0.78 | +1.20 | +0.04 | +0.20 | +0.52 |
| 2024 | June | +0.69 | +0.78 | +0.60 | +0.85 | +1.36 | +0.63 | +0.91 |
| 2024 | July | +0.73 | +0.86 | +0.61 | +0.96 | +0.44 | +0.56 | -0.07 |
| 2024 | Aug | +0.75 | +0.81 | +0.69 | +0.74 | +0.40 | +0.88 | +1.75 |
| 2024 | Sep | +0.81 | +1.04 | +0.58 | +0.82 | +1.31 | +1.48 | +0.98 |
| 2024 | Oct | +0.75 | +0.89 | +0.60 | +0.63 | +1.89 | +0.81 | +1.09 |
| 2024 | Nov | +0.64 | +0.87 | +0.40 | +0.53 | +1.11 | +0.79 | +1.00 |
| 2024 | Dec | +0.61 | +0.75 | +0.47 | +0.52 | +1.41 | +1.12 | +1.54 |
| 2025 | Jan | +0.45 | +0.70 | +0.21 | +0.24 | -1.07 | +0.74 | +0.48 |
| 2025 | Feb | +0.50 | +0.55 | +0.45 | +0.26 | +1.03 | +2.10 | +0.87 |
| 2025 | Mar | +0.57 | +0.73 | +0.41 | +0.40 | +1.24 | +1.23 | +1.20 |
| 2025 | Apr | +0.61 | +0.76 | +0.46 | +0.36 | +0.81 | +0.85 | +1.21 |
| 2025 | May | +0.50 | +0.45 | +0.55 | +0.30 | +0.15 | +0.75 | +0.98 |
| 2025 | June | +0.48 | +0.48 | +0.47 | +0.30 | +0.80 | +0.05 | +0.39 |
| 2025 | July | +0.36 | +0.49 | +0.23 | +0.45 | +0.32 | +0.40 | +0.53 |
| 2025 | Aug | +0.39 | +0.39 | +0.39 | +0.16 | -0.06 | +0.82 | +0.11 |
| 2025 | Sep | +0.53 | +0.56 | +0.49 | +0.35 | +0.38 | +0.77 | +0.30 |
| 2025 | Oct | +0.53 | +0.52 | +0.55 | +0.24 | +1.12 | +1.42 | +1.67 |
| 2025 | Nov | +0.43 | +0.59 | +0.27 | +0.24 | +1.32 | +0.78 | +0.36 |
| 2025 | Dec | +0.30 | +0.45 | +0.15 | +0.19 | +2.10 | +0.32 | +0.38 |
The full UAH Global Temperature Report, along with the LT global gridpoint anomaly map for December, 2025 as well as a global map of the 2025 anomalies and a more detailed analysis by John Christy, should be available within the next several days here.
The monthly anomalies for various regions for the four deep layers we monitor from satellites will be available in the next several days at the following locations:


You are currently browsing the Roy Spencer, PhD. blog archives for January, 2026.
Copyright 2026 Roy Spencer, Ph. D. - All Rights Reserved
