
 Home/Blog
This is just a short update regarding how global surface air temperature (Tsfc) trends are tracking 34 CMIP6 climate models through 2025. The following plot shows the Tsfc trends, 1979-2025, ranked from the warmest to the coolest.
“Observations” is an average of 4 datasets: HadCRUT5, NOAAGlobalTemp Version 6 (now featuring AI, of course), ERA5 (a reanalysis dataset), and the Berkeley 1×1 deg. dataset, which produces a trend identical to HadCRUT5 (+0.205 C/decade).
I consider reanalyses to be in the class of “observations” since they are constrained to match, in some average sense, the measurements made from the surface, weather balloons, global commercial aircraft, satellites, and the kitchen sink.
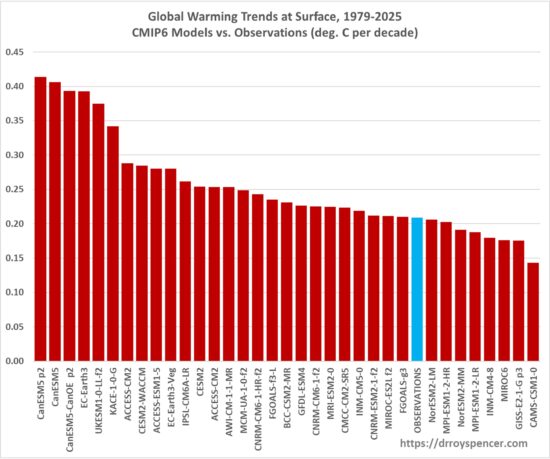
The observations moved up one place in the rankings since the last time I made one of these plots, mainly due to an anomalously warm 2024.


In your view, do CMIP6 models represent a significant improvement over CMIP5 when compared with observations?
No model that uses GHG radiative forcing is a significant improvement.
Indeed!
Sure..basic atmospheric physics must be wrong!
No, basic physics appears to be correct.
Glad to hear that you now understand that CO2 produces a GHE. Because that is what the atmospheric physics demonstrates.
Yeah Nate, F=5.35ln(C/Co). That’s physics.
derived from physics
I hope Stephen is just being facetious. That equation is completely bogus. It’s the opposite of reality.
Nate is going to explain how it was derived.
OK. The CO2 emits to space when it reaches critical low density high in the troposphere. Density increases with concentration, but also decreases exponentially with height.
To stay at the critical density, the height of emission must increase–logarithmically with concentration.
As the height of emission increases the T decreases, so the SB law emission to space from is reduced..logarithmically with concentration.
You ought to be able to handle this basic math.
The lapse rate reveals the proper thermodynamics. The attenuation from the surface to the top of the atmosphere is due to pressure. Rising air expands at lower pressure doing pV work on its surroundings thus lowering internal energy causing a drop in temperature. Radiative Forcing has no role.
“Radiative Forcing has no role.”
It does not follow from the previous.
It seems to have been accidently pasted on.
Nate, please stop trolling.
You stop first.
Nate, please grow up and stop trolling.
You first. Thanks in advance.
No, Nate. You are not getting it. Again, please grow up and stop trolling.
How did you select these 34 CMIP6 climate models? Are they using the same GHG concentrations history that we had?
Nate, please stop trolling.
Another comparison:
https://www.realclimate.org/index.php/climate-model-projections-compared-to-observations/
Are you saying that Roy is wrong?
The RealClimate link undoubtedly provides a more comprehensive perspective of climate model vs observation comparison. But one doesn’t have to chose one or the other, understanding “both” perspectives is always an option.
In science we are skeptical and can be critical of anyone’s analysis.
i am skeptical of YOUR science.
“RLH says: i am skeptical of YOUR science.”
One of the hallmarks of intellectual honesty is to apply the same rigorous standards to one’s own beliefs as one does to others’ claims.
This is where most self-identified skeptics go wrong.
To be fair, introspection is very difficult.
“One of the hallmarks of intellectual honesty is to apply the same rigorous standards to one’s own beliefs as one does to others’ claims.”
Yes Mark, and you avoided doing that: “This is where most self-identified skeptics go wrong.”
You conveniently forgot to mention “Warmists”. You know, those people that believe ice cubes can boil water….
To be fair, introspection is very difficult.
” To be fair, introspection is very difficult. ”
This, Clint R, applies especially to you and the gang of pseudo-skeptics who flood this blog with their 360-degree denialist stance, e.g., regarding centuries-old scientific findings about our Moon, beginning with those of… Sir Isaac Newton en personne
Bindi, until you have a viable model of “orbiting without spin”, you’ve got NOTHING.
You’re just clogging this blog, like several others.
Nate
” In science we are skeptical and can be critical of anyone’s analysis. ”
True!
But… regardless of how true that is, for people like ‘RLH’ it only applies if data processing and/or analysis shows signs of cooling.
That’s the reason why I call him ‘Blindsley H00d’: he keeps since ever blind on the same eye.
RLH i.e. Blindsley H00d
” i am skeptical of YOUR science. ”
To be skeptical of any science means to be able to technically and / or scientifically contradict its results.
That is exactly the contrary of what you do.
Like Robertson and all the pseudoskeptics infesting this blog, all you are able to do is to claim things without any real, consistent proof.
The best example is you claim five years ago that (TMIN+TMAX)/2 would lead to wrong daily temperature averages when compared to the true average of hourly data.
I disproved your claim using three temperature data sets: from the German Weather Office, from the METEOSTAT source and finally from the USRCN station data.
All you were able to respond was to polemically discredit my results – once more without any technical proof.
Bindidon, please stop trolling.
According to Berkeley Earth, NOAA has not been able to report a massive number of stations from around the world since August, 2025. As a non-scientist and just an interested person in these matters, I continue to be amazed at the poor quality of our current data (inferior siting of stations in the U.S. for example.) The developed nations have been spending massive amounts of money on CO2 abatement, research, etc and we can’t produce reliable temperature data? Apparently, the NOAA issue is a botched computer conversion (I think software). If NOAA doesn’t care enough to treat that as a high priority, why should I care about warming?
Then there is the older temperature data going back to, say, 1875 and forward. John Christy wrote a book entitled “Is It Getting Hotter in Fresno…Or Not? His research makes it clear that the older temperature records, at least in Fresno, are quite dicey.
Then there is the land temperature record outside the USA since 1875. Vast areas that are underpopulated, subsistence societies, industrialized nations ravaged by two world wars, many colonies of western advanced that lost that expertise (technology and interest in science) when colonialism ended.
No, I really am coming to the conclusion that our “vision” of temperature trends is quite limited. I am quite skeptical that scientists can take sparse and often bad data and somehow magically produce something that approximates reality. I do trust the satellite data, but that takes us back only to 1979.
And that is 29% of the earth’s surface.
“Apparently, the NOAA issue is a botched computer conversion (I think software). If NOAA doesn’t care enough to treat that as a high priority, why should I care about warming?”
See:
https://www.ncei.noaa.gov/access/crn/
“The United States Climate Reference Network (USCRN) is a sustained network of high-quality weather monitoring stations across the contiguous U.S., Alaska, and Hawaii. These stations use resilient instrumentation to measure temperature, precipitation, wind speed, soil conditions, and more.”
My quote should also include this statement:
“The developed nations have been spending massive amounts of money on CO2 abatement, research, etc and we can’t produce reliable temperature data?”
In response to the concern that:
“As a non-scientist and just an interested person in these matters, I continue to be amazed at the poor quality of our current data (inferior siting of stations in the U.S. for example.)”
This is true for the raw U.S. station network, but it is not ignored. Scientists are well aware of these problems and attempt to correct for these using bias adjustment algorithms.
One way to test whether those adjustments are reasonable is to compare the official adjustment against the pristine reference network linked above.
https://moyhu.blogspot.com/2020/03/usa-temperatures-comparison-of-moyhu.html
See: (go to the end of the post)
https://berkeleyearth.org/october-2025-temperature-update/
This is the correct link for my 7:39 PM comment.
https://agupubs.onlinelibrary.wiley.com/doi/full/10.1002/2015GL067640
Thomas Hagedorn
Your Berkeley Earth link explicitly states that station coverage remains sufficient to constrain the global average temperature with low uncertainty.
Unless you are attempting to analyze regional temperature trends in areas such as Kazakhstan or parts of Africa, it is unclear how this issue undermines the global surface temperature record.
So, at the outset of my original post I noted that I am not a scientist. I do have some very dated training and experience in atmospheric research. Global warming, now, rebranded as climate change and covid messaging and public policy have made me lose a lot of confidence in the objectivity of science. So, I approach these matters from a critical (my favorite description of my position) or skeptical viewpoint. I saw Berkeley Earth’s comment that you referenced. I also note that they get funding from an American oligarch, Bill Gates. More than a little pressure and incentive to convince themselves and others that their methodology works, even when you lose that many data points. (Look at the global map on that link. The loss is massive.)
And I continue to be amazed at the poor quality of U.S. weather station siting and at NOAA blowing a computer conversion for such important data. And this is supposedly an existential, all-hands-on-deck crisis. MOVE THE DARN STATIONS. USE METHODOLOGY IN PLACE SINCE THE 70s FOR A COMPUTER CONVERSION. I guess I shouldn’t be surprised. I have heard a number of examples of antiquated technology and inertia in government…IRS, air traffic control, social security, treasury department. It is like it is still 1980.
I have read many of the skeptical/critical books on climate change and that is why I have this skeptical view. They just seem to make a better case.
The burden is on you to demonstrate that Berkeley Earth’s methodology is failing as a result of this disruption. As of October, Berkeley Earth still has approximately 7,500 active stations available. For estimating a global mean temperature, far fewer stations are required to achieve a stable result.
https://andthentheresphysics.wordpress.com/2018/08/18/you-only-need-about-60-surface-stations/
“And I continue to be amazed at the poor quality of U.S. weather station siting and at NOAA blowing a computer conversion for such important data.”
Please see my comment dated January 10, 2026 at 8:27 PM.
Eldrosion, please stop trolling.
“Apparently, the NOAA issue is a botched computer conversion (I think software).”
Evidence?
You are very tedious, sir. I didn’t make that up. I dug in a little and tried to find out the cause. Use AI for a little and you’ll get more background on it. Berkeley Earth is reporting about it. They use some other data sources, but they show a map of NOAA’s global reporting network sites and large parts of the globe (outside US) are dark (if it still is uncorrected).
Still, it would be nice to know the source of this information. And be able to look at it.
Is that too much to ask?
Nate, please stop trolling.
The article that I have linked below has a first section that has some very insightful and wise observations about data and its use. Even though its author is a finance professor who focuses on investment valuations and decisions, the first section applies to anyone trying to use data in a sophisticated way. I see many applications of his observations to climate science. Just ignore the rest of his blog post after the opening section on data. The author -Dasmodaran- is quite experienced and respected in his field:
https://aswathdamodaran.blogspot.com/2026/01/data-update-1-for-2026-push-and-pull-of.html
Good statistics is good.
But unless you can show us Climate Science specifically NOT doing this, I don’t see the relevance here.
Nate, please stop trolling.
1. Nate’s question for evidence about:
” Apparently, the NOAA issue is a botched computer conversion (I think software). ”
2. Hagedorn boy’s riddiculous reply:
” You are very tedious, sir. I didn’t make that up. I dug in a little and tried to find out the cause. ”
*
No one told that you ‘made that up’, Hagedorn boy. However, you clearly wrote it.
Hence, you merely show that you were unable to prove evidence of your polemical, superficial claim – as was asked by Nate.
*
Too many people think, guess and discredit here, by the way. Too few look at data and compare their processing. After all, the data is available to all of us…
*
Let’s do what Hagedorn never would be able to do: a comparison of three global, land-only anomaly time series from Jan 1900 till Dec 2024:
– 1. NOAA Climate at a Glance (wrt 1901-2000)
– 2. Berkeley Earth (wrt 1951-1980)
– 3. my layman’s evaluation based on the raw GHCN daily data (wrt 1991-2020)
https://drive.google.com/file/d/1b7Ag4ED7C8zPcgDJ4GPaURKKYlSpk1b_/view
and in addition, of
– 4. UAH 6.1 LT (wrt 1991-2020)
https://drive.google.com/file/d/1t8KzmaddoZfb6tFs1ZqK3eJq3rUPWdLz/view
All anomalies were of course displaced by their time series’ mean for the common period (1991-2020).
*
The graphs couldn’t show better that though having the comparatively highest trend (in °C / decade) for the period since 2000
NOAA: 0.42 +- 0.03
Berk: 0.33 +- 0.03
Bin: 0.32 +- 0.02
UAH: 0.31 +- 0.02
NOAA’s data can by no means be discredited as being based on bad sited stations.
The difference between the surface time series is much more due to
– the anomaly construction method chosen
and
– presence or absence of interpolation (I never use this technique).
*
Yes: NOAA faces since years and years critique on their ‘Pairwise Homogenising Algorithm’ designed long time ago by Menne & al.
*
All data sources will be added as soon as possible.
Sources for the land-only series
NOAA
https://www.ncei.noaa.gov/access/monitoring/climate-at-a-glance/global/time-series/globe/land/tavg/1/0/1900-2025
Berkeley Earth
https://berkeley-earth-temperature.s3.us-west-1.amazonaws.com/Global/Complete_TAVG_complete.txt
UAH 6.1 LT
https://vortex.nsstc.uah.edu/data/msu/v6.1/tlt/uahncdc_lt_6.1.txt
(data column 2)
Bin’s eval of GHCN daily
https://www.ncei.noaa.gov/pub/data/ghcn/daily/
*
GHCN daily provides for data from about 130,000 stations, over 40,000 of them come with temperature data.
Half of them is in the US.
Thus it makes abolutely no sense to generate time series by averaging at station level, as then the Globe looks like kinda US backyard.
To avoid this, all local station anomalies are first stored in grid cells (of the same 2.5 degree size as UAH’s); the grid cells then are averaged for each latitude band and then finally latitude weighted.
Of the 40,000+ stations, 26,273 were selected; 14,326 of these are in the US, giving 11,947 outside.
Not all of them were present between 1900 and 2025, of course; in 2020, for example, 12,866 stations located in 1856 cells (60% of Earth’s land) were active.
With the area weighting performed using the grid cell storage, instead of having 46% non-US stations competing with 54% US, one has for example in 2020 1686 cells outside the US competing with 170 inside, the latter forming about 9% of the total.
And the pseudo-skeptic blah blah endlessly continues with this ‘thought’, apparently derived from somewhere else:
” As a non-scientist and just an interested person in these matters, I continue to be amazed at the poor quality of our current data (inferior siting of stations in the U.S. for example.) ”
*
It is clear to me: Hagedorn, who is indeed anything but a scientist (and above all not even able to process data relevant to us), ‘continues to be amazed’ by things about which he apparently has no real clue.
*
Long time ago, WUWT’s Watts started his ‘surface-stations.org’ project within which numerous, if not all, USHCN stations were inspected by volunteers with regard to ‘siting quality’; the station set was accordingly subdivided into five categories.
Even NOAA acknowledged the project by publishing the ‘site 1’ list of USHCN’s 71 best sited stations; I lost the NOAA link but luckily downloaded the list before:
https://drive.google.com/file/d/1ipzDRdJppZDM6ii4qj9h1AKFrC3t0h94/view
Then there was this paper, a deep tewchnical inspection of USHCN station data versus siting, published by Fall, Christy, Watts & al:
https://agupubs.onlinelibrary.wiley.com/doi/full/10.1029/2010JD015146
{ This paper led to many reactions, especially from Berkeley Earth. }
*
Last year I again started a comparison of these 71 best sited USHCN stations to anonymous GHCN daily stations, by collecting all those (over 250) located in the respective 1 degree vicinity of the former:
https://drive.google.com/file/d/11sJjcVifKIecrYRr08jB93bjlbujJPDX/view
And then I compared the two station sets in time series generated from 1951 to 2011 (the end of the period investigated by Fall & al.).
*
1. USHCN vs. GHCN daily: TMIN series
https://drive.google.com/file/d/1-IHF0hCUK8n-Qki14wwd0YCxQdBSeiy2/view
2. USHCN vs. GHCN daily: TMAX series
https://drive.google.com/file/d/1RzP181WalVgApyoYdJ9lR1jPwSDTr6NK/view
Honestly, I would have expected much higher discrepancies between the data recorded by the 71 ‘site 1’ stations and the lot of anonymous stations nearby!
**
The same happened a few weeks later, as I compared the average of all 113 USCRN stations to over 560 GHCN daily stations located in their respective 1 degree vicinity.
3. USCRN vs. GHCN daily: TMIN series
https://drive.google.com/file/d/1zQ5qFsPe5_INNZ1E_5VibXhIn7VSEMvb/view
4. USCRN vs. GHCN daily: TMAX series
https://drive.google.com/file/d/19YiPAYIkUCyDgPIqr_fd7eUcNVE3H6go/view
*
Yeah. So much about ‘inferior siting of stations in the U.S. for example’.
Some recent comments seem to cry out for some basic science, especially in the areas of temperature, specifically what “temperature” means, and how to raise temperature.
What “Temperature” Means
“Temperature” is a measure of the average kinetic energy of molecules. Specifically, it is the energy of the average translational motion of the molecules. That is how a simple thermometer works, as it measures the temperature of a glass of water. The water molecules hit the thermometer, transferring kinetic energy to the fluid inside the thermometer tube. As the molecules in the fluid become more energized, the fluid expands. The rise in the fluid can be read from a scale on the tube, Fahrenheit, Celsius, Absolute, Rankine, or other. It doesn’t matter.
How To Raise Temperature
This is where it gets really interesting. While most Alarmists (Gretas) probably don’t know what “temperature” is, they certainly don’t know what is required to raise temperature. Even “climate scientists” don’t know how to raise temperature.
To raise the temperature of the glass of water, the average kinetic energy of the water molecules must INCREASE. Suppose there are 3 molecules, with kinetic energies of 1, 2, and 3. The average KE is “2”. If a fourth molecule is added, with a KE of “2”, the average is then (1+2+3+2)/4 = 8/4 = 2. So the temperature does not increase because the average KE did not increase. Notice that more energy was added, but the temperature did not increase. One of the major mistakes in “climate science” is believing adding more energy always results in raising the temperature.
What if the fourth molecule had a KE of 1? The average KE is then (1+2+3+1)/4 = 7/4 = 1.75. More energy was added, but the average KE DECREASED.
Don’t expect the Gretas to understand any of this.
Eh, your examples are of added mass, not added energy.
Don’t see how that is relevant.
Sorry Frode, but in both examples both mass and energy are added. But mass does not affect temperature, only energy.
So your comment is not relevant.
Let’s add some 10% absorbed sunshine each to Clint’s 3 molecules having different radiative properties with initial KE of 1,2,3 when “the average KE is “2””. The average then becomes (1.1+2.2+3.3)/3 = 6.6/3 = 4.4 average KE.
So, their temperature does increase because the total KE increased with the average KE increase. Notice that more thermodynamic internal energy was added and the temperature did increase.
Don’t expect Clint R to understand any of this.
Ball4 is one of my more immature, ignorant stalkers. I always try to keep my examples very easy so such children can understand them. But, as Ball4 indicates, he’s still unable to understand.
He misses my main point that the average kinetic energy MUST be raised to raise temperature. Just adding kinetic energy that results in the same, or a lesser, average does NOT raise temperature.
Also, Ball4 makes an arithmetic error. 6.6/3 = 2.2, NOT 4.4.
Kids these days….
Clint R did manage to understand some of that! 2.2 is better @ 10%.
Again Clint works hard to try to decieve people.
For the 47th time: in radiative heat transfer only MASSLESS photons carrying energy are exchanged.
In your irrelevant ezample mass is exchanged. This gives a totally different result than is found for radiative heat transfer.
Are you actually mentally unable to understand why there tis a difference?
It seems so.
Wrong again, child Nate.
You commented 3 days after me, but not understanding ANYTHING about the issue. Like some immature, uneducated brat, you make false accusations, hoping something will stick.
My comment was explaining how temperature is raised. It was not addressing “radiative heat transfer”, specifically. You can’t understand any of this.
Mass, by itself, can NOT raise the temperature. To raise the temperature, the average kinetic energy MUST be increased, as my examples indicated.
Find a responsible adult to explain it to you.
Not capable of learning or understanding then?
Let’s explain for the extremely slow learners:
In your scenario, Mass M =1 unit, energy E =1 unit. Energy density =1.
Add mass dM =0.5 u with energy dE = 0.3 units.
Result Energy density = 1.3/1.5 = 0.87, has gone down. The mass is now cooler.
But the GHE forcing is radiative.
So we if we add energy dE = 0.3 units by massless radiation:
Energy density = 1.3/1 = 1.3, has gone up. The mass is now warmer!
Wrong again, child Nate. You remind me of Ball4. He messed up the simple arithmetic, and you messed up the simple physics. What a team!
This is NOT about “energy density”, it’s about the “average kinetic energy”.
Get a responsible adult to explain it to you. I won’t respond to any more of your childish nonsense.
So lets get this straight.
You were working with energy per molecule. I was working with energy per unit mass.
And you think that they are not equivalent?
Are you blissfully unaware that mass is proportinal to number of molecules?
Yes it seems you are.
And if I tell you energy per unit mass, and what type of molecules it contains, we can find the energy per molecule.
Now please, continue to play dum as a rock.
Get a responsible adult to explain it to you, child Nate. I won’t waste any more time with your childish nonsense.
As always, no rebuttal, no facts or logic, just insults.
Nate, please stop trolling.
Awww, trolls supporting trolls. How cute.
If only help with the science was available…Alas no.
Yes, Ball4 regularly supports you, Nate. Despite the fact that he often disagrees with you whilst doing so. Then you both cannot even admit that you disagree. Trolls will be trolls.
If only help with the science was available.
Sadly no, just pointless trolling. And severe lack of self recognition.
More please..
Nate, I’m not supporting Clint here. I’m simply asking you to stop trolling. Same as I have asked many others to stop trolling…yet you’re the only one bitching and moaning about it endlessly.
And again utterly failing to recognize that posting, purely to apply ad-hominems to all the people you dislike, is trolling in its purest form.
I don’t dislike you, Nate. I just want you to stop trolling.
So if I simply post science, relevant to the discussion, is that trolling?
Just trying to get the ‘DREMT trolling rules’ straight.
Nate, you can’t be reasoned with on any subject. Sometimes I think the way Clint speaks to you is quite appropriate. You do behave like a child, and so he treats you as one. But, then you turn around and try to dismiss everything he’s said as “just insults”. Where, in reality, he tried to explain his position, using “facts and logic”, but you simply cannot be reasoned with. Then I ask you, politely, to stop trolling, and you immediately try and drag me into the discussion and expect me to continue Clint’s arguments! More trolling.
That is why the Planet Surface Rotational Warming Phenomenon:
It was traditionally believed, when a surface is solar irradiated, what is not reflected, it is absorbed as heat.
It was a traditional believe: either solar energy is reflected, or it is absorbed as heat.
So, that believe led to the logical assertion, that no matter how fast a planet rotates, the entire not reflected solar energy is absorbed as heat.
Now we know, the not reflected portion is not entirely absorbed as heat. It is Immediately IR Emitted, and, only a small part is absorbed.
So, when faster rotating, a planetary surface exhibits a lower Immediate IR Emission, and a higher Heat Absorption.
In general case, a planet with a higher (N*cp) product (everything else equals), that planet absorbs more heat, and therefore, that planet develops a higher average surface temperature (Tmean).
–
Link: https://www.cristos-vournas.com
Technical contradiction of Hagedorn’s superficial blah blah (suite et fin)
For the sake of completeness, I added to land data from NOAA, Berkeley Earth and my layman’s eval based on GHCN daily, the following sources: CRUTEM5 (Univ of Eastern Anglia, UK) and NASA’s GISS land station data.
1. Jan 1900 – Dec 2024
https://drive.google.com/file/d/1AWmhz9V2-xgrn-U8wZAWO4pwkMExGHUd/view
2. Dec 1978 – Dec 2024
https://drive.google.com/file/d/1QVFcm5NGmTiASVyX43YcPuQWdV2nR6-F/view
*
Sources
CRUTEM5 at Met Office
https://www.metoffice.gov.uk/hadobs/crutem5/data/CRUTEM.5.1.0.0/download.html
NASA
https://psl.noaa.gov/data/timeseries/month/NASAGLBLT/
Beware false prophets,the question should be, why would it not warm after a decline, it always did in the past, what makes today special?
Is it not also amazing to see the Brown boy looking at some graphs, detecting in them a bunch of lines starting bottom left and ending top right, and automatically speaking about ‘warm’?
Incredible. Brown reminds me Robertson ranting at single details, like a toro running after the torero’s red muleta in a Spanish corrida.
*
I didn’t write anything about warm or cold: I was just responding Hagedorn’s false claims, e.g.
” As a non-scientist and just an interested person in these matters, I continue to be amazed at the poor quality of our current data (inferior siting of stations in the U.S. for example.) ”
or even better
” Apparently, the NOAA issue is a botched computer conversion (I think software). ”
The graphs above were posted only with the intention to show that the difference between NOAA and other sources is during the sat era much smaller than some might insinuate.
But the pseudoskeptics will of course reply unisono that all surface series are ‘fudged’.
*
IMHO, the ‘false prophets’ are quite elsewhere…
Sarcasm, is the lowest form of wit, there is a big difference between knowing the name of something ,and knowing something,maybe you should learn something. Just like Empires of the past,nothing lasts forever,
1/12: Colorado: Our terrible winter is about to get even worse
https://www.tiktok.com/@weatherchris/video/7594541821892529421?_r=1&_t=ZP-931HRSEEZxP
Sarcasm, is the lowest form of wit, there is a big difference between knowing the name of something ,and knowing something,maybe you should learn something. Just like Empires of the past,nothing lasts forever,
Yesterday I had the funny idea to construct a global temperature time series based on the rawest data I have on disk:
– GHCFN daily data for the land areas;
– HadISST1 SST for sea surface.
A weighted mix of the two, according to the real ratios (30 resp. 70%) gives a result matching the Pseudoskeptics’ expectation: a land+ocean time series looking like UAH LT:
https://drive.google.com/file/d/1scREtDkvDwt7XRNF_dQjGNbBUu4RWBpY/view
The mix’s trends are, for various periods (since 1979, 2000, 2010), lower than UAH’s.
*
This is, of course, a pure illusion.
My HadISST evaluation shows a significant low bias, due to the trivial global anomaly calculation: the result is the same nonsense as produced by a simple averaging of all absolute land station data. A correct method for calculating the sea surface anomalies grid cell by grid cell would result in higher temperatures.
*
HadISST source:
https://www.metoffice.gov.uk/hadobs/hadisst/data/download.html
What role, if any, would Specific Heat Capacity play in your hypothetical experiment?
Why do you ask?
What do Joules per kilogram per Kelvin have to do with the time series I posted?
Some years ago, a commenter was looking for a UAH LT time series based on absolute (Kelvin) data rather than on anomalies wrt the current reference period.
Here they are again, till Dec 2025:
https://drive.google.com/file/d/1vJatellJjYn3Nwbiy28p78Z0GElPheyr/view
*
Due to the presence of the seasons, removed during anomaly computation, a sort of the absolute values looks different
2024 7 266.15
2024 8 265.99
2023 7 265.99
2023 8 265.84
1998 7 265.80
2024 6 265.79
2025 7 265.77
2022 7 265.74
2020 7 265.72
2016 7 265.67
when compared to the same sort of anomalies
2024 4 0.94
2024 3 0.88
2024 2 0.88
2024 9 0.81
2023 10 0.79
2024 5 0.78
2023 11 0.77
2024 8 0.76
2024 10 0.75
2023 12 0.75