While investigating cloud feedbacks over the ocean with the CERES Earth radiation budget instruments, I thought I would take a quick look to see how lower atmospheric temperature variations over land and ocean compare to each other. Part of my interest was the recent cold winter over the U.S. and Europe, which has seemed strange to some since our global-average temperatures are running quite warm lately.
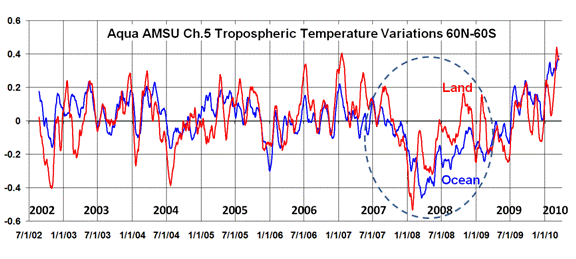
The following plot shows tropospheric temperature variations over land versus ocean since mid-2002 as measured by the AMSU instrument on the Aqua satellite. I’ve restricted the averaging between 60N and 60S latitudes, which is 86.6% of the surface area of the Earth. These are daily running 31-day average anomalies (departures from the average seasonal cycle).

In the big picture, I was a little surprised to see that, on average, there is essentially no time lag between the land and ocean temperature variations. The correlation between the two curves is +0.63 at zero days time lag. I would have expected a tendency for oceanic changes to precede land changes, since we usually think of oceanic warming or cooling events driving land areas more than vice versa.
We also see that the recent cold winter over the U.S. and Europe was not reflective of global land areas, which is not that surprising since those regions represent only about 5% of the surface area of the Earth.
I have been particularly interested in the cause of the global cooling event of 2007-08, which I have circled in the plot above. I had assumed that this was primarily an oceanic phenomenon, but as can be seen, land areas were similarly affected.
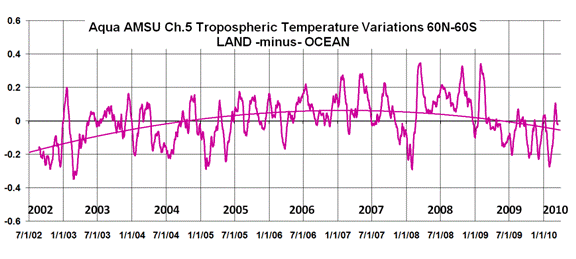
The difference between the land and ocean curves is shown in the next plot, along with a second order polynomial fit to the data. There seems to be a low-frequency change in this relationship, with several years of land-warmer-than-ocean now switching to ocean-warmer-than-land. I have no obvious explanation to offer for this.

And if you are wondering just how real the temperature fluctuations shown above are, I also computed the oceanic atmospheric temperature variations (blue curve, 1st graph) from the AMSU flying on a totally different satellite — NOAA-15 — and found that the curves from Aqua and NOAA-15 were virtually indistinguishable.
[The reason why the above analysis is restricted to the period since 2002 is that Aqua is the first orbit-maintained satellite. Previous satellites had decaying orbits, which caused a change in the local observation time over the years which resulted in a long-term drift in over-land temperatures due to the strong day-night cycle in temperature.]

 Home/Blog


