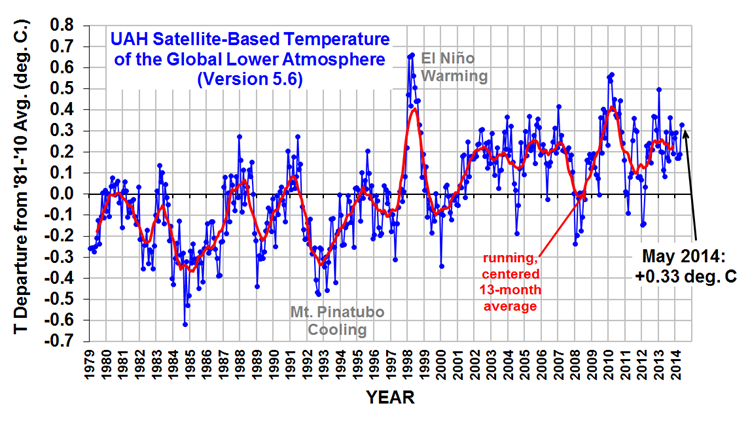
The Version 5.6 global average lower tropospheric temperature (LT) anomaly for May, 2014 is +0.33 deg. C, up from April (click for full size version):
The global, hemispheric, and tropical LT anomalies from the 30-year (1981-2010) average for the last 17 months are:
YR MON GLOBAL NH SH TROPICS
2013 1 +0.497 +0.517 +0.478 +0.386
2013 2 +0.203 +0.372 +0.033 +0.195
2013 3 +0.200 +0.333 +0.067 +0.243
2013 4 +0.114 +0.128 +0.101 +0.165
2013 5 +0.082 +0.180 -0.015 +0.112
2013 6 +0.295 +0.335 +0.255 +0.220
2013 7 +0.173 +0.134 +0.211 +0.074
2013 8 +0.158 +0.111 +0.206 +0.009
2013 9 +0.365 +0.339 +0.390 +0.190
2013 10 +0.290 +0.331 +0.249 +0.031
2013 11 +0.193 +0.160 +0.226 +0.020
2013 12 +0.266 +0.272 +0.260 +0.057
2014 1 +0.291 +0.387 +0.194 -0.029
2014 2 +0.170 +0.320 +0.020 -0.103
2014 3 +0.170 +0.338 +0.002 -0.001
2014 4 +0.190 +0.358 +0.022 +0.093
2014 5 +0.329 +0.326 +0.333 +0.173
This is the 3rd warmest May in the satellite record:
1998 +0.56 (warm ENSO)
2010 +0.45 (warm ENSO)
2014 +0.33 (neutral)
John Christy thinks the coming El Nino will give us a new temperature record, since it is superimposed on a warmer baseline than the super El Nino of 1997-98. I’m not convinced, since we are in the cool phase of the PDO, which favors weak El Ninos (like 2009-10).
As we finish up our new Version 6 of the UAH dataset, it looks like our anomalies in the 2nd half of the satellite record will be slightly cooler, somewhat more like the RSS dataset….but we are talking small adjustments here…hundredths of a deg. C.
The global image for May should be available in the next day or so here.
Popular monthly data files (these might take a few days to update):
uahncdc_lt_5.6.txt (Lower Troposphere)
uahncdc_mt_5.6.txt (Mid-Troposphere)
uahncdc_ls_5.6.txt (Lower Stratosphere)
Interesting Article on clouds. Sounds like a negative feedback to me.
http://www.accuweather.com/en/home-garden-articles/earth-you/researchers-penetrate-one-of-t/28309808
If it does beat 1998, will that mean that a new mene will have to be created as the old one (“it’s not warmed since 1998”) will be out-of-date?
That meme has never been in-date — it relies on cherry picking a very unusual year for purposes of comparision.
Two can play that game. The last 5 years are the warmest in UAH’s record. So are the last 10 years. So are the last 20, the last 25, and the last 30.
David,
Would you like to peg your salary for the next ten years at current levels.
Then you can boast that the next 10 years are the highest it has ever been.
No matter whether you take the last 17 years or the last 70 yrs or the last 140 years the alarmist proposition does not hold water. It’s the physics we are talking about not a time series.
BTW I am I guess a little shorter than 10 years ago but if I take a trend line from when I was 1yo I shall be 10 ft tall if ever I get to 100. No I am not having a dig at you here but some clown physicist from the US who came on a TV show telling us to ignore the hiatus as the trend was up. I guess you guys have your version of John Cook too.
Tony: Most people’s salaries continually increase. So, yes, the average of their last 10 years would be at a record level.
The analogy to temperature is obvious.
The time series reflects the physics.
Thanks David.
I guess I will be about 9ft when I reach 90 and need get a new tailor.
The underlying time series of height reflects the physics too. I’ll take your word as changes in biochemistry don’t matter.
David,
I was not talking about “most people” as most would not be daft enough to believe they were better off if their salary was pegged for 10 years.
I was talking about pegging your salary for 10 ( make that 17) years. You should be quite happy given your reasoning of the underlying physics.
I’m retired so no my salary is not as healthy as when I worked. Financially I am not better off in the next 10 years even though my overall linear trend is still up.
Here you go, Tony: the 10-year period ending in Dec 1998 had an average UAH LT anomaly of -0.05 C.
The 10-year period ending with May 2014 had an average of 0.19 C.
Great, you just showed Bob Tisdale’s 0.25 degree C step change caused by the El Nino.
Thanks.
Thing is, with an El Nino as big as the one in 1998, a +0.25 degree C step change in temperature would be exactly what we would expect….
David – you might enjoy this article I got published referring to the very phenomanon to which you allude! : http://www.huffingtonpost.com/davidgoldstein/interview-with-a-climate-change_b_5325343.html
Whereas AGW alarmists cherry-pick a starting point a decade or two outside of the “little ice age” (1880) as their starting point.
Cherry-picking is rampant in this science.
According to most of the data sets, it actually hasn’t warmed since about September of 1996, which “Cherry Picks” a date before the Super El Nino of 1997-1998. Therefore, there has been statistically no significant warming INCLUDING the big 1998 spike….
I personally doubt that we will beat 1998 this year. The PDO is slightly negative, and the AMO is decidedly negative. There is a big cold-pool south of the equator in the Pacific that will almost definitely cause this El Nino to be weaker than most forecasters are predicting.
Joe Bastardi may not be right 100% of the time, but he sure does know his patterns, and he says that this El Nino could well fizzle out, and almost certainly will be nowhere near as strong as the 1997-1998 version was.
Take another look. For the time being, the cool phase of the PDO is vamoose.
the PDO really can’t be interpreted on a month-to-month basis. It is considered by some to be a low-frequency expression of ENSO. Even when it goes positive during an El Nino, you can still be considered “in the negative phase of the PDO”.
Is the fact that it is the third warmest May, significant, since these are anomalies?
As months go it is joint 30th warmest and 0.23c lower than May 1998.
YTD is 0.32c lower than 1998.
To beat 1998 the average for the remainder of the year will have to be 0.55c.
To me, ANY anomaly below +/- 1 degree C is probably NOT significant.
The error bars, especially on PAST measurements are way too high (although you won’t find error bars on any “climate” graphs that I have seen…)
But, regardless, anything within +/- 1 degree C isn’t even noticeable to the average plant, animal, or human and certainly isn’t statistically significant on a 4 billion year climatic scale.
Ray, the year to compare to 1998 would be next year (2015), presumably the year of peak El Nino warmth.
I thought that, but didn’t say it!
Or depending on the timing we could get two part years (back end of 2014 and start of 2015) but people are only interested in calendar years.
Well I’m sure the Canadians would sure like for some of that warmer weather to be sent their way. They seem to be having some rather wintery weather up north for this time of year. Though this Hoosier isn’t complaining, I have noticed that so far this year the Continental US is having the coldest year on record.
Yeah, a “blistering” 24C (73F) here in Indianapolis on June 10th… kinda pleasant actually, except for the clouds and humidity and the threat of rain. Much better than being in the low 90s though (F of course).
USHCN data from near Indianopolis shows a definite upward trend:
http://is.gd/1knNQE
http://cdiac.ornl.gov/cgi-bin/broker?id=123527&_PROGRAM=prog.gplot_meanclim_mon_yr2013.sas&_SERVICE=default¶m=TMEAN&minyear=1883&maxyear=2013
DavidA,
Having been here since the mid-1980s, I would tend to agree with the upward trend here locally. However, the warmest Summer temperatures were 1995, 1998, and 2012. 2014 has actually been pretty darn cold here by comparison, although we did have some above-average days in late May. January through April of 2014 was ridiculously below normal though, especially in the unadjusted (raw) data. The USHCN probably adjusted the temperature upwards for that period, but let me tell you, we actually FELT the raw, unadjusted temperatures, NOT the adjusted ones!!!!
Dr Spencer,
Leaving aside the extremes hit by the el nino/ la nina but it seems that since the large 98 el nino the T settled at roughly 0.3 C higher.
Bob Tisdale relates much of the T increases to this sort of phenomenon. What are your thoughts? I can’t see how this might relate to GHGs though. I appreciate that these are short periods to feel comfortable with any speculation.
research we published last year suggests that periods with stronger El Ninos lead to global warming, periods with stronger La Nina lead to global cooling.
*If* these natural fluctuations are superimposed upon a longer-term warming trend, you then get warming, then a plateau, then warming again, then a plateau. The longer term warming trend is, in my view, at least partly (maybe even mostly) human-caused.
But when you put all of this together with the observed rate of surface and deep ocean warming, you get a low climate sensitivity, i.e., non-dangerous (and maybe even beneficial) AGW.
Dr. Spencer – I follow you from time to time and 95% of what you post is so far over my head I can never understand it on a layman’s basis. I was reading this and saw “The longer term warming trend is, in my view, at least partly (maybe even mostly) human-caused” and wondered what you meant exactly. I wouldn’t automatically believe you were a believer in man-made global warming but this sentence makes it sound as though you may be that now. Have a good day!
Foster and Rahmstorf attempted to adjust for ENSOs, volcanoes, and solar variability. They found steady underlying trends of 0.14 to 0.18 C/decade, through 2010.
“Global temperature evolution 1979–2010”
Environmental Research Letters Volume 6 Number 4
Grant Foster and Stefan Rahmstorf 2011 Environ. Res. Lett. 6 044022 http://iopscience.iop.org/1748-9326/6/4/044022
David, all they did was remove the “bumps” in the temperature record from short term variability, like from ENSO. They did not account for the ocean heat *accumulation* effect that El Nino has on long-term trends.
Yes, I realize that. But it shows that GHG warming continues on top of short-term natural variability.
You obviously missed my point.
Then what is your point?
There is no “short-term” natural variability – nature is in constant variation.
If you are trying to say that the 1997/1998 Super El Nino was a “short-term variability” then it would depend on what you mean by short-term…
The 1997/1998 Super El Nino boosted temperatures by about +0.25 degrees C, and after that step-change things have been pretty much on a stable plateau ever since, below the highest temperature level achieved during that El Nino.
The important thing to note is how long it is taking(took) to get to new global temperature highs.
Most skeptics, including me believe(make that acknowledge-based on evidence) that we are warming.
The issue is not warming vs cooling or warming vs no warming in the last XX years.
The issue is the RATE of measured warming.
If the rate is close to global climate models projections and that rate is linked strongly to CO2 in the atmosphere, then there will be some problems down the road that should be addressed.
If the rate is so slow that it takes 16 years to nudge out the old global temperature highs(even if they were set in a strong El Nino year) during an El Nino year, then that fact makes it obvious that it’s not a problem.
So we should focus on real science and proven laws regarding CO2. Remember this one??
Sunshine +H2O +CO2 = Sugar(food) + Oxygen
Throw in some essential minerals, usually from the soil and you get photosynthesis which we learned about in elementary school.
Today in school, my 3rd grade grand daughter is being taught CO2=Pollution.
How many people today, if they were taught that the sun revolves around the earth in school, then told by solar scientists, the media and governments that the sun revolves around the earth would know otherwise???
Sure looks like it from the vantage point of every human standing on this planet watching it cross the sky every day.
The rate of measured warming may well be meaningless.
Take for example the 1997/1998 Super El Nino. It caused a nearly instantaneous (climatologically speaking) step-change of +0.25 degrees C in “global average temperature (whatever the hell THAT is… meaningless term…)
Since the Super El Nino, we have stayed on the same plateau with only minor temperature variations in the 16 years since that event, but no TREND in temperature whatsoever.
It would be completely ERRONEOUS to draw a LINEAR trend-line through data which clearly has a naturally caused step-change in it.
Basically, if the temperature trend from 1983-1996 was relatively flat, there was a big step-change, and then the data from 1999-2013 was relatively flat, drawing a trend-line through the data would be a statistically insane thing to do, even though 30 years is supposedly a long enough time in “climate” to be able to do such a thing….
Now, I realize that 1983-1996 wasn’t perfectly flat – there was some upward trend there. I also realize that 1999-2013 isn’t perfectly flat either (it is actually ever so slightly down, but pretty close to “flat”), but statistically, there is 14 years of not a whole lot of change, followed by an abrupt step up over a 2 year period, followed by 14 years of almost no change at all. Drawing a straight line through the 30-year period of 1983-2013 is silly if you ask me….
More of the same. All things being equal which they are of late it is ENSO which is clearly driving global temperatures, not CO2.
Month of May just lends more support to that train of thought.
–
These four factors either combined or in some combination are responsible for all the climate changes on earth. If one agrees with this then one will also have to agree that global climate change is synchronous.
MY FOUR FACTORS
1. The initial state of the global climate.
a. how close or far away is the global climate to glacial conditions if in inter- glacial, or how close is the earth to inter- glacial conditions if in a glacial condition.
b. climate was closer to the threshold level between glacial and inter- glacial 20,000 -10,000 years ago. This is why I think the climate was more unstable then. Example solar variability and all items would be able to pull the climate EASIER from one regime to another when the state of the climate was closer to the inter glacial/glacial dividing line, or threshold.
.
2. Solar variability and the associated primary and secondary effects. Lag times, degree of magnitude change and duration of those changes must be taken into account. I have come up with criteria . I will pass it along, why not in my next email.
a. solar irradiance changes- linked to ocean heat content.
b. cosmic ray changes- linked to clouds.
c. volcanic activity- correlated to stratospheric warming changing which will impact the atmospheric circulation.
d. UV light changes -correlated to ozone which then can be linked to atmospheric circulation changes.
e. atmospheric changes – linked to ocean current changes including ENSO, and thermohaline circulation.
f. atmospheric changes -linked also to albedo changes due to snow cover, cloud cover , and precipitation changes.
g. thickness of thermosphere – which is linked to other levels of the atmosphere.
.
3. Strength of the magnetic field of the earth. This can enhance or moderate changes associated with solar variability.
a. weaker magnetic field can enhance cosmic rays and also cause them to be concentrated in lower latitudes where there is more moisture to work with to be more effective in cloud formation if magnetic poles wander south due to magnetic excursions in a weakening magnetic field overall.
4. Milankovitch Cycles. Where the earth is at in relation to these cycles as far as how elliptic or not the orbit is, the tilt of the axis and precession.
a. less elliptic, less tilt, earth furthest from sun during N.H. summer — favor cooling.
I feel what I have outlined for the most part is not being taken as a serious possible solution as to why the climate changes. Rather climate change is often trying to be tied with terrestrial changes and worse yet only ONE ITEM , such as CO2 or ENSO which is absurdity.
Over time not one of these one item explanations stand up, they can not explain all of the various climatic changes to all the different degrees of magnitude and duration of time each one different from the previous one. Each one UNIQUE.
Examples would be the sudden start/end of the Oldest, Older and Younger Dryas dramatic climate shifts, the 8200 year ago cold period, and even the sudden start of the Little Ice Age following the Medieval Warm Period.
Roy W. Spencer, Ph. D. says:
June 10, 2014 at 9:22 AM
the PDO really can’t be interpreted on a month-to-month basis. It is considered by some to be a low-frequency expression of ENSO. Even when it goes positive during an El Nino, you can still be considered “in the negative phase of the PDO”.
I disagree with that statement in the above completely.
The fact that the PDO is presently in a rather strong positive phase(not slightly positive ) is significant.
“Remote Sensing Systems” show a high in April 1998 for the LT of + 0.8573 K while their figure for May 2014 is + 0.2863 K.
Their figures are indeed on the cool side, since 1998, compared to UAH, and “the pause” is a little more obvious. The general picture is much the same, however.
According to a NASA scientist at Jet Propulsion working for NOAA (eh? this is confusing) this El Nino is going to be “El Wimpo” – we can forget it before it starts.
Not sure if you can have a significant La Nina after a feeble El Nino!
Yes, actually when the PDO and AMO are in “cold” phases together, El Ninos tend to be weak, and La Ninas tend to be quite strong.
When the AMO and PDO are both in “warm” phases (like the 1990s for example), you tend to get very weak La Ninas and strong El Ninos.
It is actually pretty rare that you get really strong El Ninos and La Ninas right after one another.
Below are seven of those so called important “facts” (one for every day of the week) that these global warming enthusiasts are pushing on the American people, that just so happen to be lies:
1) 97% of Scientists Agree: The 97% figure is a misquote of a flawed study. The study people use to come up with the 97%, “Quantifying the consensus on anthropogenic global warming in the scientific literature” by John Cook, and friends, First of all the real result was 97% of the scientific papers which had an opinion one way or the other believed in global warming. A more extensive examination of the Cook study reported that out of the nearly 12,000 scientific papers Cook’s team evaluated, only 65 endorsed Cook’s alarmist position. That’s about 0.5%. Other analysis demonstrates that some of the studies which disagreed with the global warming theory was mislabeled and 35% of the authors who took no position were left out of the final survey results altogether.
2) The Polar Ice caps are melting at record levels. Put away the SCUBA gear the world’s coastlines are NOT going to be under any time soon. Antarctic sea ice has set a new record for May, with extent at the highest level since measurements began in 1979. At the end of the month, it expanded to 12.965 million sq km, beating the previous record of 12.722 million sq km set in 2010. This year’s figure is 10.3% above the 1981-2010 climatological average of 11.749 million sq km. Arctic Ice had been lower than average but the total of the two has shown sea ice higher than normal. Even the Arctic sea ice is improving. Meteorologist Joe Bastardi reports For the first time in over a decade, the Arctic sea ice anomaly in the summer is forecast to be near or above normal for a time! While it has approached the normals at the end of the winter season a couple of times because of new ice growth, this signals something completely different – that multiyear growth means business – and it shows the theory on the Atlantic Multidecadal Oscillation (AMO) is likely to be on target. Once it flips, this red herring of climate panic will be gone. Global and Southern Hemisphere anomalies are already unmentionable since the former is well above normal and the latter is routinely busting daily records.
3) The Earth is Warming-In August 1996; the Atlanta Olympic ended; Netscape 3.0 was introduced to the internet; Bob Dole picked Jack Kemp as his Republican VP running mate; and the earth showed warming for the last time. According too RSS satellite data, the global warming trend in the 17 years 9 years since September 1996 is zero. The 213 months without global warming represent more than half the 425-month satellite data record since January 1979.
4) Global Warming is causing extreme weather-Even the UN’s IPCC , acknowledged by global warming believers as the best climate change authority, rejects this whopper
…In its [IPCC] newly released Fifth Assessment Report, the panel backed away from connections between current droughts and climate change. As it noted: “Based on updated studies, AR4 conclusions regarding global increasing trends in drought since the 1970s were probably overstated,” and “there is not enough evidence at present to suggest more than low confidence in a global-scale observed trend in drought or dryness (lack of rainfall) since the middle of the 20th century.” The report states that “it is likely that the frequency and intensity of drought has … decreased in central North America and north-west Australia since 1950.
The new report delivers a similar verdict for other sorts of extreme weather: “There is low confidence in any long term increases in tropical cyclone activity … and low confidence in attributing global changes to any particular cause.” Any increased hurricane damages “have not been conclusively attributed to anthropogenic climate change; most such claims are not based on scientific attribution methods.” There is “low confidence” for trends on tornadoes, and “the evidence for climate driven changes in river floods is not compelling.
A study published in the July 2012 Journal of the American Meteorological Society concluded unequivocally there is no trend of stronger or more frequent storms which makes sense since there has been no warming for almost 18 years.
5) Global Warming is Causing Asthma. The warming alarmists complain (when it helps their case) that skeptics confuse climate and weather. Here is a case where the alarmists are confusing pollution with climate. Dirty air limited to a small geographic area (like the smog in LA) is not climate change. Nor does it require the same solutions.
6) CO2 causes global warming- Maybe Mother Nature is computer-phobic, it works in all their computer models but it is not working in real life. Today CO2 levels in the atmosphere are higher than ever, but there hasn’t been warming in almost 18 years. During the medieval warming period 800-1400 C.E. it was hotter than it is today and CO2 levels were much lower than they are today.
7) The Hockey Stick: The term “hockey stick” was coined by the head of National Oceanic and Atmospheric Administration’s (NOAA) Geophysical Fluid Dynamics Laboratory, Jerry Mahlman, to describe the pattern of historical temperatures in the northern hemisphere (it kind of looks like a hockey stick on its side). The chart, created by Dr. Michael Mann (now at Penn State University) shows relatively stable temperatures until around 100 year ago when we see a spike up. It is one of the key pieces of information used to prove that global warming is about to destroy the world.
The Chart became the center of the IPCC’s argument that man-made global warming was real, even though (as memos released as part of the Climategate scandal revealed) the CRU at the University of East Anglia , had serious problems with the Hockey Stick chart, but it was pushed through by the chart’s creator Dr. Mann.
Salvatore, on #1, I believe it was 35% of papers which expressed an opinion one way or the other. Thus two thirds of the papers were thrown out… (correct me if I’m wrong)
Roy,
I look forward to reading the paper accompanying your new version 6. Do you know approximately when it will be published?
Remind you again, that for the UAH dataset to really become ‘somewhat more like the RSS dataset’, its MIDDLE section needs to be lifted rather than its second half to be cooled.
But, yes, we’re indeed talking a few hundredths of a degree. UP 0.06 Kelvin between 1992 and late 2005, to be precise:
http://i1172.photobucket.com/albums/r565/Keyell/RSSvsUAH_zpsf1327448.png
Some of you are missing some key points. Temps should have plummeted in the 2000s based on natural forcings. They didn’t of course because of the increasing CO2 forcing. This El Niño may actually fizzle out but 2014 will still have a shot at warmest year for NOAA and NASA. It all depends on how long inc surface temps linger in the pacific. There is a good 5 month delay for UAH in peak temps from MEI Niño conditions. UAH and RSS will therefore have too much lag in response to have a record year. Either way from here on out even neutral years will challenge El Niño years for the record. The background warming is simply too high now.
Bassman, what natural forcings would they be. Although solar cycle 24 has some of the lowest sun spot activity in over 100 years, according to SORCE data, the actual level of solar radiation is at record levels. Average Top of Atmosphere levels for April 14 were higher than for any year since 2003. All global temperatures are driven by incoming SWR so on the basis of input alone you would expect temperatures to be higher at the moment. Of couse what we gat as climate is subject to a vastly complex interaction of many other influences.
Thanks, Dr. Spencer.
I have updated your graph in my pages, and the hiatus goes on, for now. We shall watch and see how high the coming El Nińo pushes the temperatures in his trail, and for how long.
I do agree with Joe Bastardi that it does not look like it could be a very big one.
Bruiser 101, negative PDO makes up 70+ percent of it, aerosols, neg AMO and solar make up a lesser part. This information I am taking from NASA and has been talked about quite a lot in the literature the last 3 years or so. Temps will begin to rise in the next 5 years. If PDO switches back to positive then it will really rise.
regarding the questions if the coming ENSO event will become an el nino and if so how “strong”? I can say that having doing cycle analyses, a 300+/- 3 months period is obvious in ONI data, this means that the coming ENSO event will be an el nino, which is related to the the 1989 la nina, which in turn is related to the 1963/1964 el nino (each subsequent ENSO event is, as said, ~300 months apart).
The 1963/1964 el nino had a max ONI value of 1.4.
IMHO the coming el nino will therefore have the same value, and should peak nov. dec. this year.
btw, 25+25=50, which is equal to the 50yr solar cycle…
Folks,
It is really not hard to deal with the coming high temperatures fueled by El Nino and what Dr. Spencer states: “The longer term warming trend is, in my view, at least partly (maybe even mostly) human-caused.”
We have been very successful in cementing the idea in the minds of conservatives that there is no long term trend, despite the fact that Dr. Spencer will from time to time admit that there is a long term warming trend that is human-caused. Even if the coming El Nino creates new record global temperatures, there is no reason why the message should change.
Specifically:
It seems reasonably likely that neither 2014 nor 2015 will be hotter than the calendar year 1998 because of the timing of the coming El Nino. So even if a 12 month average is the highest ever, we can still refer to the strict calendar year average as not being warmer.
Even if 2014 or 2015 exceeds the 1998 average, it is unlikely that every month in the coming year exceeds the 1998 values, so one can say (for example) “August of 1998 was hotter than August 2014”. This still sounds like no warming and will be very effective.
Even if 2014 or 2015 is hotter than 1998, the difference is likely to be small since 1998 was so extremely abnormal. So one can just divide the difference in the the yearly average of 2014 or 2015 compared to 1998 by 16 or 17 years to come up with an average warming per year which will be far below the IPCC estimate for the next 100 years.
Most importantly, one can still just say that there is no warming at all regardless of what the coming temperatures say. Only climate scientists try to apply stringent statistical analysis. Those that want to see no warming will see that in the temperature plots anyway. Actually, only a very small percentage will consult the data at all.
We should continue to selectively discredit any proxy temperatures. Invoke Urban Heat Island effects on temperatures (and pretend that satellites pick that up too). Call into question any theory that the heat is in the ocean due to lack of data. Insist that temperature data is “adjusted” and not real.
Lastly, one can just say that was warmer in the distant past when there were no SUV’s. This is the best answer for politicians since they are not required to even understand measurements. Blame any evidence of warming on liberal scientists. The people that matter in this battle will go along.
I think people underestimate the difficulty involved with getting anyone to change an opinion based on ideology instead of science.
There is no imminent challenge in our community.
Walter
Walter;
What are your thoughts on what appears to be a trend to gentle warming vs. the models projecting disastrous change, seemingly designed into scaring people into buying into a designed agenda?
For many of us here, this is the crux of the issue.
Jake
Yes, it was very likely warmer 125,000 years ago.
Hi John,
You bizarrely wrote:
“Yes, it was very likely warmer 125,000 years ago.”
Do you understand that permafrost remains (mammoths, mastadons, woolly rhinoceros, etc) are CARBON DATABLE. In other words, they retain significant amounts of CARBON 14. Which of course means they cannot be any older than 30-40k years ago! Try again.
Have a great day!
It’s amazing when you are accused of making a bizarre response by someone who then goes on to make a bizarre response.
I was simply agreeing with Walter Schmidt that it was warmer in the distant past. Do you have a problem with me agreeing with Walter Schmidt that it was warmer in the distant past?
Hi John,
Please accept my apology for a snarky comment. There exists much psuedo-science to the effect that the earth may have been warmer but it must have been hundreds of thousands of years ago and they claim to arrive at such conclusions from glacial ice core readings. My point remains valid that in fact the earth MUST HAVE BEEN EXTENSIVELY WARMER THAN THE CURRENT PERIOD DURING MUCH MORE RECENT PERIODS THAN THE SUPPOSED 125K YEARS AGO YOU MENTIONED. THIS INCLUDES PERIODS EARLIER THAN 30-40K YEARS AGO. Carbon 14 dating makes it abundantly clear and I’ve heard or read somewhere that recent DNA analysis of permafrost remains have place them at ~ 5k yrs. Personally, I have nothing against Walter Schmidt but please understand I don’t place much stock in proxy dating methods, including btw the dna analysis I just mentioned. So NO I DON’T HAVE ANY PROBLEM WITH YOUR CLAIM THAT IT WAS WARMER IN THE DISTANT PAST, BUT IMHO THAT DISTANT PAST WILL PROVE MUCH EARLIER THAN MOST ANYONE EXPECTS. Enormous uncertainty runs through all such dating analysis. Nevertheless, the carbon 14 half life remains hard to fudge.
Have a great day!
The article on past climate changes PROVES that the current AGW theory is full of it, in that past climate changes have been much larger and abrupt then what is currently going on presently.
In-fact the climate over the past 100 years has been quite stable compared to the historical record.
THE ARTICLE
Numerous, abrupt, short-lived warming and cooling episodes, much more intense than recent warming/cooling, occurred during the last Ice Age and in the 10,000 years that followed, none of which could have been caused by changes in atmospheric CO2 because they happened before CO2 began to rise sharply around 1945. This paper documents the geologic evidence for these sudden climate fluctuations, which show s remarkably consistent pattern over decades, centuries, and millennia.
Among the surprises that emerged from oxygen isotope analyses of Greenland and Antarctic ice cores was the recognition of very sudden, short-lived climate changes. The ice core records show that such abrupt climate changes have been large, very rapid, and globally synchronous. Climate shifts, up to half the difference between Ice Age and interglacial conditions, occurred in only a few decades.
Ten major, intense periods of abrupt climate change occurred over the past 15,000 years and another 60 smaller, sudden climate changes have occurred in the past 5000 years. The intensity and suddenness of these climatic fluctuations is astonishing. Several times, temperatures rose and fell from 9-15° F in a century or less.
The dramatic melting of continental glaciers in North America, Europe, and Asia that began 15,000 years ago was interrupted by sudden cooling 12,800 years ago, dropping the world back into the Ice Age. Continental and alpine glaciers all over the world ceased their retreat and re-advanced. This cold period, the Younger Dryas, lasted for 1300 years and ended abruptly with sudden, intense warming 11,500 years ago. The climate in Greenland warmed about 9° F in about 30 years and 15° F over 40 years. During the Younger Dryas cold period, glaciers not only expanded significantly, but also fluctuated repeatedly, in some places as many as nine times.
Temperatures during most of the last 10,000 were somewhat higher than at present until about 3,000 years ago. For the past 700 years, the Earth has been coming out of the Little Ice Age and generally warming with alternating warm/cool periods.
Both Medieval Warm Period and Little Ice Age have long been well established and documented with strong geologic evidence. Georef lists 485 papers on the Medieval Warm period and 1413 on the Little Ice Age for a total of 1,900 published papers on the two periods. Thus, when Mann et al. (1998) contended that neither event had happened and that climate had not changed in 1000 years (the infamous hockey stick graph), geologists didn’t take them seriously and thought either (1) the trees they used for their climate reconstruction were not climate sensitive, or (2) the data had been inappropriately used. As shown in the 1,900 published papers, the Medieval Warm Period and Little Ice Age most certainly happened and the Mann et al. ‘hockey stick’ is nonsense, not supported by any credible evidence.
“Temperatures during most of the last 10,000 [years] were somewhat higher than at present until about 3,000 years ago.”
That is what my Physical Geography Textbook, from University days 50 years ago, simply stated. It was called “the Optimum [sic] Climate Phase”.
Silly old Professor. Didn’t he know that an extra 2 degrees C spells doom for the whole world? Goodness only knows how our ancestors managed to struggle through such furnace-like conditions, and to develop Civilizations along the way.
Hi Bernie,
The poor old Professor didn’t have the benefit of modern day pc psuedo-science to instruct him in proper environmental pedagogy. Especially as it relates to historical temperature re-constructions and graphs(read fantasy wall art!). Today such professors would be denied tenure, denied peer review and banished to some small college or educational institution still trying to maintain the proper academic discipline of pursuing facts and evidence where they lead and remaining open to new theories that incorporate new and ever changing information into their models. BTW don’t let that 50 year old textbook out your sight! The PC enviro-whacko book burners might track you down. Be carefull!!!
Have a great day!
I have just returned from “La France profonde” which I have been visiting for sixty years. The towns are sprawling and expensive and some have social problems. But the countryside!
Every visit, it is greener and denser. Huge swathes of pasture and woodland where there used to be hard-scrabble little farms. It is the same in Southern England. From the air, the rural buildings are just dots almost disappearing under the tree canopies.
CO2 seems to be Viagra for plants!
The French also use a lot of nuclear power.
So do the Germans, but in a fit of irrationality, after Fukashima, they decided to scrap it all! They prefer to get their gas from Putin’s lot, and their oil from that charming area of stability called the Middle East.!!
From one place, I could see the Tricastin nuclear power plant with its ever-present plumes. An American lady said “Oh my God! It’s on fire!” I assured her it was steam being vented.
A German lady then asked in all seriousness if the local wine was radioactive. I told her it came by the horrible taste naturally.
“…how our ancestors managed to struggle through such furnace-like conditions…”
They didn’t wear under-pants.
And when they got knocked down in the street and were taken to Hospital it was very embarrassing for them. (For younger people – this used to be the clinching reason given by British mothers to their children about why they should change their undies every morning. That, and the admonition “don’t eat peas with a knife because you will cut your mouth”.)
I also remember:
“Don’t shout so, darling! Mummy had the wrong sort of Gin last night.”
I guess these things can develop in many different ways but to me it already looks like things are starting to stall, ENSO I mean.
“…things are starting to stall, ENSO I mean.”
See my comment above in which I mention that the Australian Met Bureau says that this ENSO will have little effect, because the winds haven’t developed. Of course, Californians will be disappointed since they need a wet winter.
I notice that while the anomalies for the Lower Troposphere = + 0.33, the anomalies for the Middle Troposphere = + 0.23 and the anomalies for the Lower Stratosphere = – 0.31.
constantly i used to read smaller articles that as well clear their motive, and that is also happening with this paragraph which
I am reading here.
my site; Google
It’s fantastic that you are getting ideas from this paragraph as well as from our dialogue made at this place.
my web page – Virtual Temporary Office Rental San Francisco