USHCN Surface Temperatures, 1973-2012: Dramatic Warming Adjustments, Noisy Trends

April 11th, 2012 by Roy W. Spencer, Ph. D.

Since NOAA encourages the use the USHCN station network as the official U.S. climate record, I have analyzed the average [(Tmax+Tmin)/2] USHCN version 2 dataset in the same way I analyzed the CRUTem3 and International Surface Hourly (ISH) data.

The main conclusions are:

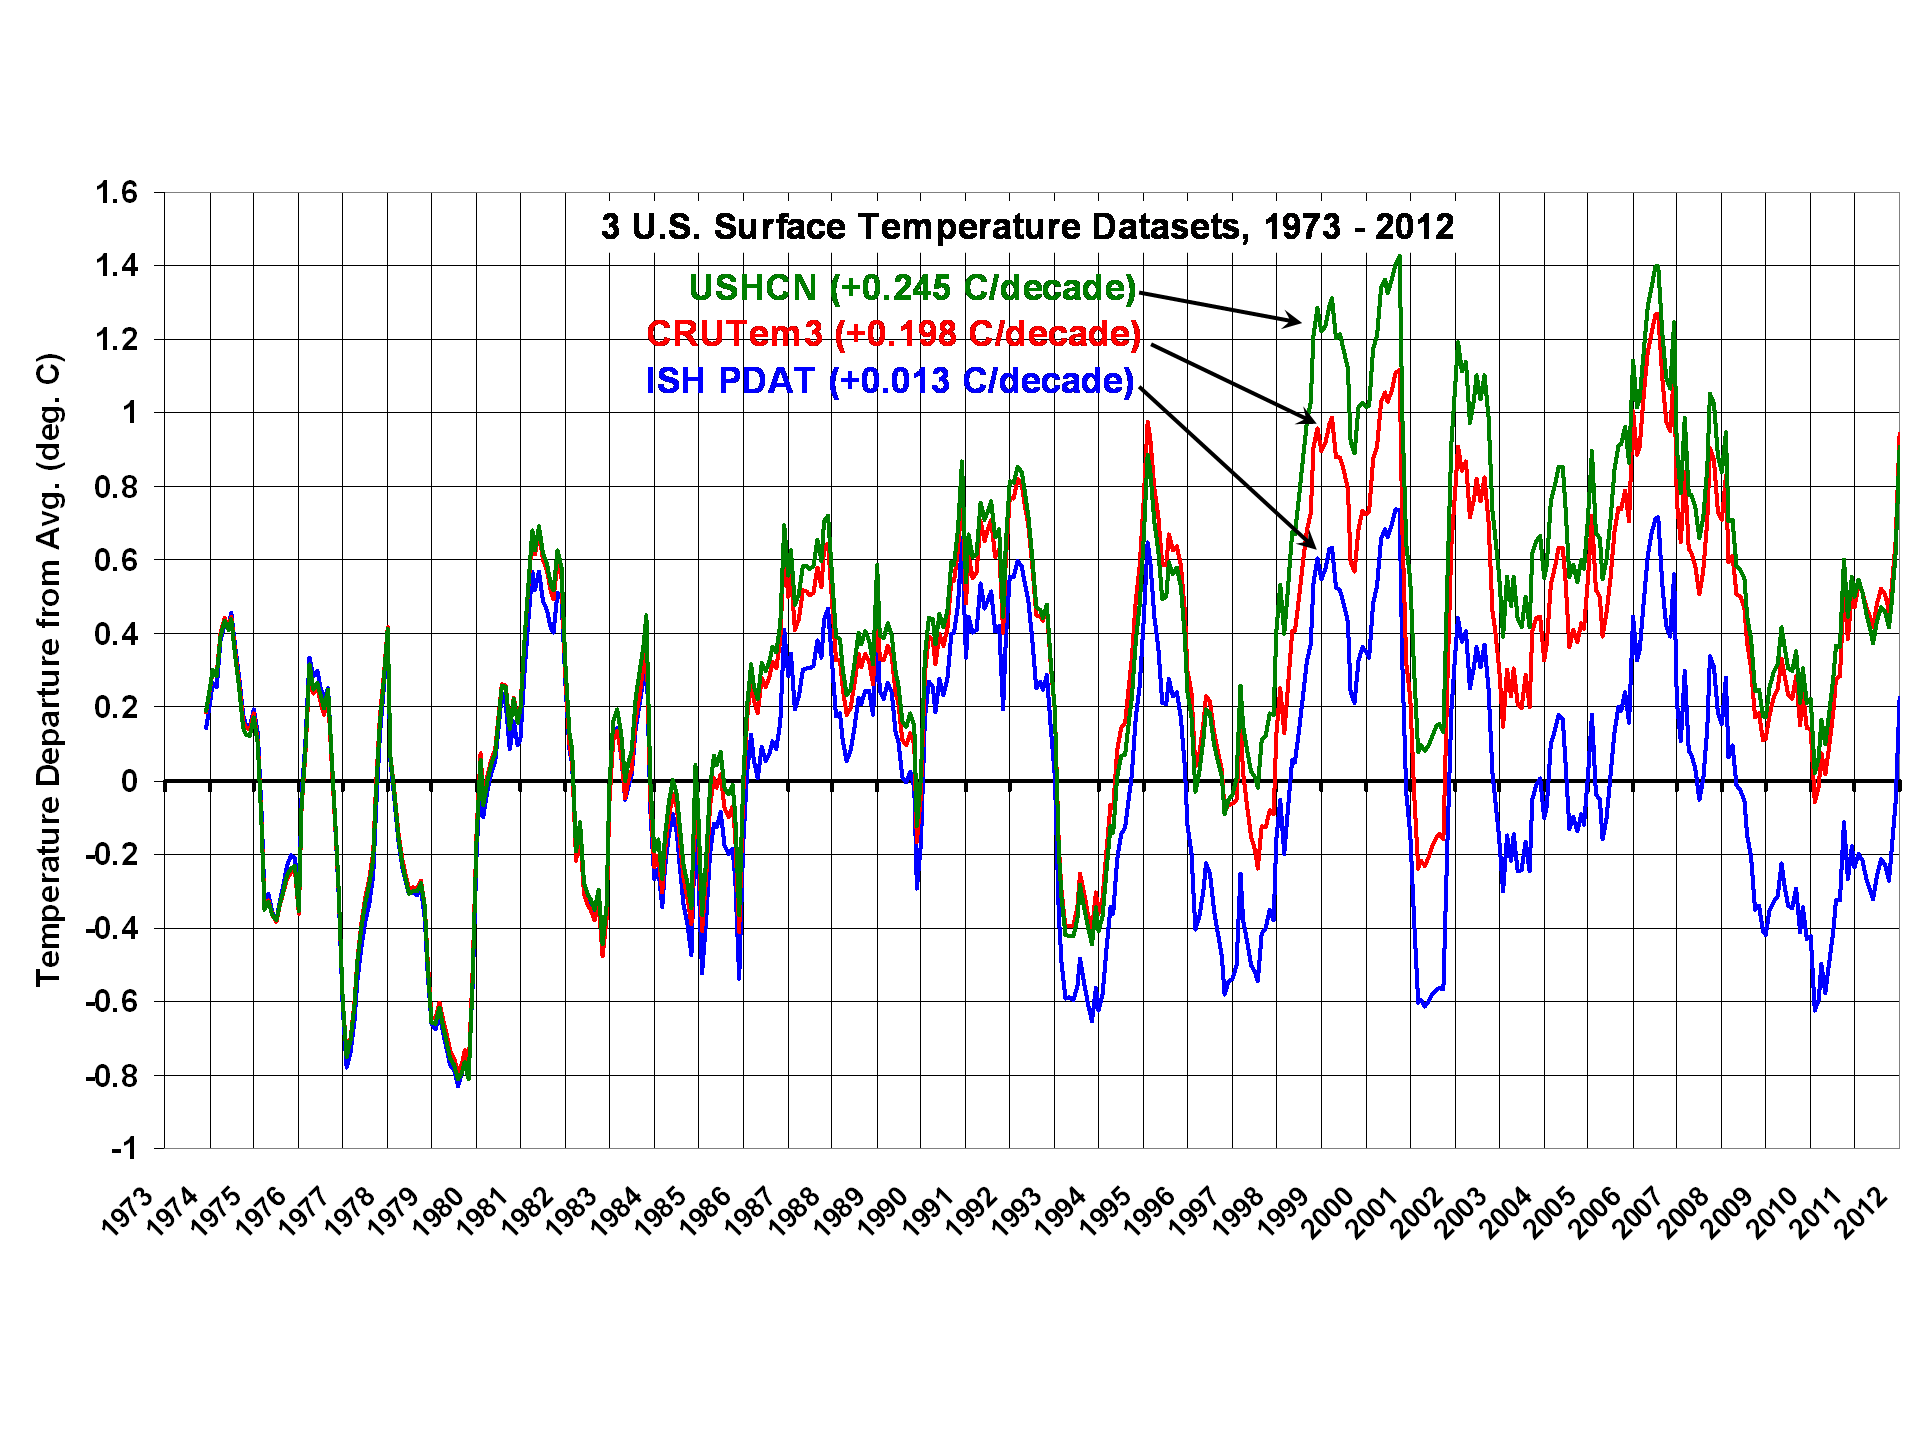
1) The linear warming trend during 1973-2012 is greatest in USHCN (+0.245 C/decade), followed by CRUTem3 (+0.198 C/decade), then my ISH population density adjusted temperatures (PDAT) as a distant third (+0.013 C/decade)

2) Virtually all of the USHCN warming since 1973 appears to be the result of adjustments NOAA has made to the data, mainly in the 1995-97 timeframe.

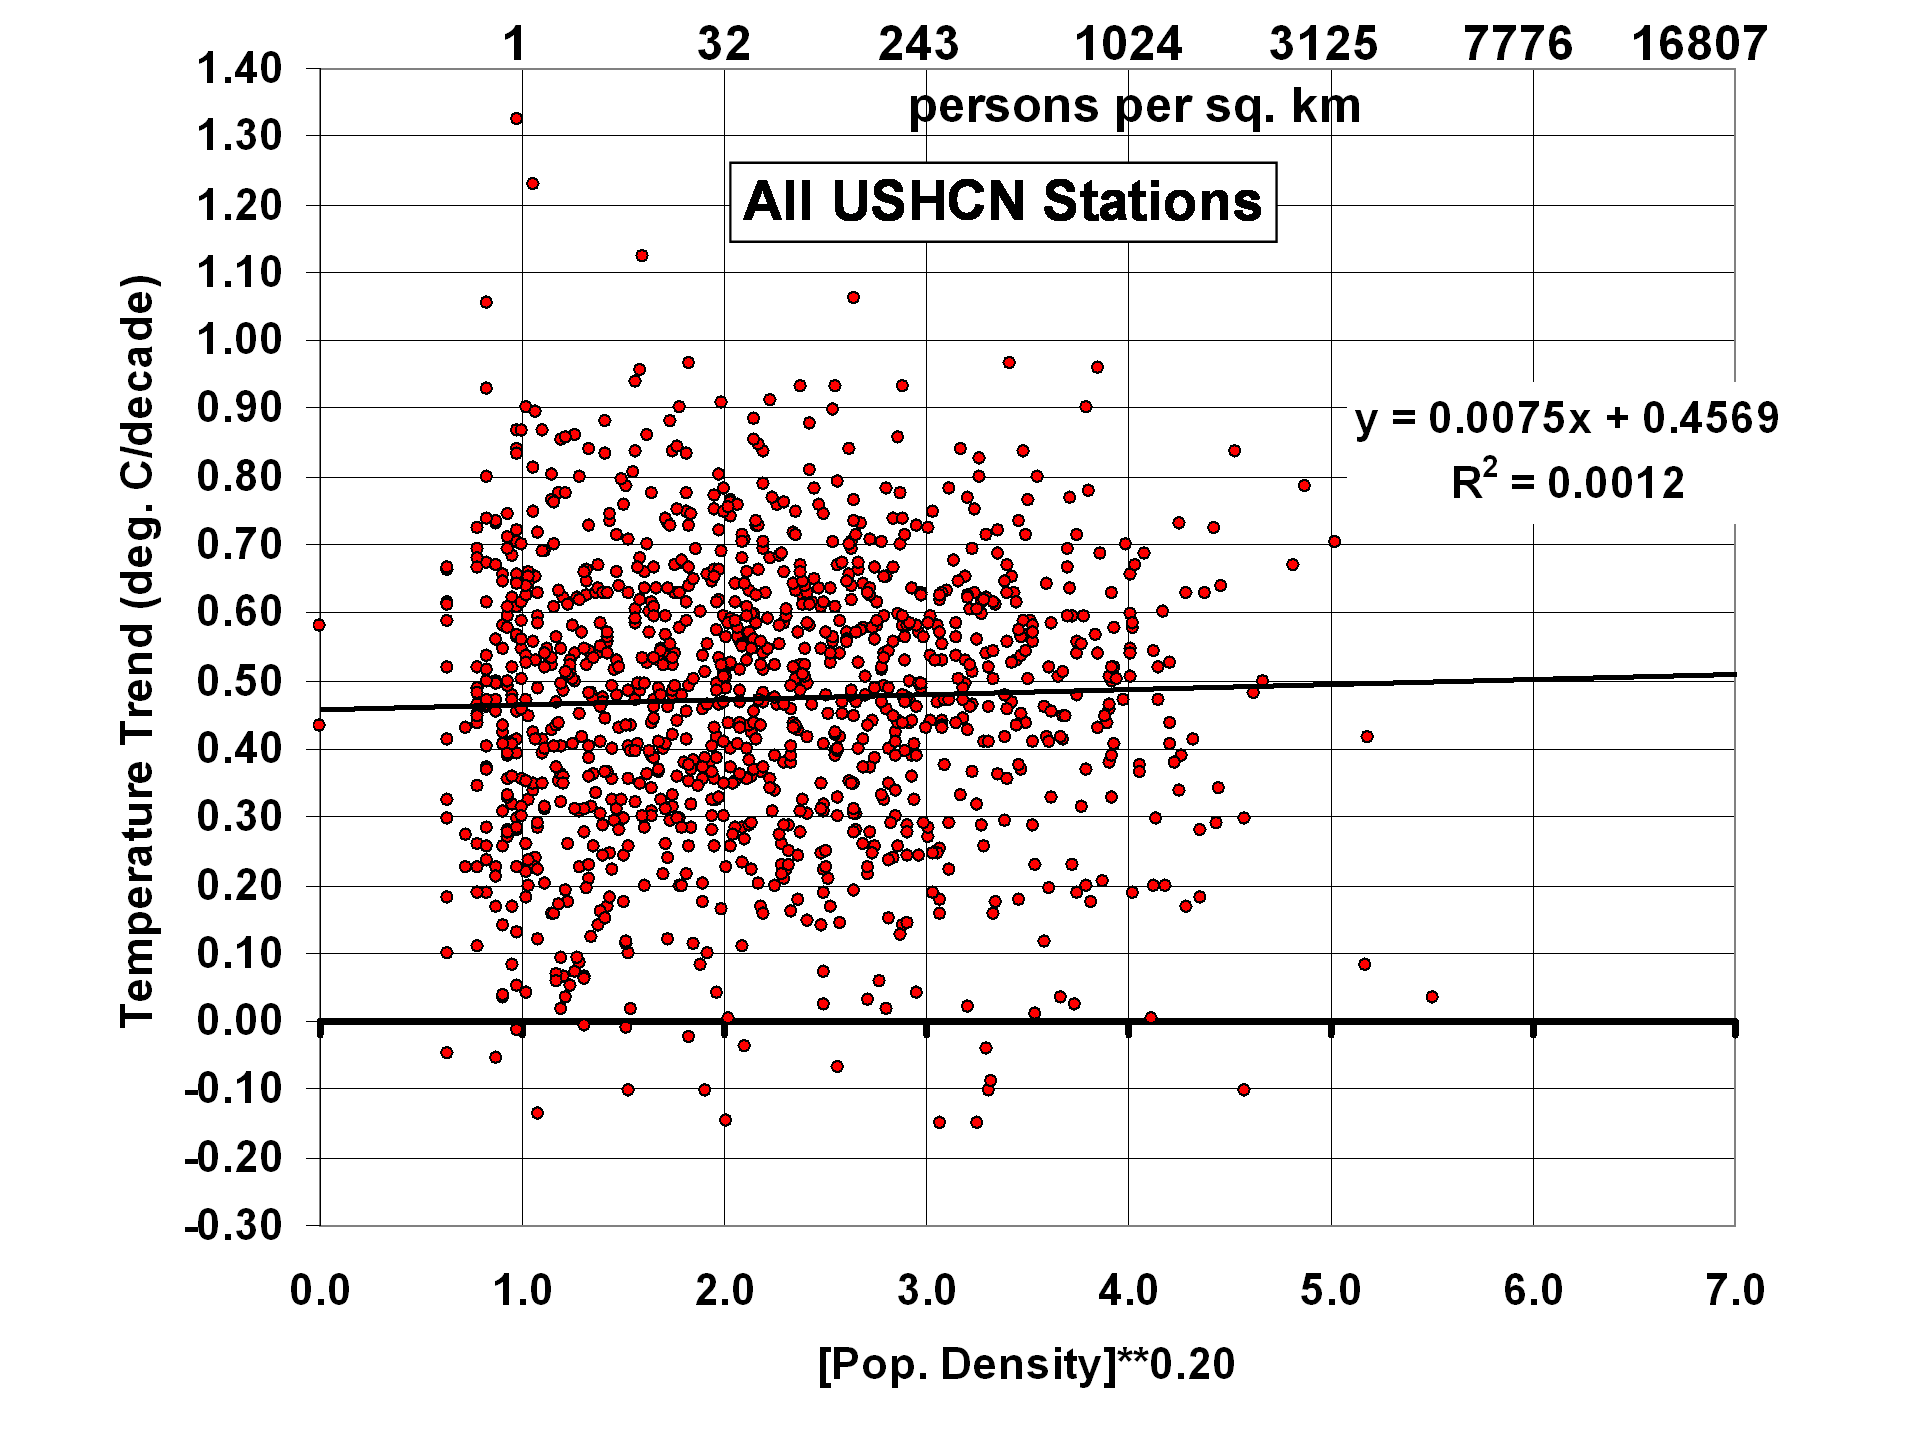
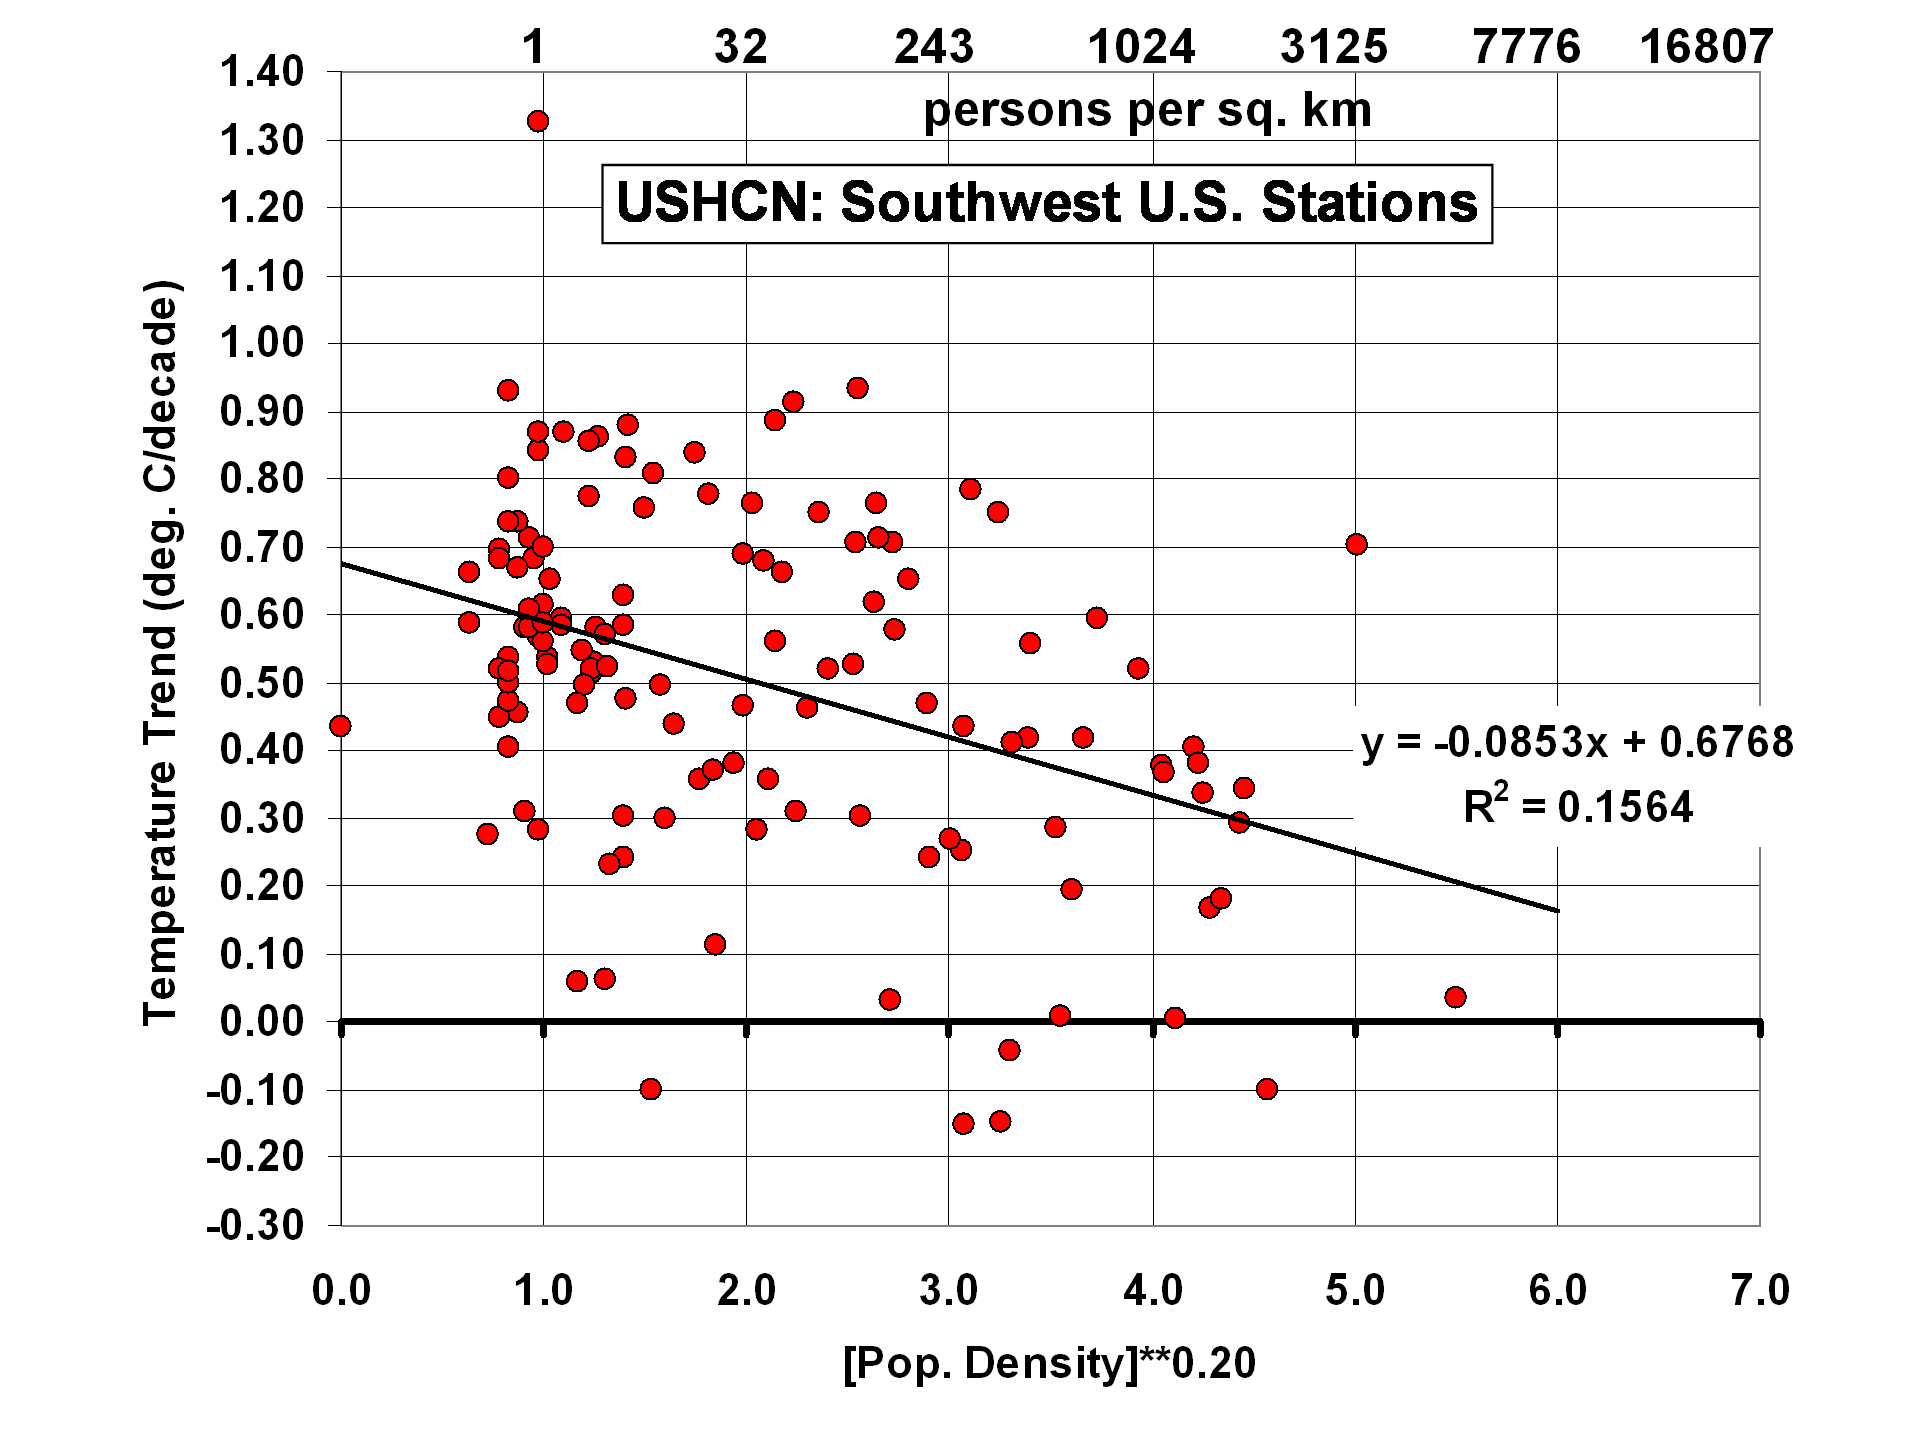
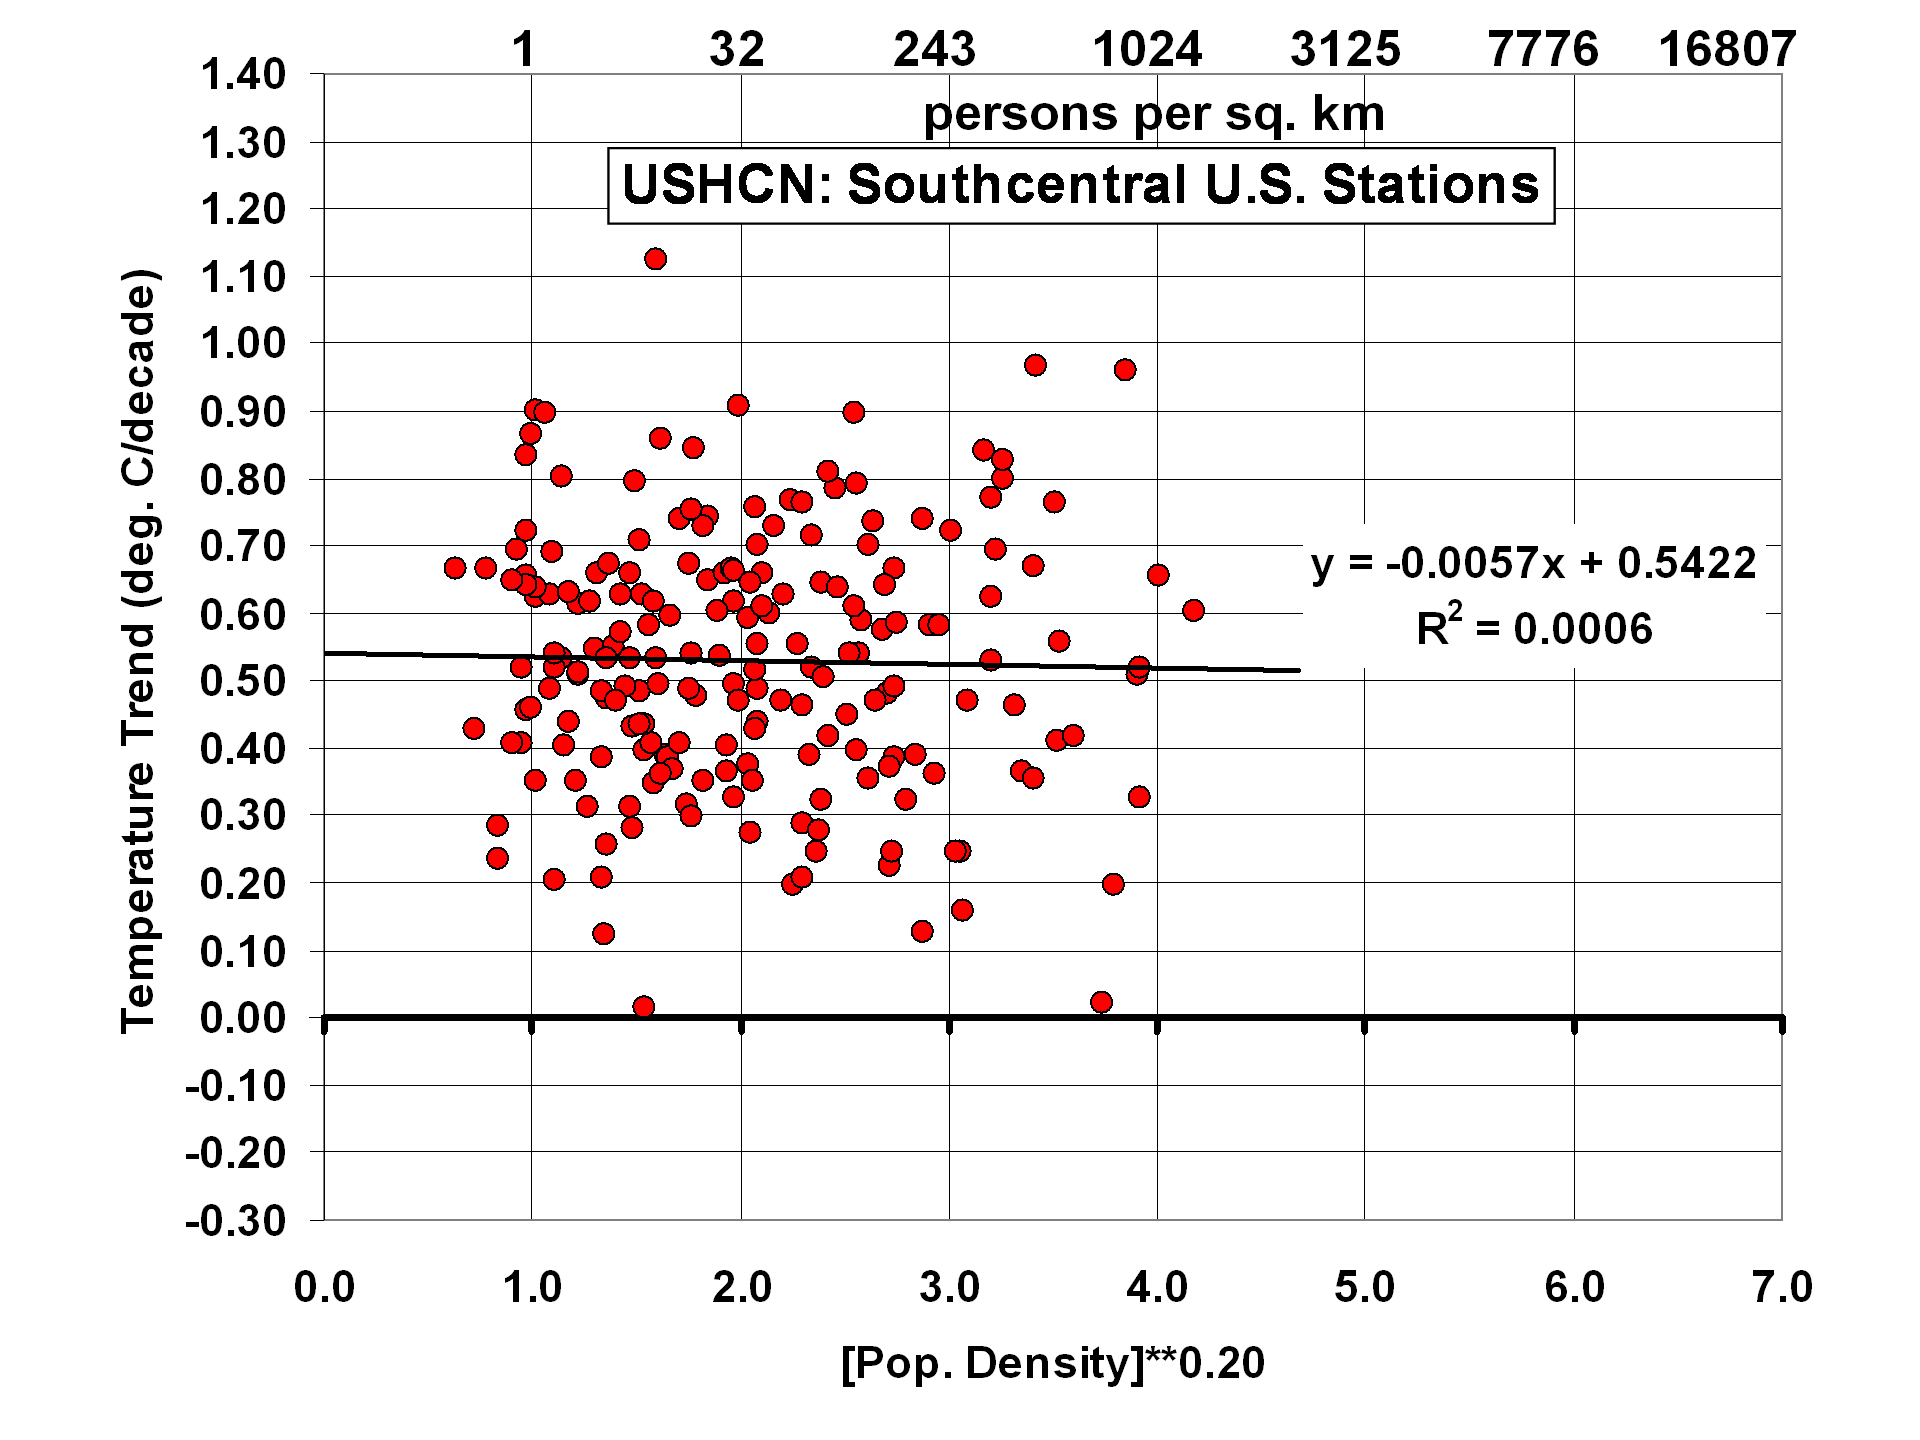
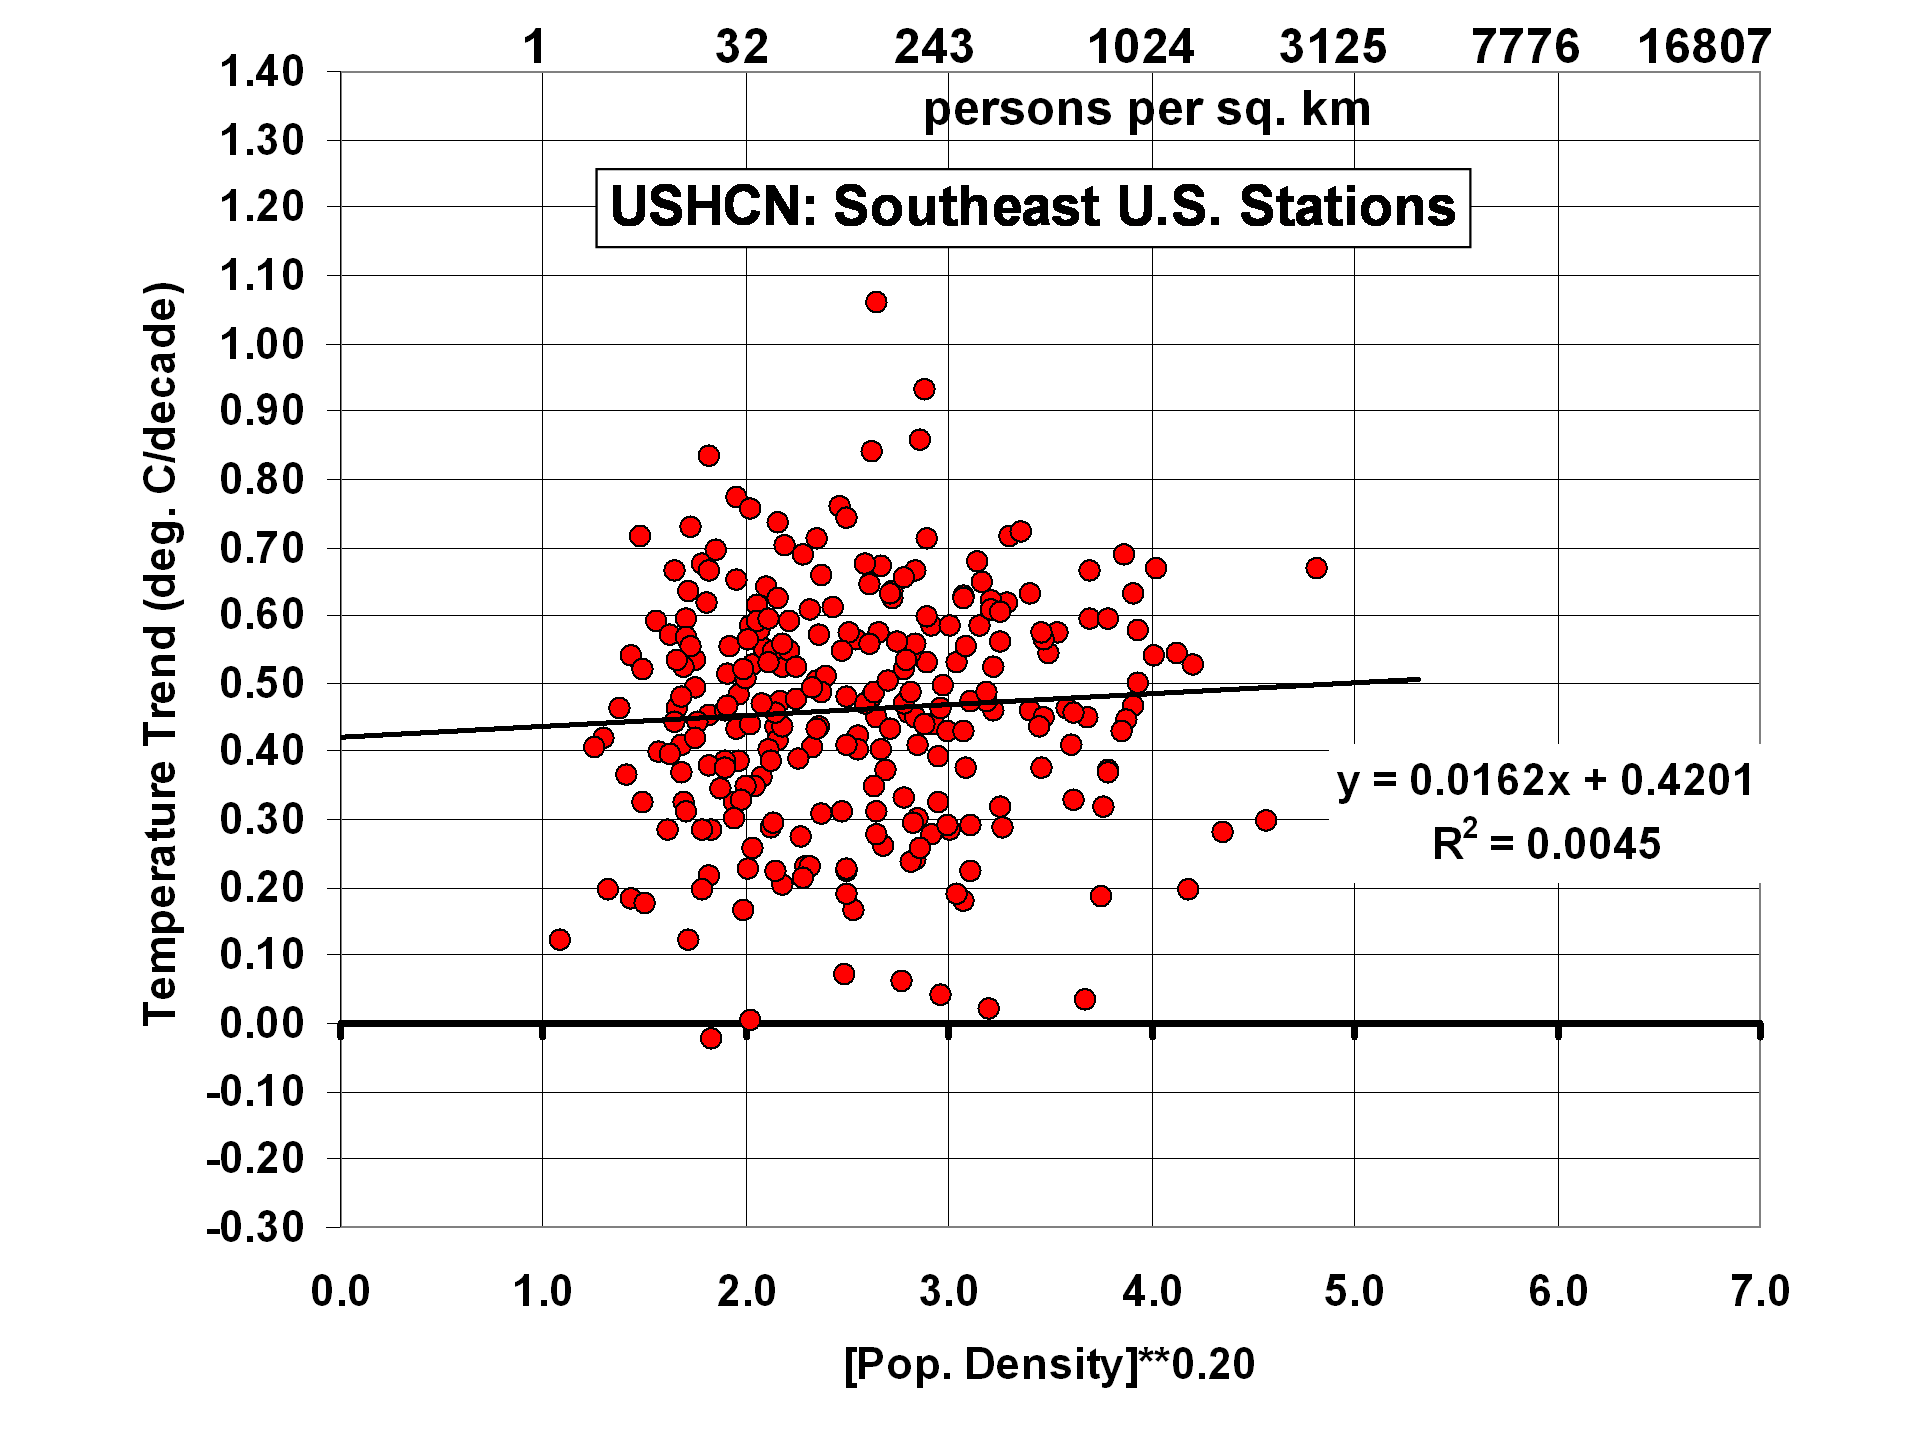
3) While there seems to be some residual Urban Heat Island (UHI) effect in the U.S. Midwest, and even some spurious cooling with population density in the Southwest, for all of the 1,200 USHCN stations together there is little correlation between station temperature trends and population density.

4) Despite homogeneity adjustments in the USHCN record to increase agreement between neighboring stations, USHCN trends are actually noisier than what I get using 4x per day ISH temperatures and a simple UHI correction.

The following plot shows 12-month trailing average anomalies for the three different datasets (USHCN, CRUTem3, and ISH PDAT)…note the large differences in computed linear warming trends (click on plots for high res versions):
The next plot shows the differences between my ISH PDAT dataset and the other 2 datasets. I would be interested to hear opinions from others who have analyzed these data which of the adjustments NOAA performs could have caused the large relative warming in the USHCN data during 1995-97:
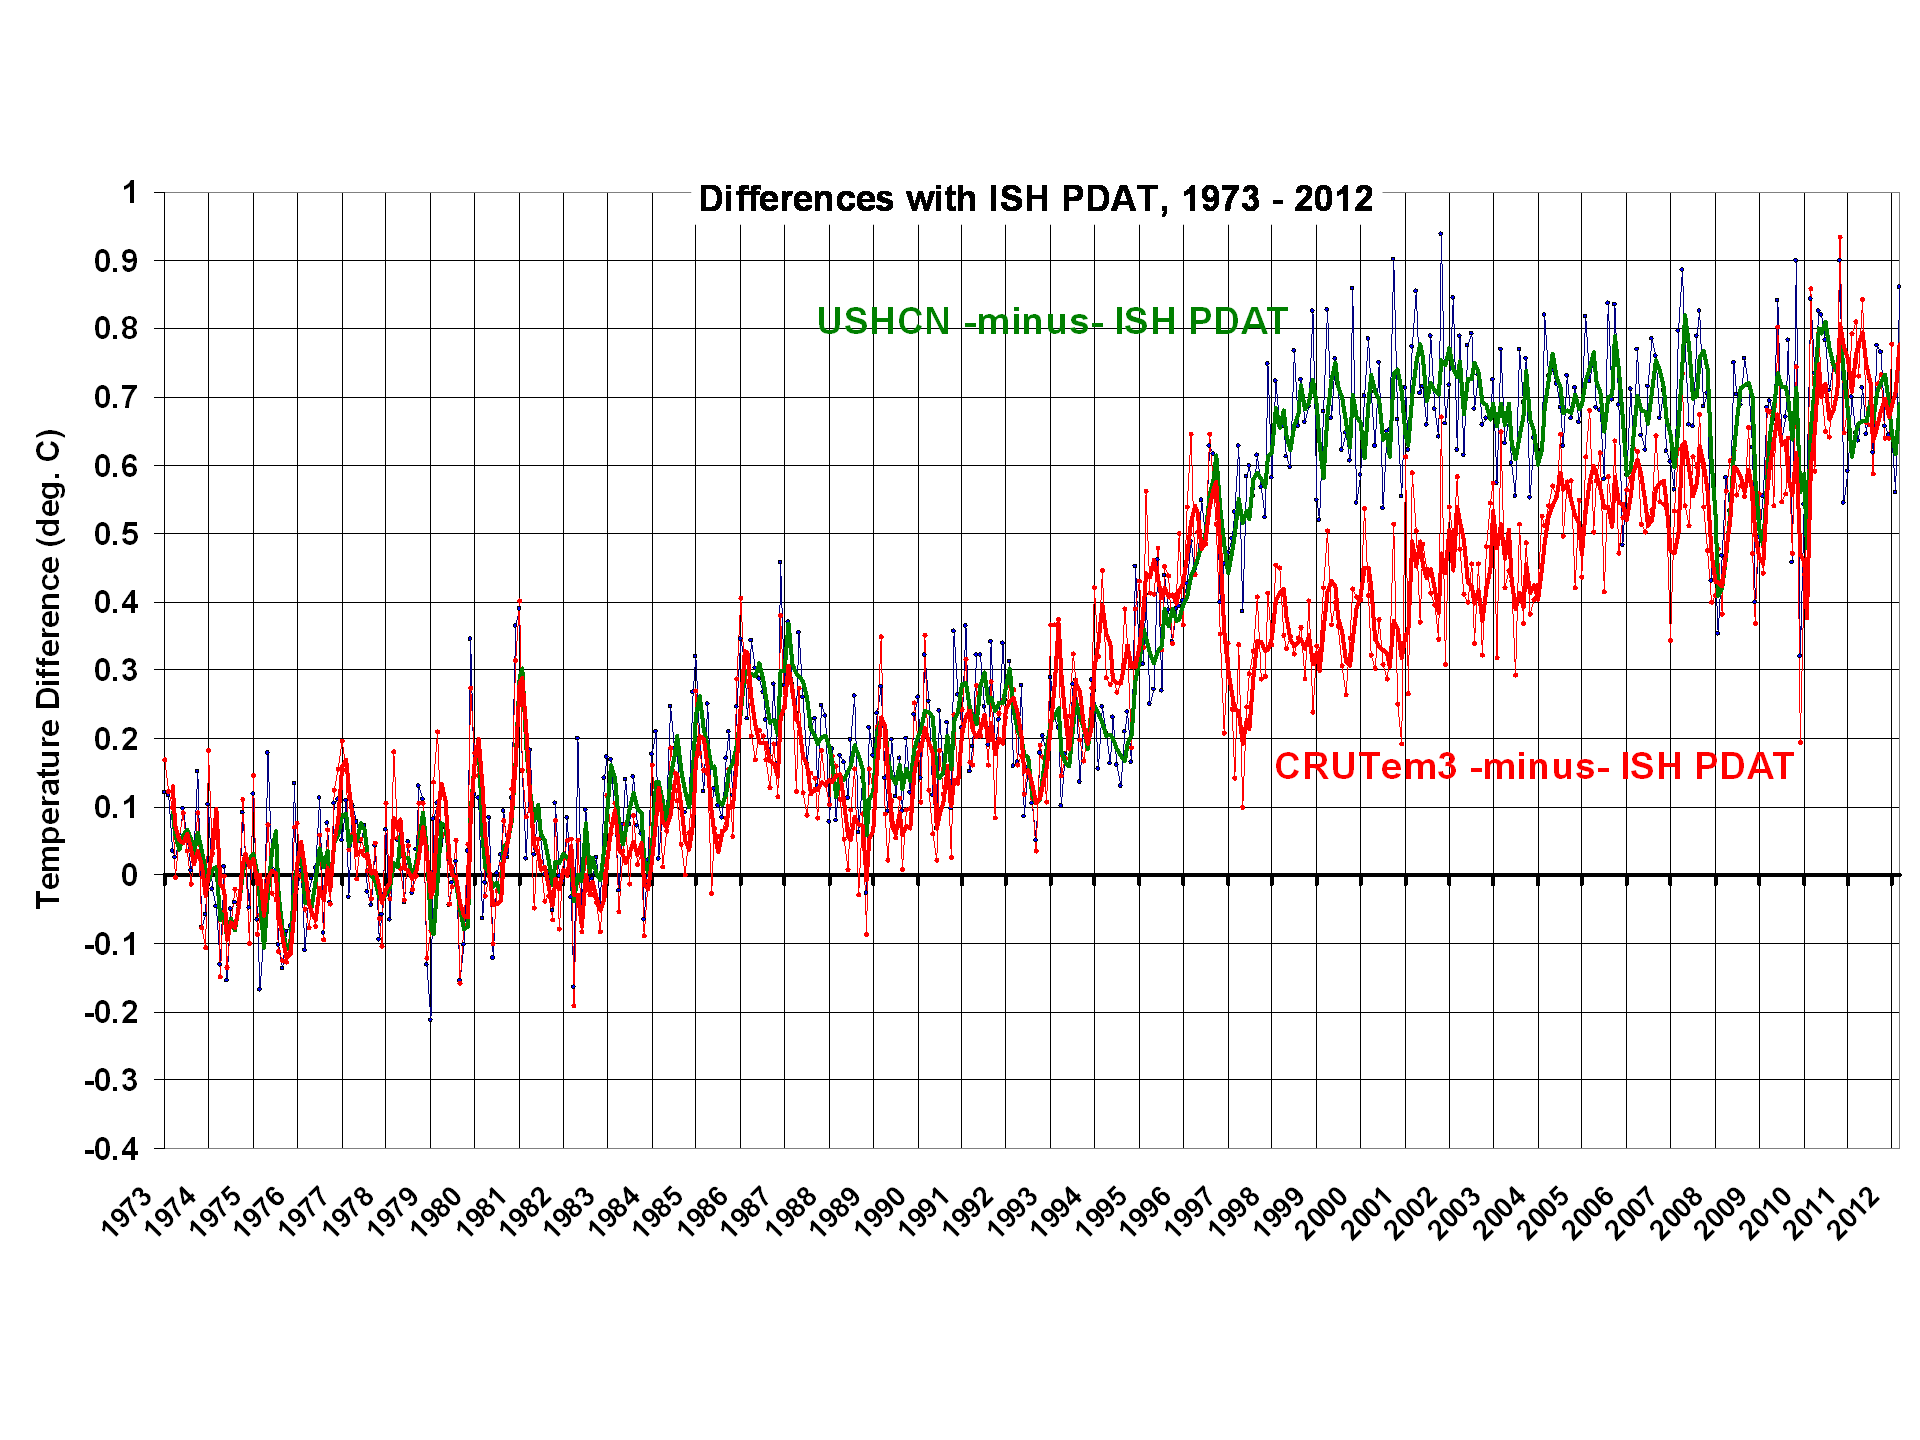
From reading the USHCN Version 2 description here, it appears there are really only 2 adjustments made in the USHCN Version 2 data which can substantially impact temperature trends: 1) time of observation (TOB) adjustments, and 2) station change point adjustments based upon rather elaborate statistical intercomparisons between neighboring stations. The 2nd of these is supposed to identify and adjust for changes in instrumentation type, instrument relocation, and UHI effects in the data.

We also see in the above plot that the adjustments made in the CRUTem3 and USHCN datasets are quite different after about 1996, although they converge to about the same answer toward the end of the record.

UHI Effects in the USHCN Station Trends
Just as I did for the ISH PDAT data, I correlated USHCN station temperature trends with station location population density. For all ~1,200 stations together, we see little evidence of residual UHI effects:

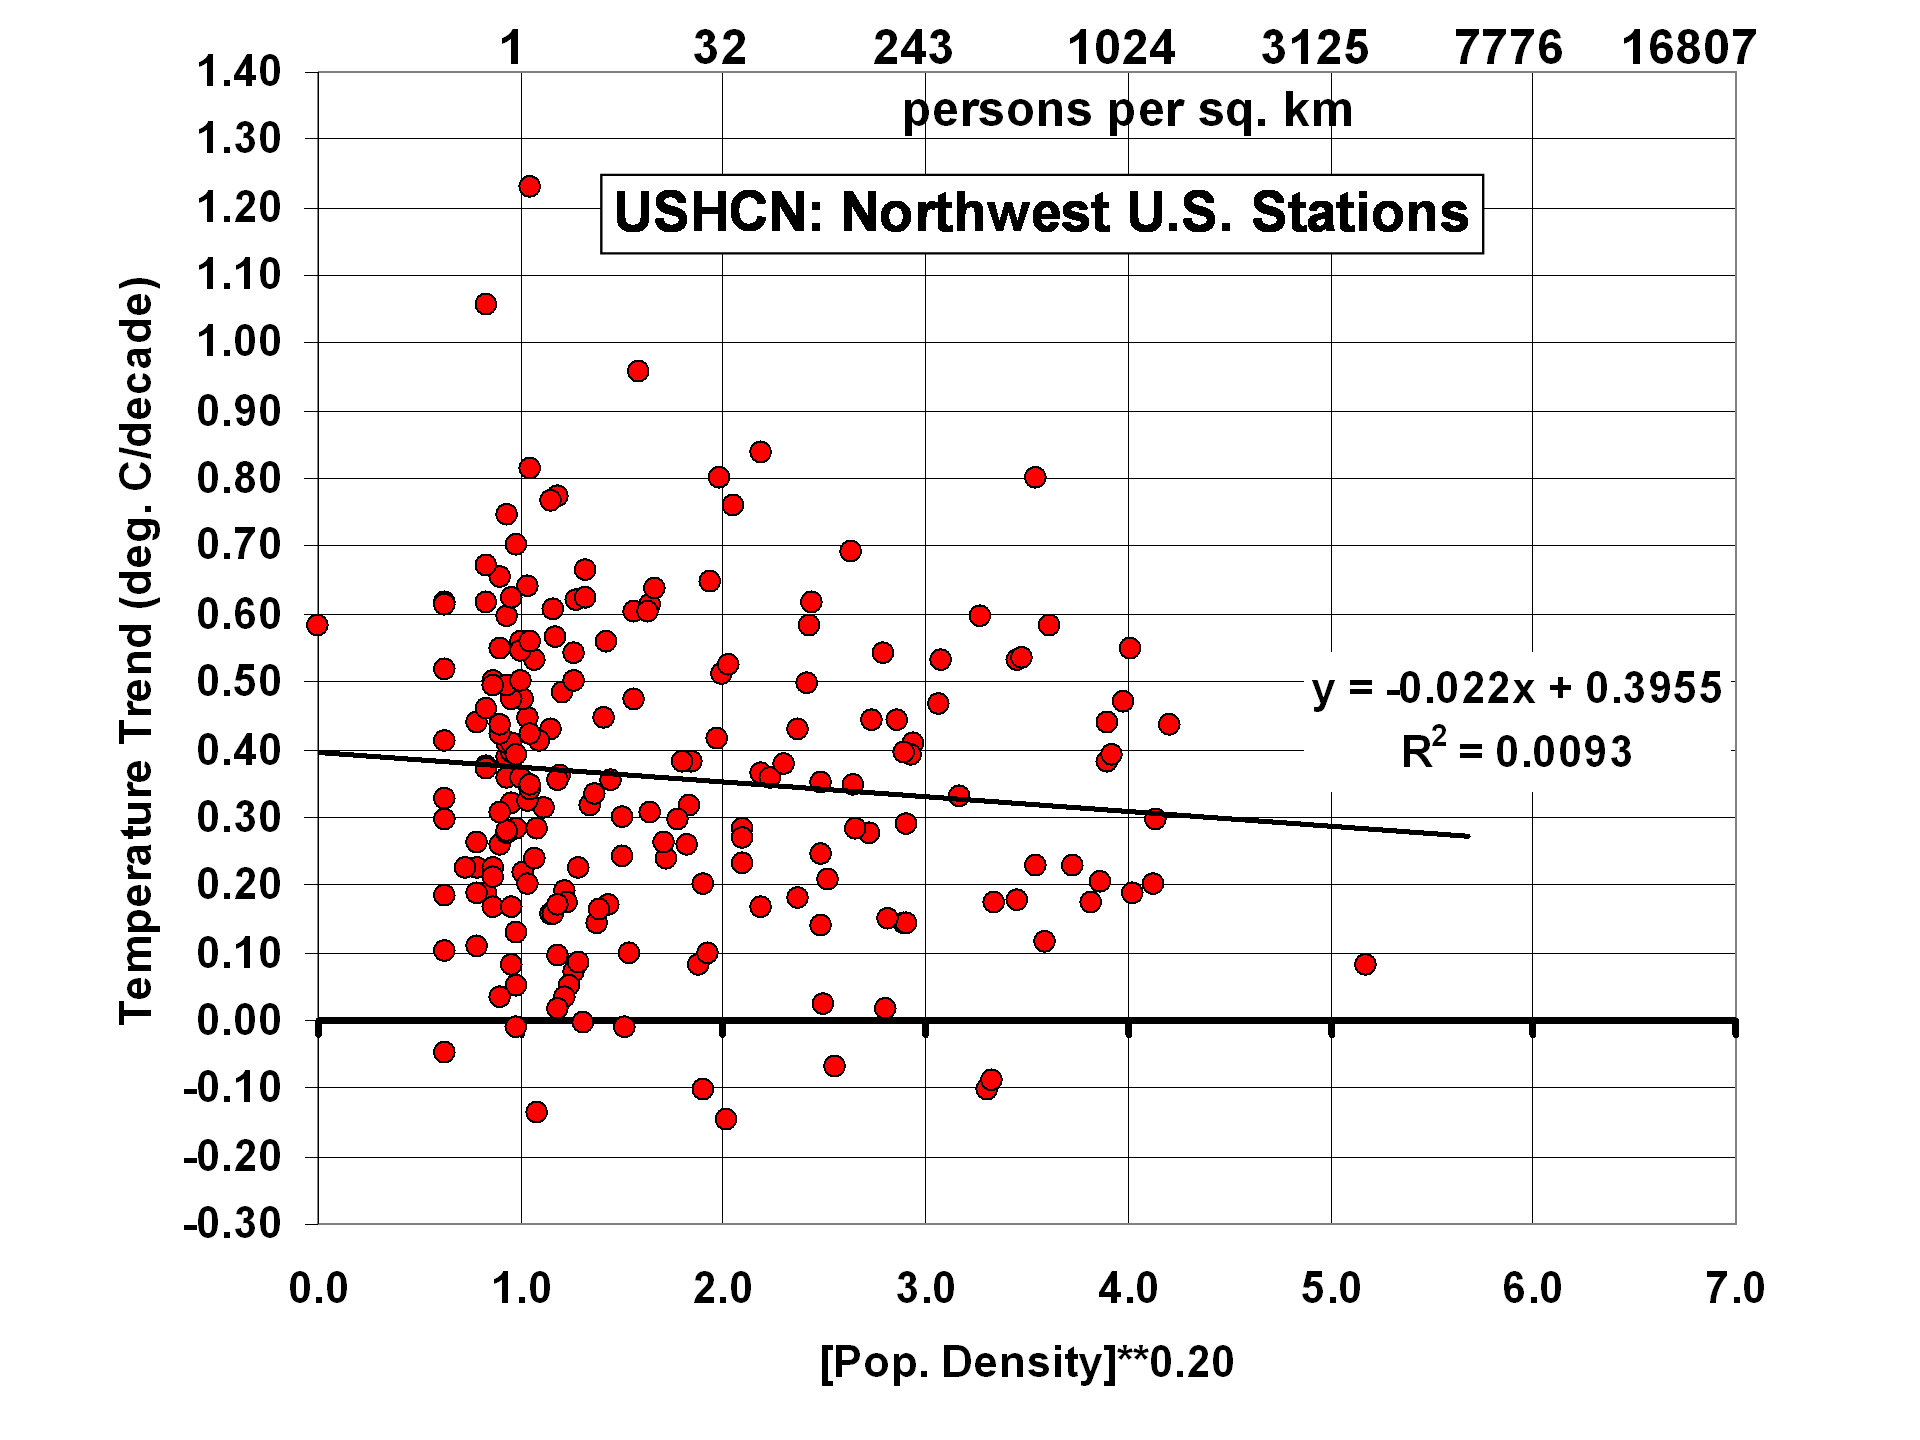
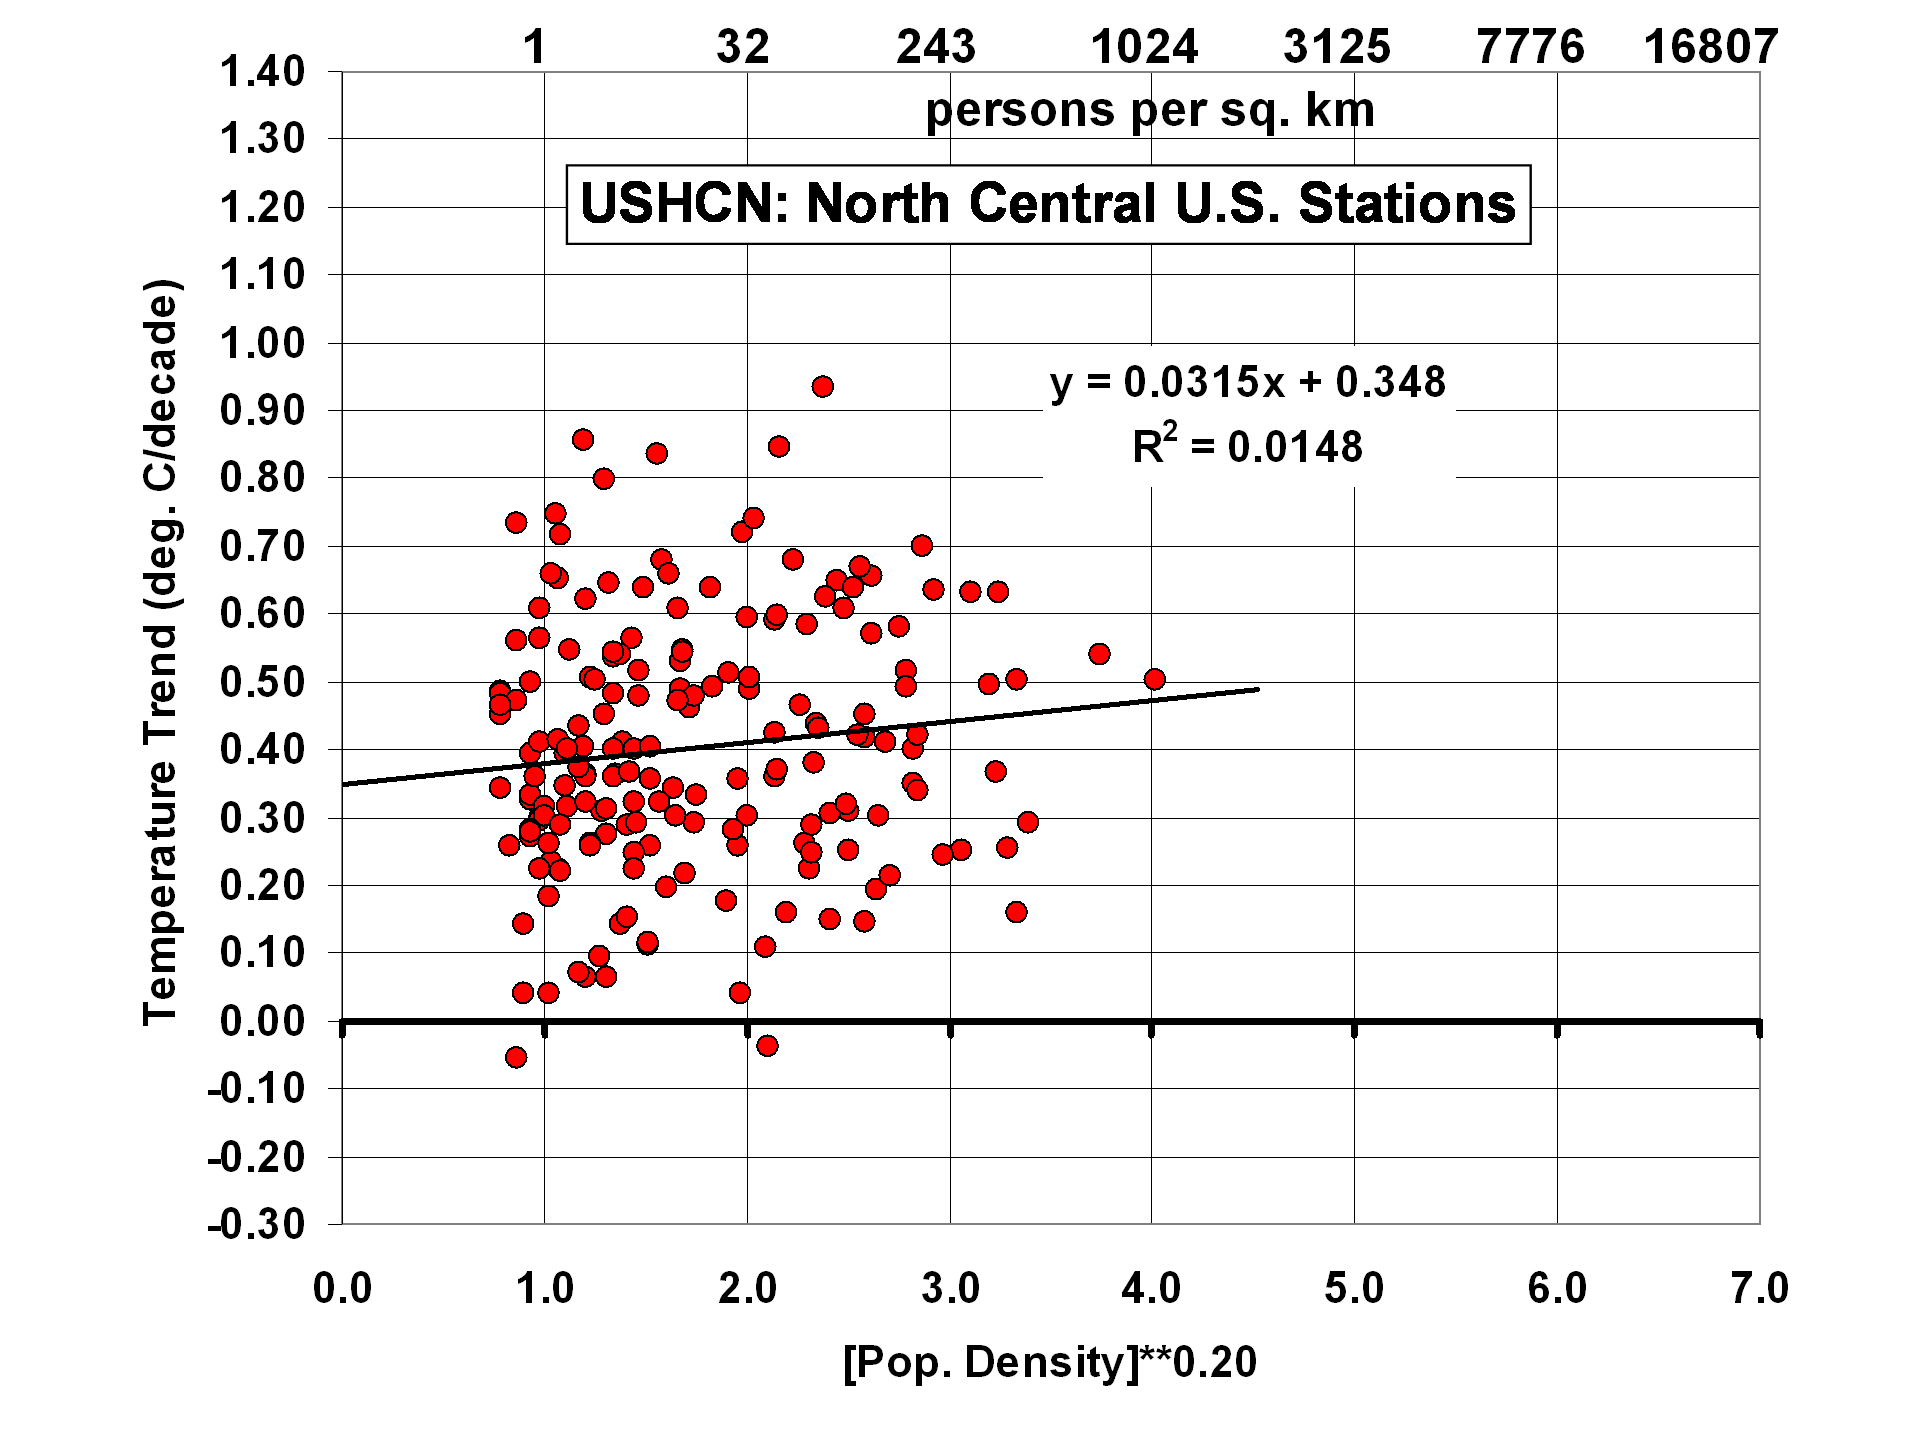
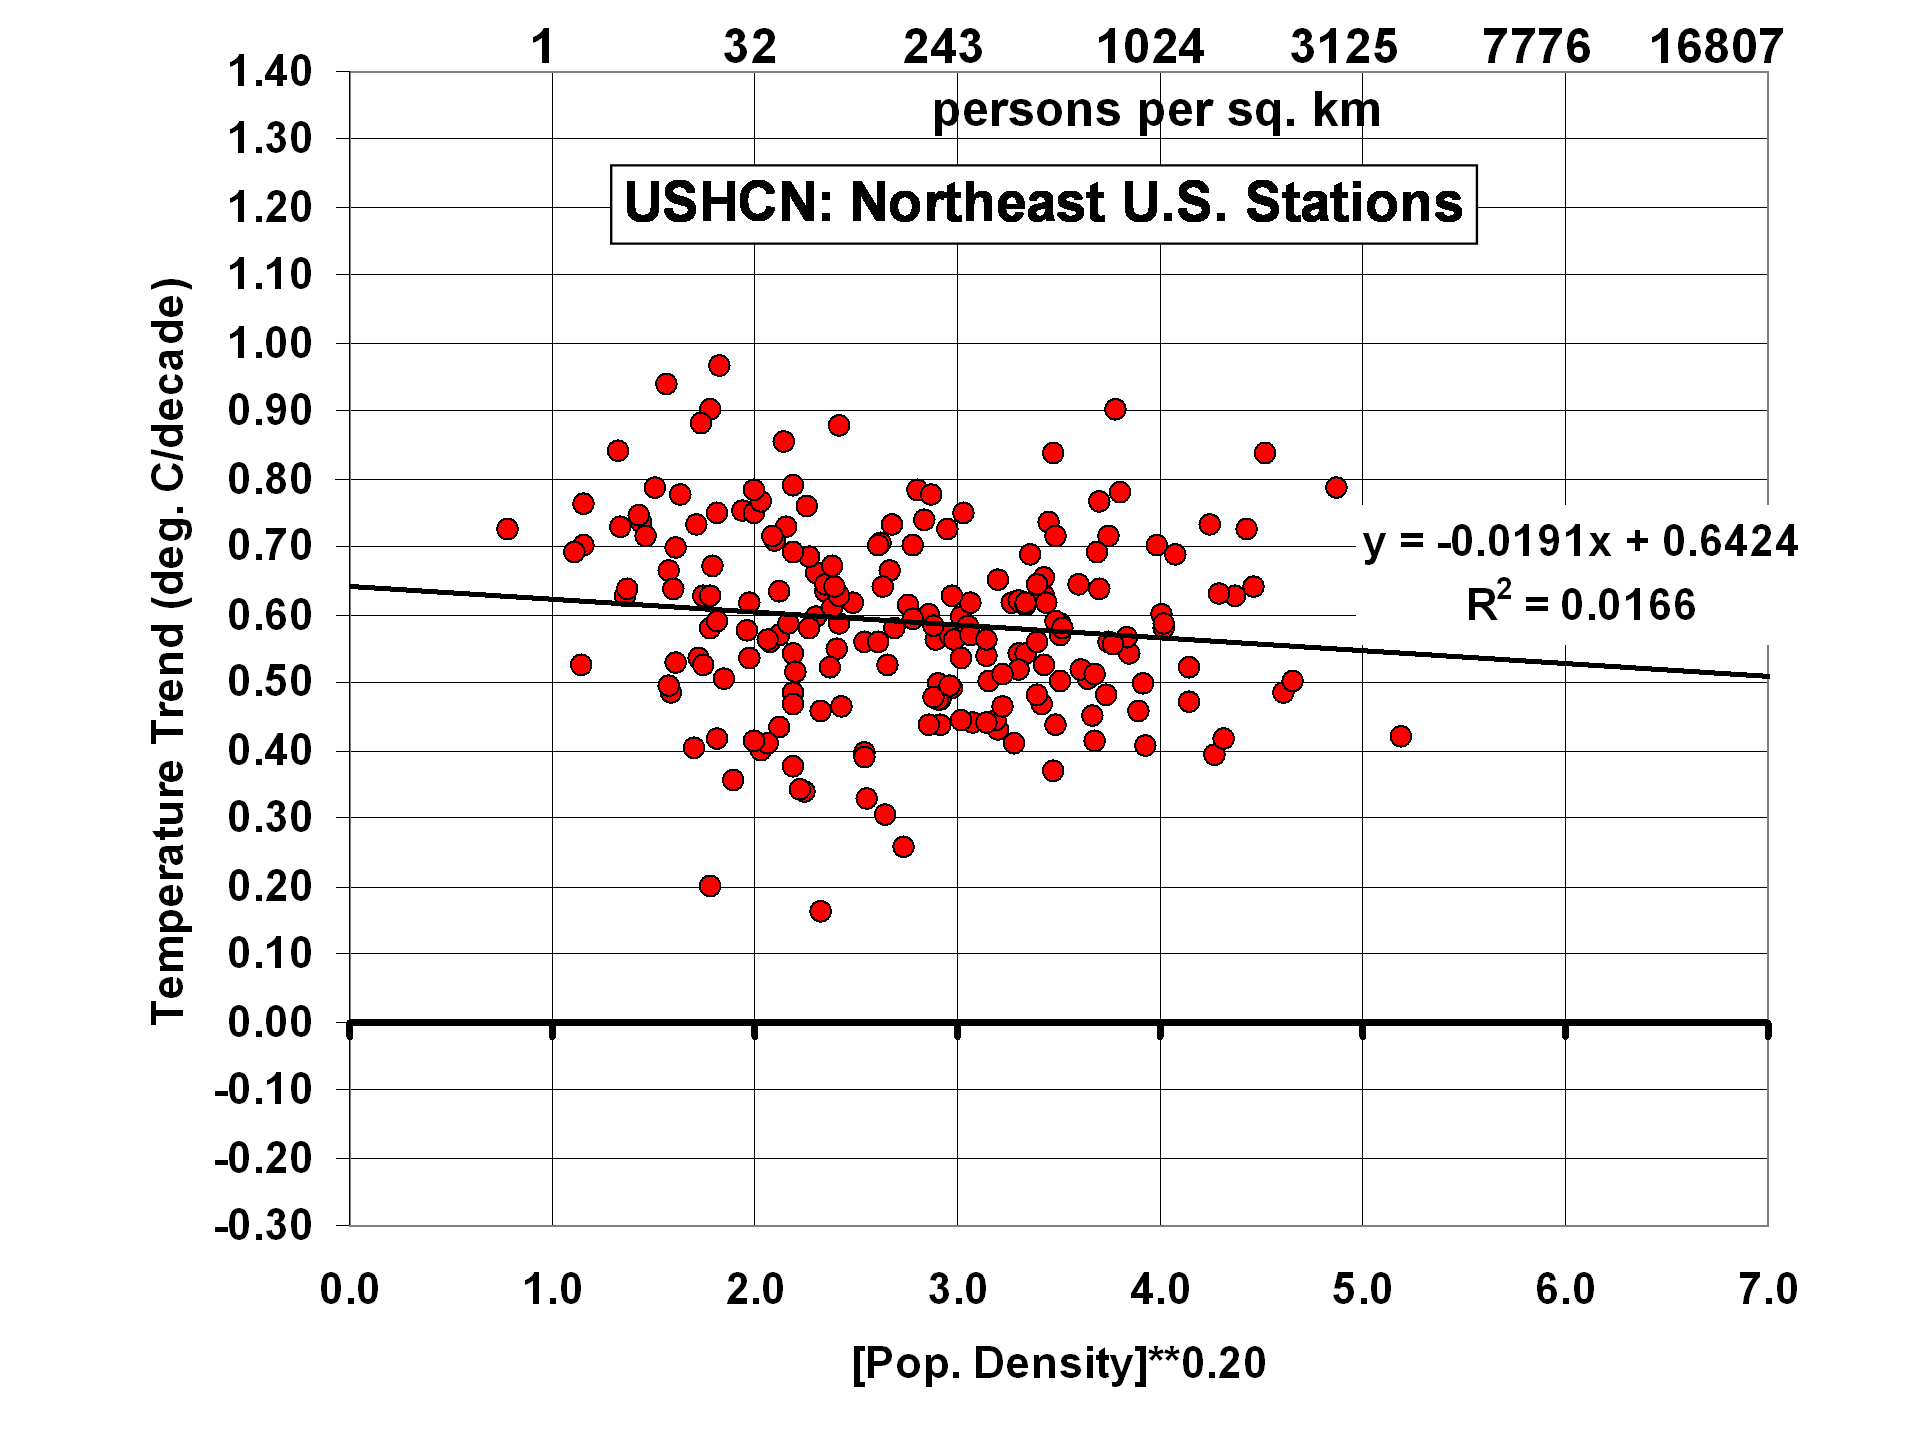
The results change somewhat, though, when the U.S. is divided into 6 subregions:


Of the 6 subregions, the 2 with the strongest residual effects are 1) the North-Central U.S., with a tendency for higher population stations to warm the most, and 2) the Southwest U.S., with a rather strong cooling effect with increasing population density. As I have previously noted, this could be the effect of people planting vegetation in a region which is naturally arid. One would think this effect would have been picked up by the USHCN homogenization procedure, but apparently not.

Trend Agreement Between Station Pairs

This is where I got quite a surprise. Since the USHCN data have gone through homogeneity adjustments with comparisons to neighboring stations, I fully expected the USHCN trends from neighboring stations to agree better than station trends from my population-adjusted ISH data.

I compared all station pairs within 200 km of each other to get an estimate of their level of agreement in temperature trends. The following 2 plots show the geographic distribution of the ~280 stations in my ISH dataset, and the ~1200 stations in the USHCN dataset:
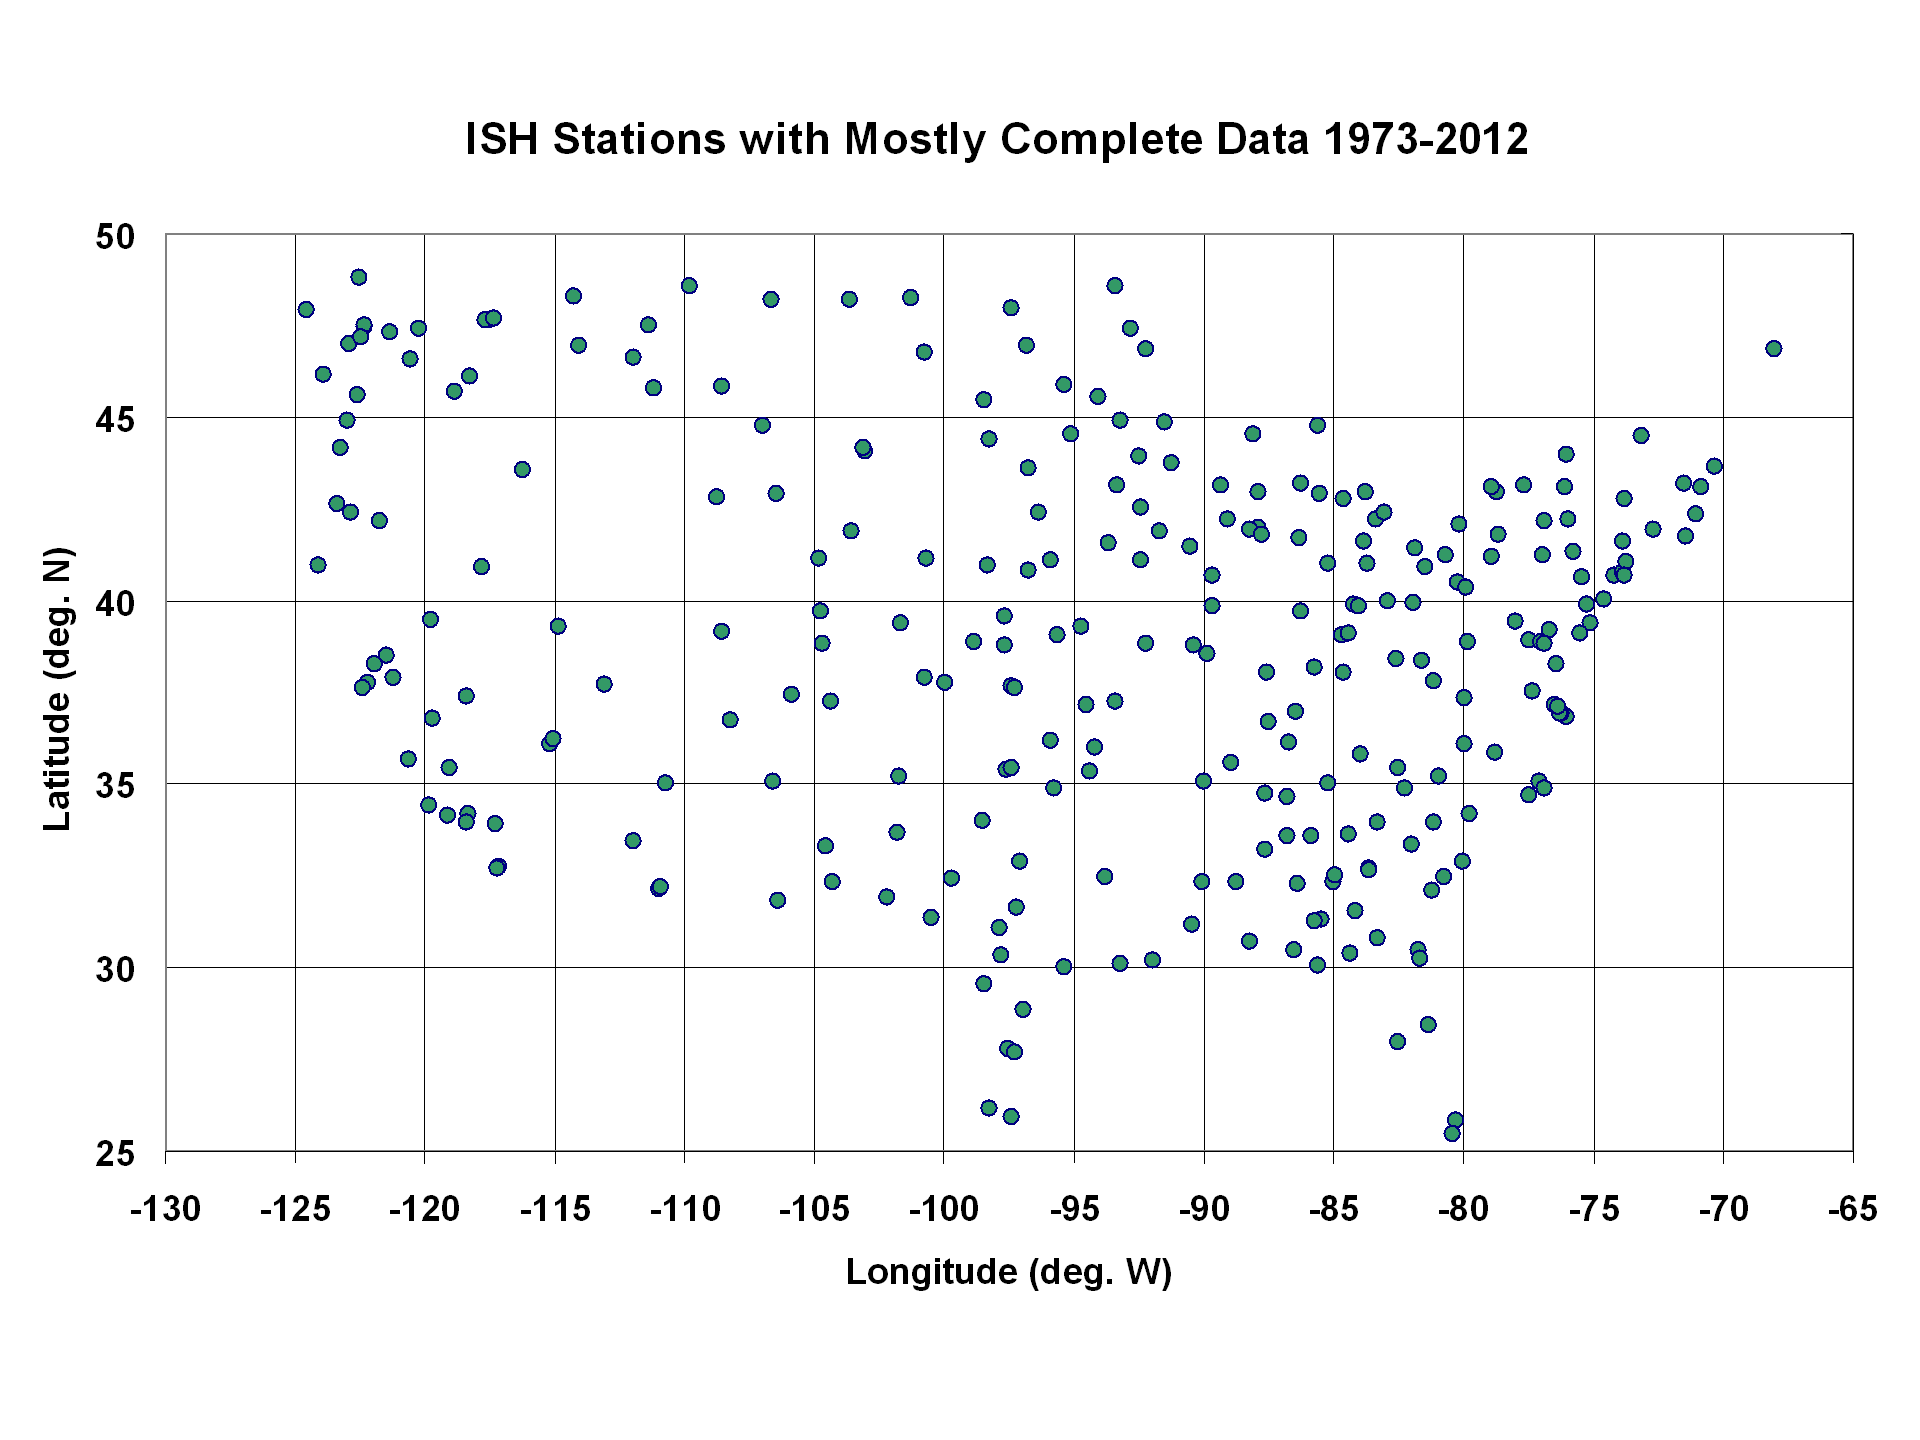
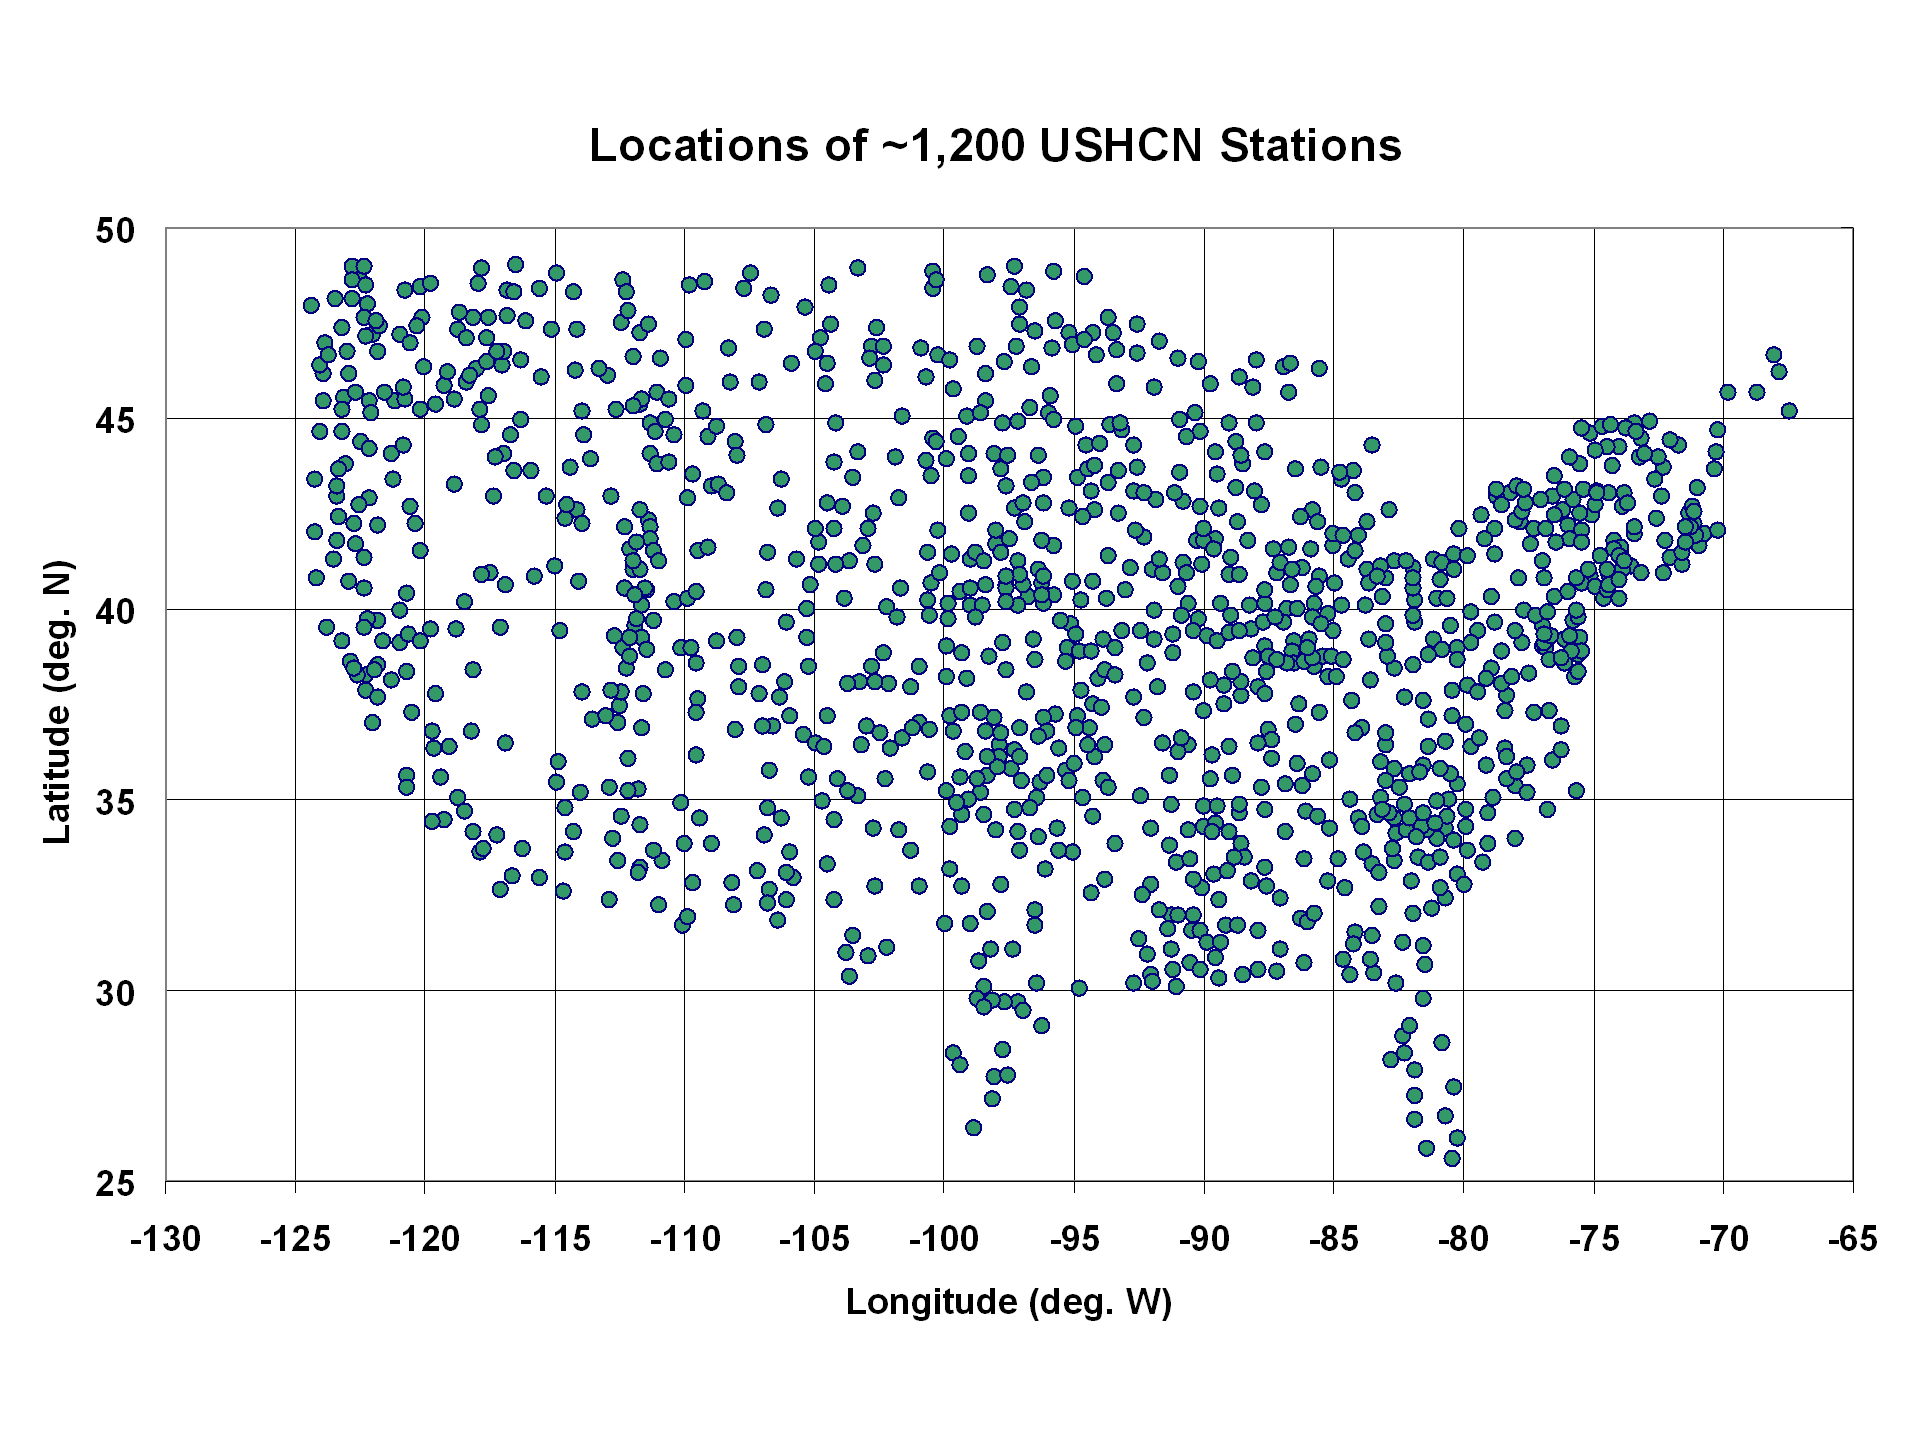
I took all station pairs within 200 km of each other in each of these datasets, and computed the average absolute difference in temperature trends for the 1973-2012 period across all pairs. The average station separation in the USHCN and ISH PDAT datasets were nearly identical: 133.2 km for the ISH dataset (643 pairs), and 132.4 km for the USHCN dataset (12,453 pairs).

But the ISH trend pairs had about 15% better agreement (avg. absolute trend difference of 0.143 C/decade) than did the USHCN trend pairs (avg. absolute trend difference of 0.167 C/decade).

Given the amount of work NOAA has put into the USHCN dataset to increase the agreement between neighboring stations, I don’t have an explanation for this result. I have to wonder whether their adjustment procedures added more spurious effects than they removed, at least as far as their impact on temperature trends goes.

And I must admit that those adjustments constituting virtually all of the warming signal in the last 40 years is disconcerting. When “global warming” only shows up after the data are adjusted, one can understand why so many people are suspicious of the adjustments.


70 Responses to “USHCN Surface Temperatures, 1973-2012: Dramatic Warming Adjustments, Noisy Trends”

Toggle Trackbacks

  1. just some guy says:

    Wouldn’t this analysis be better if you were able to use data for population density change or “flux”, instead of just population density?

  2. Kasuha says:

    “But the ISH trend pairs had about 15% better agreement (avg. absolute trend difference of 0.143 C/decade) than did the USHCN trend pairs (avg. absolute trend difference of 0.167 C/decade).”

    I can’t comment on quality of USHCN adjustment procedure but I believe it is not as successful in achieving similar trends because it is not based on adjusting trends of measured data.

    Imagine these measurements would run for several thousand years rather than 40 – you wouldn’t be able to do UHI adjustments by changing trends because all stations would produce almost exactly the same trend while urban areas would produce temperature shift (likely nonlinear, dependent on multiple factors including both base temperature and population density changes).

    • Kasuha says:

      USHCN definitely does not employ trend changes – their algorithm detects and corrects step changes in temperature measurements and they believe that accounts for both station changes and urbanization changes. I’m a bit skeptical about that, in my opinion many urbanization changes may result in steps smaller than the resolution of their adjustment procedure.
      It also doesn’t correct for urban effects already present at the time when the station was built.

      • …except that a step-change imposed upon the data WILL change the trend.

        • Kasuha says:

          Yes, but it is consequence of the adjustment, not means of the adjustment. The influence on the trend also depends not only on the step magnitude but also on the time when it appears, being biggest in the middle of the interval and decreasing to zero towards both ends.

          I can see there is also USHCN raw (unadjusted) available, it might be interesting to look at differences between USHCN adjusted and unadjusted and eventually to compare them with differences between your ISH adjusted and unadjusted.

          • Kasuha says:

            I managed to calculate average USHCN adjustment between 1973 and 2011 for 665 USHCN stations (all which had annual mean for both 1973 and 2011 in unadjusted series) and the average adjustment is +0.6°C. Adjustments range from -2.3 to +4.6 but 80% is between -1 and +2.
            And here I’d expect UHI adjustments to go negative rather than positive…

  3. Stephen Wilde says:

    Oh dear.

    I’ve been accepting that there was some tropospheric warming during the late 20th century.

    Is that now in doubt ?

    Mind you, my position has been that climate zone shifts and changes in the size and/or speed of the water cycle negate thermal effects from more GHGs and anything else apart from surface pressure and insolation at top of atmosphere.

    So perhaps there really is zero warming overall but instead higher temperatures in the mid and high latitudes only as a result of air flow from the equatorial regions passing across our surface sensors more often/for longer whilst energy is accelerated to space in order to maintain the overall equilibrium temperature.

    I must say that I am alarmed and surprised by the complexity and subjectivity apparently involved in the adjustment processes.

    There seems no way to verify whether the adjustments actually made result in a more accurate or less accurate temperature record.

    It looks like a bit of a mess with a high level of arbitrary and possibly agenda driven adjusting having gone on.

    • Philip Bradley says:

      Stephen,

      While the effects aerosols are complex, overall increasing aerosols should warm the low to mid troposphere. However, this tropospheric warming is a sign of climate cooling. This is because the net effect of aerosols is the opposite of GHGs. While GHGs impede the loss of heat from the Earth’s climate thus warming the climate. Aerosols impede the gain of heat from solar irradiance, thus cooling the climate.

      To see the aerosol effects you have to look at tropospheric temps on a regional basis, such as over India where the tropospheric warming and surface cooling can clearly be seen.

  4. D J Cotton   says:

    The foolowing is very relevant to surface temperatures …

    On Joseph Postma’s thread at tallbloke, Tim Folkerts said (my bold) …

    So if we see a collection of photons with “bites” in the CO2 bands (as is indeed seen from satellites), we can surmise that there is cool CO2 in front of a warmer material.

    He was citing a well known fact in spectroscopy that we only see evidence of absorption when the gas in front is cooler than the source of emission. As soon as the gas is warmed above the temperature of the emitter it ceases to absorb the radiation

    This is just like a region on the Earth’s surface which, if warmer than some region of the atmosphere, will also not absorb radiation from that cooler region. It does not reflect it either. The radiation undergoes what physicists are now starting to call pseudo scattering. It has to do this, because this is the natural process by which nature ensures that the Second Law of Thermodynamics (SLoT) is upheld when radiation goes from cold to hot bodies.

    This pseudo scattering (or what I have previously called resonant scattering) does in fact involve a resonating process and is thus quite different from reflection, even though, energy-wise the end result is the same. During the resonating process the energy from the electromagnetic radiation is used by the target instead of its own thermal energy. But such energy goes straight into new radiation (making up a part of the target’s S-B quota) which is identical to the incident radiation in both frequency and intensity, although scattered in direction. This is why it is called pseudo scattering because it looks just like diffuse reflection.

    The important thing is that the energy at no stage gets converted to thermal energy. If it did, then that thermal energy could transfer to some other body by conduction or other sensible heat transfer mechanisms, rather than only by identical radiation. So no thermal energy is deposited in the target (and the SLoT is not violated) but the target does cool more slowly because it didn’t have to convert some of its own energy in order to produce that portion of its radiation quota.

    There is no indication anywhere that the IPCC are aware of this process of which I’m sure Joseph Postma is, because it has been well explained by Prof Claes Johnson and others in internal correspondence to which I am a party. The IPCC energy diagrams clearly imply that the energy in backradiation is converted to thermal energy in the surface, but, as indeed was originally thought by the early physicists like Boltzmann and Planck, the IPCC think compensating radiation in the other direction somehow has a “net” effect. The only trouble is, the energy may not go the other way by radiation at all, and it doesn’t have to go anywhere immediately. What if it warmed a layer of water just below the surface? Well, it can’t, because no such radiation penetrates even a millimetre into water because it is scattered at the surface.

    The same thing actually happens to the low frequency radiation in your microwave oven. It is not absorbed at the atomic level in any target, even water. Instead is is scattered by the hydrogen and oxygen atoms (unlike sunlight) but it resonates with whole water molecules. This happens only within a certain narrow range of very low frequencies (in which each photon has very low energy) and it causes the water molecules to “snap” through 180 degrees in synch with each half wavelength passing by. This generates thermal energy by friction and so the process is nothing like the warming caused by the Sun. That is why most other matter is not warmed in a MW oven, unless it contains water molecules which can then get warmed themselves and transfer thermal energy by conduction.

    So, both spectroscopy and microwave ovens confirm what I have been saying this last year or so, that radiation from a cooler source (recognised by the shape of its Planck curve) does not transfer thermal energy to a warmer target.

    The effect that such radiation has on the rate of cooling of the warmer target depends on both the temperature of the source and the number of frequency bands within that radiation which can resonate. (This is explained in more detail in my paper.) If it does not have a full distribution under its Planck curve (but just a few spectral lines as for a specific gas) then it is very ineffective in that role of slowing radiative cooling. Of course other sensible heat transfers and evaporative cooling rates are not slowed, and do in fact speed up to compensate, resulting in no net slowing of the overall rate of cooling of the Earth’s surface.

  5. Alex Harvey says:

    Dear Dr. Spencer,

    Please publish these findings.

    Kind regards,
    Alex Harvey

  6. Philip Bradley says:

    The SW cooling trend with increasing urban density is likely an urban irrigation effect. Lower density = more gardens = more irrigation.

    Dr Christy found a +3C effect from irrigation in the Central Valley over the 20thC, so the size of the effect is substantially larger than claimed 20thC AGW warming.

  7. There are huge variations in temperature trends between stations in close proximity. For instance, in Ohio, temperature changes from the 1940’s to the 2000’s at USHCN sites vary from -1.1F to +1.3F. (These are based on USHCN adjusted figures, so extraneous factors should be excluded already).

    In theory US sites should be some of the best quality controlled sites in the world, yet I cannot see how we can claim to know temperatures to a tenth of a degree when this sort of variability exists.

    http://notalotofpeopleknowthat.wordpress.com/2012/04/09/ohio-temperature-trends/

  8. peter azlac says:

    Something for you to consider is the 45% warming bias that the Australian statistician Lowe found in the Australian temperatures series from average Tmax and Tmin rather than the three hourly values.
    http://gustofhotair.blogspot.com/2009/04/analysis-of-australian-temperature-part_16.html

    He found that “almost all of the warming occurred between 6am and noon” and that it is linked with cloud cover – see paper by Philip Bradley that discusses Lowes’ results:

    http://www.bishop-hill.net/blog/2011/11/4/australian-temperatures.html

  9. Quinn the Eskimo says:

    Edward R. Long made an analysis of adjustments made to NCDC rural and urban stations, available here: http://scienceandpublicpolicy.org/originals/temperature_trends.html

    He found in the US:

    Rural Raw: .13 C per century
    Rural Adjusted: .64 C per century

    Urban Raw: .79 C per century
    Urban Adjusted: .77 per Century

    “Thus, the adjustments to the data have increased the rural rate of
    increase by a factor of 5 and slightly decreased the urban rate, from that of the raw data.”

    This was discussed at http://wattsupwiththat.com/2010/02/26/a-new-paper-comparing-ncdc-rural-and-urban-us-surface-temperature-data/

    This may bear on both of the riddles you note above.

  10. Kramer says:

    What is the point of placing a thermometer at a location, recording what it says, and then going back and changing it’s data?

    This also reminds me of what James Lovelock once said about the ozone data:

    I have seen this happen before, of course. We should have been warned by the CFC/ozone affair because the corruption of science in that was so bad that something like 80% of the measurements being made during that time were either faked, or incompetently done.
    http://www.guardian.co.uk/environment/blog/2010/mar/29/james-lovelock/print

    (I’m still waiting for the MSM to investigate what Lovelock meant by this…)

  11. Curt says:

    I’ve long been intrigued by the TOBS adjustment in the USHCN record, and have spent a good amount of time looking into it. It seems to stem from the fact that for many of the rural stations, the time of observation for the stations was moved from late afternoon to early morning late in the 20th century.

    For these “max/min” stations, early morning observation, with the accompanying resetting of the maximum and minimum recorders so the next 24 hours’ extremes can be caught, is problematic, because it is very near the typical daily minimum time. If the next morning’s minimum is higher, that morning’s reading could actually be from the present morning.

    This is the fundamental reason for the TOBS adjustment. A great deal of research has gone into looking a temperature patterns in different parts of the US and coming up with adjustment magnitudes as a function of location in the US and the time of year (see for example Karl’s 1979 paper).

    BUT, all of this analysis appears to contain the implicit assumption that the observers, virtually all of whom are enthusiastic “weather geeks”, would be unaware of the problem and not take a simple step — resetting the minimum recorder later in the day — to eliminate the issue. As outspoken climate blogger Steven Goddard or real-science.com, who has done this kind of monitoring, puts it, “Do they think we’re morons?” He said it took him about two days to figure out he needed to do the later reset.

    Anyway, it seems it would be quite easy to test whether observers are doing this additional reset or not. With access to the raw USHCN data from these sites and metadata as to when the TOBS changed from afternoon to morning, it should be possible to compare the number of repeated low readings on consecutive mornings on both sides of the change. More formally, statistics such as “lag-1 autocorrelation” could be checked to see if the data has the pattern that was assumed to justify the correction.

    • Philip Bradley says:

      The real problem with the TOB adjustment is that its size is based on an estimation method Karl came up with. Even though the original paper records still exist for many, if not most stations and the real TOB can be determined from these records which contain Time of Observation. I assume this wasn’t done originally as a cost saving measure. And in climate science they never go and correct mistakes.

      • Philip Bradley says:

        That last sentence should read,

        I assume this was done originally as a cost saving measure. And in climate science they never go back and correct mistakes.

        • Curt says:

          I’m not understanding your point. The records we have from these stations each day are simply comprised of the readings of the minimum and maximum markers at the observation time. The fear for early morning observations is that the minimum marker might show the previous morning’s low if that was lower than the present morning’s low. With only this data, any adjustment would have to be a statistically based estimate.

          My point is that there is at least anecdotal evidence that many observers do not let this happen, and this should be easy to test.

          • Philip Bradley says:

            The TOB bias results from the actual time of observation changing. As automated temp recorders were introduced TOB progressively moved to a standard time.

            What Karl did, as I recall, is look at how min and max temperatures changed over time and estimated how much TOB had changed on average, then produced an algorithm to adjust temperatures to reflect the estimated average change in TOB. Despite the fact actual TOB was recorded for every observation.

            A method based on the recorded TOB would make the TOB adjustment for each site specific to that site and presumably more accurate than the current blanket adjustment.

            Thats my recollection.

  12. DocMartyn says:

    Well finally someone has identified the cause of man-made global warming.

  13. Tilo Reber says:

    Your horizontal scale year markers should probably be moved one year to the right Roy.

  14. Tilo Reber says:

    Kasuha: “I’m a bit skeptical about that, in my opinion many urbanization changes may result in steps smaller than the resolution of their adjustment procedure.”

    Urbanization wouldn’t produce steps at all. It would only be recognized in the trend. And if you homogenize the trend, then you only distribute the urbanization effect. You do not remove it. And if you do not accout for urbanization that has happened prior to station placement, then you again fail to account for it properly. For example, if I have a record that goes from 1900 to 2012, and if I then include stations along the way at times between those dates, then any UHI effect those stations have at the time of inclusion will change the trend of that record due to that unaccounted for initial UHI effect.

    So, if what you say is true, Kasuha, then USHCN simply doesn’t account for any of the UHI.

  15. P. Solar says:

    Dr Spencer, this is very interesting.

    Looking at your second figure, USDHCN and CRU seem to basically agree until 1997 when it appears that CRU applied a kludge “correction”. Presumably realising there was a problem with the rise and making a rather crude correction.

    All was fine until 2001 when they appear to have got worried that there was no warming and poked a 0.2K rise back in. This seems to have no relation to the underlying data. Then again in 2004 and finally in 2010.

    I have no idea how they justify or even whether they document these changes in detail in the literature, but there seems to be a very artificial attempt to get these global records to agree with each other after this initial (UHI?) adjustment. Since CRU have notoriously refused to let anyone have their unprocessed data and reproducibility is steadfastly made impossible, we can only dismiss their results as an unverifiable curiosity, not science.

    It seems clear that without these step adjustments CRU would essentially be as flat as USHCN since 1999.

    Both are falling since 2010.

    As for the scatter plots, I am , as you know, very uncomfortable with this inappropriate use least squares regression, a technique that only gives valid results when there is negligible errors in the x-coordinate. The derivation of the result depends on this being the case and I’m sure you’d agree that there is pretty huge uncertainly in the population data.

    There may be more justification for plotting other way around.

    As a minimum you should do the regression in both directions and regard the two slopes as bounding the likely result. We have already discussed this in some detail and you recognise the issues.

    It is a little disappointing that you are still propagating the use of this flawed method rather than refuting its use.

    It is worth noting that much of Dessler’s work resulting in unrealistic values of climate sensitivity were precisely because he was also using this flawed technique to fit the slope.

    You would have faired much better in challenging his work if you had looked at how this issue affected his results.

    Best regards.

  16. P. Solar says:

    Roy Spencer says: When “global warming” only shows up after the data are adjusted, one can understand why so many people are suspicious of the adjustments.

    Indeed. As I noted over at WUWT there is very little sea level rise in the tidal gauge data. Most of it seems to have its origins in the processing.

    http://wattsupwiththat.com/2012/04/12/envisats-satellite-failure-launches-mysteries/#comment-955459

    This post over at JudithCurry.com also shows Hadley SST processing removes most of the variation from the earlier 2/3 of the icoads data, making the late 20th c. rise *appear* “unprecidented”.

    http://judithcurry.com/2012/03/15/on-the-adjustments-to-the-hadsst3-data-set-2/

    The continual upwards adjustments of any metric that relates to climate is becoming endemic.

  17. Philip Bradley says:

    I would be interested to hear opinions from others who have analyzed these data which of the adjustments NOAA performs could have caused the large relative warming in the USHCN data during 1995-97:

    I suspect what happened is that CRUTemp3 reflects the 1995/7 SE Asia smog cooling that extended well into the eastern Pacific, while ISH doesn’t, presumably due to coverage.

  18. One thing I found when I ran the same sort of correlations (the series is reported by state over a couple of years at Bit Tooth Energy – the individual state analyses are listed on the RHS of the blog and finished at the end of last year) is that with the adjustment that was made after the TOBS adjustment (which I admit I just took on faith) still showed an adjusted temperature increase for many of the states as a result of that subsequent adjustment. (There were only a very few states where this did not hold true).

    But looking at the r^2 values for latitude and elevation (which I checked along with local population) the correlations seemed to be reduced after the adjustments. Since the average elevation of the stations was also, in most states, below the average elevation of the state, and the larger population centers also tend to lie in lower elevations I believe that all three factors (elevation, latitude and population) have to be factored into the analysis. I just haven’t got around to it.

  19. Nick Stokes says:

    Dr Roy,
    “And I must admit that those adjustments constituting virtually all of the warming signal in the last 40 years is disconcerting. When “global warming” only shows up after the data are adjusted, one can understand why so many people are suspicious of the adjustments.”

    As Tamino has noted, your own USA48 satellite measure gets shows a trend from 1979 of 0.22°C/decade, very similar to the USHCN trend. Is this an adjustment artefact?

    • phi says:

      US station data appear to be an exception. It could be that for one reason or another, thermometers are less disturbed in the US than elsewhere (?). The differences in temperature trends between US and other parts of the globe could also be smaller than what is usually supposed. UAH TLT: 1979-2011 0.23 per decade for the continents of the Northern Hemisphere and 0.22 ° C per decade 1979 to March 2012 for US.

      And for land in general:
      http://img215.imageshack.us/img215/5149/plusuah.png
      There is a serious divergence.

    • Eric Barnes says:

      Interesting choice of year Nick. Why not pick 1980? It was even colder than 1979. Or is there some level even you won’t stoop to?

  20. phi says:

    We should add that Tamino may take argument of TLT to criticize Dr. Spencer’s statements but then he must also be able to explain the divergence TLT-surface for global land. If he does not, his argument is worthless.

  21. barry says:

    I’m curious, too, about the UAH satellite-derived data for the USA. Clearly these data are not affected by urban heat islands, and yet the trend is much closer to USHCN and CRUtem than Dr Spencer’s population density adjusted trend.

    Dr Spencer?

  22. john parsons says:

    Nice try Phi, but the same question is being asked ( and left unanswered ) all over the blogoshere. It appears that skeptic bloggers walked right off the cliff with Dr. Spencer. JP

  23. Brian D says:

    Dr. Spencer, now that you have an idea on the correction needed at certain pop. densities, shouldn’t you now apply that at the start of the record instead of zero? UHI warming was affecting the record then too. This would negate a flat trend, but might give a more realistic warming trend. And you need to use older census records to start so you can make proper corrections to start and as the increases or decreases come to play in the populations through the record.

    It would be interesting to see the affect on individual stations from the start of the record and how that record would look as pops have steadily grown over time. I’m sure that’s huge task, but just some examples.

  24. John@EF says:

    Dr. Spencer, Is there a reason you won’t even attempt to square-the-circle between your claims here and your UAH satellite data? … that is, other than there’s no way to do so.

  25. B.Kindseth says:

    Dr. Spencer,
    You said, “2) Virtually all of the USHCN warming since 1973 appears to be the result of adjustments NOAA has made to the data, mainly in the 1995-97 timeframe.”
    I had thought that you had broken this out by the type of adjustment, ie, homogenization, TOD, UHI, etc, but I can’t find the posting. Do you have this information? I thought that it would look on a pie chart.
    Thank you.

  26. Charlie says:

    Surely what is needed is to examine the changes which happen to the land surrounding a weather station? Would it be worth undertaking experiments to see what variations in structures within 25 -50m of weather station have impacts? If a weather station in a field suddenly has a 6 lane highway built next to to it of a gas station, diner and large parking lot, this may be more important than population density.

    How many weather stations have accurate records of the surrounding land use since they were installed?In any engineering field, equipment has to be calibrated according to the required specification and all records kept. By NOT keeping accurate records of all the changes which could influence a weather station, we using non calibrated equipment with no records. As all equipment has drift how sure can we be of the results? Anyone who maintains equipment has to undertake the work according to specifications and all raw data has to be kept for examination.

    Who would fly in aircraft built and maintained by those who manage our temperature records?

  27. I truly enjoy looking through on this internet site, it holds superb posts.

  28. I truly enjoy looking through on this internet site, it holds superb posts.

  29. Who would fly in aircraft built and maintained by those who manage our temperature records?

  30. I truly enjoy looking through on this internet site, it holds superb posts.

  31. I truly enjoy looking through on this internet site, it holds superb posts.

  32. Kirks Custom says:

    Interesting choice of year Nick.

  33. I love this article!

  34. Digital Sign says:

    nice! great post!

  35. what an awesome post!

  36. knockout post! awesome!

  37. what a beast. thank you !

  38. Would love to see more posts from this site.

  39. website says:

    Thanks for sharing this great article.

  40. Thank you for sharing this.

  41. I really find this fascinating – it may not seam to affect our normal lives but it does in a roundabout way.

  42. This could be the effect of people planting vegetation in a region which is naturally arid. One would think this effect would have been picked up by the USHCN homogenization procedure, but apparently not.

  43. Wonderful illustrated information. I thank you about that. No doubt it will be very useful for my future projects. Would like to see some other posts on the same subject!

  44. Click here says:

    I have to wonder whether their adjustment procedures added more spurious effects than they removed, at least as far as their impact on temperature trends goes.

  45. I have no idea how they justify or even whether they document these changes in detail in the literature, but there seems to be a very artificial attempt to get these global records to agree with each other after this initial (UHI?) adjustment.

  46. Andrew Scott says:

    Now I understand the reason behind this. Thank you for discussing this.

  47. Jesika Parker says:

    I didnt have any expectations concerning that title, but the more I was astonished. The author did a great job. I spent a few minutes reading and checking the facts. Everything is very clear and understandable. I like posts that fill in your knowledge gaps. This one is of the sort.

  48. click here says:

    Glad to check this great site. Nice work!

  49. about us says:

    The 2nd of these is supposed to identify and adjust for changes in instrumentation type

  50. info says:

    Glad to check this one. Keep on posting.

  51. What an informative post this is. Thanks for sharing.

  52. Good author! I’ll save this.

  53. The effect that such radiation has on the rate of cooling of the warmer target depends on both the temperature of the source and the number of frequency bands within that radiation which can resonate.

  54. monicabing422 says:

    We also see in the above plot that the adjustments made in the CRUTem3 and USHCN datasets are quite different after about 1996, although they converge to about the same answer toward the end of the record. Mold removal company near me

  55. If a weather station in a field suddenly has a 6 lane highway built next to it with a gas station, diner and large parking lot, this may be more important than population density.

Leave a Reply to Tilo Reber