June 2012 U.S. Temperatures: Not That Remarkable

July 6th, 2012 by Roy W. Spencer, Ph. D.

I know that many journalists who lived through the recent heat wave in the East think the event somehow validates global warming theory, but I’m sorry: It’s summer. Heat waves happen. Sure, many high temperature records were broken, but records are always being broken.

And the strong thunderstorms that caused widespread power outages? Ditto.

Regarding the “thousands” of broken records, there are not that many high-quality weather observing stations that (1) operated since the record warm years in the 1930s, and (2) have not been influenced by urban heat island effects, so it’s not at all obvious that the heat wave was unprecedented. Even if it was the worst in the last century for the Eastern U.S. (before which we can’t really say anything), there is no way to know if it was mostly human-caused or natural, anyway.

“But, Roy, the heat wave is consistent with climate model predictions!”. Yeah, well, it’s also consistent with natural weather variability. So, take your pick.

For the whole U.S. in June, average temperatures were not that remarkable. Here are the last 40 years from my population-adjusted surface temperature dataset, and NOAA’s USHCN (v2) dataset (both based upon 5 deg lat/lon grid averages; click for large version):
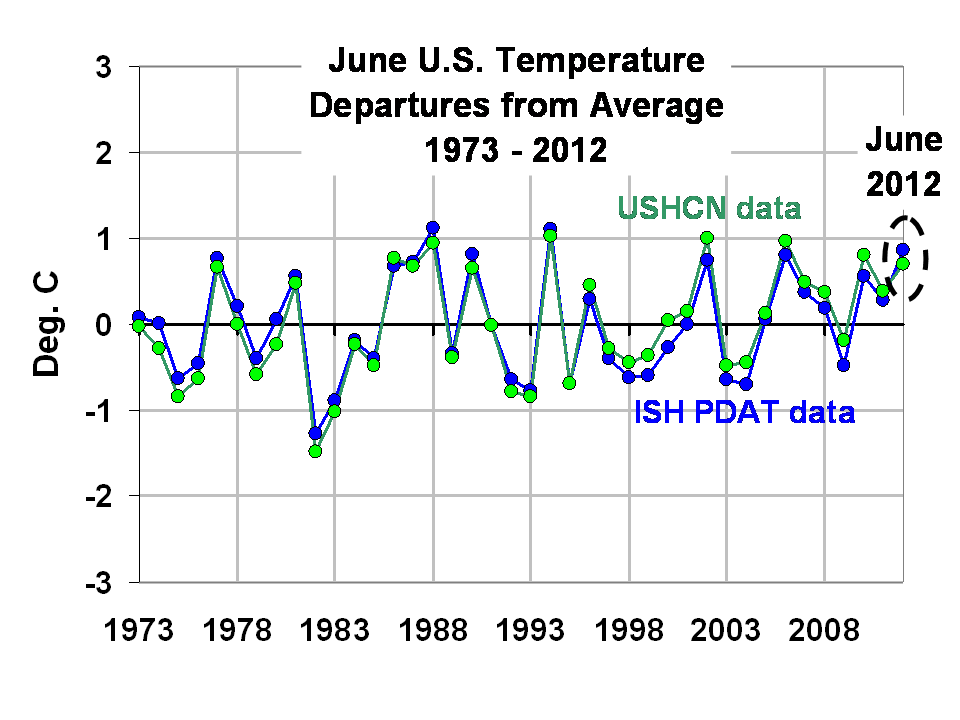
Certainly the U.S drought conditions cannot compare to the 1930s.

I really tire of the media frenzy which occurs when disaster strikes…I’ve stopped answering media inquiries. Mother Nature is dangerous, folks. And with the internet and cell phones, now every time there is a severe weather event, everyone in the world knows about it within the hour. In the 1800s, it might be months before one part of the country found out about disaster in another part of the country. Sheesh.


55 Responses to “June 2012 U.S. Temperatures: Not That Remarkable”

Toggle Trackbacks

  1. mike maguire says:

    The drought of 2012 is certainly impressive, especially
    when one takes note of the area effected.

    The US Cornbelt, which has the most fertile, high yielding farmland on the planet is being effected in widespread fashion with severe drought to an extent that hasn’t been seen since………..1988.

    Until 1988, this area had averaged a widespread drought around every 12 years or so(averages, being what they are only take the number of years and divide the number of droughts in to that).

    Plenty of local and even regional droughts between 1988 and 2012 but the US Cornbelt had gone a record number(23) of growing seasons without a severe drought that effected an area this large.

    Over the last several years, I’d been saying 2 things are inevitable.

    1. The next widespread severe drought for the Cornbelt.

    2. Global Warming getting the blame

    Let’s see if you can pick which one of these is climate and which one is weather.
    a) A year with widespread drought
    b) 2+ decades without widespread drought

    These are the periods of the worst US droughts for such a large, key crop growing area (that lasted for more than just 1 year?)

    1. The Dust Bowl years in the 1930’s
    2. In the 1950’s there were numerous widespread droughts
    3. The 1980’s had several droughts(1983 and 1988=Cornbelt)

    The 1990’s and 2000’s had what surely has been the most favorable growing weather of the last century.

    Makes this severe drought seem that much worse.

  2. If I didn’t know any better, I’d say that communications technology causes extreme weather.
    Thanks, Dr. Spencer, please keep up the good work.

  3. Andrew says:

    Roy, I realize this is asking a lot, but would it be possible to for you to analyze your surface temperature product for the US at a daily scale to determine whether warming is concentrated in the coldest days of the year as found by this paper?

    Knappenberger, P.C., P.J. Michaels, and R.E. Davis, 2001. Nature of Observed Temperature Changes Across the United States during the 20th Century. Climate Research, 17, 45–53.

    This involves sorting days within the year by absolute temperature and then computing trends for the day-rank. I did such an analysis with reanalysis data averaged over US:

    http://devoidofnulls.wordpress.com/2011/08/05/the-truth-about-extreme-average-temperatures-in-the-us-region/

    Of course, I do realize that your data begins around the time of some of the coldest winters in US climate history (pre-history is another matter!) so in some sense a stronger cold day warming over this period might be expected. Still, it would be an indication that overall, temperatures in the US have gotten less extreme during the period when warming is allegedly only explained by anthropogenic forcing.

  4. RW says:

    Roy, excellent. I’m tiring of it too.

  5. Thomas says:

    What result do you get if you instead use your MSU data for continental USA?

  6. Jean-Charles Jacquemin says:

    Thanks Dr Spencer.

  7. David Appell says:

    The USA48 lower troposphere as measured by UAH is on the verge of setting a record for the warmest 12 months, since the records began in Dec 1978.

    Over that time period the USA48 linear trend is 0.23 +/- 0.08 C/decade (95% confidence level; no autocorrelation factored in), for a total warming of 0.77 C (1.4 F).

    What is the expected value for USA48 “natural variability” over a 33 year period?

    The continental US has gotten significantly warmer is just 3+ decades. People are naturally going to wonder if that has come in part from an enhanced greenhouse effect, and what it means for the weather….

  8. excellent and so correct.

  9. salvatore del prete says:

    July 7, 2012 at 7:46 AM

    Met Office – No warming in the past 15 years

    We could even be headed for a Dalton or Maunder-type minimum, the coldest part of the Little Ice Age.

    “The supposed ‘consensus’ on man-made global warming is facing an inconvenient challenge after the release of new temperature data showing the planet has not warmed for the past 15 years,” says this article in the Daily Mail.

    “The figures suggest that we could even be heading for a mini ice age to rival the 70-year temperature drop that saw frost fairs held on the Thames in the 17th Century.”

    “Based on readings from more than 30,000 measuring stations, the data was issued last week without fanfare by the Met Office and the University of East Anglia Climatic Research Unit (of Climategate fame). It confirms that the rising trend in world temperatures ended in 1997.”

    Read that again. “Based on readings from more than 30,000 measuring stations, the data … confirms that the rising trend in world temperatures ended in 1997.”

    Not only has the warming trend ended, it looks like we could now be headed in the other direction.

    According to leading climate scientists, “after emitting unusually high levels of energy throughout the 20th Century, the sun is now heading towards a ‘grand minimum’… threatening cold summers, bitter winters and a shortening of the season available for growing food.”

    “There is a 92 per cent chance that both Cycle 25 and those taking place in the following decades will be as weak as, or weaker than, the ‘Dalton minimum’ of 1790 to 1830,” said a paper issued last week by the Met Office. “In this period, named after the meteorologist John Dalton, average temperatures in parts of Europe fell by 2C.”

    “However, it is also possible that the new solar energy slump could be as deep as the ‘Maunder minimum’… in the coldest part of the ‘Little Ice Age’ when, as well as the Thames frost fairs, the canals of Holland froze solid.”

    “Meanwhile, since the end of last year, world temperatures have fallen by more than half a degree, as the cold ‘La Nina’ effect has re-emerged in the South Pacific.”

    http://www.dailymail.co.uk/sciencetech/article-2093264/Forget-global-warming–Cycle-25-need-worry-NASA-scientists-right-Thames-freezing-again.html

    Thanks to William Dugan for this link

    Here’s a link to a University of Reading press release concerning this (the Maunder Minimum part):
    http://www.reading.ac.uk/news-and-events/releases/PR428852.aspx

    The press release includes a link to the Journal of Geophysical Research paper: http://www.agu.org/pubs/crossref/pip/2011JD017013.shtml

    ——————————————————————————–

    I originally posted an article about this on January 30, 2012. With the current heat wave in parts of the United States, and the mainstream media screaming ‘global warming,’ I thought it worthwhile to bring it up again.

    http://iceagenow.info/2012/01/headed-mini-ice-age/

  10. David Appell says:

    To first order, the change in the global average temperature, due to a change in the solar constant, is

    dT/T = (1/4)(dS/S)

    You can get daily values of S from LASP, here:
    http://lasp.colorado.edu/sorce/tsi_data/daily/sorce_tsi_L3_c24h_latest.txt

    The smoothed value of S has actually increased since the last solar minimum, about 0.7 W/m2 since 2009.

    Given all this — especially the top equation — why should I expect any cooling due to a change in the Sun’s luminosity?

  11. I say since 1850, when the DALTON MINIMUM ended, thru present,the variations in climate have been due to ENSO,AO/NAO, PDO/AMO etc etc, against a background of higher solar activity since 1850. All changes however, in the same climatic regime.

    The rise in temperature since 1850 to present of .5c, can be shown to be linked to the higher solar activity from 1850-2005.

    If it were associated with CO2 ,one would think the temperature rise would not have started way back in 1850,and it would have been steady ,with no periods of declines.

    Not to mention the MIDAEVAL warm period , again associated with strong solar activity, way back around 1200 AD.

    Since 2005, the decline in solar activity is going to evenually exert enough positive feedbacks to the climate system,directly and indirectly, to put it into a lower temperature range. Anotherwords a different climate regime,which will bring us back to a range similar to the Dalton Minimum, once again.

    This will happen after the weak maximum of solar cycle 24 passes by, and the solar conditions grow very quiet.

    That is my opinion of what will happen, I should say.

    Time will tell, we will know soon. This decade.

  12. David Appell says:

    Salvatore del Prete says:
    > The rise in temperature since 1850 to present of .5c,
    > can be shown to be linked to the higher solar activity
    > from 1850-2005.

    How?

    dT/T = (1/4)(dS/S)

    Please explain how that gives dT = 0.5 C

  13. Because that variation is not the type we are talking about. It has been shown that other sun like stars ,when they go into a prolong quiet period, have a solar irradaince decrease on average of .6% not the .1 % difference our sun has shown last century, during it’s 11 year typical sunspot cycle.

    Not to mention all those secondary effects, that seem to be associated with the sun ,even when it goes through the so called 11 year sunspot cycle max/min.

    Much less what kind of secondary effects might result during a PROLONG SOLAR MINIMUM PERIOD., lasting a few decades,in contrast to just a year or so ,when the sun exhibits a more or less 11 year sunspot cycle.

    Which it has done more or less since the Dalton Minimum ended, up until Oct. of 2005.

    The most recent solar quiet period since 2005, featured a solar irradiance at the depth of the quiet around 2009 or so, which was much less (-.15 versus -.1 ) then all the previous typical 11 year sunspot solar minimums, since the Dalton.

    I say that -.15 will be more like -.35 , going forward, when the sun grows quiet once again, after solar cycle 24 max passes by.

  14. The rise in temperature was accomplished through the general increase in solar activity since 1850, in combination with the secondary effects associated with this rise in solar activity since 1850.

    Those being less Volcanic Activity, a more +AO, PDO mostly in a warm phase, more El Ninos, less cloud cover, to name some examples.

    Those items were in a warm phase last century(SINCE 1850), in combination with the rather strong solar activity, hence the temperature rise. I say since 2005, the opposite is happening,hence I expect a lower temperature range once again, more like the Dalton.

  15. David Appell says:

    If the change in the solar constant is 0.6%, then dT/T ~ 0.15%.

    Since T ~ 14 C = 287 K, dT ~ 0.4 K.

    That’s not much cooling, in a world where dT ~ 0.15 C/decade from the enhanced greenhouse effect.

    By the way, since the Maunder Minimum dS/S ~ 0.1%, not the value you give of 0.6%. See
    http://lasp.colorado.edu/sorce/tsi_data/TSI_TIM_Reconstruction.txt

  16. Many other sources show a much greater degree of solar variance in TSI,(on the order of -.3 or so during the Maunder Minimum) then what you presented. I just posted they that they found a decrease of -.15 during this latest solar minimum in 2009 or so,versus the -.1 typical drop off.

    We will know this decade, because the sun is likely to be in a very prolong quiet period,(that I am confident of) and the TSI ,is not the only story. The strengh of the solar wind ,the UV light emitted by the sun,in additon to less irradiance also have to be taken into account, when it comes to the climate,versus the sun.

    It is also a proven fact that less sunspots equate to a lower solar irradiance,contary to what your data suggest.

  17. David Appell says:

    > It is also a proven fact that less sunspots equate
    > to a lower solar irradiance,contary to what your
    > data suggest.

    Proven where?
    By whom?
    Where can I find the data?

  18. I say that data is not correct, and the sun ,like all the other sunlike stars (which have been found to vary by.6% ) is more likely to be correct.

    There are many papers if you google solar varations during the Maunder Minimum ,that will show data on TSI variations, which run counter to the data you presented.

    I have to run. This decade will show us much in regards to all we have been talking about.

  19. That article is more or less saying we don’t really know. Again just google solar irradiance changes during the MAUNDER ,and you will find many different opinions.

  20. David Appell says:

    Don’t send me to Google — I want to know *your* data sources.

  21. David Appell says:

    By the way, the Lean 2000 GRL article you cited finds a total solar irradiance change of 0.2% since the Maunder Minimum, not the 0.6% number you have been using.

    That gives dT/T ~ 0.05%, or dT ~ 0.1-0.2 C.

  22. Kwasi says:

    So, to summarise, we can’t know if the temperatures were record temperatures, and even if they were, record temperatures aren’t unusual, and even if they are, then it’s just natural variation.

  23. John W. Garrett says:

    Thank you, Dr. Spencer. I admire your work and your adherence to the work of science.

    The older I get, the less I believe anything emanating from broadcast or print media. When you get right down to it, they are basically professional gossips faced with the necessity to fill an enormous amount of empty airtime and pages each and every day. As a result, they will say or write almost anything.

  24. David Flick says:

    Dr Spencer,

    Thanks for this article.

    You wrote: “But, Roy, the heat wave is consistent with climate model predictions!”. Yeah, well, it’s also consistent with natural weather variability. So, take your pick.

    I pick “consistent with natural weather variability.”

  25. ferd berple says:

    The arctic is becoming warmer as the north magnetic pole moves toward the north geographic pole. The antarctic is becoming colder as the south magnetic poles moves away from the south geographic pole.

    Is it simply coincidence? The magnetic poles of the earth are changing rapidly. More rapidly than at any time previously observed. We know from the paleo records than changes in the earth’s magnetic field are associated with significant climate change.

    The earth’s magnetic field allows the solar wind to enter the atmosphere at the magnetic poles. Is it impossible that these high energy charged particles from the sun affect the atmosphere and polar temperatures?

    Could it be that in the hysteria to blame humans for climate change, we have overlooked the role of nature?

    http://en.wikipedia.org/wiki/File:Aurora_Australis.ogv

  26. Gordon Robertson says:

    Hey, Roy…don’t forget that the record for the US is still 1934. Hansen tried to change it to 1998, but Steve McIntyre caught him and embarrassed him into changing it back.

    BTW…a study by Kreutz back into that era revealed that CO2 levels were in excess of 400 ppmv. He had a degree in chemistry and took over 25,000 readings, being careful to allow for variables that might affect the densities. Warmer oceans…more atmospheric CO2…makes sense.

    Of course, it throws the IPCC cherry-picked ice core proxies for a loop. They pulled 273 ppmv out of a hat for the pre-Industrial era. Jaworowski claimed that CO2 bubbles at great depth change state to a solid, and when the cores are drilled, water in introduces, which messes up the density of the CO2. He figured the 273 ppmv PI density could be 30% to 50% higher, bringing it into the range Kreutz found.

  27. Joe Bastardi says:

    Its hard to believe you actually write about this. What happened 33 years ago Dave? Think you can do it. ITS CALLED THE GREAT CLIMATIC SHIFT. THE PDO SHIFTED FROM COLD, WITH A COLD AMO ALSO , TO WARM. THE ATLANTIC FOLLOWED IN THE MID 90S

    Now think, what happens when you warm the tropical oceans NATURALLY with the energy capacity of the oceans being 1000x of air, and warm, moist air having more energy than cold dry air. What could possibly be the effect? It wouldnt be cooling now, would it? warm the ocean what happens to the air above it. If you are going to try to claim that something that is .0004 of the air, 1/400th of the GHG who’s prime source is the ocean, and that man according to DOE is responsible for .00002 of, is driving the oceanic cycles, then you stop and think about what you are trying to say physically. Its the equal of a man blaming a hangnail for being 60 lbs overwieght

    It is not brain surgery. If you go into a sauna and turn the heat up to 180, the temp of the sauna rises till it hits 180, then it flattens out. There can be other effects, someone opening the door cools it. You wanna really sweat, through water on the element and then watch the humidity come up with the temp. But the fact is the earths temps have obeyed almost perfectly the stimulus of the warm PDO flip, then the addition of the warm AMO. As soon as no more could be added, then what happens. Temps level off, Now that the PDO is turning colder, there is evidence it is falling ( pdo flip 4 years ago)

    I didnt make this up
    http://clivebest.com/blog/wp-content/uploads/2011/06/overlayco2.png

    The increase in water vapor relatively slight, but enough, due to increased temp of the earths warmest waters, is likely to cause more cloudiness, and that means there will be more cooling. The temperature pattern IS PERFECTLY CONSISTENT WITH CLIMATE CYCLE THEORY, But not consistent with co2 driven warming since there is obviously a disconnect.

    What I am amazed at is you simply walk into a trap, as if you never looked at the PDO, or MEI. And then you ask this question. Here look for yourself
    http://www.esrl.noaa.gov/psd/enso/mei/mei.html
    you can see the 33 years of warm MEI’s overall, which your side unwittingly, everytime they gush over an el nino coming on, simply admits it is the ocean. The PDO is in lock step with it, because Ninos are much more prominent in warm pdo’s than cold, and the forecast from your side of constant el ninos is a huge bust, we simply flipped back to the cold PDO. There is of course a lag and as I have been opining for years, and I admit part of this is because of my dad who is a meteorologist and grew up in the 30s-50s, drove the weather patterns of that era into my head, WE ARE IN A SIMILAR CYCLE TO THE 1950S

    http://en.wikipedia.org/wiki/File:PDO.svg

    Now that we can measure it with satellite, it makes perfect sense to let the objective test go forward to see if global temps, without the monkey business of people trying to adjust temps, actually cool in the cycle we are going into, the cold pdo and what will become a cold amo by 2020

    You either dont know this, which is exactly what I believe about alot of your side, they wont look at anything that challenges their dogma, while by the very nature of our side, we have to look at everything you do, OR YOU DO KNOW and wont allow it come forward. Either way, you are confronted with a test, a challenge, I know that is not how the AGW crowd operates, they simply make these vague assertions of the future then claim they are right, but I stand on the idea that by 2030 global temps, and N hem sea ice returns to where it was in the late 1970s ( on average , since 1979 there was a min and that wouldnt be fair.. to your side). So there it is, the same thing I have been yapping about since introducing the triple crown of cooling 4 years ago.

    I am astounded that you could actually bring this up. Do you even know about the PDO, because if you did, why would you walk into the the trap you laid for yourself. And if you didnt, just what are you looking at besides things that back your idea.

    By the way, the nation of Sweden had the coldest June since 1786. That says as much or more than heat records, many of which are at new stations or stations that have had much more buildup around them, finally reaching levels comparable to where they were in the last similar cycle. Sort of makes me wonder if the bottom line is I am not cool enough by 2030, given me not even factoring in the sun

  28. Canadian Dave says:

    Correct me if I am wrong, but:

    If you have 100 years of weather data, for 1,000 locations, statistically, on any average day, should you not expect to have 10 new records for that day?

    I am just saying.

  29. Roy makes a good point about “broken” records.

    This analysis of broken records in Kansas last July shows that :-

    1)None of the records broken were earlier than 1939 and all were at airports.

    2)Cross analysis with nearby stations shows that in most cases temperatures were higher on those days in 1934 and 1936.

    http://notalotofpeopleknowthat.wordpress.com/2011/09/20/record-breaking-temperaturesnot-quite-what-they-seem/

  30. For David Appell.

    Look into this study.

    Estimations of Maunder Minimum Solar Irradiance and CA ii H and K fluxes, Using Roation Rates and Diameters.

    by BLANCA MENDOZA

    The gist of the article is they feel based on their data that solar irradiance was 1.23% lower then today in the year 1683, and 0.37% lower then today in year 1715.

    Dave, it is not just solar irradiance, but even so a .2% change if that was all it was during the Maunder Minimum , would still equate to a -.4c drop in temperature, I believe.
    OTHER FACTORS
    You also have to take into account the change in the solar wind, the changes in UV light, and the impacts to the earth’s magnetic field during a prolong solar minimum period,with some active spurts within the period.

    Those in turn in the order I listed, impact cosmic ray concentrations entering earth’s atmosphere, the zonal or not so zonal flow of the jet stream, and lastly the amount of volcanic activity, all of which in my opinion impact the climate.

    When these are combined with the decrease in solar irradiance ,and with the cold PDO/LESS EL NINOS,with the AMO to follow, I say the SETUP is in place for colder temperatures in the very near future.

    The qustion is will the positive feedback from all of what I have mentioned be enough to put the global temp. into a lower range. I say yes.

  31. chris brandow says:

    looking at your chart, it seems that 6 years have had statistically significant “above average June Temps”. next highest frequency in previous decades, is 4 with other 2 decades being 2. That is more significant than whether this was an above average june. and yes, it is merely suggestive of warming, not definitive.

  32. Nige Cook says:

    You might be having heat in the USA, but here in England it’s been chilly all “summer”.

    The jetstream is normally north of Scotland. This “summer” it has been blowing over mainland Europe and England is getting endless low pressure systems with rain, low temperatures, and depression.

  33. As Joe Bastardi said, a trace gas with a trace increase, is NOT going to change the climate. Not to forget the longwave radiation levels CO2 absorbs, are already at the saturation point.

    The data shows NO correlation between co2 concentrations changes around this level and temp., in contrast to solar variations and temperature.

    This hoax, because that is what it is, is in the 9th inning of it’s run.
    It is tragic to see how such stupidity, can CON so many.

    I have never seen a bigger brain drain,in a scientific field, as I have seen in the field of climate.

    The models are largly responsible for this , and they may work for short range forecasting, but they will NEVER work when it comes to the climate.

    I have much much more confidence in my climatic research and my conclusions, then these ridiculous models, which amount to the blind leading the blind.

    PREPARE FOR GLOBAL COOLING, THAT IS WHAT IS GOING TO HAPPEN.

    The setup is in place. It is a matter of how much cooling, not if we have cooling.

  34. Wes Kirk says:

    I’m not a climatologist, but then neither are many of the people claiming AGW theory is legitimate and absolutely infallible so we should be well weighted in credentials.

    Having followed the temperature trends and the discussion the last few years, I’ve noticed people seem to leave out the Urban Heat Island Effect when posting their temperature databases. Around my town I know one “temperature station” that is located right next to a well-traveled asphalt road with the fumes going directly upward into the thermometer station and it seems to always read just enough to push an above average day to a record and so forth.

    My question to you Doctor: Is it possible to isolate the exact amounts the heat island effect has on various temperature stations and records and then remove that amount for a full reconstruction of the actual data? When researching Anthony Watts’ Surface Station project, it appears over 80% of the temperature stations around the country have over a 2 degree C bias upward. He also includes charts on surfacestations.org that show the temperatures for a length of time, always tilting upward when placed in the urban heat island areas due to improper citing.

    As far as June goes, while it has been sweltering in much of the United States I can’t tell you enough how many people in Europe are complaining about the “cold” summer. It amazes me that our AGW “friends” love to discuss how incidents in one country offer proof of their theory yet when entire continents display conditions invalidating that theory they forget that it is GLOBAL warming they are advocating.

    As far as I go, I’m just hoping we get another Maunder Minimum. A summer under 80F for a decade or so is just what the doctor ordered!

  35. TonyLupo says:

    Roy, nice piece. We need more of these when the media goes into an AGW frenzy every time it gets hot, or we have a disaster.

  36. Wes Kirk, not being a climatalogist(the co2 global warming crowd) is a plus, since they have no clue about earth’s climate system to begin with.

  37. Robert says:

    Wes Kirk says:
    July 9, 2012 at 10:37 PM

    Regarding the UHI – this has been shown to be minimally impacting and that the corrections applied by most groups largely remove most of the discrepancy.

    You can ask Steven Mosher about this if you prefer an “independent” opinion on it. I believe it is time that people stop promoting ideas that have been falsified numerous times by both Scientists and independent bloggers etc… The surface station topic is a dead issue for the most part – please leave it at that. If you cannot prove there is a major issue across the United States then you don’t have any evidence to stand on. If you can’t put up right now – then you should shut up. Until you have evidence you aren’t allowed to create pervasive mistruths.

  38. Robert says:

    Dr. Spencer,
    where can I find your raw data for making the UAH dataset and the processing code in particular as well? I presume you have made it available considering it has been published many times and based on prevalent views on Data Archiving and code provision. Where can I find this dataset?

  39. Glenn Tamblyn says:

    Wes Kirk

    Is it possible to remove the effects of UHI from the temperature records to compensate for that effect?

    Yes, of course it is. And all the major temperature analyses do that. They don’t modify the underlying raw data to compensate for it but when calculating their global trends they apply adjustments for UHI effects.

    For example, GISS use satellite observations of light at night to decide which areas are potentially liable to UHI issues. Then they ignore or adjusts the data for stations within those regions by comparing the changes to adjacent stations that are not in potential UHI zones.

    Additionally, repeated studies by a range of groups and individuals have shown theat UHI isn’t a significant issue in measuring the global trends anyway. This includes a paper by Anthony Watts and others, arising out of the surfacestations.org movement that reported that poor quality stations didn’t have any significant effect on calculation of the long termm trends. These issues did have an effect on the Daily Temperature Range (DTR), the difference between maximum and minimum temperatures. But they didn’t make much difference at all to the average temperature anomalies.

    Also, some basic numbers tell us that UHI can’t be a significant factor. Consider the US. What percentage of the total land area of the US would be affected by UHI? Is there a UHI visible in New York city? Obviously. But how far into upstate New York does one need to travel to get outside this UHI zone? 50 km? 75?, 100? And the US eastern seaboard is fairly densely populated. How much of Wyoming or Texas is influenced by UHI? Some parts of the world are densely populated, with high energy consumption – Europe, the coastal US, major Asian Megacities such as Shanghai or Mumbai. But most of the worlds land area doesn’t have a high energy usage density at all – Wyoming, Siberia, Africa, rural India, outback Australia etc. Personally I would estimate that at most 1-5% of the continental US is subject to a UHI. Globally for all the worlds land surface, even 1% would be unlikely. Then we need to allow for the fact that land only makes up 30% of the Earth’s surface; 70% is ocean. And there is no UHI at all in the ocean?

    So we have a fraction of 1% of the Earth’s total surface area potentially affected by UHI. And the major temperature series include an adjustment for that small amount anyway.

    I find it hard to fathom why some people fixate on UHI so much. It is, at worst, a tiny, tiny distorting factor. And the results from people like Anthony Watts confirm that.

  40. Eric Barnes says:

    Hi Dr. Spencer.
    Have you ever considered using the hourly data to either confirm or refute the TOBS adjustment amounts from T. Karls paper?
    http://journals.ametsoc.org/doi/pdf/10.1175/1520-0450%281986%29025%3C0145%3AAMTETT%3E2.0.CO%3B2

  41. Hasufel says:

    Oddly enough, NOAA themselves don’t agree with Spencer’s denialist message:

    http://www.ncdc.noaa.gov/sotc/global/2012/6

    * The average combined global land and ocean surface temperature for June 2012 was 0.63°C (1.13°F) above the 20th century average of 15.5°C (59.9°F). This is the fourth warmest June since records began in 1880.
    * The Northern Hemisphere land and ocean average surface temperature for June 2012 was the all-time warmest June on record, at 1.30°C (2.34°F) above average.
    * The globally-averaged land surface temperature for June 2012 was also the all-time warmest June on record, at 1.07°C (1.93°F) above average.
    * ENSO-neutral conditions continued in the eastern equatorial Pacific Ocean during June 2012 as sea surface temperature anomalies continued to rise. The June worldwide ocean surface temperatures ranked as the 10th warmest June on record.
    * The combined global land and ocean average surface temperature for January–June 2012 was the 11th warmest on record, at 0.52°C (0.94°F) above the 20th century average.

  42. harrywr2 says:

    This is the fourth warmest June since records began in 1880.

    What was the temperature at the airport in 1880? How many square miles of tarmac did the average airport have in 1880? 1930? 1950? 1970? 2000?

    Hint…the Boeing 747 didn’t enter commercial service until Jan 1970. Airfields were originally grass strips.

    Yesterday my wife and I rode across Nebraska in what was supposedly 100F+ heat with full motorcycle safety gear on. We split all of a 12 ounce tea between us to stay ‘hydrated’.

  43. Desertphile says:

    Hundreds of record high lows; thousands of record high highs; ENSO neutral conditions; urban heat island effect insignificant; night time temperature warming anomalously….

    Is there anyone out there who still believes anything Dr. Spencer asserts?

  44. Desertphile says:

    “Oddly enough, NOAA themselves don’t agree with Spencer’s denialist message”

    Of course not.: NOAA does not cherry-pick their data, nor ignore reality. If you want NOAA’s values to match Dr. Spencer’s opinions, the staff at NOAA would have to be replaced with neo-libertarian pseudo-conservative “free market” ideologues.

  45. Desertphile says:

    “I find it hard to fathom why some people fixate on UHI so much. It is, at worst, a tiny, tiny distorting factor.”

    This one of the two last hopes for denialists when they hope to deceive people. The UHI effect is so insignificant that the error bars are just as wide as the measured effect itself. The entire effect globally might even be negative! (See the BEST conclusion, for example.)

    The other last hope for denialists’ deception is “It’s clouds!”

  46. Desertphile says:

    “Dr. Spencer, where can I find your raw data for making the UAH dataset and the processing code in particular as well?”

    Golly, never mind that. I want to see his data that shows the Urban Island Heat effect is significant. Dr. Spencer merely asserted that it is: where’s the data?

  47. Desertphile says:

    “PREPARE FOR GLOBAL COOLING, THAT IS WHAT IS GOING TO HAPPEN.”

    Take my $1,000 wager.

  48. If I had made such an absurd and asinine claim equal to “June 2012 U.S. Temperatures: Not That Remarkable,” the head of my department (anthropology) would demand an explanation for my irrational behavior; my colleagues would question my mental health.

  49. Massimo PORZIO says:

    @Desmond Paine who wrote: “If I had made such an absurd and asinine claim equal to “June 2012 U.S. Temperatures: Not That Remarkable,” the head of my department (anthropology) would demand an explanation for my irrational behavior; my colleagues would question my mental health.”

    Maybe it’s better that you continue to study anthropology and left science blogs free to do their jobs without your unscientific and futile statements.

    Thank you.

  50. “Maybe it’s better that you continue to study anthropology and left science blogs free to do their jobs without your unscientific and futile statements.”

    Ah, yet another anti-science Neanderthal. How amusing; you’re the 80th one I’ve seen on the ‘net this morning.

    drroyspencer.com is not a science blog: it’s a anti-science free-market propaganda blog. Check out “Spencer and Braswell 2008” for a fine example of ideology pretending to be science.

    The assertion “June 2012 U.S. Temperatures: Not That Remarkable” is irrational, contrary to reality, and wrong. Asserting that over 1,200 thermometers are wrong is irrational. If a respected scientist instead of Dr. Spencer had written such a thing, her peers would worry about her mental health.

  51. Massimo PORZIO says:

    @Desmond Paine who wrote “Asserting that over 1,200 thermometers are wrong is irrational.”

    Learn the meaning of “measuring errors analysis” before talking about things that you probably don’t know at all.
    I had a professor of physics who many times stated: “guys, be careful that thermometers always measure the temperature of themselves”. My professional experience in 25years of industrial controls demonstrated me that no statement is true like that. Thermometers are the worst sensor to faith on, if you don’t really understand its limits.

    And be polite, there is no doubt here: you may be a good anthropologist, I can’t argue that of course, but your method to relate with others is Neanderthal, not mine.

    If you were a real scientist, the simple fact that you seem to have seen 80 more “Neanderthal” like me before should lead you to have some doubts about your blind believing.

    Anyways I only wrote that you wrote an “unscientific and futile statements” which is absolutely the truth, because you didn’t write nothing to support your point of view except ad hominem attacks to Dr. Spancer.

    At this point I suspect you are just a troll.

    Follow my suggestion: if you don’t like Dr. Spancer blog return to your anthropology. Here in Italy we say: “live and let live”, it’s at the very root of freedom.

    If you don’t change your arrogant behavior, these are the very last words I waste for you.

    ————-

    @ Dr. Spancer:
    I’m unable to post a direct reply to the message, I always need to append the reply at the end of the thread instead. You should investigate why.
    I’m using Chrome as browser on a Windows Xp OS.

    Have a nice day.

    Massimo

  52. Manfred says:

    I’m experiencing the same problem directly posting a reply. I’m using Firefox 14.0.1

    Amblin:

    Temperature Projections – IPCC / Hansen v Non-CO2
    You’ll know this for sure, that the CO2 based models overestimating the amount of warming. “While actual atmospheric CO2 levels have increased since 1988, the fact that actual temperatures are similar to the reduced CO2 models implies a problem with the models.”

    We also know that UK Met Office confirms no statistically significant warming for the last fifteen years, and some cooling is evident – in spite of rising [CO2].

    And no doubt you’ll know:

    Climate change between the mid and late Holocene in northern
    high latitudes – Part 1: Survey of temperature and precipitation proxy data
    H. S. Sundqvist1,2, Q. Zhang1,3, A. Moberg1,2, K. Holmgren1,2, H. K¨ornich1,3, J. Nilsson1,3, and G. Brattstr¨

    “Therefore, annual northern hemisphere temperatures during the Holocene ‘Climate Optimum’ 6000 years ago were ~1.95°C hotter than at the end of the 20th century. The “hockey team” of Michael Mann et al has claimed that prior warming periods were localized to the European Arctic, but this extensive review shows the current warming is not unprecedented, not localized, and was greatly exceeded in the recent geologic past.”

    Furthermore:
    ‘This paper also notes (p. 6) that the temperature change via proxy reconstructions from years 1501 to 2000 “appears to be only ~0.05°C for the Northern Hemisphere as a whole according to data from Mann et al (2009).’

    I’d say that a simplistic association with CO2 is at the very least, massively confounded by an array of other variables. In health, we have Sir Austin Bradford Hill criteria of causality. It appears that climate science has no criteria by which to test association for causality? Is this so?

  53. This is so great blog! I like the way this blog was organize and presented. This is really informative. Thanks for a great information!
    https://24hourplumbercampbelltown.com.au/emergency-plumber-ingleburn-campbelltown/

Leave a Reply