Spurious Warmth in NOAA’s USHCN from Comparison to USCRN

August 22nd, 2012 by Roy W. Spencer, Ph. D.

It looks like the Gold Standard (USHCN) for U.S. temperature monitoring is spuriously warmer than the Platinum Standard (USCRN)

After Anthony Watts pointed out that the record warm July announced by NOAA based upon the “gold standard” USHCN station network was about 2 deg. F warmer than a straight average of the 114 core US Climate Reference Network (USCRN) stations, I thought I’d take a look at these newer USCRN stations (which I will call the “Platinum Standard” in temperature measurement) and see how they compare to nearest-neighbor USHCN stations.

USCRN Stations in Google Earth

First, I examined the siting of the core set of 114 stations in Google Earth. Most of them are actually visible in GE imagery, as seen in this example from Kentucky (click for full-size image):
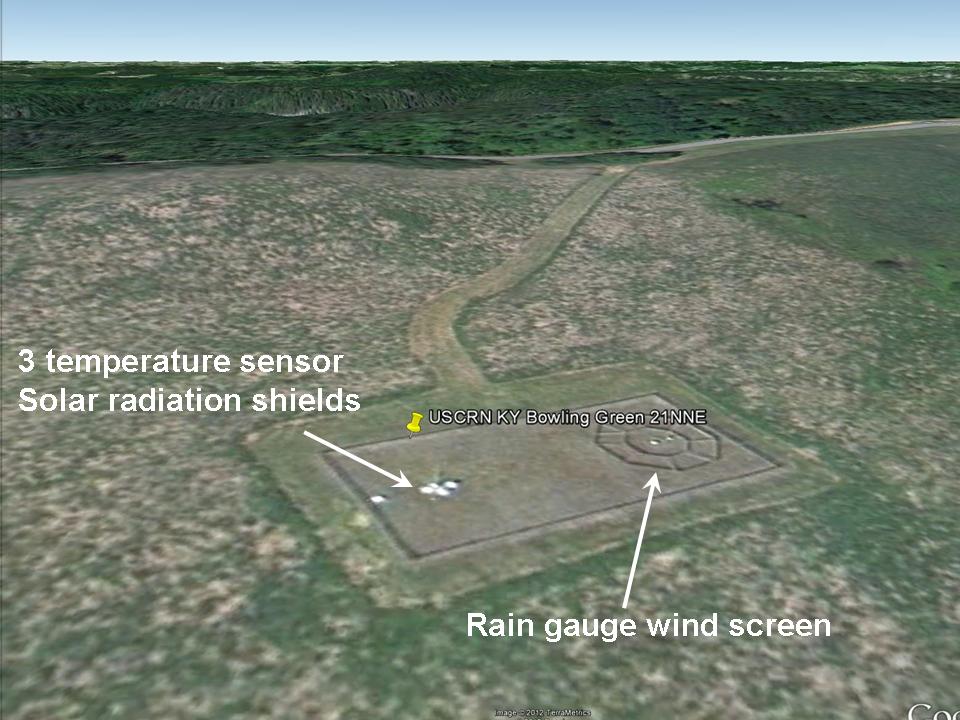
The most identifiable features of the USCRN sites are the three white solar radiation shields over the 3 temperature sensors, and the circular wind shield placed around the precipitation gauge.

While most of the CRN sites are indeed rural, some of them are what I would call “nearly rural”, and a few will probably have limited urban heat island (UHI) effects due to their proximity to buildings and pavement, such as this one next to a 300 meter-diameter paved surface near Palestine, TX which NASA uses as a research balloon launch site:
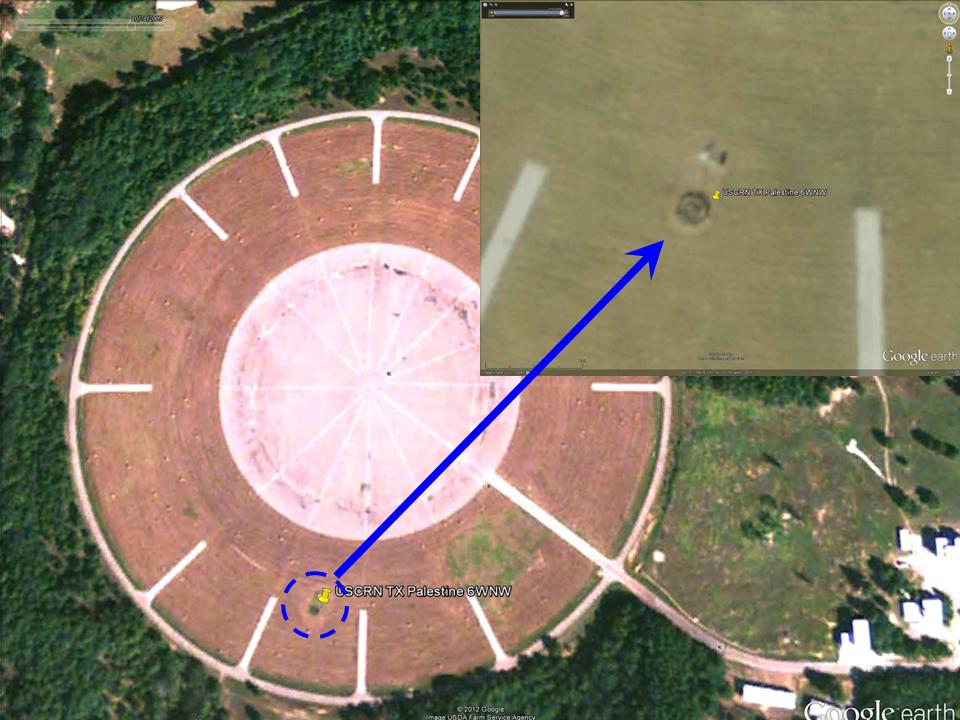
The larger image (from October) suggests that the ground cover surrounding the paved area is kept free of vegetation, probably by spraying, except right around the weather sensors themselves.

A few station locations have 2 USCRN sites located relatively close to each other, presumably to check calibration. A particularly interesting pair of sites is near Stillwater, OK, where one site is a few hundred meters from residential Stillwater, while the paired site is about 2.4 km farther out of town:
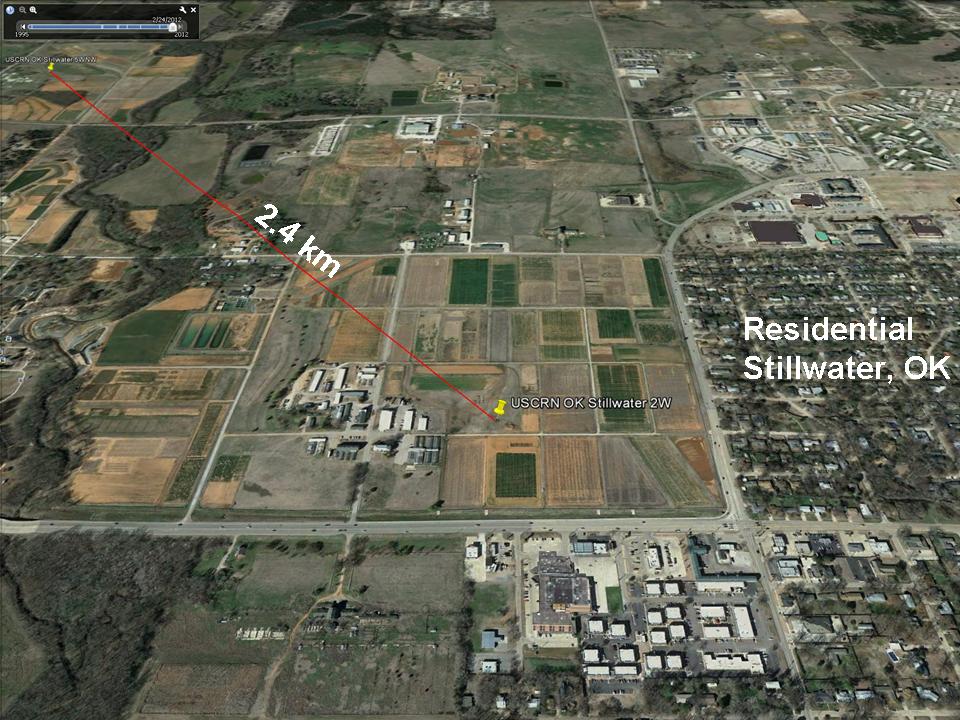
Whether by design or not, this pair of sites should allow evaluation of UHI effects from small towns. Since the temperature sensors (Platinum Resistance Thermometers, or PRTs) are so accurate and stable, they can be used to establish fairly tiny temperature differences between the few CRN neighboring station pairs which have been installed in the U.S.

From my visual examination of these 114 USCRN sites in Google Earth, the “most visited” site is one in rural South Dakota, which apparently is quite popular with cattle, probably looking for food:

Just 1 km to the southwest is this even more popular spot with the locals:
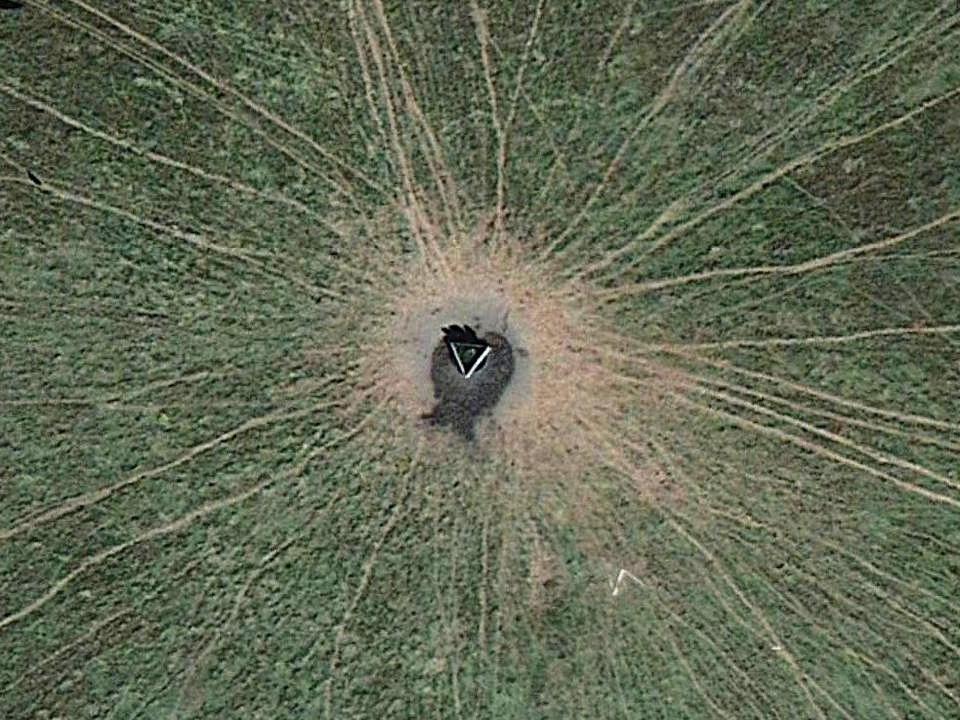
Hopefully, this USCRN site will not experience any BHI (Bovine Heat Island) effects from localized methane emissions, which we are told is a powerful source of greenhouse warming.

Elevation Effects
One important thing I noticed in my visual survey of the 114 USCRN sites is the tendency for them to be placed at higher elevations compared to the nearby USHCN sites. This is a little unfortunate since temperature decreases with height by roughly 5 deg. C per km, which is 0.5 deg. C per 100 meters, an effect which cannot be ignored when comparing the USCRN and USHCN sites. Since I could not find a good source of elevation data for the USCRN sites, I used elevations from Google Earth.

USCRN and USHCN Station Comparisons

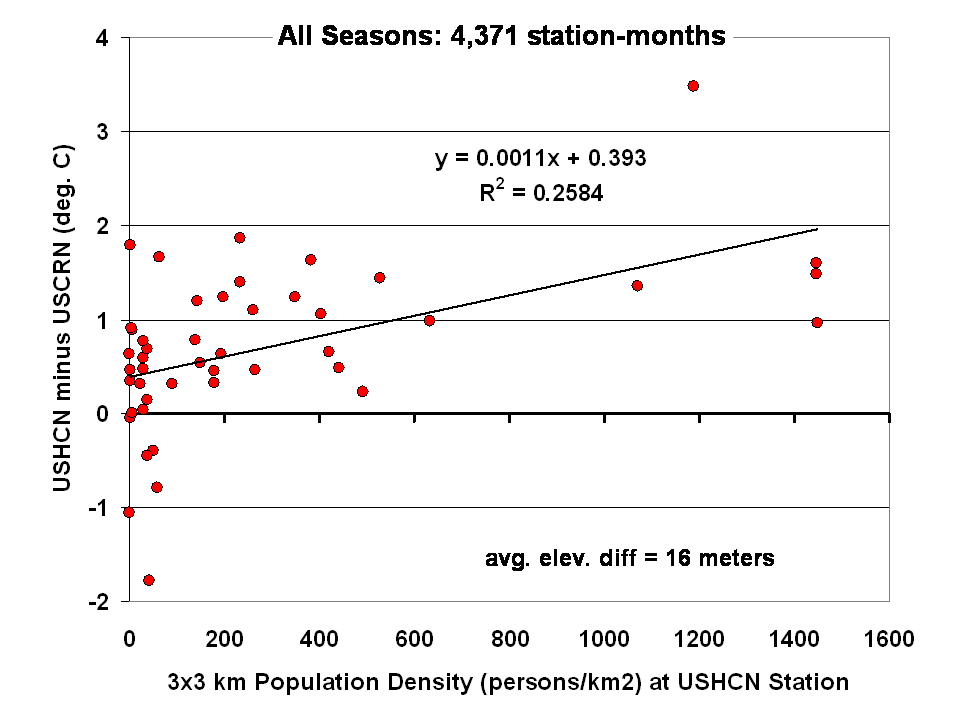
As a first cut at the analysis, I compared all available monthly average temperatures for HCN-CRN station pairs where the stations were no more than 30 km apart in distance and 100 m in elevation. This greatly reduces the number of USCRN stations from nominally 114 to only 42, which were matched up with a total of 46 USHCN stations.

The results for all seasons combined shows that the USHCN stations are definitely warmer than their “platinum standard” counterparts:
The discrepancy is somewhat greater during the warm season, as indicated by the results for just June-July-August:
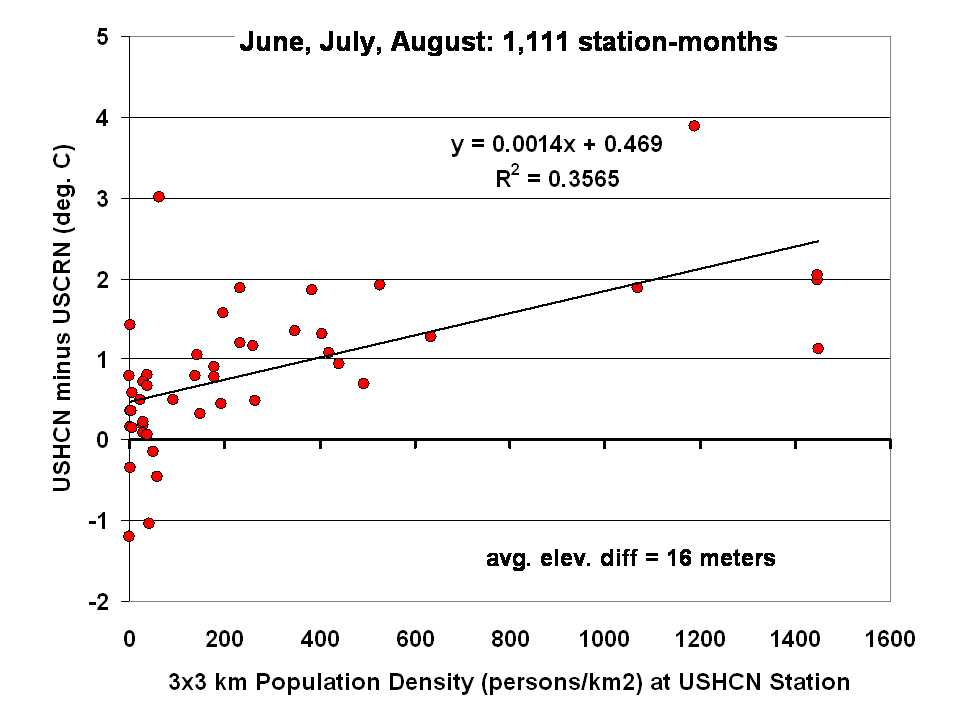
Regarding that Stillwater, OK USCRN station pair, the site closest to the Stillwater residential area averaged 0.6 deg. C warmer year-round (0.5 deg. C warmer in summer) than the more rural site 2 km farther out of town. This supports the view that substantial UHI effects can arise even from small towns.

The largest UHI effects in the above plots are from USHCN Santa Barbara, CA, with close to 4 deg. C warming compared to the nearby USCRN station. Both stations are located about the same distance (a few hundred meters) from the Pacific Ocean.

What Does this Mean for U.S Temperature Records?

I would say these preliminary results, if they pan out, indicate we should be increasingly distrustful of using the current NOAA USHCN data for long-term trends as supporting evidence for global warming, or for the reporting of new high temperature records. As the last 2 plots above suggest:

1) even at “zero” population density (rural siting), the USHCN temperatures are on average warmer than their Climate Reference Network counterparts, by close to 0.5 deg. C in summer.

2) across all USHCN stations, from rural to urban, they average 0.9 deg. C warmer than USCRN (which approaches Anthony Watt’s 2 deg. F estimate for July 2012).

This evidence suggests that much of the reported U.S. warming in the last 100+ years could be spurious, assuming that thermometer measurements made around 1880-1900 were largely free of spurious warming effects. This is a serious issue that NOAA needs to address in an open and transparent manner.

The good news is that the NOAA U.S. Climate Reference Network is a valuable new tool which will greatly help to better understand, and possibly correct for, UHI effects in the U.S. temperature record. It is to their credit that the program, now providing up to 10 years of data, was created.


33 Responses to “Spurious Warmth in NOAA’s USHCN from Comparison to USCRN”

Toggle Trackbacks

  1. This is why I am so glad we now have satellite temp. data for the globe.

  2. Great post, thanks!
    All of these complications show just how valuable UAH satellite temperature measurement work is.

  3. Kasuha says:

    There is one thing I wonder about – did you use the adjusted or unadjusted USHCN temperatures? Because were it adjusted, the difference might decrease or even disappear with unadjusted ones.

  4. JJ says:

    “Hopefully, this USCRN site will not experience any BHI (Bovine Heat Island) effects from localized methane emissions, which we are told is a powerful source of greenhouse warming.”

    You joke, but I wonder what the effect of a hundred head or two congregating around a temp station would be …

    ~1,000 pounds each, @ 40C (~102F), plus shading and wind blocking …

    Dairy farmers incur large costs for cooling their barns of this excess heat during most of the year, offset somewhat when they are able to use that warmth to heat their barns and homes over the winter.

  5. MDarts says:

    Is there any plan to incorporate this data in the USA temperature base? If it’s been available for ten years I would think that all the bugs in the system have been corrected.

  6. jim2 says:

    Dr. Spencer – Would it be a valid method to use the lapse rate to obtain a global surface temperature from the channel 5 temp? If so, would it be more accurate to use the moist lapse rate rather than the dry?

  7. Cathy B says:

    We just broke another all time low arctic sea level extent record. Unlike the land US record, there is no doubt that this is the warmest in millenium. Ice core data is very useful in determining the last time there was no ice at a particular location! Since this is satellite and ice core data, I don’t think it was caused by bovine or polar bear interaction or UHI.

    Roy seems to have stopped looking at the forest (long
    time satellite trends) and become fixated by the trees
    (“adjusted” US temperature).

    The models predict the current transition to El Nino will
    be produce a weak max. So probably no big spikes in the next 6 months like 1998. But certainly higher temps than 2000-2009.

  8. phi says:

    Cathy B,

    “We just broke another all time low arctic sea level extent record. Unlike the land US record, there is no doubt that this is the warmest in millenium.”

    Do you have a reference?

    “Roy seems to have stopped looking at the forest (long
    time satellite trends) and become fixated by the trees
    (adjusted US temperature).”

    Trees, it is a great idea! What do they say about the evolution of US temperatures in the twentieth century?

  9. BS says:

    Cathy B,

    2012 YTD has been cooler than 8 of the last 12 years, according to NASA.

    http://data.giss.nasa.gov/gistemp/graphs_v3/Fig.A2.txt
    http://data.giss.nasa.gov/gistemp/graphs_v3/Fig.C.txt

  10. jim2 says:

    Cathy B, If you take a look at AMSU Channel 5, it’s just another year. The temp is pretty much in the middle of the last 10 years. The Arctic ice melt is regional, not global. Think global.

    http://discover.itsc.uah.edu/amsutemps/

  11. Bevan says:

    Dr Spencer’s blog article says of a site in rural South Dakota that “Hopefully, this USCRN site will not experience any BHI (Bovine Heat Island) effects from localized methane emissions, which we are told is a powerful source of greenhouse warming.”

    I suggest that the problem should be cooling, if the Greenhouse Global Warming theory is to have any credibility.

    The graph that I have, downloaded from the Internet, for the Hitran absorption spectrum for methane has its maximum line strength at 3.29 microns. At this wavelength, the incoming Sun’s spectral radiance is 85 times greater than the outgoing Earth’s spectral radiance as determined by Planck’s law. The next major absorption line is at 7.58 microns where the line strength is 46 % of the maximum line strength while the outgoing Earth spectral radiance is only 25 times greater than the incoming Sun’s. The next two absorption lines are at 2.31 and 1.65 microns where the line strength is about 2% of the maximum line strength and the incoming sunshine greatly exceeds the outgoing Earth’s radiation by more than four orders of magnitude. Thus if the Greenhouse Global Warming theory is relevant then the overall loss of energy via back radiation of the incoming sunshine should cause the Earth to be colder than it would otherwise be if there was no methane in the atmosphere – not hotter.

    Similar effects apply to the other main greenhouse gases, namely, carbon dioxide and nitrous oxide, where the maximum absorption line strength occurs in the region where the incoming Sun’s spectral radiance exceeds the outgoing Earth’s spectral radiance. Thus increases in concentration of both of these gases should also cause cooling of the Earth.

    As there is no sign of cooling of the Earth in spite of marked increases in the concentration of all three greenhouse gases, carbon dioxide, methane and nitrous oxide, the Greenhouse Global Warming theory is falsified.

    Add to this the very odd idea that the Terrestrial Greenhouse Effect, said to be the 33 degrees difference between the average surface temperature of the Earth, 288 degrees Kelvin, and the global mean effective temperature, 255 degrees Kelvin, which occurs at about 4.5 km above sea level, apparently only happens in this lower 4.5 km of the troposphere and is said to be due to the presence of greenhouse gases. No effect is claimed for the remaining 12 or more km of the troposphere even though they contain similar concentrations of the greenhouse gases. How can this be? What sort of theory is this?

  12. Massimo PORZIO says:

    Cathy B,

    Unlike the land US record, there is no doubt that this is the warmest in millenium. Ice core data is very useful in determining the last time there was no ice at a particular location!

    Uhmmm Maybe you are unaware that no ice cores had ever extracted from sea ice sheets but from land perennial glaciers instead.

    See this authoritative link which shows where polar ice had been taken:
    nsidc.org/data/atlas/news/ice_core_additions.html

    As you can see Greenland is the main source for the Arctic. As far I know, few other ice cores had been taken from Svalbard and Franz Josef Land too, but in each case they had been drilled on island glaciers, not from sea ice. That because is well know that sea ice melts from the above but from the below too, so it cant get any long time information about the Earth climate.
    From the very same link above, note the drilling depth, which is about 1km, do you really believe the sea ice thickness is close to that value even at the North Pole?
    For your information, as far I know, the sea ice thickness is no more than 5 meters at the North Pole.

    “Roy seems to have stopped looking at the forest (long time satellite trends) and become fixated by the trees (adjusted US temperature).”

    So, when Berkeley’s Dr.Muller uses his BEST “adjusted” US temps to explain his “change of point of view” and shift to the AGW enthusiast side, that’s “science”. While, when respectable scientists such as Dr. Spencer or Dr. Christy use those very same data, than is that a “fixation” or an obsession?
    By my point of view Dr.Spencer arguments are due, at least to emphasize how other scientist pose their believing upon not reliable data. I dont know which was the real reason which lead Dr. Muller to became so sure of the man made global warming, maybe because he wasnt aware of how those data are compromised by the many unpredictable variables which play in those measurements that he used. For this, I believe that essays like this from Dr. Spencer are welcome to inform such people who arent expert in the field, so they can hear the other bell (its a saying here in Italy, which meaning in English should be Let them hear the other side of the story).
    Finally, I can’t imagine why people like you want to attack on the personal side the others who don’t agree with you. If you have any doubt about Dr. Spencer statements tell us where he is wrong by showing us the proof of your own statements and lets us think about them.
    That’s how science should be, lets hear the two bells 🙂

    Have a nice day.

    Massimo

  13. Cathy B says:

    Phi:

    There are many different efforts to estimate arctic ice loss from groups all over the world, and some people who seem to like to collate data. Here is a particular example:

    https://sites.google.com/site/arcticseaicegraphs/

    Note that we are not just seeing a slightly smaller record, but an incredible shattering of the record. Warmer artic summers means more northernly jet stream means hot US. You can try to adjust it away with pictures of cows, but when the corn crop fails, the cows will die and then there isn’t much wiggle room.

    Massimo: This site has for years focused on the global temperature data derived from satellites. Dr. Spencer has always posted other things, but the main emphasis was always on the monthly temperature updates, so much so that every month there was always a rash of comments trying to spin the data and even websites where you can wager (real and fake money) on the outcome.

    As the global temperatures have continually increased I have noticed lately that every month, right after publishing the global numbers, we get a post about “adjusted US” numbers. I doubt this is a coincidence.
    Who wants to talk about an ENSO neutral temp higher than El Nino temps from 10 years ago? It is more fun to try to adjust US temps (a tiny fraction of the globe) to show our recent extremes are only sort of extreme. This is definitely losing sight of the bigger picture.

    CB

  14. Joseph says:

    CB,

    You are looking at a 30 year trend and finding that it has a variance. My question is what kind of variance can be expected in a 30 data set? How about you compare it to the data from 1930-1960. Wait. We don’t have that data to make a comparison with. We can’t tell what is normal from what is abnormal until we have more data.

  15. Massimo PORZIO says:

    Hi Cathy B
    maybe I’ve not been clear in my previous message.
    I agree with Joseph argument, you can’t state that “there is no doubt that this is the warmest in millenium” just using the polar sea ice extension analyses.
    Leaving apart the short seasonal samples, which have pointed out by Joseph. You must take account that in the very same link you referenced in your last message, you can see the “CRYOSPHERE TODAY GLOBAL ICE(Area)” which well explain what jim2 said in his message on August 25, 2012 at 4:59 PM “The Arctic ice melt is regional, not global. Think global.”
    In fact, while the Arctic sea ice experienced a shrink, the Antarctic sea ice has grown last years. And the global sea ice area is not so low. It’s above 2007 and 2011, almost the same as 2008.
    As it happened in 2007 the dropping of the Arctic sea ice area has followed an Arctic storm not an exceptional high temperature there. Someone suggested that the sea ice area shrinking could be the consequence of the packing of the floating ice due to the heavy winds instead of a temperature issue.
    In support to that theory, the Danish Met Institute give you the “Daily mean temperature and climate north of the 80th northern parallel, as a function of the day of year” at this link:

    //ocean.dmi.dk/arctic/meant80n.uk.php

    As you can see the temperature was absolutely a little lower than the average and after (not before) the sea ice shrinkage it “jumped” above the average value. This should convince you that the air temperature is the consequence not the cause of the sea ice area reduction there.

    From my point of view the sea ice area shrinking should be more sensitive to the oceans water temperature than the air temperature. That’s because of the different density of the heating media, and this link seems to support this view.

    http://www.arctic-warming.com/_FIN_Feb2010_WEB_CC_Arctic1919.pdf

    Note that the same link refers to an event happened at the beginning of the 20th century (abt 1919), which shows how the Arctic sea ice shrinking is not so unusual for the people who work on it from a long time.

    Anyways to show you that the Arctic could experienced these events before and so that this is not an exceptional event, I suggest you to read this link too, maybe you missed it:

    //www.newyorkmapsociety.org/FEATURES/TRAGER.HTM

    Ask yourself: How did they draw those maps if those lands and their surrounding seas were covered by ice?

    Uhmmm…

  16. HR says:

    Dr Roy,

    I often read that all this is irrelevant anyway because satellite records, such as your own, show a similar rate of warm as the land based record. What do you say to this?

  17. Dan Pangburn says:

    Ice can melt because the surrounding water is warmer than it was when the water froze. The planet has warmed a lot since the last glaciation and has been warming more or less regularly since the depths of the LIA until about 2001. The assertion that it is warmer at the end of a warming period is not very profound. The observation that arctic ice is melting is evidence that warmer water got to the arctic ocean but does not mean that the planet is still warming.

    Paraphrasing Richard Feynman: Regardless of how many experts believe it or how many organizations concur, if it doesnt agree with observation, its wrong.

    The IPCC and many others perceive that increased atmospheric carbon dioxide was the primary cause of global warming. Measurements demonstrate that they are wrong.

    The average global temperature trend has been flat since 2001. No amount of spin can rationalize that the temperature increase to 2001 was caused by CO2 increase but that 25.2% additional CO2 increase had no effect on the average global temperature trend after 2001.

    Without human caused global warming there can be no human caused climate change.

    Average GLOBAL temperature anomalies are reported on the web by NOAA, GISS, Hadley, RSS and UAH. The first three all draw from the same data base of surface measurement data. The last two draw from the data base of satellite measurements. Each agency processes the data slightly differently from the others. Each believes that their way is most accurate. To avoid bias, I average all five. The averages are listed here.

    2001 0.3473
    2002 0.4278
    2003 0.4245
    2004 0.3641
    2005 0.4663
    2006 0.3930
    2007 0.4030
    2008 0.2598
    2009 0.4022
    2010 0.5298
    2011 0.3316

    A straight line (trend line) fit to this data has no slope. That means that, for over a decade, average global temperature has not changed. If the average thru July in 2012 (0.3431) is included, the slope is down.

  18. steven mosher says:

    1. Use any DEM to get the elevation data for both sets of stations. SRTM is available or the check the inventories for the CRN stations.

    2. 100meters different in altitude is important, you’d have to correct for that with a lapse rate ( by season )

    3. With your DEM you should be able to calculate slope and aspect, you want to rule out potential cold drainage. Peilke has a paper on this somwhere.

    4. Do not rely on the GRUMPv1 product for population density especially for low population places. It is not very accurate as you could see if you compared it with US census data or if you just used google earth to look at few small density places.. Basically the population figures especially at low density put people where there are no people.. ( excess population gets spread evenly over rural places )

  19. jim2 says:

    WUWT has a post concerning an article,

    Impact of population density on the surface temperature and micro-climate
    of Delhi
    Javed Mallick1 and Atiqur Rahman2,* 1Department of Civil Engineering, King Khalid University, Abha, Kingdom of Saudi Arabia 2Remote Sensing and GIS Division, Department of Geography, Faculty of Natural Sciences, Jamia Millia Islamia University, New Delhi 110 025, India

    The chart therein show that the temp increase is greater early in population growth and levels out thereafter.

  20. harrywr2 says:

    steven mosher says:
    September 2, 2012 at 5:37 PM

    Basically the population figures especially at low density put people where there are no people.. ( excess population gets spread evenly over rural places )

    I think it would be slightly more accurate that suburban/urban spillover gets averaged in with the rural as grumps uses ‘incorporated boundaries’ to determine average density. I.E. All that stuff just over the city line gets dumped into the average for the rural portion of the county.

    Hence, without a google earth eyeball examination a thermometer could be for all practical purposes in an urban setting but show up as rural.

    Riyadh, Saudi Arabia is probably the worst example of Grumps. There are no city boundaries. So population density is averaged over the province of Riyadh. The same is true for Mosul, Iraq.

  21. bob paglee says:

    Sea Ice incurs cyclical and countracyclical effects aided and abetted by positive feedbacks and negative feedbacks.

    For example, a reduction in the area of white sea ice should reduce the reflection of incident solar radiation, ergo allowing more solar heating of the exposed seawater, thereby increasing the rate of melting in a form of a positive feedback.

    But as a possible negative feedback, when the gross area of sea ice is diminished, the underside of the remaining sea ice reflects less heat into the seawater below and more heat is reradiated into outer space, thereby reducing the rate of summer melting.

    Whatever case is predominating temporarily can induce a significant cyclical effect.

  22. eksommer says:

    So if surface temperatures are rising faster and higher around urban areas, and we continue to develop land, then won’t that in effect raise the temperatures globally–over time–with concomitant consequences regarding Earth’s warming?

  23. Massimo PORZIO says:

    You missed the point.
    UHI is a local effect which is pertinent to a very small land area compared to the whole land surface.
    But a great quantity of temperature sensors are placed into the UHI areas. This sensors are then used to “homogenize” the temperature along the whole land surface, so the average temperature is sensibly biased.

  24. Massimo PORZIO says:

    Hoops!

    My previous reply was for eksommer of course 🙁

    I’m still unable to reply directly to a post.

  25. mqwieesspztqfodfs, Online Blackjack, IsIpRxL, [url=http://hollandblackjack.nl/]Online Blackjack[/url], juBxpvd, http://hollandblackjack.nl/ Online Blackjack, JFubaNq.

  26. I I loved that post on top places to advertise, and I’m glad you linked to it again, so I could have both resources in one book mark

  27. eyryfesspztqfodfs, Oklahoma City Locksmith, nLbTuRj, [url=http://247locksmithsoklahomacity.com/]Locksmiths oklahoma city[/url], UJgMzDY, http://247locksmithsoklahomacity.com/ Locksmith Oklahoma City Oklahoma, ExvvVVF.

  28. rpbluesspztqfodfs, Valium dosges, oezXKWi, [url=http://cyclingthestuarte2e.com/]Order valium online[/url], xWknlMJ, http://cyclingthestuarte2e.com/ Side affects valium, VFXhQxa.

  29. rhgueesspztqfodfs, Free instant life insurance quotes us, GrJwYqU, [url=http://cj08.com/]Compare term life insurance quotes[/url], nQEwcCb, http://cj08.com/ Life Insurance Quotes, IGHwhtr.

  30. Hgh benefits says:

    xebbkesspztqfodfs, Benefits of hgh, xSHnVrn, [url=http://ddlt.org/]Does hgh work[/url], BTxvxJp, http://ddlt.org/ HGH, tzjNiVB.

  31. ferd berple says:

    There is much better correlation between polar ice levels and magnetic field changes than there is with CO2.

    The magnetic poles are shifting faster than at any time in recorded history. Moving towards the arctic and away from the antarctic.

    We know from the paleo data that climate change is associated with magnetic field changes. In contrast, the paleo data shows that CO2 lags climate change, and is thus the result, not the cause.

  32. Michael A says:

    I would like to know if the temperatures you used from the older system were the raw temps or the adjusted temps.

    thanks in advance.

  33. I really like your article about the best sites to promote, so I’m delighted you linked to it once again so I could save both pages.

Leave a Reply