
 Home/Blog
I’ve been having discussions with a physicist-friend about how to analyze time series data: what kinds of smoothing or filtering should be used, etc. The blogosphere is filled with discussions of various climate datasets and what people think they “see” in them.
Time series analysis is nothing new, and has a rich history. But it is easy to be fooled by data. So, as a learning exercise, I would like readers to examine the following 20-year plot of monthly data…I’ll call it the Magical Mystery Climate Index. I would like you to tell me what you see.
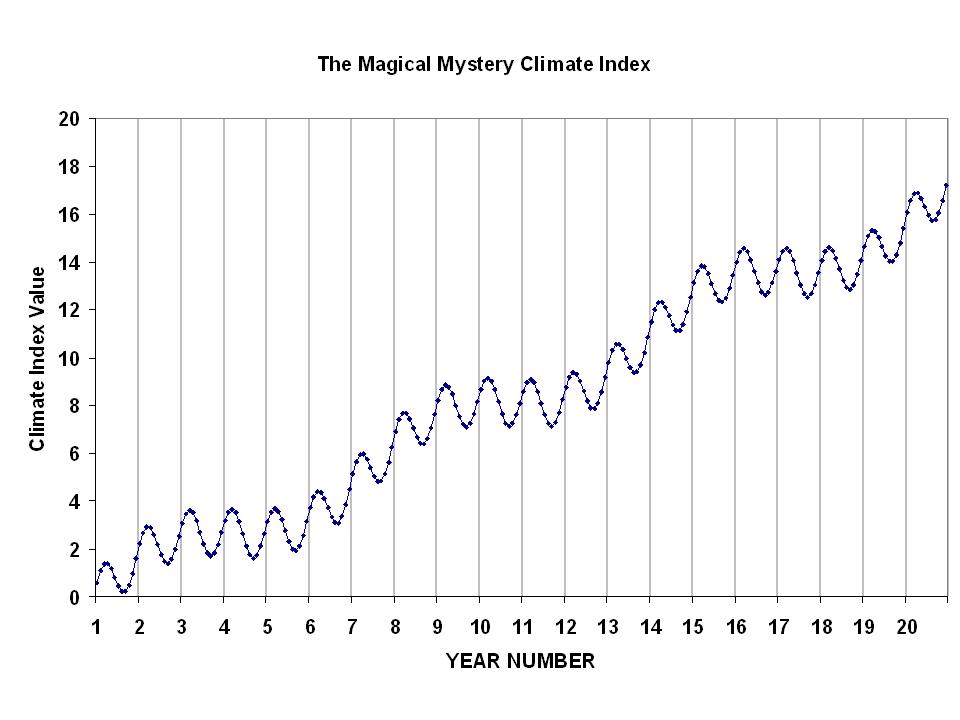
For those so inclined to do some data analysis, here are the data in an Excel spreadsheet: Magical-mystery-climate-index
I suppose what I am asking is this: What modes of variability do you see in the data? I happen to know the answer, because I’m the one who defined those modes of variability. I just want to see what other people come up with. I’ll post the real answer when I stop getting new ideas from readers.


