Now that the CERES radiative flux products from the NASA Terra and Aqua satellites have been updated through October, 2013, I thought I would update the comparison between global average SST variations and CERES to examine forcing and feedback issues.
As in my recent post on SSM/I ocean variables, all plots below are for the global area-average ice-free ocean between 60 deg. North and South latitudes.
Starting with the SST variations, with the anomalies computed relative to the CERES period (March 2000 thru October 2013), we see that global average SST is reasonably well correlated with ENSO activity, which I am representing with the Multivariate ENSO Index (MEI). (Linear trend lines are for entertainment purposes only).

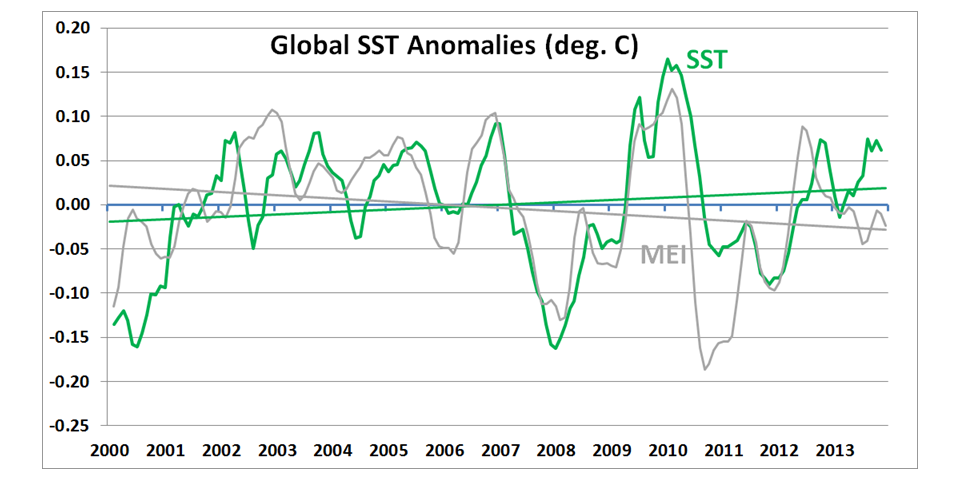
Fig. 1. Three-month anomalies in global average SST and MEI (scaled to SST) between March 2000 and October 2013.
The corresponding CERES radiative flux anomalies computed over the ocean also show a response to ENSO activity.
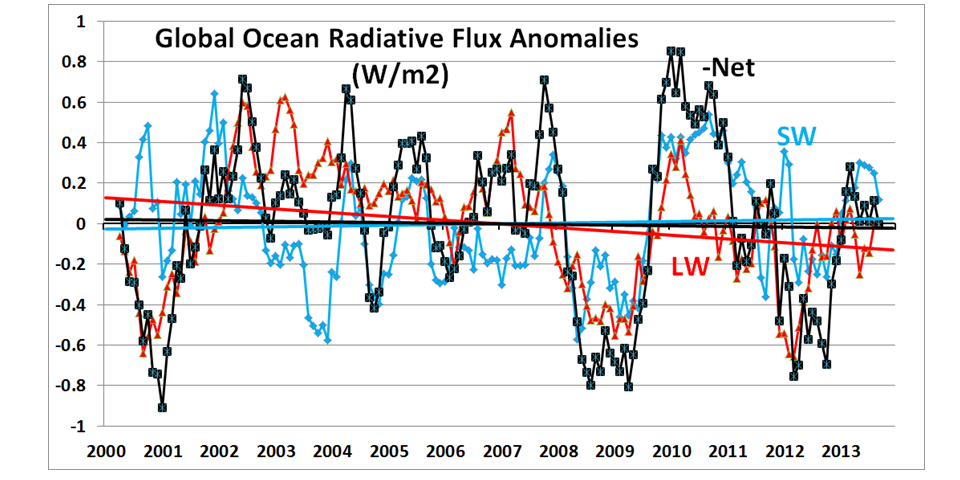
But in order to put the above pieces of the puzzle together, I have found that lag regression between SST and the other variables leads to considerable physical insight. The following plot shows how different variables change before and after SST during the 13+ year CERES period of record.

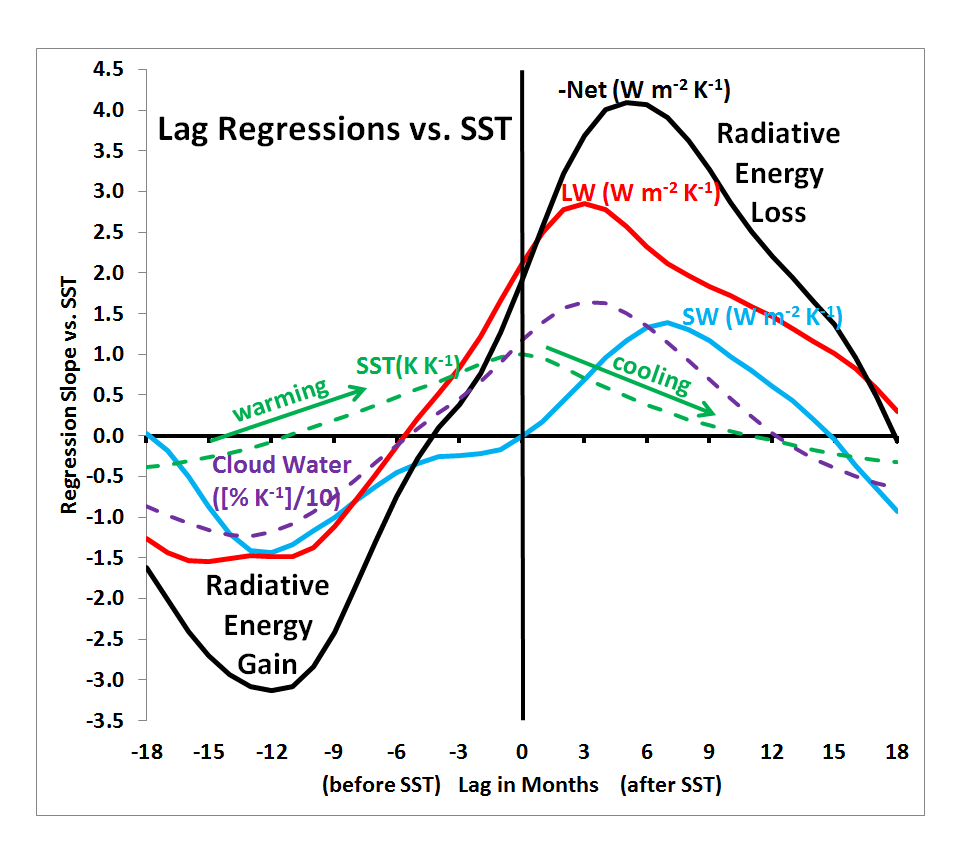
Fig. 3. Lag regression coefficients between SST and several other variables, based upon monthly running 3-month average global ocean anomalies.
We see that 12-18 months before peak SST is reached, there is a radiative accumulation of energy, both solar shortwave (SW) and infrared longwave (LW). (Net is close to the sum of the two, but with the sign flipped, so that positive numbers represent energy lost by the climate system).
The curve based upon SSM/I cloud water shows that there is a ~1% decrease in cloud water over the ocean about 9-18 months before peak SST anomalies of ~0.1 deg. C are reached, which probably explains the solar SW curve. This is the “internal radiative forcing” we talk about…the climate system’s cloud cover is not constant, and varies depending on circulation regime (El Nino or La Nina), creating a forcing of later temperature change.
As peak temperatures are approached (at zero time lag), the radiative fluxes change to a net loss, which continues for many months as SSTs then cool.
As long-time loyal readers of my blog are aware, the regression relationships at zero time lag are what are traditionally used to estimate feedbacks in the climate system, a methodology which I (and Lindzen) believe is seriously in error. Since feedbacks determine climate sensitivity, and sensitivity determines how much anthropogenic global warming there will be, this is a critical issue.
I’ve spent years studying this problem in considerable detail, and I don’t see any way yet to diagnose feedback (the radiative response to a temperature change) when there is a simultaneous, unknown, radiative forcing of temperature change going on.
The climate system is constantly out of balance, and without knowing how much internal radiative forcing is occurring, you can’t know the size of the net feedback. Radiative forcing always opposes net radiative feedback, and if forcing is occurring, any estimate of feedback is biased in the direction of positive feedback (high climate sensitivity).
We have three papers published on this (Lindzen has others), and as far as I can tell, the climate community still does not understand the implications of our work.
What we do know is that the climate models we have analyzed show relationships that depart significantly from the observations, and in the direction of high climate sensitivity. Our most significant papers on this, which I fully stand behind, are here and here. (The latter paper is the one that led to the journal editor resigning and apologizing to Trenberth for allowing to be published…even though it was peer reviewed, and never retracted.)
This is a subject on which the scientific consensus, as far as I can tell, is clueless. Attempts to refute our work have been feeble at best. Andy Dessler claims the radiative signals are all feedback (no “internal forcing”) and are a response to previous temperature changes.
Well, if that is the case (as I have asked him), why doesn’t he then use a time lag in his feedback diagnoses? As Lindzen has shown, when this is done you diagnose strong negative feedback. Oops…wrong answer for the IPCC.
To paraphrase Trenberth, we can’t account for the IPCC’s continuing to ignore this issue, and it is a travesty that we can’t. 😉
For those interested in the data which went into the above plots, here is the spreadsheet.
The striking thing here is that the shortwave “radiative energy loss” exactly vanishes at SST clock zero. This gives a good chance to the hypothesis that the SST drives the shortwave “radiative energy loss”.
Hi Dr. Spencer,
I do not believe that what you are showing is an “internal radiative forcing”. Instead I think it is the “shortwave flux feedback” associated with ENSO.
see http://journals.ametsoc.org/doi/abs/10.1175/JCLI-D-11-00178.1
The reason that the shortwave flux leads global temperature is that SST variations over the central equatorial pacific lead global temperature. So the TOA shortwave response can be a feedback on LOCAL SST variation in the tropical Pacific but still lead (and thus appear to force) global temperature.
These are not local measures, Patrick.
I am showing a global (ocean) average net radiative gain, which through energy conservation MUST lead to a warming tendency, which is exactly what is observed.
Now, I admit the observed surface warming/cooling with ENSO is *mostly* (2/3) non-radiatively forced, from changes in vertical ocean mixing, as we showed in our APJAS paper from last year:
http://link.springer.com/article/10.1007/s13143-014-0011-z
…but the remaining 1/3 radiative forcing was required to best match all of the observations.
And taking that into account substantially affects the model-diagnosed net feedback…by a factor of 2.
Roy,
Did you consider that the ENSO process controls the ocean uptake of solar energy (and also of the release of latent heat through evaporation) by varying the distribution of clouds and the strength of winds across the tropical/subtropical ocean basins (not just the Pacific)? During a La Niña (or indeed during ‘neutral’ ENSO conditions), the central and eastern tropical Pacific soaks up copious amounts of solar energy, because the cloud cover in these regions is relatively sparse at these times (the trades push the heated water (and with it, the clouds from the moist deep convection) far into the west – it’s all a circularly coupled process). But the SST does NOT increase. The warm water is stored at depth. The OHC increases however. The opposite happens during El Niño. The ocean loses stored-up energy, they cool. But the SST rises.
By reflecting solar radiation back to space (the albedo effect of clouds) and by trapping infrared radiation emitted by the surface and the lower troposphere (the greenhouse effect of clouds), clouds exert two competing effects on the Earth’s radiation budget. These two effects are usually referred to as the SW and LW components of the cloud radiative forcing (CRF). The balance between these two components depends on many factors, including macrophysical and microphysical cloud properties. In the current climate, clouds exert a cooling effect on climate (the global mean CRF is negative). In response to global warming, the cooling effect of clouds on climate might be enhanced or weakened, thereby producing a radiative feedback to climate warming (Randall et al., 2006; NRC, 2003; Zhang, 2004; Stephens, 2005;
Dr. Spencer says
Radiative forcing always opposes net radiative feedback, and if forcing is occurring, any estimate of feedback is biased in the direction of positive feedback (high climate sensitivityBony et al., 2006).
Feedback in general is the process in which changing one quantity changes the second quantity and the change in the second changes the first. POSITIVE FEEDBACK AMPLIFIES THE CHANGE.
Given the above the net radiative feedback can then be directed back to the surface of the earth as is the case with GHG giving a real positive feedback. Would this then not enhance radiative forcing?
Is my thinking wrong? I hope the question is not stupid. Thanks.
Not sure I fully understand the question…but maybe this will help:
“NET radiative feedback” includes the Planck effect (increasing IR loss due to temperature alone), which always overwhelms any positive feedbacks. If it were not so, the climate system would be unstable to perturbations, which it is not (nor are any of the IPCC climate models).
The climate community has greatly confused the issue by not calling the Planck effect a “feedback”, per se, even though it is included in the NET feedback parameter.
The term “positive feedback” is tricky one. It is used by the IPCC precisely for this reason.
They want to trick us into thinking that water vapour radiative effects amplify the effects of CO2. Part of the trick is with the word “amplify”. Amplification means addition of power to the signal. There is no source of power in the atmosphere that can do that. So “amplification” is an abuse of language. Even our dear and much respected Dr Spencer lets them get away with this one, though he protests that it is confusing.
If I put a resistance across the terminals of a real physical battery, current will flow through it, and I can measure the voltage across it, say 1 volt. If put another resistance in series with it, the current flow will fall, but the voltage across the combination will rise, say perhaps to 1.1 volt. That is a fair analogue of the water vapour radiative feedback. The power coming out of the battery has fallen, but the nominal measurement of voltage has risen.
Would you call that amplification?
I don’t think so. But the IPCC would call it so. They say “Oh, look how the voltage has risen. You must admit that’s amplification!” So amplification is a clever word game they use as propaganda.
Then to get more technical. There are two ways of analyzing dynamical systems which contain circular causal linkages.
One way of analysis is that used by electronic amplifier designers, and cheatingly cited by the IPCC. They are dealing with circular causal linkages that contain power sources that really add power to the signal. Their language is built around that. That’s right for their work because they are really dealing with amplification. Their formalism is used by the IPCC for a system that doesn’t contain power sources that really add power to the signal. Result: confusion and trickery.
The other way of analysis is used by general dynamical systems theorists. They don’t usually talk the amplifier designers’ language of feedback. They represent their systems by differential equations of the form
dx / dt = f(x),
where x is a list of variables. The output affects the input, and people, not dynamical systems theorists, say “Oh, that’s feedback!” Well, it’s loop causality, but not feedback as amplifier designers cited by the IPCC use the word.
Positive feedback as amplifier designers use the term refers to a causal loop with a power source in the loop. The feedback is positive if some power gets back to the input. But the loop only shows further amplification due to the feedback if the so-called ‘loop gain’ is greater than 1. If it is less than 1, it’s still called positive feedback but it doesn’t result in further amplification. The “loop gain” of the IPCC “amplifier” is less than 1, so there is no further amplification properly speaking. And there was no amplification in the first place in the IPCC game, because there is no power added in the loop.
So the IPCC can talk persuasively and effectively emotively about “amplification” due to “positive feedback” with all its propaganda effects. But it’s no more than a cheating wording.
In a nutshell, “positive feedback by water vapour radiative effects” has “loop gain” less than one and doesn’t amplify. True, it is like the added resistor in the battery example I started with in this post. The battery will go flat later as a result of the added resistor, and its voltage will stay up longer, but still the only power available was already there from the start. No added power. No amplification in reality.
The dynamical systems theorists usually don’t talk about feedback in the amplifier designers’ sense. The dynamical systems theorists look at the linearized transfer matrix of the system, and look at its eigenvalues. If they are all negative, the system is stable and does not explode away from its rest point. If one of more of them is positive, the system will explode away from its rest point and usually will find another rest point some distance away, beyond the scope of the linearize transfer matrix.
One might loosely say that this is “positive feedback”, but it’s not the strict amplifier designer’s positive feedback. Analyzing the IPCC’s climate story in this way, one finds that all the eigenvalues are negative. The loop doesn’t lead to any positive eigenvalue: the system is stable, not explosive. This is the natural way to study the climate system, avoided by the IPCC because it lacks exploitable propaganda value.
This kind of thing is also dealt with by chemical engineers. They speak of compensatory and anti-compensatory effects. True, the water vapour radiative effect is to a degree anti-compensatory, but not anti-compensatory enough to destabilize the system. I find this terminology most useful.
To be more specific, it is even debatable whether the water vapour radiative effect is really anti-compensatory. Dr Spencer has considered this debate. On the one hand, more total water vapour is like an added resistor as above. But it’s not a simple as that. The atmosphere is more complicated than a resistor. The water vapour is distributed over a range of tens of kilometres of altitude. True almost for sure, the water vapour near the earth’s surface increases with increasing temperature, and that is anti-compensatory, though not explosive. But the data about the effect of the earth’s surface temperature on the water vapour at high altitudes is inadequate and no sure conclusion is known about it. It remains within the possibilities of the inadequate data that the water vapour at high altitudes is compensatory to a degree that outweighs the anti-compensatory effect of water vapour near the earth’s surface. So the IPCC’s beloved anti-compensatory effect of water vapour radiative action remains unproven.
In summary, the IPCC story of “amplification or warming by positive feeback through water vapour radiative effects” is a propaganda trick.
Looking at Dr Spencer’s response just above, the Planck effect is deceptively treated by the IPCC people as if it was a power addition to the circuit, when it really belongs in the power loss side of the balance sheet.
I have to disagree with Dr Spencer when he lets the IPCC off the hook by using their “feedback” language. I think one should call a spade a spade, and use the appropriate dynamical systems approach, not the inappropriate amplifier designers’ language. I guess, without evidence, that Dr Spencer says to himself ‘Well, the IPCC dictates the terms of the debate and we have to respond in the language that people have learnt from them and can relate to.’ Perhaps from a practical point of view he is right about that, but we thoroughly agree that “The climate community has greatly confused the issue …” That’s their aim.
> If I put a resistance across the terminals of a
> real physical battery, current will flow through it,
> and I can measure the voltage across it, say 1 volt.
> If put another resistance in series with it, the
> current flow will fall, but the voltage across the
> combination will rise, say perhaps to 1.1 volt.
Where do you get your batteries?
My knowledge of climate science is negligible. However…
The voltage will remain constant regardless of the resistance across its terminals (within normal limits for the battery). A 9ohm resistor across a 9V battery will draw 1A (for awhile), dissipate 9W but will measure 9V across it. Adding another 1ohm resistor in series will raise the resistance to 10ohm. Current will fall to .9A but voltage across the total resistance is still 9V. It doesn’t increase (or decrease) at all. Voltage across just the 9ohm resistor will be 8.1V and .9V across the 1ohm resistor. Total dissipated power drops to 8.1W. Where in this process does the voltage increase?
A real battery has an internal series resistance due to the inner chemicals components which aren’t perfect conductors, that internal resistance exerts that voltage drop, I’m sure he was writing about that real case.
Have a nice day.
Massimo
I don’t think that fact was at all clear. Even so, I’m not sure how that’s relevant. Even if we assume he was referring to an actual battery with internal resistance (which would just be modeled as an additional resistance in the circuit), at no time will the voltage measured across the terminals increase unless your initial conditions assume a tiny external resistance compared to the internal. If that was the example’s assumed initial state then it was a poor example.
scott-
A 1.2V NiCad with a 0.2 Ohm internal resistance and 1 Ohm external load will drop 0.2V internal, 1.0V external.
With a 2.2 Ohm external load the drops are 0.1V internal, 1.1V external.
doh!
OK, that makes sense. When I read the original comment I thought he was trying to say that a 1V cell could under certain conditions generate a 1.1V drop.
Christopher Game-
Svensmark’s idea of solar modulated cosmic ray cloud formation is a fair analogy for small signal power amplifier. And of course positive feedback to the sun is negligible.
Salvatore,
“By reflecting solar radiation back to space (the albedo effect of clouds) and by trapping infrared radiation emitted by the surface and the lower troposphere (the greenhouse effect of clouds), clouds exert two competing effects on the Earth’s radiation budget. These two effects are usually referred to as the SW and LW components of the cloud radiative forcing (CRF). The balance between these two components depends on many factors, including macrophysical and microphysical cloud properties. In the current climate, clouds exert a cooling effect on climate (the global mean CRF is negative). In response to global warming, the cooling effect of clouds on climate might be enhanced or weakened, thereby producing a radiative feedback to climate warming (Randall et al., 2006; NRC, 2003; Zhang, 2004; Stephens, 2005;”
A bit part of the problem, as Christopher points out, is the language itself and the concepts the language is attempting describe.
IMO, the biggest flaw in the whole way the concept of feedback is framed in climate science is that’s it’s more akin to that of a static steady-state system rather than a dynamic one (which the climate system is). For example, the net cooling effect of clouds on global average is a dynamic average — not a static average, yet the feedback issue surrounding clouds is framed as though it’s a static average whose change upon a change in the energy balance, like from 2xCO2, is unknown or a big mystery.
Whether the net effect of clouds on average is to cool or warm depends on the SW reflective properties of the surface – not the SW reflective properties of the clouds themselves (or the combination of SW and LW properties of the clouds themselves).
This is clearly illustrated by the following plot of cloud cover vs. surface temperature. Note that the ‘cloud amount’ is independent of the type of clouds that make up the amount:
http://www.palisad.com/co2/sens/st_ca.png
Do you see how at temperatures above about 0C, the net effect of clouds on average is to cool, and below about 0C the net effect of clouds is to warm? That is above 0C, the more clouds there are the cooler it is on average, and below about 0C, the more clouds there are the warmer it is on average?
Snow and ice and snow are roughly as reflective to solar energy as clouds are and generally only persist at temperatures at or below 0C. The net effect of clouds switches from warming to cooling at about the same point that the surface becomes less reflective than the clouds above?
Can you see the fundamental physical mechanism behind this?Above about 0C, clouds are more reflective than the surface, so the net effect of clouds is to cool by reflecting more solar energy away than is delayed beneath them (i.e. re-directed back toward the surface). Below about 0C, clouds are about equally reflective to solar energy as the surface is (due to snow and ice), so the net effect of clouds is to warm by delaying more energy beneath them than is reflected away in total. Clouds on average are much more opaque to outgoing infrared radiation emitted from the surface and lower atmosphere than the clear sky is.
In short, The inflection point around 0C is where the net effect of increasing/decreasing clouds switches from warming to cooling. The net effect at and above the current global average temperature is unambiguously to cool.
That should have read:
For example, the net cooling effect of clouds on global average is a dynamic average — not a static average, yet the feedback issue surrounding clouds is framed as though it’s a static average whose net behavior upon a change in the energy balance, like from 2xCO2, is unknown or a big mystery.
Sorry, there are a lot of typos I missed in that message. Was in a bit of hurry.
This graph:
http://www.palisad.com/co2/sens/st_ca.png
…is about 3 decades worth monthly average sample points (the orange dots) for each grid area.
Entire message edited:
Salvatore,
“By reflecting solar radiation back to space (the albedo effect of clouds) and by trapping infrared radiation emitted by the surface and the lower troposphere (the greenhouse effect of clouds), clouds exert two competing effects on the Earth’s radiation budget. These two effects are usually referred to as the SW and LW components of the cloud radiative forcing (CRF). The balance between these two components depends on many factors, including macrophysical and microphysical cloud properties. In the current climate, clouds exert a cooling effect on climate (the global mean CRF is negative). In response to global warming, the cooling effect of clouds on climate might be enhanced or weakened, thereby producing a radiative feedback to climate warming (Randall et al., 2006; NRC, 2003; Zhang, 2004; Stephens, 2005;”
A bit part of the problem, as Christopher points out, is the language itself and the concepts the language is attempting describe.
IMO, the biggest flaw in the whole way the concept of feedback is framed in climate science is that it’s more akin to that of a static steady-state system rather than a dynamic one (which the climate system clearly is). For example, the net cooling effect of clouds on global average is a dynamic average — not a static average, yet the feedback issue surrounding clouds is framed as though it’s a static average whose net behavior upon a change in the energy balance, like from 2xCO2, is unknown or a big mystery.
Whether the net effect of clouds on average is to cool or warm depends on the SW reflective properties of the surface – not the SW reflective properties of the clouds themselves (or the combination of SW and LW properties of the clouds themselves).
This is clearly illustrated by the following plot of cloud cover vs. surface temperature. Note that the ‘cloud amount’ is independent of the type of clouds that make up the amount:
http://www.palisad.com/co2/sens/st_ca.png
Do you see how at temperatures above about 0C, the net effect of clouds on average is to cool, and below about 0C the net effect of clouds is to warm? That is above 0C, the more cloud cover there are the cooler it is on average, and below about 0C, the more cloud cover there are the warmer it is on average?
Snow and ice and snow are roughly as reflective to solar energy as clouds are and generally only persist at temperatures at or below 0C. Note the net effect of clouds switches from warming to cooling at about the same point that the surface becomes less reflective than the clouds above.
Can you see the fundamental physical mechanism behind this?Above about 0C, clouds are more reflective than the surface, so the net effect of clouds is to cool by reflecting more solar energy away than is delayed beneath them (i.e. re-directed back toward the surface). Below about 0C, clouds are about equally reflective to solar energy as the surface is (due to snow and ice), so the net effect of clouds is to warm by delaying more energy beneath them than is reflected away in total. Clouds on average are much more opaque to outgoing infrared radiation emitted from the surface and lower atmosphere than the clear sky is.
In short, the inflection point around 0C is where the net effect of increasing/decreasing clouds switches from warming to cooling. The net effect at and above the current global average temperature is unambiguously to cool.
That helps so much. Now I understand what you mean when you said radiative forcing opposes net radiative feedback.
Thanks
I have carefully studied your recently published papers and I agree that they provide strong evidence that climate sensitivity is very much lower than indicated by climate models. Your Lag-Regression vs SST Fig. 3 of this post confirms this.
However, the caption to Figure 2 incorrectly says “Three-month global ocean anomalies”. The spreadsheet you provide shows that each curve is actually plotting the centered five-month averages, not three-month averages. The columns are incorrectly labeled “3-mon”. Example, cell AB25 is average(V23:V27), which is 5 months.
Figure 1 correctly says “Three-month anomalies…”.
oops. I know I was playing around with both types of averaging…sorry for the confusion.
The travesty of physics continues all right …
A new study (published in this book) refutes the claim that water vapor causes greenhouse warming. Water vapor is supposed to be the most prolific greenhouse gas but real world temperature and rainfall records show that it cools rather than warms. So too would carbon dioxide.
Back in the 19th century it was suggested that the reason we observe cooler temperatures as we go up high mountains is because the force of gravity acts upon individual molecules and affects the air temperature in that region. The temperature may be thought of as relating to the speed at which these air molecules move, and so, if they are “falling” they gather speed and end up being warmer, or if they are rising they cool.
In recent years an interesting device was invented in which air is forced through this “Ranque Hilsch vortex tube” in a helical motion that creates a very strong artificial gravity field due to centrifugal force. The center of the tube is like the top of that mountain and, indeed, the air in the tube is cooled in the center and warmed at the outside. So this “gravito-thermal” effect, as it is called, is clearly demonstrated to be a reality in the vortex tube, just as it is in a planet’s atmospheric troposphere.
The laws of physics can be used to explain just how and why this temperature gradient is formed by gravity, and it is found on all planets with atmospheres. But its existence has been overlooked by so-called “climatologists” who have assumed that Earth’s troposphere would have had uniform temperatures throughout if it had not been for so-called “greenhouse gases” like water vapor, carbon dioxide, methane and a few other radiating gases somehow warming the surface with energy sent from the far colder atmosphere.
So, disregarding the laws of physics concerning this temperature gradient, climatologists have tried to explain why the Earth’s surface is in fact hotter than the average temperature in the troposphere. It seemed to make sense that the Sun heats the surface which then warms the air, but the Sun’s rays mostly pass through the thin surface layer of the oceans. Nearly all the “heat” in the atmosphere is “trapped” not in radiating molecules but in non-radiating air molecules (mostly nitrogen and oxygen) which then collide with radiating molecules, transferring energy to those “greenhouse gases” so they can then radiate it away to space.
The trouble is, that the Sun could not actually warm the surfaces of planets to the temperatures we now know exist. For example, there just is not anywhere near enough solar radiation entering the Venus atmosphere to raise the surface temperature by hundreds of degrees. The atmosphere cannot magnify the incoming energy at the top and send more out of the base of the atmosphere and into the surface. Yet the surface of Venus does get a few degrees hotter during its four-month-long daytime.
So herein lies a serious dilemma which led author Douglas Cotton to call upon his knowledge of physics from his science degree and subsequent studies, coupled with considerable research into “climate science” and then to put together a ground-breaking hypothesis in a new book entitled “Why it’s not carbon dioxide after all.” Physicists, who seem not to have been consulted much by climatologists, are now starting to realize that the much-touted “greenhouse effect” is in fact a seriously flawed conjecture, and this is what a retired physics educator* wrote about the book:
“Essential reading for an understanding of the basic physical processes which control planetary temperatures. Doug Cotton shows how simple thermodynamic physics implies that the gravitational field of a planet will establish a thermal gradient in its atmosphere. The thermal gradient, a basic property of a planet, can be used to determine the temperatures of its atmosphere, surface and sub-surface regions. The interesting concept of “heat creep” applied to diagrams of the thermal gradient is used to explain the effect of solar radiation on the temperature of a planet. The thermal gradient shows that the observed temperatures of the Earth are determined by natural processes and not by back radiation warming from greenhouse gases. Evidence is presented to show that greenhouse gases cool the Earth and do not warm it.”
“Why it’s not carbon dioxide after all” could potentially free the world of all concern that carbon dioxide is causing warming.
In fact, all such warming ceased around the turn of the century and the world is currently enjoying a very slight cooling trend, which the author expects to continue for about 30 years into this century. Yes, there will probably be another half degree or so of warming spread over the following 30 years, but 500 years of long-term cooling is likely to commence within the next 100 years or so, all due to natural cycles possibly regulated by planetary orbits and solar cycles. The book is available through Amazon and Barnes & Noble in paperback, and also in $8.95 e-versions from these distributors as well as for iPad and iPhone.
*John Turner B.Sc.;Dip.Ed.;M.Ed.(Hons);Grad.Dip.Ed.Studies
“As long-time loyal readers of my blog are aware, the regression relationships at zero time lag are what are traditionally used to estimate feedbacks in the climate system, a methodology which I (and Lindzen) believe is seriously in error.”
Yes. Dessler’s analysis assuming zero lag time was just awful.
It’s not about radiative forcing, Roy. You have shown yourself that when cloud cover reduces there is a subsequent surface warming a few months later. Pretty obvious to me, Roy. More sunshine gets through (with fewer clouds) and gradually warms the ocean thermocline regions. The results show at the surface months later of course. And it’s all to do with the fact that water vapour is negatively correlated with surface temperature.
Radiative imbalance at TOA is the result of totally natural warming or cooling. It is not the cause.
What it is about, Roy, is …
Gravity, bringing about …
thermodynamic equilibrium, with its …
gravitationally induced thermal gradient …
that then allows “heat creep” to ..
raise the temperature of Venus and …
Earth
Dr. Spencer,
Very interesting analysis, thank you, a couple of observations if I might;
Christopher Game makes several good observations regarding electronic circuit feedback concepts. Most importantly is that there is never any “energy gain” in an electronic amplifier. Yes, a perfect amplifier can “control” the voltage across a varying load with the current varying as a result. But the energy flowing through the amplifier and the load is never amplified. For example a voltage amplifier can be configured (via positive feedback) to hold the voltage at 10 volts (DC or AC) regardless of the current required by the load. If the load requires 1 kilo Watt hour during day 1 and 10 kilo Watt hours hours during day 2 whatever power supply is driving the amplifier and the load will have to deliver 1 kilo Watt hour (plus some loss in the amplifier) during day 1 and 10 (plus some loss) during day 2.
Additionally, it is important to remember that the absolute radiometric values reported by any broadband radiometer are only correct for exactly the same spectral shape that was used to calibrate it. A broadband radiometer (like a silicon photodiode) has a “spectral response” that is not in fact flat across the spectrum. The reported radiometric value is the current out of the photodiode which is an integral of the source spectral shape and the sensor’s spectral response.
So if you calibrate a photodiode using (for example) a 3100 K color temperature reference source and then point it at a 3200 K source the absolute radiometric values reported are in fact wrong. I have seen a color temperature difference of 20 degrees K result in absolute radiometric errors approaching tenths of a percent.
I admit that I am not exposed to all of the technical details involved in the satellite sensors you are relying on, but there is something to remember, generally (a broad statement that may not apply to all radiometric measurements) it is impossible to do “absolute radiometric” measurements with a radiometer (ironic isn’t it). It requires additional spectral information obtained from a spectroradiometer.
In fact if you purchase an “absolute radiometric standard” from NIST (currently about $15,000 for a visible source) you get a $25 light bulb with spectroradiometric measurements across many spectral points (about 25 nanometers apart).
For electrical engineers this is most akin to the difference between an old fashioned AC voltage meter and a modern “True RMS” voltage meter. To get the “True RMS” you need “frequency component” information. To get the “True Radiometry” you need “spectral component” information. Spectrum/Frequency, it is the same concept just different wavelengths.
So, given the very small anomalies shown in your Figure 2, it is possible that these are actual observations from the system (i.e. the climate), BUT it is also possible that they are simply calibration errors inherent with attempting to measure absolute radiometric values with a broadband sensor.
It is indeed very tempting to “see” a signal in that plot, but the values are SO SMALL, it could simply be calibration errors.
Finally, attempting to “tease out” individual feedback components in a complex system is very difficult, nay impossible for the climate. There is just way too much going on, fluxes to the right of me, fluxes to the left, all going every which way at once.
In complicated electro-mechanical systems (motors attempting to hold an airplanes tail fin in an exact position for example) there are so many “feedbacks” going on in parallel (air drag, momentum of the tail fin, stiction in the bearings, resonances in the structure, etc. etc.) that most modern control theory is done exclusively in frequency space.
For example, a finite element analysis (model) will predict that the structure has a resonance (it shakes wildly) at 30 Hertz, so the designers attempt to design the control loop so there is no power gain at that frequency.
Cheers, Kevin.
KevinK is kind to say that I made some good observations, but reading his comment makes it clear that I failed to convey my message about what an amplifier does.
Perhaps I misread his comment, and I am not sure what KevinK means by his words “energy gain”, words that I did not use. But my idea is that an amplifier has available to it an arbitrarily accessible power source, for example a battery, or the mains power supply, that can be drawn upon to add power to the signal. I think contrary to KevinK’s reading of my comment above, though I would not use those exact words, I am saying that it is of the essence of an amplifier that it provides energy gain, in a sense. It adds energy to the signal. That is its prime function. I would say that KevinK was describing an ideal voltage source, with a fixed controlling input, not an amplifier in general. Of course the ideal voltage source can have an amplifier inside its inner workings. KivenK would rightly say this latter is a way of “configuring” an amplifier. Of course we agree that energy is conserved. The added energy is supplied by the arbitrarily accessible power source.
It is in the atmosphere that I am saying there is no energy gain. There is no power supply to drive it. The atmosphere is not an amplifier.
Also I have to reject KevinK’s suggestion that “a voltage amplifier can be configured (via positive feedback) to hold the voltage at 10 volts (DC or AC) regardless of the current required by the load.” I have to say that a negative feedback configuration is the one for that. Positive feedback would not help. Perhaps that was a typo by KevinK?
“It is in the atmosphere that I am saying there is no energy gain. … The atmosphere is not an amplifier.”
Yes, and that’s why the atmosphere of Venus does not amplify the energy which comes in from the Sun at the top and send more out at the bottom and into the surface. The radiative flux that comes out at the surface interface is in fact far less – being only about 10% of what Earth’s surface receives. No amount of back and forth radiation between the surface and the atmosphere can amplify this radiative flux from about 20W/m^2 up to about 16,000W/m^2 which is what would be required if it were radiation that raised the temperature of the Venus surface by 5 degrees during its four-month-long daytime.
Can anyone (Roy included) explain the Venus dilemma, which I have in my book?
…and yet the Sun, the interior of which produces thermal heating at a rate less than the human body does (on a per mass basis), can achieve temperatures of thousands to millions of degrees.
Extremely high temperatures can be achieved by either (1) increasing energy input, or (2) decreasing energy output (which is what the Sun, and Venus do).
The “greenhouse effect” is behind door #2, Doug. Greenhouse gases increase the vertical temperature gradient: they increase temperature (on the heated surface side of the air layer), and decrease temperature (away from the heated surface).
…and there is no “Venus dilemma”, Doug…except maybe in your conceptual understanding….physical, time-dependent models exist which fairly accurately reproduce the vertical temperature profile of Venus, which has been measured.
No they don’t Roy.
You cannot create energy. None of the models discuss the fact (let alone explain it) that the Venus temperature actually rises by 5 degrees at any given location on the equator as it passes through 4 months of sunlight.
For that to happen there must be an energy input. You cannot get this by radiation from the Sun, because it would have to be about 16,000 W/m^2. The solar radiation reaching the surface of Venus is less than about 20W/m^2 based on estimates made from actual measurements by Russian probes dropped to the Venus surface.
And none of the required thermal energy can come by way of radiation from the colder atmosphere because, if it could, entropy would decrease.
The way it gets there is explained by just one other author and myself who independently arrived at the same conclusion.
And, by the way, the centre of the Sun also retains thermal energy because of its huge gravity and the gravitationally induced thermal gradient.
The gravito-thermal effect is now proven empirically, Roy, in the Ranque-Hilsch vortex tube where it is blatantly obvious in the cross section of the tube.
And I have proved why the thermal gradient exists just by using standard physics, Roy. That’s why I told you last year that your Item 6 in your “Misunderstood … ” article is wrong. Now that there is empirical evidence, will you agree to correct it as you said you would if proven wrong. You are proven wrong Roy.
And no, Roy, to the “decreasing energy output” business. Any location on the equator of Venus cools by 5 degrees during the 4-month-long Venus night. This proves that Venus could have cooled right down in a few hundred years if the Sun’s radiation stopped. The fact is that the Sun warms it back up by 5 degrees during its day.
That latter process of warming from 732K to 737K is what cannot be explained by radiation. Radiation is not the primary determinant of planetary atmospheric and surface temperatures.
The reasons are explained in great detail in my book.
Remember, Roy, that my study shows that increasing water vapour causes lower mean daily maximum and minimum temperatures – just the opposite of what Al Gore would like you to believe in order to serve his personal pecuniary and political interests.
Dear Douglas,
As a geologist I know that our planet has had a rather constant amiable temperature for life to develop as we know it. The reason global temperature has been within tight bounds with exception of polar regions, is due to the fact that Earth is a water planet.
Thanks to the three phases of water, i.e. gas, liquid and solid and the energy transfer between the phases, water seems to form a perfect thermostat. Furthermore, clouds are the actual regulators, which is clear from the comments above.
I do, however, have a dilemma, which has to do with the IPCC insisting that greenhouse gases are causing global warming. Howver, we all know that there is a stasis in warming for over 15 years, so how come heat is escaping into ocean deeps just during the past years and not previously. Could this be due to the fact that IR-backradiation cannot penetrate into the oceans beyond the topmost molecular film of water and that no heat has escaped into abyssal depths.
A little off topic but included in the article:
“In science, diversity and controversy are essential to progress and therefore it is important that different opinions are heard and openly discussed.” This is a quote from the journal editor in his resignation letter to the journal that published Dr. Spencer’s paper. Something is really, really flawed here. The quote is the truth- and whenever the AGW clique cite consensus remember this individual in hind sight wanted to suppress the alternative perspective and publically stated he should not have published the paper because a small scale correlation does not overthrow the greater body of work (he never said the data was bad)! I agree with the point, a big claim requires big data, but if the peer review process filters for contrarian arguments driven by valid data and predetermines they are not relevant, then science cannot progress and build a bigger story. This is no longer science by the exclusion of the diversity and controversy that are an essential part of science his own quote. I feel the same process is occurring in multiple fields and collectively there is a counter argument to AGW that is data driven.
For example, the idea that cosmic rays impact the Earth’s climate has been mostly disregarded by the IPCC and friends as well:
http://www.sciencedirect.com/science/article/pii/S1364682697000011
My personal research was partially tied to this issue because my data collecting inadvertently found that there was abundant empirical data for the 22 to 24 year Hale cycle, which relates to the Sun’s magnetic field flux and ultimately cosmic rays. The Hale solar cycle drives the sunspot cycle but does not directly impact the sun’s irradiance, and therefore represents a component of solar flux that is not included in the models. The Hale cycle is present in the proxy data is common from spectral analysis of tree rings and lacustrine varves (see the review of all the places I found this periodicity and why I called it well known). I agree- the presence of this periodicity in relevant data is not a silver bullet, but the other side should be allowed representation.
http://link.springer.com/article/10.1007/s10933-008-9244-0#page-1
Then consider the association between solar events like the Mounder and Dalton solar minimums and the associated cool phase- again caution with correlation and causation, but there is a case that just doesn’t get considered.
http://www.sciencedirect.com/science/article/pii/S0037073804002507
Three years ago I wrote on my website: “In 1981 NASA’s Dr James Hansen made a huge mistake: he assumed that the Earth’s surface acts like what physics calls a “blackbody.” But a blackbody has to be surrounded by space, or totally insulated so that it cannot lose “heat” (which should be called thermal energy) by conduction or other means to its surrounds. … But the surface is continually transferring heat to the atmosphere by conduction and other non-radiative processes. Besides, the surface layer of the oceans (say 1cm thin) is nearly transparent.”
But, but, but … the reality is that the greenhouse gas water vapour cools and does not warm the surface at all, as a study shows.
To calculate the climate sensitivity you simply need a large persistent forcing over a short time frame.
The 5% decrease in cloud cover shown the ISCCP data is exactly this.
Each percent decrease in cloud cover produce a temp increase of 0.06 deg C
The 5% decrease in clouds in 13 years, represents a forcing of 0.9w/m2 and yet there was only 0.4 deg increase in temp over the entire 30 year satellite period.
Assuming that 0.3 degrees was due to this cloud forcing then it takes 3 w/m2 per degree of warming, very close to neutral feedback.
Ole Humlum has the background on his climate4you.com site under climate and clouds.
I just calculated the obvious climate sensitivity from it.
the trouble with this approach, Robert, is there is no way to know how much of the cloud change is forcing versus feedback. That’s the conundrum that will always be tripped over.
The IPCC (Trenberth, Dessler, and others) will claim that any cloud change you see is all feedback (in response to a temperature change).
You are instead claiming it is all forcing (of temperature change).
I say it is an unknown combination of the two.
“The IPCC (Trenberth, Dessler, and others) will claim that any cloud change you see is all feedback (in response to a temperature change).”
Roy
This is clearly false. Cloud formation needs cloud seeds and this is affected by aerosols which are natural and man-made. Obviously cloud cover is also a forcing as it is not solely dependent on temperature change.
“That’s the conundrum that will always be tripped over.”
Especially when you’re dealing with such small surface temperature changes averaged over the globe.
Thresholds must be considered which is often neglected.
Sometimes a forcing put on the climate does not appear to have a significant effect on the climate because threshold levels of that forcing have not been met.
This can obscure climate sensitivity to that forcing in my opinion.
Dr Spencer and Responders,
Your back and forth debate is so healthy in learning about
climate.True Science is based on learning and discussing.
To all of you….keep up the good work your submissions are
really valuable.
Dr. Spencer you are priceless!!!
God Speed and Happy Easter to all.
Dr Spencer writes:
“As long-time loyal readers of my blog are aware, the regression relationships at zero time lag are what are traditionally used to estimate feedbacks in the climate system, a methodology which I (and Lindzen) believe is seriously in error. Since feedbacks determine climate sensitivity, and sensitivity determines how much anthropogenic global warming there will be, this is a critical issue.”
Of course he is completely right in that. Completely right.
It would be a joke if it were not so harmful, that people might restrict their assessment of regression relationships to zero time lag.
But I would add that the time-lagged regressions should be shown for many years, say 15 years before and after zero lag. The reason is that this shows in a glaringly obvious way that the graphs are practically uninterpretable as guides to the causal linkages between the variables and underlying system dynamics. Glaringly obvious that they are practically uninterpretable. The regressions do not decay rapidly to zero magnitude, which means that the simple linear analysis is not going to be very helpful as a guide to the causal linkages and underlying system dynamics. Instead of quickly decaying to zero, the regressions continue to show large swings unabated even for long lags. I think it wise to extensively and explicitly show these long-lag swings, to help people see why the results of these methods are practically uninterpretable.
It is an experience of some sciences, that in order to understand the system dynamics, one really needs to know the actual causal linkages in advance of looking more closely at the time histories. One needs to know the mechanisms, punto. Recognized as sadly and painfully true in some sciences. It seems that climate science falls prey to this problem too.
The hardest mechanism to pin down perhaps is cloud formation. I think this is an intrinsically difficult one. It is as if the system tries everything simple, and eventually passes the buck to cloud formation. There are things such as supersaturation instabilities that make it hard.
Christopher,
The data strongly suggests the net average effect of clouds is tied to surface reflectivity above all else. When the surface is snow and ice free, the net effect of clouds is to cool, i.e. more energy is reflected back to space than is delayed beneath, and when the surface is composed of snow and ice, the net effect of clouds is to warm, i.e. more energy is delayed beneath than is reflected away in total (because snow and ice are roughly as reflective to solar energy as clouds are).
This relationship is undeniable in the measured response of cloud cover vs. surface temperature:
http://www.palisad.com/co2/sens/st_ca.png
The inflection point around 0C is where the net effect of increasing/decreasing clouds switches from warming to cooling.
You really don’t need to model specific cloud formation processes to determine what the net average effect of clouds will be on incremental warming. Moreover, cloud formation is largely chaotic and can’t really be modeled to the level of accuracy needed anyway.
This plot here of atmospheric water density (from the same data set) provides additional insight:
http://www.palisad.com/co2/gf/st_wc.png
At approximately the same point that the clouds start to increase again as the temperature increases is also where increased water content no longer results in further rise in temperature. Can you see the fundamental physical mechanism(s) behind this? That is, beyond a certain temperature (about 300K) there is so much water being evaported, removing so much heat from the surface as the latent heat of evaporation, providing so much ‘fuel’ (i.e. water) for cloud formation, that the combination of cloud caused (from solar reflection) and evaporative caused cooling appears to completely overwhelm any increase in atmospheric opacity from increased water vapor.
This not only suggests the net feedback is negative, but is most strongly negative in the tropics.
For the plots each small orange or brown dot represents a monthy average for one grid area for a 2.5 degree slice of latitude. The green and blue dots are the 25 year averages for each 2.5 degree slice of latitude. From right to left, it goes from the tropics to poles.
Thanks, Dr. Spencer. Very good article.
You write:
“global average SST is reasonably well correlated with ENSO activity”.
Yes, so much that, as you show, one could have a not too bad approximation of global LT temperatures by looking at the MEI.
I think the evidence for an ocean-controlled Earth climate is now much more convincing than the opposite for a CO2 temperature control.
The climate system is constantly out of balance, and without knowing how much internal radiative forcing is occurring, you can’t know the size of the net feedback. Radiative forcing always opposes net radiative feedback, and if forcing is occurring, any estimate of feedback is biased in the direction of positive feedback (high climate sensitivity).
Dr. Spencer then says (which was very helpful) NET radiative feedback includes the Planck effect, increasing IR loss due to temperature alone, which always overwhelms any positive feedbacks.
Given the above and thru SIMPLE observation is it fair to say that radiative forcing trumps NET radiative feedbacks,
Although net radiative feedback will LIMIT the radiative forcing effects?
Is it also fair to say many internal climatic feedbacks will aid radiative forcing?
Case in point the AVERAGE distance the earth is from the sun will determine the average global temperature all other items considered equal, DESPITE the fact that the earth will radiate more or less IR radiation (acting against radiative forcing) out to space if the earth were warmer when closer to the sun or cooler when further from the sun.
In addition at the same time we have internal climatic feedbacks which would sometimes aid radiative forcing.
Examples would be ice cover changes, snow cover changes , cloud cover changes ,in response to radiative forcing changes. .
Bottom line being the EXTERNAL RADIATIVE FORCING on the climate system rules the day, although it can be limited by net radiative feedback.
This is my understanding .
I read this article again I don’t think what I said in my previous post applies to what you are driving at.
The climate system is constantly out of balance, and without knowing how much internal radiative forcing is occurring,
Internal is the KEY word.
I find this part of climate very complex and hard to grasp.
I will admit it.
I think when an article is presented like this over the site that extreme clarification should be made about all the terms that are being used.
“NET radiative feedback” includes the Planck effect (increasing IR loss due to temperature alone), which always overwhelms any positive feedbacks. If it were not so, the climate system would be unstable to perturbations, which it is not (nor are any of the IPCC climate models.
Dr. Spencer says and I agree yet (I am playing devils advocate here) we know from past climate history that the climate system is not stable and at times positive feedbacks take control of the climate. If not why then have there been glacial and inter glacial periods along with abrupt changes in the climate and what brings those positive feedbacks to end rather then keep going in the same direction once they get started, that causes the earth to swing from glacial to inter glacial or have an abrupt climate change ???
I say how could random chaotic episodes revert the process once it got started? I mean given no external influence on the climate logic tells me once the climate system were to go in an x direction one would think that x direction would built upon itself and not somehow thru randomness not only stop going in that direction but actually revert to an entirely opposite direction.
MY TAKE
This is why I keep coming back to solar activity, Milankovitch Cycles, the beginning state of the climate and the earth’s magnetic field.
I think all of the factors above or some combination of them if they change in degree of magnitude or duration of time which is strong enough long enough in duration(SOLAR/EARTH MAGNETIC FIELD)combined with where the earth is in relationship to MILANKOVITCH CYCLES/BEGINNING STATE OF THE CLIMATE will cause changes to the climate system through promoting positive feedbacks (THROUGH PRIMARY AND SECONDARY MEANS) that are able to overcome the inherent negative feedbacks in the climate system of the earth.
If not why would the climate of the earth change from glacial to inter glacial and why once the climate changed in an x direction would it not only keep going in that x direction forever but revert eventually to an entirely different direction, not to mention sometimes stay stable for long periods of time while at other times change abruptly?
JUST RANDOMNESS IN THE INTERNAL CLIMATIC SYSTEM OF EARTH IS NOT ENOUGH.
I emphasize random fluctuations internal to the climate system because they are ignored in feedback analysis and, as we have published, neglecting them leads to diagnoses of climate sensitivity which are too high.
I never implied they are all that is going on….although I still believe they *might* dominate climate variability.
I remain skeptical that we really know the connection between Milankovitch cycles and Ice Ages & interglacials. Yes, it is possible that feedbacks change over time, and the positive feedbacks can at least temporarily put the climate system into a new state.
But this is all so very speculative that I loathe it being called “science”…it’s not much better than astrology.
“Dr. Spencer says and I agree yet (I am playing devils advocate here) we know from past climate history that the climate system is not stable and at times positive feedbacks take control of the climate. If not why then have there been glacial and inter glacial periods along with abrupt changes in the climate and what brings those positive feedbacks to end rather then keep going in the same direction once they get started, that causes the earth to swing from glacial to inter glacial or have an abrupt climate change ???”
It wouldn’t assume those changes are mostly caused by net positive feedback. One positive feedback we know that operates from glacial to interglacial is the melting of surface ice, but most of that effect was used up as we left the last glacial maximum. Now, the remaining ice is centered around the poles which don’t get much Sun and are dark 6 months of the year.
Also, as mentioned in my posts above, the net effect of clouds depends on surface reflectivity of solar energy. If anything, in a warming world there would be a little less snow and ice covered surface, so it stands to reason the net effect of clouds will remain to cool on incremental global warming. I think so few, including Roy, are willing to accept this because it’s too embarrassingly simple.
All I know is this subject is amazingly elusive when trying to pin down causes and effects will give the x result.
Dr. SPENCER says, But this is all so very speculative that I loathe it being called “science”…it’s not much better than astrology.
My only reply is we have to THINK of reasons and then explore them even if they are speculative. If not how else could we go about trying to solve the climate mystery.
I think all theories start out as speculation and then the speculation is proven correct or incorrect over time.
Roy W. Spencer says, April 17, 2014 at 5:19 AM: …and there is no “Venus dilemma”… physical, time-dependent models exist which fairly accurately reproduce the vertical temperature profile of Venus, which has been measured.
Roy, I would be very grateful if you could let me have references to support this. Many thanks. [email protected]
D Cotton says, April 16, 2014 at 7:57 PM: …air is forced through this “Ranque Hilsch vortex tube” in a helical motion that creates a very strong artificial gravity field due to centrifugal force…the air in the tube is cooled in the center and warmed at the outside. So this “gravito-thermal” effect, as it is called, is clearly demonstrated to be a reality in the vortex tube, just as it is in a planet’s atmospheric troposphere.
Doug, whatever the merits of your atmospheric gravito-thermal proposal and your corresponding thermal diffusion hypothesis, I think that the Ranque Hilch vortex tube does not provide a helpful analogy. I suspect that your detractors will simply have a field day pointing out that a gas cools as it decompresses in accordance with the ideal gas laws, so one would expect a continuing thermal profile to be established all the way from the hotter highly compressed outer layer of the vortex towards the colder less compressed centre, maintained at steady state by the continuing steady flow of high pressure air into the vortex tube.
Most physicists would support the notion that the atmospheric (dry adiabatic) lapse rate is a simple mathematical consequence of the trade-off between molecular KE and PE in a gravitational field. So you really don’t need something as exotic (and diversionary) as the Ranque Hilch vortex tube to make your point.
But the lapse rate only tells us the difference in temperature between one level and another. The absolute values of the temperatures up the atmospheric column are determined by something else: the net flow of energy into the atmosphere both from the ground and from the Sun which (assuming a steady state atmospheric profile) are balanced by the net flow of energy via radiation to space.
In my view that is where your argument should be focussed. Diversions into Ranque Hilch are in danger of confusing people and are therefore counterproductive.