With the hopes of an El Nino fading (now reduced to a 58% probability), and what could be another early start to an unusually cold and snowy winter, it is useful to take a step back and examine why some of us have been harping for years on what really controls North American climate variations on the timescale of your lifetime: natural climate cycles.
The most prominent of these are the Pacific Decadal Oscillation (PDO) and the Atlantic Multidecadal Oscillation (AMO).
Not only do these cycles profoundly influence North American climate, there is considerable evidence that they are partly responsible for that popular hobgoblin, “global warming”.
As the following graphic shows, the PDO — which was originally discovered as the main control over fisheries productivity off the west coast of North America — is also related to periods when global temperatures were rising or falling, which tend to occur over ~30 year periods:
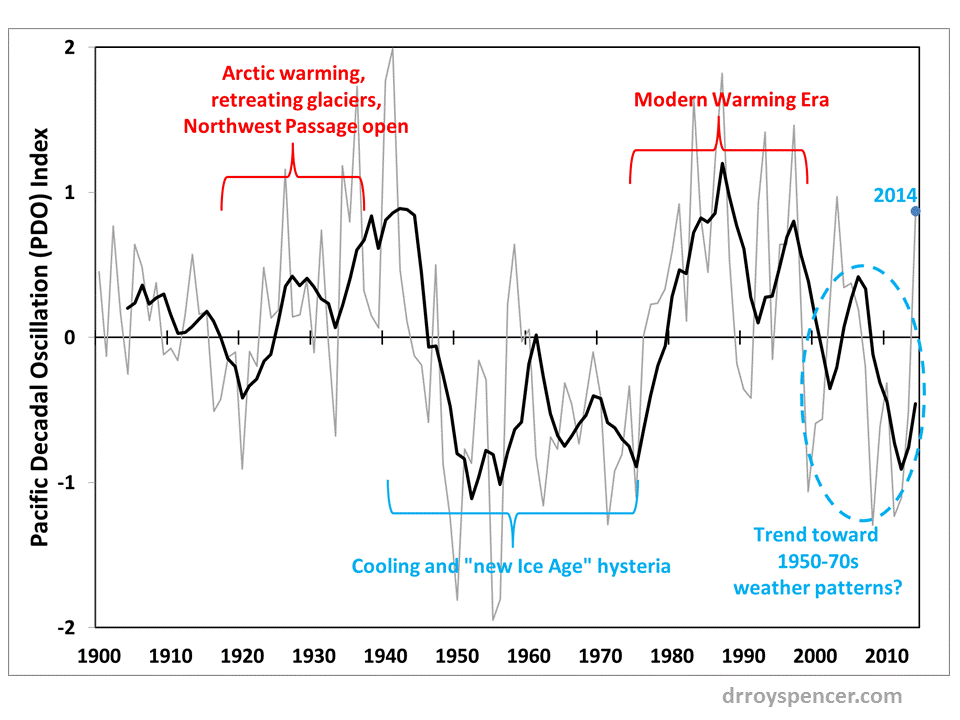
Yearly Pacific Decadal Oscillation values, and the corresponding periods of popular climate change awareness (light gray is yearly values, dark line is 4-yr trailing averages).
We aren’t sure how this happens, but small natural variations in global average cloud cover changing how much sunlight is let into the climate system are a strong possibility.
The issue is important because, to the extent that natural climate cycles are partly responsible for recent global warming, the less reason there is to be concerned about energy policies which reduce the use of fossil fuels, currently necessary for human prosperity. With today’s news that President Obama will continue to pursue executive action on climate change, while not requiring equal commitments from the largest greenhouse gas emitter China, it is important that people understand that most of what we experience in terms of weather and climate change is largely out of our control.
The trouble with including natural climate cycles in the national discussion of global warming is both political and scientific: (1) it doesn’t fit the global warming narrative driven by policy goals, and (2) we don’t understand what causes natural climate cycles, and so they cannot be included in computer climate models.
Government research funding for at least 25 years has hinged on the assumption of human causation, and as I have always said, if you fund scientists to find a connection, they will indeed find it. That’s why the resulting research that is published also is dominated by explanations involving human causation.
Nevertheless, it is fairly easy to show that natural cycles are indeed involved in not only regional changes, but “global warming” as well.
For example, the accompanying spreadsheet shows that over the most recent warming period (since the late 1970s), the PDO, AMO, and El Nino/La Nina activity can statistically account for most of the recent warming of global average sea surface temperatures.
But statistics aren’t enough. Since we understand that carbon dioxide is a greenhouse gas, and should cause some warming, but we don’t understand natural climate cycles, scientists only look where the streetlight of government funding illuminates the problem: CO2.
What complicates policymaking even further is that what motivates public perceptions and thus decision makers the most are weather events. Hurricane Sandy. A snowy winter. We end up blaming these on the only thing we thing we think we understand — increasing CO2 should cause some change, so it must be responsible for all of the change we see.
Those natural cycles — well documented in the scientific literature for at least their regional effects — are forgotten. Except by some of us who have been working in the climate field for at least a few decades. Ask Weatherbell’s Joe Bastardi, who has been talking about these natural cycles for years — and using them to make good long-range forecasts.
The recent admission that natural changes are responsible for the California drought was not news to some of us. What is news is that some pretty big research names that would be assumed to be part of the global warming bureaucracy are the ones now saying it.
So, as the unseasonal cold settles in over the U.S. this week, don’t be fooled by those who claim “global warming causes cooling”. What we are seeing is natural variability, likely dominated by the oceans. The “new weather norm” might well be different from what anyone less than 30 years old has been used to.
To the extent that human-caused warming is occurring, I am increasingly convinced it is a largely benign — and possibly beneficial — needle lost in the haystack of Mother Nature’s natural climate gyrations.
Thanks for this summery on the PDO Roy, what effects do you see when the AMO changes and what is your estimate of when that will happen?
If you will, when we’re both last in a cooling phase.
Thanks for sharing your knowledge.
So much dishonesty and subtle deception in this post. It’s really misleading.
Ah. The progenitor of wisdom and truth answering speculation with absolute certainty.
Bill James: “The greatest barrier to understanding things is the conviction that you already understand them.”
bassman, please elaborate… As one of (very) few rational voices on the “alarmist” side who frequent this blog, you always have something to say worth listening to. (As well your respectful tone makes you an easy read)
You’re being sarcastic right? The guy calls Dr Roy Spencer, essentially, a liar, without explanation, and you peg him as a ‘rational’ alarmist. I’d hate to think what the irrational ones are like.
Will, think Appell… All things are relative.
I once had an exchange with Appell. His argument was = he got a physics degree. Einstein was a physicist. Appell = Einstein.
Hard to know if one should laugh or feel sad for the poor guy. Another lost soul looking for a chance to make his meaningless life fulfilled by saving the world.
Could be that bassman thinks this post is so bad that Dr Spencer must be lying. (It’s better than calling him stupid, I suppose) Over at watts there is a very brilliant man who posts comments by the name of ferdinand engelbeen. He has this argument that human emissions and carbon growth are linked with an “incredibly fixed ratio”. While this is true, one can easily see that this is only so because of the influence of increasingly warmer temperatures. (so much for his “incredibly fixed ratio”) Since ferdinand is no idiot, he most surely knows this. Therefor he MUST be lying. The only question being whether or not ol’ ferdi is pocketing euros to do so…
Bassman,
That is a totally unscientific and inappropriate response. If you see dishonesty and subtle deception, detail it! Phrases like, Disaster, Dishonesty, Deception, Big Oil Funded, are the phrases of those who have stopped thinking scientifically and are responding based on beliefs they are unwilling to question.
We saw global warming from 1900-1940, no global warming from 1940-1970, global warming from 1970-1997, and no global warming from 1997 until 2014. Yes, it’s warmer now than in 1970. Yes there is more CO2 in the atmosphere than in 1970. Yes, More CO2 in the atmosphere has probably cause SOME global warming. Where is the data that says Global Warming has been mostly caused by CO2? There is no longer even a good correlation, since Global warming happens and stops happening, restarts, and stops again, all while CO2 continues to increase at an increasing rate. Why?
Mr. Matz, you are wasting time trying to reason with pseudo-intellectual “useful idiots” for the warmist cult. They are better just ignored. They are NOT persuaded by data, unless of course it is manipulated and spun to support their politically-driven (largely anti-capitalist Marxist)agenda. The good news is that more and more scientists are conducting (and publishing) research on the MULTITUDE of forces affecting climate and how they interact, a subject we still know far to little about! We have to hope and believe that, as in years and centuries past, serious and unbiased science will ultimately prevail over politically-motivated, anti-scientific dogma.
How many silly straw-man fallacies are in this post?
Not very ‘sceptical’.
The new weather norm may be correlated to prolonged minimum solar activity which has not taken place post Dalton.
My thoughts, thinking and questions follow:
As I have been maintaining a prolonged minimum solar period gives rise to a more meridional atmospheric circulation pattern due to changes in ozone concentrations in a vertical and horizontal sense in the stratosphere.
A more intense atmospheric meridional atmospheric circulation pattern should result in a greater persistence in weather patterns, more cloud coverage and snow coverage and thus an increase in the albedo.
The questions to be asked are when the maximum of solar cycle 24 finally ends( which will likely be very soon) will the atmospheric circulation pattern lock into this greater meridional pattern? If so will it amplify the cloud coverage and snow coverage? If so to what degree?
Will prolonged minimum solar activity result in lower ocean heat content and sea surface temperatures? If so how fast?
Will volcanic activity increase?
How will the weakening earth magnetic field moderate solar activity?
Will the PDO/AMO stay or go into there cold phase ? Will the warm pool of water off the Western North America coast persist? Will ENSO feature more La Nina’s going forward in response to a cold PDO?
How will a cold phase AMO/PDO play upon Arctic Sea Ice?NA’S
I have three causes for global cloud coverage in mind, they are cosmic rays, the atmospheric circulation pattern and volcanic activity.
The big question is how will those three causes for cloud coverage respond when the maximum of solar cycle 24 ends following 10 years of sub-solar activity in general?
If the answers to these questions I have asked come out the way I think they will expect cooler global temperatures going forward and more persistence in weather patters.
Note solar cycle 24 started JAN. 2008 no cycle has continued to increase in activity more then 72 months into a given cycle which means the very weak maximum of solar cycle 24 should be ending in the very near future and a long severe solar decline could /should set in thereafter.
Once this happens many of the questions I have posed should be answered.
NOTE : Solar activity currently is much above the parameters I think might be needed in order to have solar activity translate into a significant climatic impact.
But the 10 years of sub-solar activity in general is now in if one uses post 2005.
As of today, I am more concerned about Anthropogenic Commet Change…..
http://rosetta.jpl.nasa.gov
If I were using the IPCC standard of “proof”, I’d say that you have there unequivocal proof that PDO caused the recent temperature changes.
http://wattsupwiththat.files.wordpress.com/2014/11/clip_image005_thumb1.jpg?w=674&h=577
This is another nail in AGW theory, which is no decrease in OLR due to an increase in GHG’S , not to mention the zonal atmospheric circulation pattern they said would evolve over time as a result of man made global warming. When this did not materialize they changed their story and came up with the absurdity that reduced Arctic Sea Ice was responsible for the jet stream to buckle and used that as the excuse as to how the globe could cool in the face of global warming.
It is so absurd/stupid not really worth mentioning but I but I did it any way.
HERE IS WHAT CUASES THE JET STREAM TO BUKCLE IN OREDER OF MPOTANCE IN MY OPINION.
Prolonged minimum solar activity AP index 5.0 or less
Warm AMO
NEG QBO combined with low solar activity
High latitude volcanic activity and typhoon activity
Low Arctic Sea Ice least in importance– This can easily be verified by examining the atmospheric circulation in the 1970’s which featured a similar jet stream pattern to today while Arctic Sea Ice values were above normal. So much for that argument.
https://patriotpost.us/opinion/19138
More data to show how WRONG AGW theory has been in it’s predicting.
This theory belongs in the trash bin where it will be before this decade is out.
My theory is a 1000 x better.
http://s22.postimg.org/toyjvsqld/ENSO_vs_Pac_Trade_Winds_Oct14.png
Dr. Spencer is correct in the sense that we have been in the same climate regime post 1900 and when in the same climate regime the PDO/AMO play a big part in small climatic changes both up and down.
I am thinking going forward we may trend into a slightly different climatic regime with global temperatures trending to a lower level in a jig saw pattern.. Maybe -.5 c by decade end for the globe as a whole if it goes according to my thinking.
http://bobtisdale.files.wordpress.com/2013/07/fig-1-ocean-temp-changes-700-2000m.png?w=960&h=626
ocean heat content changes.
My computer went nuts let me write this again.
HERE IS WHAT CAUSES THE JET STREAM TO BUCKLE IN ORDER OF IMPORTANCE IN MY OPINION.
Prolonged minimum solar activity AP index 5.0 or less
Warm AMO
NEG QBO combined with low solar activity
High latitude volcanic activity and typhoon activity
Low Arctic Sea Ice least in importance– This can easily be verified by examining the atmospheric circulation in the 1970′s which featured a similar jet stream pattern to today while Arctic Sea Ice values were above normal. So much for that argument.
Great article!
Please correct “We end up blaming these on the only thing we thing we think we understand — increasing CO2 should cause some change, so it must be responsible for all of the change we see.”
important that people understand that most of what we experience in terms of weather and climate change is largely out of our control.
Not “climate change is largely out of our control” Roy It is all out of our control.
There is absolutely no way we can control a machine of such power.
Hi Roy,
Thank you for the post! It suggests significant COOLING periods in past decades alongside increasing CO2. This can also be observed since satellites have attempted to record atmospheric radiation emissions and correlated temperatures. Imo, the empirical data directly contradicts the claim that the CO2 (GHG) concentration of the atmosphere determines temperature, but that doesn’t mean there exists no effect. I’ll have more to claim regarding that later. Thanks again and…
Have a great day!
Hi Roy,
Permit me a minor correction. My statement should have read:
“Imo, the empirical data directly contradicts the claim that the CO2 (GHG) concentration of the atmosphere determines temperature, but that doesn’t mean there exists no effect from growing atmospheric CO2 (GHG) concentrations.”
thanks for an excellent post Dr. Spencer. I’ve found a 300 months cycle in ENSO, which can likely be used to determine turning points (start, end, and peak of el ninos, la ninas) within +/- 3 months. The cycle predicted ONI to turn from – to + in the MAM season. It turned + in the AMJ, well within the +/- 3 months .
The next event date (el nino start?) was predicted for the JJA season (+/- 3 months); after two seasons with a 0.0 reading, ONI was 0.2 in ASO.
The empirical evidence of temperatures since 1900 are referenced along with PDO behaviour. The cycles are getting SHORTER with warmer trends over riding the cooler influence of PDO. (i.e. It is warmer now consistently since the 1998 spike). There is also less duration of sustained troughing of PDO cycles. There is no contradiction whatsoever that rising CO2 levels are affecting temperatures by its conservation of suns energy in the atmosphere. Roy Spencer is presenting a misaligned 30 year cycle. PDO are not neat 30 year cycles. It is a weak unsustainable theory in the light of empirical evidence and trends of temperatures. Our climate is far more chaotic then neat 30 year cycles. We humans are disrupting any implied all one dimension box presented by Roy Spencer. There are not any signs of temperatures rising, weakening, toughing and resuming from absolute temperature restarts & resets resulting from PDO cycles. The rise and fall temperatures and its subsequent climate temperature “reset” – the IRIS theory by Linzden is recycled here. This theory will break and fall over in thn coming decades. Roy will eventually change his mind being the scientist he is.
http://www.nature.com/news/climate-change-the-case-of-the-missing-heat-1.14525
RossBrisbane,
I am not sure of your point. I looked at your link and the graph of PDO vs global temperature shows an astonishing match. If you look at the temp rise in the earlier part of the graph it was around 0.5 C (-0.3 to 0.2 at the peak). In the later part of the century and into the 21st with strong positive PDO the temp went up about 0.5 C.
Link to carbon dioxide in atmosphere:
http://www.cotf.edu/ete/modules/climate/GCcarbon1.html
If you look at the Carbon dioxide level change from the first PDO phase of warming from your linked graph, 1925 to 1945 the change was from 300 to 310 PPM. Then from 1945 to 1980 (cool PDO phase) the temperature did not go up (I don’t have the trend but it looks as if it may even gone down) yet the CO2 went from 310 to 340 PPM. Then when the PDO went positive again the temps rose 0.5 C.
If the PDO is not a responsible somehow, how come an additional 30 PPM Carbon Dioxide did nothing in 35 years to warm the globe? Then when a warm phase PDO takes place the globe begins to warm and at very similar rates as the previous increase from 1925 to 1945. From the PDO graph I do not see carbon dioxide as the primary driver of global warming. Maybe a small player but not the main actor.
Hi Ross Brisbane,
You stated:
“There is no contradiction whatsoever that rising CO2 levels are affecting temperatures by its conservation of suns energy in the atmosphere.”
The key word in your statement is “rising.” As a generic general statement that’s true and I agree with it to an extent. However, any energy increase resulting in temp rise quickly disappears and gets radiated away. If the rate of atmospheric CO2 INCREASE remains steady no temp increase occurs! Overlay Roy’s temp data with his change in atmospheric CO2 graph and you’ll see what I mean. Temp increases only occur when the rate of atmospheric CO2 increases say from 2 to 4 ppm. In fact, if the RATE of CO2 INCREASE FALLS from say 4 to 2 ppm the temperature DECREASES! This happens despite the fact that atmospheric CO2 continues to INCREASE!
Have a great day!
Hi Ross Brisbane and everyone,
Please allow me one correction to my post above. Where I stated ppm it should read ppm/yr. Thanks. I hope that clarifies things.
Have a great day!
Ah, Dr Spencer, I see you are using statistical models in a spreadsheet to inform hundred billion-dollar decisions of global significance. That’s fine by me, and if you can do that then the rest of us can do that too. 🙂
I find a combination of a purely sinusoidal PDO approximation, plus a small Svensmark-style effect, plus stock standard IPCC CO2 forcing, will altogether produce a fairly close recreation of the last 150 years – as long as it is judged on 5-year averages:
http://i.imgur.com/7iQMBPW.png
The lesson learned here is: The smaller the RSME, the easier it is to fool yourself with the model.
Having fooled ourselves into believing we have accurately recreated the Earth’s climate in a spreadsheet, we may then fool ourselves into thinking we can predict the future all the way out to 2300AD:
http://i.imgur.com/Xui5bds.gif
That GIF also contrasts the cumulative modelled effect of CO2 rise with the hypothetical “No Industry” scenario. The take-home message is that Earth’s oceans may be so slow to warm that we would have seen almost no effect from CO2 thus far even if it will add up to a significant difference in the future. In other words “The Pause In Warming” means nothing, it is too short term to disprove CAGW.
Seems the biggest impediment in the climate debate is that we don’t have enough good data to work with and we can’t gather more any quicker than one thirtieth of a climate measurement per year.
Of course I don’t believe the PDO will remain steady at a 66 year period and 33W/m^2 equivalent forcing, and it would be astonishing if this model’s prediction of the next 20 solar cycles amplitude was even close to reality, but I see you understand it is fun to speculate. The above are projections, not predictions! Even I don’t believe my own model yet.
Regular followers of Blokes of a Tall disposition would have seen an early version of this model already, exactly one year ago (hint hint).
Anyhow, thank you for sharing your insights into natural climate change, particularly the graph of the model residuals.
We now return you to your regular PDO-scheduled Pause In Warming.
“Ah, Dr Spencer, I see you are using statistical models in a spreadsheet to inform hundred billion-dollar decisions of global significance.”
Seems replacing “Spencer” with “IPCC” and “statistical models” with “computer models imaginatively tweaked” would be more informative.
And throw in a lot of hyperbole to boot.
Just in case nobody noticed…
The residual in Roy’s climate cycle model is warming at 0.051 degrees per decade. That’s the trend remaining after a long term trendless cycle is removed.
The warming trend in my model, which also includes a long term trendless cycle, is 0.045 degrees per decade.
They are roughly compatible (to within 15%).
Hi Dr. Spencer, I like to report on Irish music and weather on occasion and tweak their blind allegiance to the global warming flim flams. Are there any links to global warming / cooling and the increasing popularity of traditional country music or music in general on the blog? thanks for the sanity and the facts,
Brian.
Dr. Spencer,
Thank you for providing the Excel spreadsheet for your model of how natural cycles statistically account for most of the recent warming of global average sea surface temperatures. Some explanatory documentation would help for understanding it, though. Frankly, the labeling is skimpy and incomplete and the model equations not explained. I realize it’s a working document, but I need a bit more clarity.
The model is just a linear best fit of the three sequences (AMO, MEI, PDO) to HadSST3. There’s a calculation of the lead/lag of the sequences relative to HadSST3 in the spreadsheet, but offset sequences are not used in the model. The AMO term dominates, in large part because it has the same upward trend over the limited period evaluated as HadSST3.
The main flaw with this as an attribution model is that it doesn’t include a term for GHG forcing. One can’t really conclude anything about an effect that isn’t in the model. As such GHG warming isn’t bounded by the slope of the residuals, which I take as the implication of “unexplained warming, partly due to increasing CO2”.
Good points Dr. Roy.
People get so wrapped up in their belief system that they often forget that the “greenhouse effect” is just a hypothesis. It is NOT settled science. In fact, in AR5 the IPCC has even backed away from “back-radiation”. If you look at the history of the hypothesis, parts of it have been “tweaked”, in an effort to fix it. It is much more of an “evolving” hypothesis than “settled science”.
I know blogs that actually try to censor science, if it does not agree with their belief.
So, on a much bigger scale, the “war” is about maintaining scientific integrity (as Dr. Roy does in this post), rather than allowing everyone to just be a robot to “State Science”.
Good points geran!
“People get so wrapped up in their belief system that they often forget that the “greenhouse effect” is just a hypothesis. It is NOT settled science. In fact, in AR5 the IPCC has even backed away from “back-radiation”.”
Couldn’t agree more. This current atmosphere has vastly reduced the effective surface emissivity to around 0.17 rendering surface emissions a poor third behind moist convection and direct absorption of solar short wave as diabatic heating mechanisms for the atmosphere.
The massive opposing radiative fluxes regularly shown in flux balancing models cannot be realised, being referenced to zero Kelvin which does not exist within Earth’s atmosphere.
The line by line monochromatic addition of opposing radiation vectors across the entire spectrum gives the net flux in Wm-2. The only energy that leaves the surface as electromagnetic radiation.
Geran, i’d like to expound a bit on your concept of “evolving hypothesis” as it regards to the failure of the climate models. What follows is a snippet from an interview of ipcc contributor Hans Von Storch by Spiegel on the the subject:
Spiegel: That sounds quite embarrassing for your profession, if you have to go back and adjust your models to fit with reality…
Storch: Why? That’s how the process of scientific discovery works. There is no last word in research, and that includes climate research. It’s never the truth that we offer, but only our best approximation of reality. But that often gets forgotten in the way the public perceives and describes our work.
Hi Fonzarelli,
The last quote works well. Unfortunately the CAGW crowd don’t always see it that way when it comes to supporting confiscatory legislation based on a seemingly firm ground of SPECULATION.
Thanks and have a great day!
Hey there, John… The Hans Von Storch interview is a real gem and i’ve referenced it a number of times. Like Dr Spencer, he seems to be a fairly pragmatic fellow. He’s less charitable toward the models (than Dr. S.) in that he thinks they are broken regardless of future warming. Where as Dr. Spencer seems to have no problem with the models if they eventually reflect reality. I thought i’d give you the link to the interview for your (and any one else’s) enjoyment… On a lighter, funnier note, I use an iPhone to post my comments and all that typing with my thumbs is beginning to make them sore. Imagine that, fonzie’s got carpel thumb !!!
http://m.spiegel.de/international/world/a-906721.html#spRedirectedFrom=www&referrrer=
Hi Fonzarelli,
Good link. Imo, the problem remains that Roy, the IPCC and most modelers seek a link between the absolute level of GHG’s in the atmosphere and temperature and their assumption falls short. Remember some while back you posted the historical UAH satellite temp data combined with Roy’s historical Mona Loa rate of change in atmospheric CO2 data. Those graphs provide empirical evidence against those assumptions. You may notice that as the rate of growth in atmospheric CO2 increases say from ~1.5 to 4 ppm/yr temps increase a few tenths of a degree centigrade. Contrarily when the rate of growth in atmospheric CO2 decreases from 4 back to 1.5-2 ppm/yr the temps actually decrease! This happens despite the measured fact that atmospheric levels of CO2 continue to increase! This fact bears witness to what science has known since the days of Max Planck. Please let me know your thoughts and …
Have a great day!
McRae cool model. I have a similar one and agree that mine is not predictive but fun to generate and play with. Have u went back in time to try and match the little ice age with your model? I think u will find a stronger cosmic ray forcing is required but id be interested to see what u think. Personally it seems like the forcing is non linear and exaggerated during solar extremes. Also i published an obscure paper that included a part about the hale solar magnetic cycle forcing climate millions of years ago and it crossed my mind that the pdo might be related to solar forcing and the suns magnetic field. For me, the pdo may be sort of like a bucket of water sloshing back and forth and resonating with a signal and then once the signal stops or weakens the sloshing becomes less periodic and the frequency slows until actively forced again. I think this big solar change in magnetics was abrupt and the PDO may have jumped on board and became in phase for the ride. Great stuff your doing and thanks for sharing. Here is the link.
http://link.springer.com/article/10.1007/s10933-008-9244-0
Aaron at 9:19,
Thanks for the accolades, but you have highlighted the shortcomings of my model quite precisely. The formula I have been using for predicting solar activity is already known to its original author (not me) to be unable to predict the Maunder minimum. If a new Maunder (or Dalton) minimum were about to occur mid 21st century, my model at present would not predict it.
I have already compared its long term performance to the Loehle2008 temperature reconstruction from 100AD to 1900AD, and the RMSE is 0.33. That’s an error almost as large as the variance in the real signal. It’s within Loehele’s error bars for most of the time, but still the long term performance is quite poor.
Now that you mention it, I have just checked how much difference real SSNs make versus the virtual. If I restrict comparison to 1700AD to 1900AD, with virtual SSNs it gets RMSE 0.144, with real SIDC SSNs the model gets RMSE 0.149, slightly worse! So although it misses the LIA totally, the sunspot model is not the limiting factor in authenticity most of the time. The departure of the natural undulation from a perfect 66 year cycle looks like the main error.
That’s interesting you found evidence for the ENSO 4-year periodicity stretching back millions of years. If only the “60 year cycle” were as reliable! It’s not much of natural cycle if it has gone out of tune after just 100 years into the past.
BTW, I typically comment at Jo Nova’s site, eg: http://joannenova.com.au/2014/10/imaginary-hottest-fingerprints-found-with-broken-models-in-extreme-weather/#comment-1582519
Why is all of this made so difficult to understand.
From 1950-1977 La Nina predominated and we had global cooling, although it is difficult to measure because of global surface temp siting problems.
From 1977-1998 we had some? global warming. Again tough to determine, because of volcanoes and continued surface temp problems.
From 1999-present temp.’s have remained overall flat, except for temporary nino/nina anomalies which basically cancelled each other out during the period.
http://www.esrl.noaa.gov/psd/enso/mei/
A study of the earths climate over the past 20,000 years show regular cyclic fluctuations of temperature are the norm.
Sea level has risen 400 ft over the past 20,000 years and the past 6-8 inches of it has somehow?? been attributed to a change of 1 in 10,000 parts of the atmosphere from something to CO2. Somehow “we” think there can be no other reason. 99.85% of the sea level rise was natural, while .15% of it was undoubtedly due to man??? WHAAAT???
NFW, as regards sea level rise the claim is even more dubious than that… Sea levels were stable for 2,000 years according to wikipedia and the ipcc (“their” data…). They began rising in 1870 when human emissions amounted to just 1 PPMV PER DECADE. Seas have risen at a steady clip with half the rise occuring before the recent waming of the past fifty years. Thus most all of the rise in sea levels can be attributed to natural warming…
A good read is The Attacking Ocean by Brian Fagan. The book covers archaeological data documenting the effect of sea level rise on earths continents the past 20,000 years. What I find most fascinating about all of Fagans book is that he writes he is a AGW believer. He spouts the dogma. That’s interesting because he has written at least half a dozen books all about the enormous effects that natural climate change has had on humanity for centuries. Does he really believe in the new definition of climate change, which basically attributes ALL dramatic weather to C02? Yes, he has to, otherwise he’d be a nobody! What a fascinating time this is.
Dr. Roy Spencer arctic air still persists. Rather will be colder.
http://earth.nullschool.net/#2014/11/18/0600Z/wind/isobaric/70hPa/orthographic=-115.97,68.25,418
Polar vortex, the lower atmosphere.
Polar vortex, as in the previous year is shifted in the direction of Europe. This pattern formed in October, like last year. This pattern is stable.
http://www.cpc.ncep.noaa.gov/products/stratosphere/strat-trop/gif_files/time_pres_WAVE1_MEAN_OND_NH_2014.gif
http://www.cpc.ncep.noaa.gov/products/stratosphere/strat_a_f/gif_files/gfs_z30_nh_f00.gif
Please see that in October was very low solar activity. Neutrons show it very well (vice versa).
http://cosmicrays.oulu.fi/webform/query.cgi?startday=01&startmonth=10&startyear=2014&starttime=00%3A00&endday=13&endmonth=11&endyear=2014&endtime=00%3A00&resolution=Automatic+choice&picture=on
http://www.cpc.ncep.noaa.gov/products/precip/CWlink/daily_ao_index/hgt.ao.cdas.gif
Here you can see a decrease of solar activity in October.
http://www.solen.info/solar/images/cycles23_24.png
http://cci-reanalyzer.org/DailySummary/
This is great if accurate. I think it is because the base line runs from 1980 -2000.
Such is the circulation. Look at the clouds, you can see how cold air flows over America and gets warm over the Arctic Circle over the the Bering Strait. There is a blockage of the polar vortex.
http://www.sat24.com/world.aspx
On second thought it may not be accurate. Anyone have thoughts on this product?
Salvatore look at this.
http://earth.nullschool.net/#current/wind/isobaric/850hPa/overlay=temp/orthographic=-27.45,94.93,482
Salvatore coming up big snowstorm.
http://earth.nullschool.net/#2014/11/15/1800Z/wind/isobaric/850hPa/overlay=total_cloud_water/orthographic=-100.09,43.56,1108
There is a thousand year time delay (or more) between significant global temperature increases and sea-level rise. One only need look at data from the onset of the Holoscene to see that this is true.
see for example: http://3.bp.blogspot.com/_nOY5jaKJXHM/TGbHwwJPxhI/AAAAAAAABPs/GM0nE65s-Sg/s1600/past+mean+temp+co2+sea+level+variations.jpg
Therefore, it is disingenuous to suggest that warming in the last 50 years has had any significant effect whatsoever on sea-level.
Thus, you obviously are claiming that if you warm up a body of water it only will expand after a delay of a thousand years or more. Could you explain the physics behind this please? You should publish this. It will be a revolution of thermodynamics.
Jan, i’ve never understood that either. The claim with ice cores is that the 800 year lag of co2 behind temperature is due to the thermal expansion and out gassing of the oceans. (others claim the lag is an artifact of the ice cores; it’s interesting to note that shallow cores don’t seem to have a lag) I’ve yet to hear an explanation as to how that happens…
There isn’t any 800 year time lag. You aren’t up to date with the research.
Care to elaborate?
Fonzarelli wrote on November 13, 2014 at 8:32 PM:
Shakun et al., Nature (2012), http://dx.doi.org/10.1038/nature10915
Parrenin et al, Science (2013), http://dx.doi.org/ 10.1126/science.1226368
I wouldn’t take a paper like that too seriously. It uses a computer model (circular argument) + temperature proxies, to make its case. Proxies are highly problematical at the best of times. It’s less ambiguous to look at ice cores, because you can directly measure CO2 atmospheric content locked in the ice, and the 18O/16O ratio to work out temperature variation. Why would any rational person prefer models and proxies to actual measured data?
Oops, because the computer model + proxies tell you what you already believe. The actual measured data is dismissed with a hand wave, because it’s not the answer you want. 😉
Will Nitschke,
You certainly have an opinion. However, it seems to me you are actually the one who is using hand waving to dismiss the results of a scientific study, because you don’t like the answer given in the study.
Some specific points:
1. The 18O/16O ratio is nothing else than a temperature proxy. It is not a temperature measurement. Thus, your dismissal of using proxies, in favor of using a proxy is just nonsense. Proxies are empirical evidence. They also have limitations. Taking these limitations into account, when conclusions are drawn, is part of the science.
2. The CO2 variability derived from ice core data is rather representative for the global CO2-content. However, the temperature variability from the 18O/16O ratio in the ice cores is only locally representative. It doesn’t tell you as much about the global temperature variability. Thus, one can’t properly understand the relationship between global CO2 and global temperature variability simply by looking at ice cores only. To be able to derive better information on the global temperature variability and its geographical pattern, a global network of temperature proxies is needed. There aren’t any direct temperature measurements from these time periods.
3. Your claim that the authors used circular reasoning, because they additionally used climate model simulations in their study to see whether these simulations reproduce the empirically derived temperature variations is unfounded. Why would using a climate model for such a purpose be circular reasoning? Your claim that a climate model or proxies just tells us what we want to believe is baseless. Why would that be?
A few brief observations because believers, whether religious or ideological, never have their opinions changed. Such brains operate on auto-pilot.
But anyway, using a model as evidence in this case is circular reasoning because the model assumes that CO2 drives warming. Checking a model to see if it’s in agreement with what you’re trying to prove, which is that CO2 causes warming, is a rather futile exercise. The authors of the paper invoke their model because their evidence is weak. If they had strong observational evidence they wouldn’t need the model.
Yes 18O/16O ratio is “nothing else than a temperature proxy.” (Sorry but your English is appalling… Anyway…) The mercury in a thermometer is also a “proxy” for temperature. Sat’s don’t directly measure temperature either. They use proxies too. You can even define a telescope as a proxy, because when you use it to look at the moon, you’re not really looking at the moon, you’re using light waves magnified by the telescope to represent an image of the moon. The light waves are a “proxy” for the moon itself.
The point I’m making is that you couldn’t refute the good observational data so you resorted to the ‘everything is a proxy’ nonsense, attempting to confuse the issue by failing to distinguish between good proxies and bad proxies. A good ‘proxy’ for global temperature measurement between 1979-2014 are sat readings. A bad proxy would be, say, measuring tree rings.
Of course, because you’re essentially a crank, IF the tree rings showed warming, you would much prefer to believe in a tree ring proxy because it would tell you something you already believed. You would not be interested in the sat readings, because they showed less warming, and besides, “everything is a proxy” so what difference does it make? (To borrow the famous words of Hillary Clinton.)
Will Nitschke wrote:
This statement is likely projection, since I am not the one here who is the religiously and ideologically motivated believer. My views are based on the science instead. They are based on the scientific evidence that is presented in the peer-reviewed literature of the field. Evidence like the one presented in the Skakun et al. study. I adjust my views, when new evidence requires it. I don’t reject what climate science says, if it is in contradiction to my personal political, ideological, or (in my case absent) religious beliefs.
How is the assumption that CO2 was driving warming implemented into climate models?
I suppose you also will reject any calculation with a physical model, which comes to the result that you would go splash when you jumped from a cliff, because the causal link between the potential energy in the gravity field on top of the cliff and the release of energy at impact at the bottom was just an assumption in the model and, therefore, the calculation would just be circular reasoning.
This is just a strawman argument, since the authors don’t claim to have proved with their study that a CO2-increase causes warming. The study is not about proving the causal relationship between CO2 and temperature change, it’s about reconstructing the global temperature variability and its spatial pattern from the Last Glacial Maximum to the early Holocene and the timing relative to the CO2-variability (also relative to the variations in the insolation forcing). Their proxy reconstruction doesn’t need the climate model simulations to prove it right. The proxy based reconstructions are the empirical data. It’s rather the other way around. A successful reproduction of what the empirical evidence says, using climate model simulations is a test for a climate model. If we are able to calculate it with the physics implemented in the climate model we can have more confidence that the physics in the model is sufficiently correct, and we can have more confidence in our understanding of the physics. The authors use the model as a tool to explore possible physical explanations for what the empirical data show. This is what climate models are for. The authors don’t claim to have proved the physics with the model. Climate models are just tools that help us understanding things.
I apologize for my deficiencies in mastering the English language. Also, I admire that you are not making any mistakes in any of the languages you speak in addition to your mother language.
Nonsense. A mercury thermometer is an instrument whose own physical state is directly calibrated to the measured variable of the studied object. Thus, the thermometer measures the temperature directly.
Proxy measurements are based on the statistical correlation between two variables. They use an empirical statistical model to relate the two variables to each other. This is what is done with the temperature and dO18 data.
No, you only are attempting another strawman argument here. What makes you think I wanted to refute the ice core data? I didn’t say anything like that. The ice core data are also used in the Shakun et al.-study. My argument was a different one, which you haven’t addressed at all.
You are the one with the assertion here, for which you haven’t provided any evidence whatsoever. Your assertion is that the Shakun et al. study should be dismissed because it was based on “bad” proxy data. All you have come up with are rhetorical tricks and babble instead, but nothing to back up your claim.
What is “good” and “bad” data supposed to mean anyway? Is there any criterion you are applying for this classification? Which one? Based on what evidence? Your gut feeling? Because you don’t like the results from the study, so the data used in the study must be “bad”?
The tree ring derived and the satellite derived data don’t even represent the same variable. Tree rings are used as proxy for the land surface temperatures, the satellite retrieved temperature data sets are for the free atmosphere.
Someone who is rejecting the accumulated knowledge from decades of research in a field of science is calling someone else, who is professionally working in that field and not rejecting it, a crank is outright funny. Talk about utterly distorted perception.
What I believe is that you are projecting too much of your own ways of thinking onto me.
Believers tend to project their own nonsense onto everyone else. It’s quite a marvel to behold. I’m not going to spend too much dissecting your ramble as it is not even a fair attempt at trying to slink out of the criticisms of your claims.
Let me just pick a random piece of stupidity to comment on –
“Nonsense. A mercury thermometer is an instrument whose own physical state is directly calibrated to the measured variable of the studied object. Thus, the thermometer measures the temperature directly.”
A mercury thermometer doesn’t measure atmospheric temperature directly. It expands when its energy content increases. So if the thermometer was placed near, say, an air conditioning outlet, it would be measuring air conditioning latent heat, not “temperature directly.” Your appalling ignorance of the basic foundational underpinnings of science is very disheartening. The ice core measurements of atmospheric ratios expresses the same sort of ability to measure temperature. Although in truth, nothing can “directly” measure temperature. There are only good proxies, OK proxies and proxies of declining usefulness. Tree rings and lake sediments fall into the poor proxies because they are responsive to many factors besides temperature. They change in relation to precipitation and are also local in range, and so on. Very unlike measuring the atmosphere which over thousands of years becomes well mixed.
Typical science crank tactic: of the hundreds of thousands of scientific papers published each year, pick out one based on a lot of complex assumptions, declare that the vastly more straightforward and well established measurements are now all wrong, and indeed, all of the previous scientific work is therefore all wrong. You people are very toxic to the scientific enterprise. The sooner you disappear back into the hole you came from, the better off the world will be.
“…delay…”
Since the Ocean is warmed from the top there will be a delay of 1000 years before any temperature increase applies to the whole body, because that is the approximate mixing time.
After comparison of Argo buoys with Challenger expedition measurements, it is accepted (best central estimates) that since the 1870’s,
the surface of the Ocean has warmed 0.69 K
the water at 366 m [200 fathoms] has warmed 0.4 K
the water at 914 m has warmed 0.12 K
the bottom water has warmed very little, if at all.
A trivial integral calculation from these numbers using an average expansion coefficient of 3*10^(-4) per K shows that thermal expansion of the Ocean over the last 135 years has caused something like:
a rise of sea level of 0.1 meters
at a rate of 0.0075 meters per year.
A typo:
the rate is 0.0075 meters per DECADE, or a little under a millimeter a year.
Of course, a given increase in heat contained in the Ocean will produce the same increase in volume, whether it has reached the bottom or not.
If, for argument’s sake, one assumes that the top 100 meters warm by a degree K for some reason, one must apply the rules EITHER to the mass in that 100 meters OR to the whole Ocean with an eventual increase of 0.025 K. But not 1 K to the whole Ocean right away!
Numberer, it’s good to see you’ve survived the antics of your (snowman making) brother… (i wish that i could say the same regarding the antics of my brothers)
From what I gather from what your saying, I take it that thermal expansion does NOT take a thousand years then, correct? (just the mixing of the heat does) How about the ocean out gassing? (Is there a delay with that?) I’ve heard it causally mentioned so many times but never explained. Thanx much…
Is it too late for psycho-therapy? Or revenge?
Thermal expansion in a fluid in a container, under gravity, is instant, however heat is introduced, because pressure is transmitted instantly. But, obviously, an increase of, say, 0.69 C “AT the surface” means nothing until you say how deep that 0.69 C goes “IN the surface layer”. And, naturally, the surface will be radiating about 1% more heat energy than before, so …
The final stage of out-gassing is also instant (bubbles rise quickly) but the CONDITION for out-gassing will spread slowly – it goes along with the heat. The change in temperature I mentioned for the top part of the Ocean is enough to account – numerically – for half the increase in atmospheric CO2 since the 1870’s. Although that is definitely not the same thing as saying it accounts for it causally. There are too many “flows” to allow for a simple deduction from changes in “stocks”.
Too late for both…
As one looks back into the late 1800’s, one sees temperature starting to rise around 1860 (never to look back). Also in 1860, one sees that co2 begins to rise at a fast clip unaccounted for by anthro additions. AND sea levels start rising (after having been stable for 2000 years) circa 1870. Is there anything DEFINITIVE that one can conclude from those three concurrent happenings? (and perhaps a fourth with the sun spot number beginning to rise in the late 1800s, too) It just seems to me that those three or four events are telling us something but i don’t know exactly what that something is…
“With the hopes of an El Nino fading (now reduced to a 58% probability)” This seems like an odd comment. 58% is likely, not a fading hope.
At any time in any year the changes of an El Nino is about 30%. If my memory is right, there was around a 70% probability a few months ago.
“ Overall, the chance of El Niño is 70% during the Northern Hemisphere summer and reaches 80% during the fall and winter . . .”
http://www.cpc.ncep.noaa.gov/products/analysis_monitoring/enso_disc_jun2014/ensodisc.pdf
The Nov. 6th statement says 58% during the Northern Hemisphere winter. Going from 80% to 58% seems, . . . , well, it seems like a fade.
Where can I find Spencer’s peer reviewed scientific publication where the approach of the spread sheet is used, which is presented in his opinion blog here?
One also should notice that Spencer uses political and ad hominem arguments to dismiss those results from published scientific research, which he doesn’t like.
It seems that the person using political and ad hominem is you. As for the opinions expressed in the article; well there are thousands of published papers in the literature that discuss such matters. What that ultimately means has yet to be decided. Hundreds of thousands of peer reviewed papers get published each year in science. In climate science it’s easy enough to find a dozen papers claiming X is true and a dozen papers claiming X isn’t true. Not all that different from psychology, economics, nutrition, or any field where the subject matter is poorly understood.
Will Nitschke wrote:
Please could you point out what the political or ad hominem arguments was I allegedly used?
Thanks.
This for instance is this kind of argument:
“But statistics aren’t enough. Since we understand that carbon dioxide is a greenhouse gas, and should cause some warming, but we don’t understand natural climate cycles, scientists only look where the streetlight of government funding illuminates the problem: CO2.”
Please could you answer my question? Where can I find the peer reviewed scientific publication by Spencer where the approach of the spread sheet is used, presented in the opinion article?
If you see something, you can not deny it? The sun is the giver of electromagnetic energy.
“Please could you point out what the political or ad hominem arguments was I allegedly used?”
Well let’s see –
(1) The idiotic assertion that unless a scientist has had his knowledge “peer reviewed” it can’t be true.
(2) The idiotic assumption that if it’s “peer reviewed” this means something special. (The best that “peer review” might offer is that a paper is not completely nonsense, but even that is not guaranteed.)
(3) An appeal to authority, rather than evidence.
(4) The claim that “political” arguments are being used. No evidence for this, simply an unfounded assertion.
(5) The claim that Dr Spencer is using ad hominem (calling specific people names, etc.) which is clearly an idiotic thing to assert as he does not do that.
(6) The assertion that his arguments are based on things he doesn’t like, i.e., his ‘feelings’. Again no evidence for this, simply an assertion. Which is also quite intentionally insulting.
(7) The claim that Dr Spencer’s arguments are in contradiction of the published scientific literature. Which is certainly not the case, and for which you offer no evidence as usual.
I could go on, but what’s the point? Your assertions 4, 5, 6, 7 are simply insults or misdirections hurled at someone you feel threatened by. For a very small post it’s certainly packed with a whole lot of stupid.
BTW, your grasp of the English language is appalling. Please put some effort into making your sentences grammatical, at least.
[i]Where can I find Spencer’s peer reviewed scientific publication where the approach of the spread sheet is used, which is presented in his opinion blog here?[/i]
I don’t think peer review is necessary for the model to have merit, though it certainly would serve as a filter to save one from looking at the details of an inherently flawed argument.
That said, I don’t think the model supports the topic of the post very well. The model is simply
HADsst3(t) ~= c0 + c1*AMO(t) + c2*MEI(t) + c3*PDO(t)
where c0-c3 are selected to get a best fit. Because there is a large trend in the residual (and the point is to explain the trend), there is clearly something missing from the model that is forcing a trend, e.g. GHG forcing. Without a term that effectively removes the trend, the weighting on the other terms is suspect at best. Hence the implicit conclusion that the residual trend is some sort of bound on “unexplained warming” doesn’t follow.
Another criticism is that I expect that the coefficients in the model are sensitive to the period of data selected which indicates a lack of model robustness. It’s not clear why the period 1979 to present is selected when all the data sets used go back further. A cynic might call it a cherry-pick.
He has a conservative brain and it tarnishes science.
And liberal brains don’t tarnish science?
Hi Fonzarelli,
Leftist brains don’t tarnish science. They remain as usual completely incapable of comprehending it. If anyone utters a comment outside the scope of the banal bromides and speculative pseudoscience they’ve been fed from their infancy they seek to ban the comments/observations (note prior attempts to squash skeptical articles from peer review), punish the individuals responsible for them and/or sully their reputation. Par the course for many if not most of the CAGW alarmist community.
Have a great day!
Strange. According to the graphic, it is claimed that the “Modern Warming Era” supposedly ended near the year 2000. But in contrast to this claim, the temperature data show that the warming of the oceans has continued after the year 2000 up today, so has the warming of the surface, so has the warming of the troposphere according to the UAH data set. (Only the RSS data set is an outlier.) And the polar caps have been melting, and the sea level has been rising.
Planet’s been warming sporadically for 300+ years. Why would it stop at the year 2000, unless the Earth likes neat round numbers based on the Christian calendar?
Yeah, sea levels rose unabated during cooling after 1940, so I guess it’s still warm enough to keep that happening. Kind of like a gas stove where you don’t have to turn up the heat to keep the kettle warming…
Jan P Perlwitz says:
“..notice that Spencer uses…”
To write “Spencer” and not “Dr Spencer or perhaps “Roy” is boorish and repugnant. Manners cost nothing.
Seems like a strange thing to get worked up about, but are you aware that it’s more properly “Dr Jan P Perlwitz”?
(1) According to Edmund Burke:
“Manners are of more importance than laws. Upon them, in a great measure, the laws depend.”
First Letter on a Regicide Peace (1796);
(2)”Dr” isn’t in the chosen moniker of “Jan P Perlwitz”.
Please note that ‘manners’ should be differentiated from ‘politically correct’. They are not the same thing and, in fact, demanding political correctness is rude.
bernie,
Well, I guess you will have to live with that, if it bothers you.
I find it very measured how I address him after what he publicly stated about other scientists not too long ago.
Will Nitschke made some comments about having a physics degree.
I have a degree in mathematical physics awarded by Cambridge University.
Fifty years later, I have ALMOST got the poison out of my system.
The temperatures in the modern warm period have stopped rising that is a better way to say it.
Soon the temperatures will be declining.
The evidence is there in that weak solar/geo magnetic fields will result in a trend (jig saw pattern) to a cooler climate (but to different degrees read below)and this is EXACTLY what is going to take place now going forward.
I want to add this, thresholds, lag times the initial state of the climate(how close to glacial/interglacial conditions climate is), land/ocean arrangements, earth magnetic field strength , phase of Milankovitch Cycles ,random terrestrial events ,concentrations of galactic cosmic rays within 5 light years of earth due to super nova or lack of for example, the fact that the climate is non linear is why many times the solar/climate correlation becomes obscured, and why GIVEN solar variability(with associated primary and secondary effects) will not result in the same GIVEN climate response.
What is needed is for the sun to enter extreme quiet conditions or active conditions to give a more clear cut solar/climate connection which I outlined in my previous post.
The solar criteria I suggested needed to impact the climate to make it more likely to become colder, which I suggest can happen if the prolonged solar minimum continues and becomes more established going forward.
I wish to thank Dr. Spencer for his blog and website. Overall it’s and island of reasonable people in a sea of shrill nonsense. Sometimes lost in these discussions is that science is accessible to all not just “specialists”. With a reasonable education people are quite capable of understanding “big” issues in science and the philosophy of science.
I must say that the only reason I discovered the site was the “news” that 97% of scientists agreed that the anthropomorphic global warming debate was over. Being told that by a particularly shrill environmentalist set me on a mission to become familiar enough with the scientific issues to intelligently refer people to “the facts”. Dr. Spencer’s site is at the top of that short list of resources to access that doesn’t come wrapped in an ideological flag. Thank you!
Interesting PDO plot.
Last pass downward was in about 1948.
Our last pass downward seems to be 2008 ?? Sixty years later ??
I’d love to see the AMSU graphs following the raw data and not this about +0.75C that is applied to all temp datasets. That might just indicate was is already being seen by folks old enough to remember what the late 60’s and 70’s were like. Seems to be moving that direction fast. Might get something we could trust then.
Roy
It’s good to see you discussing natural climate cycles. They are in fact fully responsible for all climate change and they are compellingly well correlated with the 934-year cycle and superimposed 60-year cycle in the inverted plot of the scalar sum of the angular momentum of the Sun and all the planets. See that plot here.
Planetary magnetic fields reach to the Sun and affect it and probably cosmic rays as well.
Climate is regulated by planetary orbits, Roy.
You see Roy, Pierrehumbert incorrectly deducted the 30% albedo when considering an atmosphere without GH gases. But you and I know it requires water vapour to form the clouds which reflect that 30% of solar radiation back to space, thus shading the surface and reducing the solar flux. So, without that incorrect reduction we have 341W/m^2 for which the radiating temperature would be 278K.
<b.So Roy, there's a good point you can understand and use in your arguments that greenhouse gases like water vapour at least don't warm by more than 30% of that "33 degrees of warming."
In fact water vapour doesn’t warm at all – it cools by a few degrees. But that’s to do with the gravitationally-induced temperature gradient for which you don’t yet understand the physics because you haven’t read the explanation you know where.
Ooops – See that plot here.
Thanks, Dr. Spencer.
You are not alone.
“The Southern Oscillation was discovered decades before it was found to be related to El Niño and La Niña events, which are not repetitive in time, so they are not parts of a true oscillation. While there are portions of El Niño and La Niña processes that behave as cycles, those cycles break down, and an El Niño or a La Niña can evolve as an independent event.”
Who Turned on the Heat? – “The Unsuspected Global Warming Culprit, El Niño-Southern Oscillation”
Bob Tisdale, August 2012
http://bobtisdale.wordpress.com/2012/09/03/everything-you-every-wanted-to-know-about-el-nino-and-la-nina-2/
Bob Tisdale’s “explanation” is in violation of energy conservation. “El Nino did the global warming” fails to explain where the ocean warming that can be seen in the data, is coming from, like it is shown here:
http://www.nodc.noaa.gov/OC5/3M_HEAT_CONTENT/
Or here for the ocean temperatures:
http://climateconomysociety.blogspot.com/2014/01/no-hiatus-pausestop-in-global-ocean.html
These data don’t even reveal any “hiatus” of the warming after the year 2000.
Global warming is foremost ocean warming from the point of view of physics regarding the energy budged and fluxes. The atmosphere is just an energetic appendix in the climate system, despite our human perception of the importance of the atmospheric temperatures. The oceans don’t just warm spontaneously by themselves. For the oceans to be warming, an energy surplus is needed, i.e., there must be a net energy flux going into the oceans. The surplus has to come from somewhere outside, since, as far as I know, the oceans don’t contain any internal heat sources in the water body, which could explain this. Well, perhaps there is a fleet of alien space ships submerged into the oceans, about which we don’t know, heating up the oceans internally.
Apart from some geothermal energy all energy into the oceans is from solar shortwave which varies with global cloudiness rather than GHGs.
Internal ocean cycles then create variability in the release of that energy back to the air.
No aliens required.
Stephen Wilde,
What needs to be explained is where the net energy flux into the oceans comes from, which makes the oceans warm up. The total energy input from the sun hasn’t net increased since the middle of the 20th century. It rather has slightly decreased, and the decrease has somewhat accelerated since the turn of the new century. (Isn’t the decreasing solar activity basis for many of the “global cooling” predictions by “skeptics”, which are failing over and over again?) Are you claiming that a decreasing energy input from the sun will make the oceans warm up?
“Bob Tisdale’s “explanation” is in violation of energy conservation.”
You’re such a nitwit Jan. Don’t criticise what you don’t understand. All that Bob is saying is that heat content gets shifted to SST’s where it comes within measurement range. Total amount of heat doesn’t change.
Which is that science cranks always want to invoke the claim that conservation of energy or the laws of thermodynamics are contradicted?
An environment group called Surfers Against Sewage has now jumped on the climate change bandwagon to gain more funding from the EU.
“Surfers Against CO2 is dedicated to action on climate change and limiting its impact on the world’s poorest communities” (Does it get more stupid than this?!)
Once upon a time, SAS fought the noble cause of stopping raw sewage being pumped into the sea and I supported them. Now, they are a bunch of left wing, sandal wearing, anti-growth, environmental hysterics sucking of the giant teat of taxpayer funded climate hysteria with full political backing.
Climate change is a fabricated pablum for the masses who willingly swallow it whole and then keep coming back for more. This guff has to stop.
Will Nitschke says:
“Which is that science cranks always want to invoke the claim that conservation of energy or the laws of thermodynamics are contradicted?”
I think he would like to recast that as:
“Why is it that science polemicists always want to invoke the claim that conservation of energy or another of the laws of thermodynamics is contradicted?”
Treating this as more than a rhetorical question, some answer will be found in an address by Professor William S Franklin* to the American Physical Society in 1903, printed in “Science”, November 20, 1903.
“The Misuse of Physics by Biologists and Engineers.”
*sometime Vice-President of the Physics Section of the American Association for the Advancement of Science.
“The Misuse of Physics by Biologists and Engineers.”
His strictures were severe. He could have used the title,
“The Misuse of Physics by Biologists and Engineers – and by Some Physicists.”
There’s not much room for unforced variability to affect global temperature on multidecadal timescales.
By my reckoning, the known climate forcings plus ENSO account for around 93% of the variance in global temperature since 1900. I looked at the figures for the AMO and it appears to be little more than a record of how the forced global temperature trends affect Atlantic temperatures – i.e. it’s an effect, not a cause.
It would be a bit odd to dismiss a known physical mechanism as the driver of global temperature (variations in the planetary energy balance caused by the combined effect of GHGs, solar variability, volcanic stratospheric aerosols etc.) and instead to argue that some unknown mechanism of natural variability might actually be the cause instead. A person would also have to explain how the well-understood effect of those known climate forcings could somehow be negated or counteracted by this unknown natural variability.
Seems unlikely to me.
Except models are outside 95% certainty bounds now, and they also struggle hind-casting the past. (Especially the cool period in the 60-70’s now that aerosol forcing estimates have been reduced.)
So you can’t have it both ways. If the effects were ‘well understood’ as you claim, then global temperatures would be 50% of the time, over the last 30 years, above their forecasts, and 50% of the time below their forecasts. Instead of being below forecast for nearly the entire time. So either models are approx. right and there is significant natural variability going on to explain the discrepancy (larger that originally thought) or the models are wrong in significant ways. You can’t just put your fingers in your ears and claim there is no problem, as you are doing.
Here’s how well a simple 2-box climate model reproduces global temperatures when driven by the known climate forcings:
http://images.sodahead.com/profiles/0/0/2/0/7/6/2/8/5/2bmvsgissrsquared-117883512421.png
This is well-understood physics – i.e. cause and effect, not just comparing supposed ocean oscillations to global temperature trends and hoping something fits.
Icarus62 says:
“This is well-understood physics – i.e. cause and effect…”
It may be so.
However, Professor Franklin, in the paper on the misuse of physics cited before, comments on such insouciant pronouncements in the following words:
“Statistical physics [as opposed to systematic physics] is the study of all the actual physical phenomena of nature, some of which, indeed, may be described in terms of the notions of ideal mechanics to a high degree of approximation, and some of which, indeed, may be described in terms of the notions of ideal thermodynamics to a high degree of approximation, but all of which are more or less erratic and in their minute details infinitely manifold and in all of which the notion of one-to-one correspondence, or of cause and effect, if one prefers that mode of expression, fails.
“A clear understanding of the essential limitations of systematic physics is important to the engineer; it is, I think, equally important to the biologist and it is of vital importance to the physicist, for in the case of the physicist, to raise the question as to limitations is to raise the question as to whether his science does after all deal with realities, and the conclusion which must force itself on his mind is, I think, that his science, the systematic part of it, comes very near, indeed, to being a science of unrealities. This is not necessarily to the discredit of the physicist, provided he knows it.”
W S Franklin was one of the pioneers who introduced the study of modern physics, as it was developing in Europe, into American Universities. On another occasion (I have to paraphrase from memory, here) he wrote:
“If we can reproduce a phenomenon, and perhaps incorporate it in a machine, we are in a good way to understand it. But many of the most important things in Nature just, so to speak, come upon us, and we must never think we understand these in all their aspects, merely because we make up some little stories about them.”
So your only comment on my criticism of your claims was to post an uncited chart made by who knows who that is probably made up a climate activist somewhere?
BTW, it’s not difficult to tweak all the parameters if you have a large number of them, so that they match a temperature trend of your choosing. Especially if the parameters you’re fiddling with don’t actually have to match anything found in the real world. Let’s say I’m less than impressed. 😉
It’s a bit more difficult if you’re constrained by reality though. The climate forcings driving the model are a matter of observation, so they cannot be ‘tweaked’. The factors being adjusted to fit the temperature data are climate sensitivity and lag. It turns out that a climate sensitivity of just under 3C per doubling is the best fit to the temperature data.
“[systematic] physics…being a science of unrealities.”
I picked up a book at random in the physics section of the library, and opened it at random, and was confronted by:
“”Theorem 6.6. Assume that char k = 0. All Hopf algebras of dimension d are known for d <or= 12, or d = 15,21,25,35,49. They are either semi-simple, or pointed, or dual to a pointed."
Actually, I knew that – but I am trying to forget it.
‘Jan P Perlowitz’ says:
“Global warming is foremost ocean warming.”
‘numberer’ says about ocean warming:
“The surface of the ocean (the layer that mixes in a year) has (best estimate) warmed by 0.69 K in the 135 years between the Challenger Expeditions and the Argo surveys.”
Further discussion seems superfluous.
At the risk of being a little superfluous…
“Global warming is foremost ocean warming.”
I would just point out that,
It is obviously correct, simply because the mass of the ocean is 400 times that of the atmosphere and the heat capacity of the ocean is 1600 times that of the atmosphere, both mix vigorously*, and the two are in intimate contact.
The ocean is the dog, the atmosphere is the tail, and our weather and climate are hairs on the tail.
*The top 50-100 meters of the ocean mix on a similar time-scale to the atmosphere. The lower layers of the ocean mix more slowly,
“The ocean is the dog, the atmosphere is the tail, and our weather and climate are hairs on the tail.”
I suppose that makes us the fleas on the dog, holding on for dear life.
Nigel, more specifically, the fleas on the hairs of the tail of the dog!!!
In a Chinese myth there was a Primeval World-Giant called P’an Ku who was destroyed so that the material universe could be formed.
“From his flesh comes the soil, from his bones the rocks; his blood is the waters of rivers and the ocean; his hair is vegetation; while the wind is his breath, the thunder his voice, the rain his sweat, the dew his tears, the firmament his skull, his right eye the moon and his left eye the sun.”
All very poetic. Then there is a bit of a let-down:
“P’an Ku’s body was covered with vermin, and the vermin became the races of mankind.”
I am a severe AGW skeptic. I don’t really know that much about atmospheric physics and don’t understand a lot of what I read on this website. I do have a more fundamental question about AGW theory, however.
Every time there is a weather event of any kind–drought, flood, cold spell, warm spell, hurricane, lack of hurricanes–you name it, some idiot climatologist will come along and say “it’s part of the pattern” of AGW. Anything, and everything, apparently, is part of the pattern.
So my question is: have AGW proponents have ever made a list of things that ARE NOT part of the pattern of AGW? I thought science works as follows: A question is asked and a hypotheses is made. An experiment is designed that will either verify the hypothesis or refute it. If “A” happens, then the hypothesis is supported. But if “B” happens, the hypothesis is refuted. It seems to me like there was never a “B” in regards to AGW. Why?
“…never a “B”…”
There are no experiments that can be made for the whole earth except the one that is accidentally going on. That experiment (heavy use of fossil fuels followed by disuse of fossil fuels) will be complete in a few hundred years’ time.
We do not need an experiment to put an upper bound on the result. The Stefan-Boltzmann law and the heat capacity of
the ocean do that.
“Why?”
That is a question about sociology.Some of us have a “B” in mind but we are not powerful.
Hypotheses “A” and “B” make good science.
Multiple hypotheses make for better science.
In our state of ignorance about long term climate changes, we should have in our minds – at the same time – all the ideas that have been put forward which have some physical plausibility. Psychologists tell us that the type of personality that can keep a genuinely open mind without feeling cognitive dissonance is possessed by 1% of the population. However, the jury is still out on that sweeping statement.
“…[a disconfirming] Hypothesis B…”
Some people would not recognize “B” if it was killing them.
I have a relative who is convinced that he can beat the stock market with computers. The fact that he has lost money every year for thirty years does not faze him in the slightest.
“…[a disconfirming] Hypothesis B…”
I guess that should be: “a disconfirming FACT or outcome B” i.e. which disconfirms or weakens the Hypothesis which expected fact or outcome A.
“That B will occur” is the “alternative hypothesis”.
Oh, well, you know what I mean to mean.
When the PDO Index is low (1942-1976 and 2004-2013), the surface air temp (per GISS and MSU data wrt 2004-2013) stays about level and when the PDO Index is high (1922-1940 and 1980-2004) the surface air temps rose 0.5C and 0.6C. Thus the net increase. The PDO cycle appears to have a cycle of ~50 years.
for plot of the GISS data: http://data.giss.nasa.gov/gistemp/graphs_v3/Fig.A2.gif
Now that the PDO Index has gone high for 2014 (per your PDO plot), we see that 2014 surface air temps have gone up.
for data look here: http://data.giss.nasa.gov/gistemp/tabledata_v3/GLB.Ts+dSST.txt
Your MSU data has similarly gone up this year.
If the PDO Index is a driver as you say it is, and if it stays with its ~50 year periodic form, we are due about 0.5C increase in the next 25 years (until 2040) , no increase from 2040-2065, ~0.5C increase of 0.5C by 2090 (anomaly at 1.6C which is 2.0C above 1020 minimum).
Just a first order calculation assuming that natural cycle in PDO stands.
Typos in last 2 lines of the above.
Should read
“no increase from 2040-2065, ~0.5C increase by 2090 (anomaly at 1.6C which is 2.0C above 1920 minimum).”