OR: Why I Should Have Been an Engineer Rather than a Climate Scientist
I’ve been inundated with requests this past week to comment on the NOAA and NASA reports that 2014 was the “hottest” year on record. Since I was busy with a Japan space agency meeting in Tokyo, it has been difficult for me to formulate a quick response.
Of course, I’ve addressed the “hottest year” claim before it ever came out, both here on October 21, and here on Dec. 4.
In the three decades I’ve been in the climate research business, it’s been clear that politics have been driving the global warming movement. I knew this from the politically-savvy scientists who helped organize the U.N.’s process for determining what to do about human-caused climate change. (The IPCC wasn’t formed to determine whether it exists or whether is was even a threat, that was a given.)
I will admit the science has always supported the view that slowly increasing carbon dioxide levels in the atmosphere from burning of fossil fuels should cause some warming, but the view that this would is any way be a bad thing for humans or for Nature has been a politically (and even religiously) driven urban legend.
I am embarrassed by the scientific community’s behavior on the subject. I went into science with the misguided belief that science provides answers. Too often, it doesn’t. Some physical problems are simply too difficult. Two scientists can examine the same data and come to exactly opposite conclusions about causation.
We still don’t understand what causes natural climate change to occur, so we simply assume it doesn’t exist. This despite abundant evidence that it was just as warm 1,000 and 2,000 years ago as it is today. Forty years ago, “climate change” necessarily implied natural causation; now it only implies human causation.
What changed? Not the science…our estimates of climate sensitivity are about the same as they were 40 years ago.
What changed is the politics. And not just among the politicians. At AMS or AGU scientific conferences, political correctness and advocacy are now just as pervasive as as they have become in journalism school. Many (mostly older) scientists no longer participate and many have even resigned in protest.
Science as a methodology for getting closer to the truth has been all but abandoned. It is now just one more tool to achieve political ends.
Reports that 2014 was the “hottest” year on record feed the insatiable appetite the public has for definitive, alarming headlines. It doesn’t matter that even in the thermometer record, 2014 wasn’t the warmest within the margin of error. Who wants to bother with “margin of error”? Journalists went into journalism so they wouldn’t have to deal with such technical mumbo-jumbo. I said this six weeks ago, as did others, but no one cares unless a mainstream news source stumbles upon it and is objective enough to report it.
In what universe does a temperature change that is too small for anyone to feel over a 50 year period become globally significant? Where we don’t know if the global average temperature is 58 or 59 or 60 deg. F, but we are sure that if it increases by 1 or 2 deg. F, that would be a catastrophe?
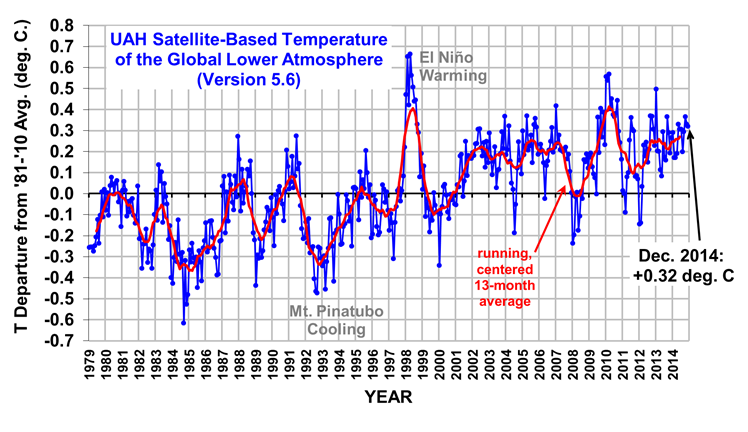
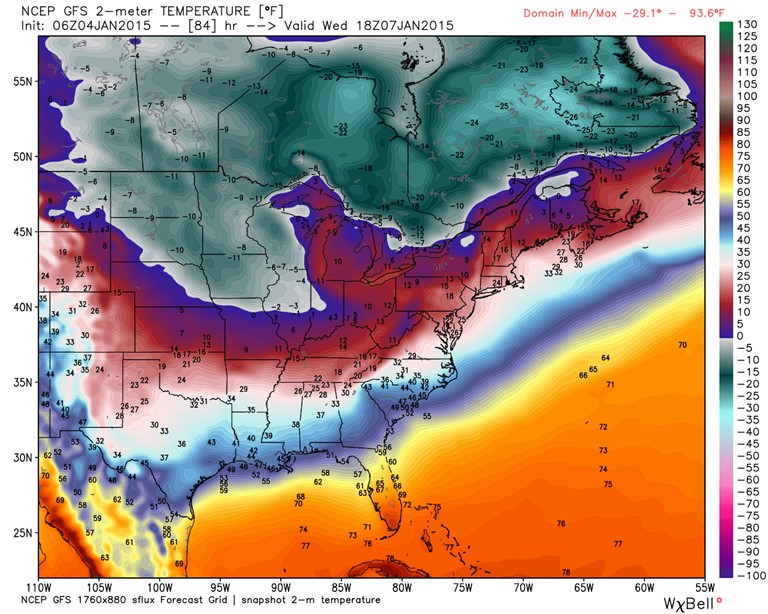
Where our only truly global temperature measurements, the satellites, are ignored because they don’t show a record warm year in 2014?
In what universe do the climate models built to guide energy policy are not even adjusted to reflect reality, when they over-forecast past warming by a factor of 2 or 3?
And where people have to lie about severe weather getting worse (it hasn’t)? Or where we have totally forgotten that more CO2 is actually good for life on Earth, leading to increased agricultural productivity, and global greening?:
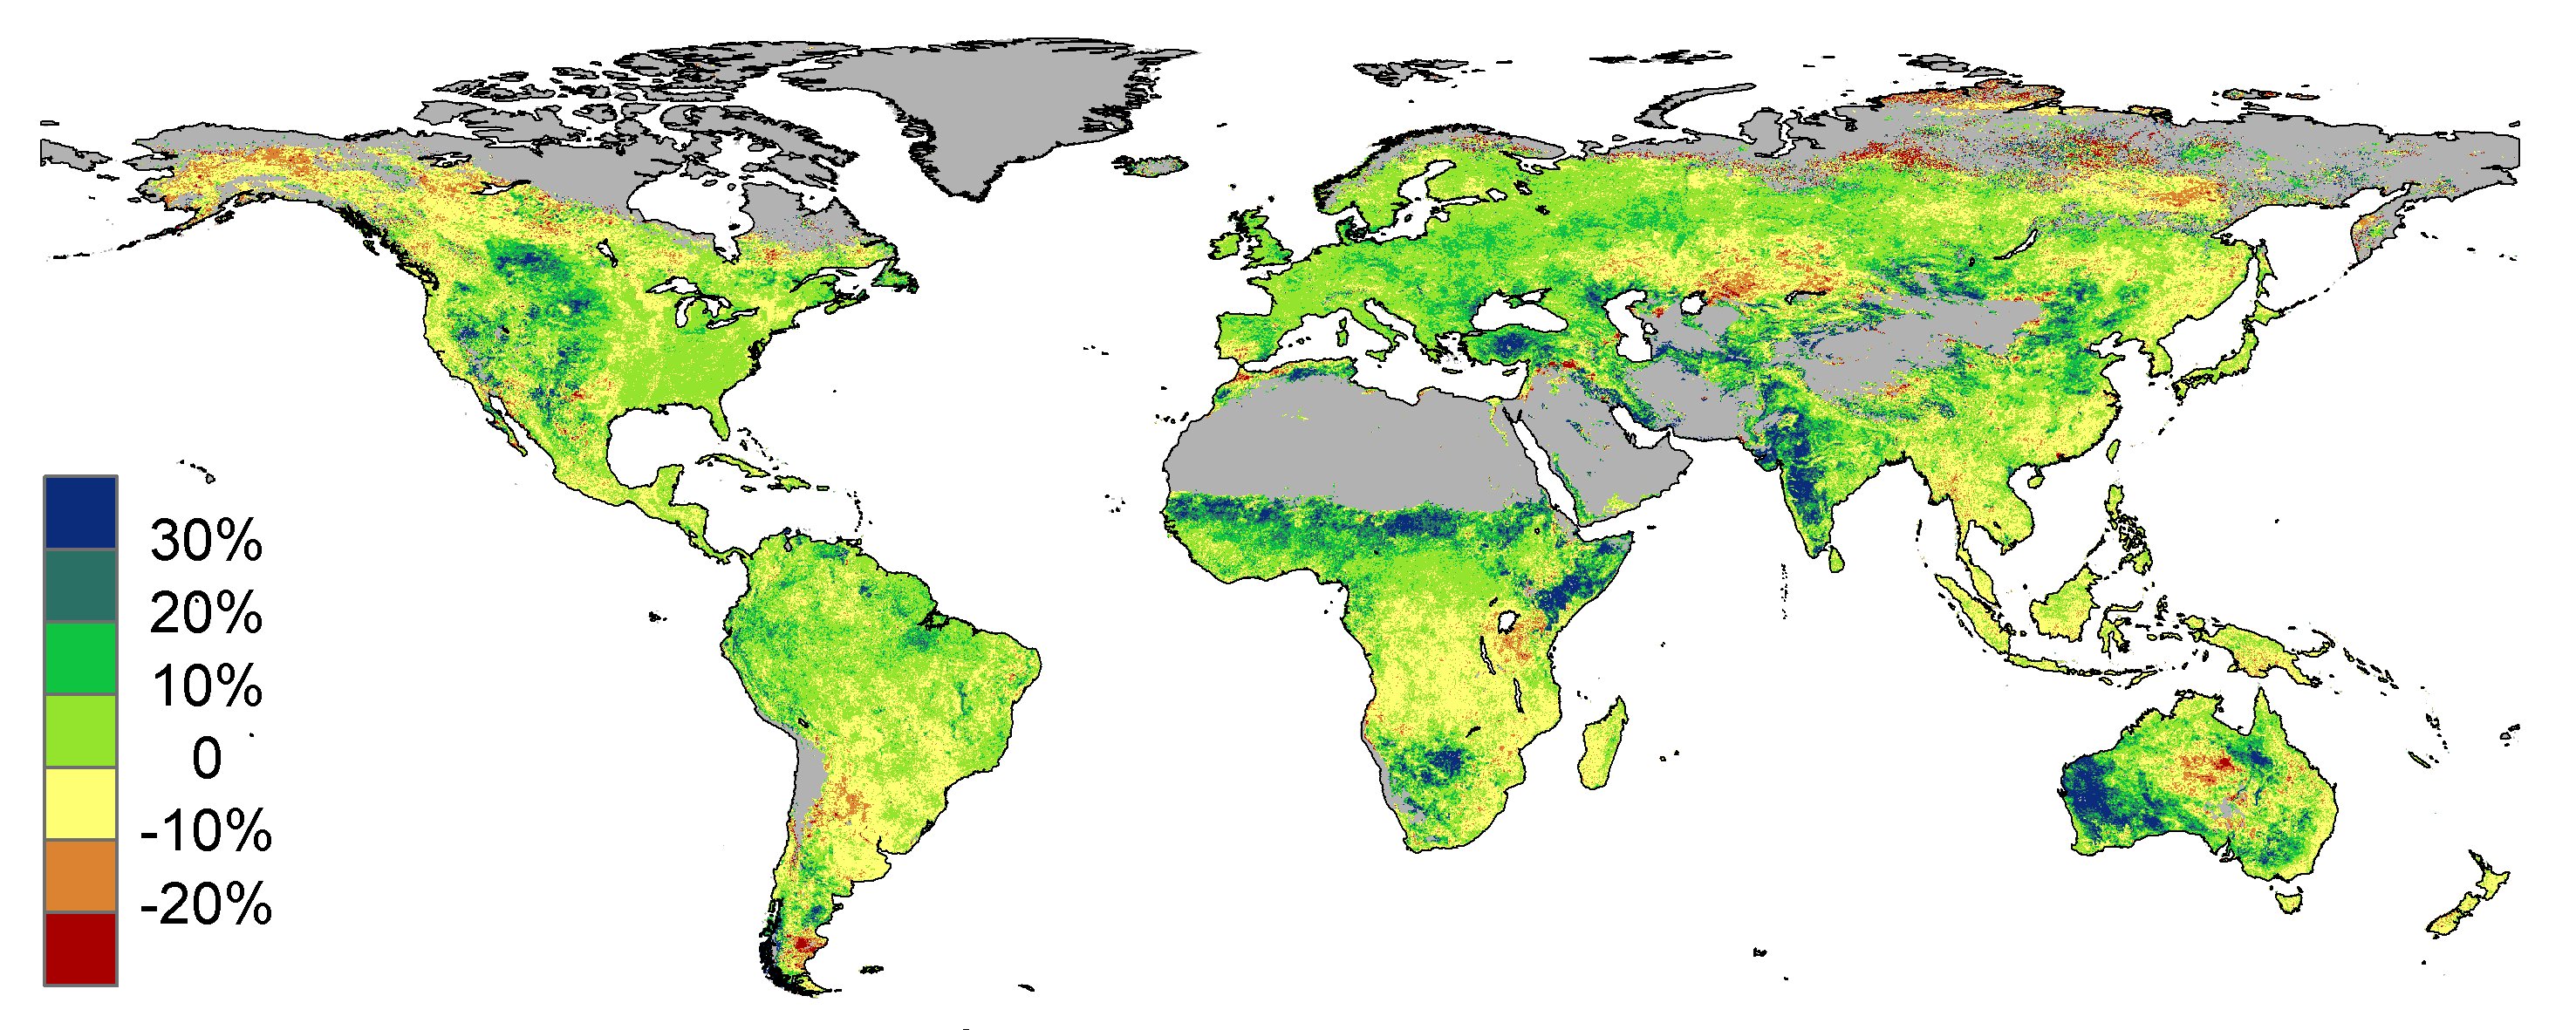
Estimated changes in vegetative cover due to CO2 fertilization between 1982 and 2010 (Donohue et al., 2013 GRL).
It’s the universe where political power and the desire to redistribute wealth have taken control of the public discourse. It’s a global society where people believe we can replace fossil fuels with unicorn farts and antigravity-based energy.
Feelings now trump facts.
At least engineers have to prove their ideas work. The widgets and cell phones and cars and jets and bridges they build either work or they don’t.
In climate science, whichever side is favored by politicians and journalism graduates is the side that wins.
And what about those 97% of scientists who agree? Well, what they all agree on is that if their government climate funding goes away, their careers will end.

 Home/Blog