
 Home/Blog
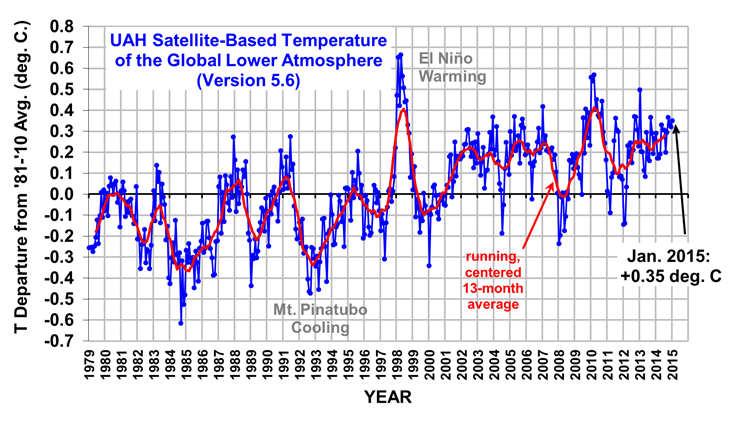
The Version 5.6 global average lower tropospheric temperature (LT) anomaly for January, 2015 is +0.35 deg. C, little changed from the December 2014 value of +0.32 deg. C (click for full size version):
The global, hemispheric, and tropical LT anomalies from the 30-year (1981-2010) average for the last 13 months are:
YR MON GLOBAL NH SH TROPICS
2014 01 +0.291 +0.387 +0.194 -0.029
2014 02 +0.170 +0.320 +0.020 -0.103
2014 03 +0.170 +0.338 +0.002 -0.001
2014 04 +0.190 +0.358 +0.022 +0.092
2014 05 +0.326 +0.325 +0.328 +0.175
2014 06 +0.305 +0.315 +0.295 +0.510
2014 07 +0.304 +0.289 +0.319 +0.451
2014 08 +0.199 +0.244 +0.153 +0.061
2014 09 +0.294 +0.187 +0.401 +0.181
2014 10 +0.365 +0.333 +0.396 +0.189
2014 11 +0.329 +0.354 +0.303 +0.247
2014 12 +0.322 +0.465 +0.178 +0.296
2015 01 +0.351 +0.551 +0.152 +0.126
The global image for January, 2015 should be available in the next day or so here.
Popular monthly data files (these might take a few days to update):
uahncdc_lt_5.6.txt (Lower Troposphere)
uahncdc_mt_5.6.txt (Mid-Troposphere)
uahncdc_ls_5.6.txt (Lower Stratosphere)


