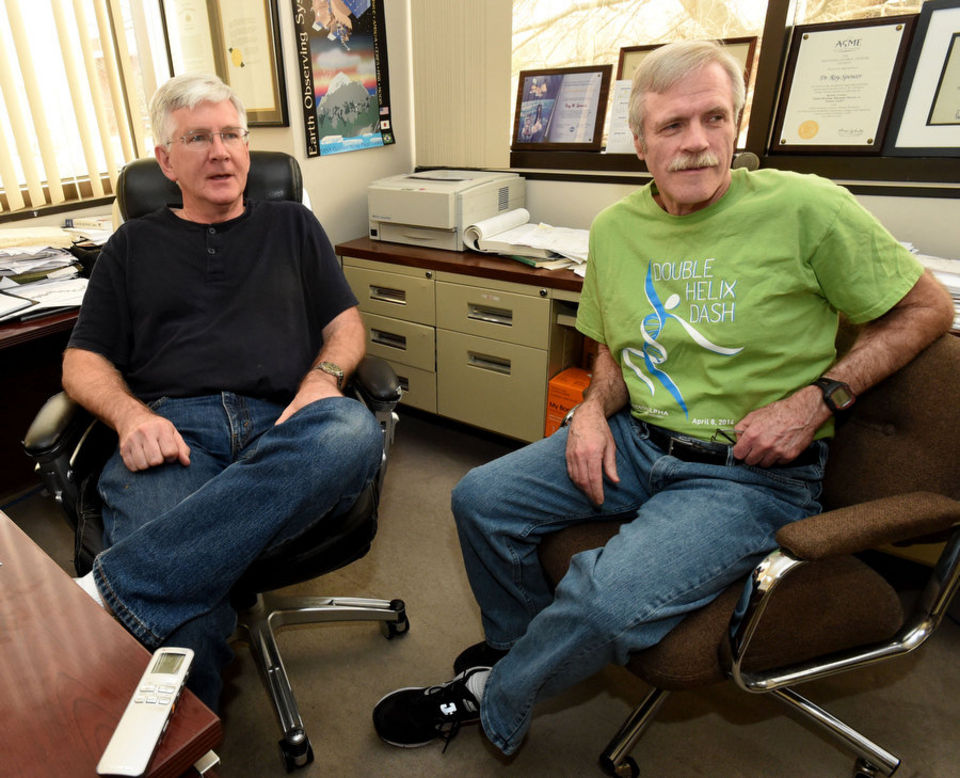
A story today by Paul Gattis at AL.com has the details:
“The silver anniversary of Roy Spencer’s career-defining moment arrived with no expectation in March. He didn’t realize it until someone mentioned it to him.
For John Christy, he had no idea that a discovery announced in 1990 would not only still resonate 25 years later but would be at the center of a raging debate.
The date was March 29, 1990. That was the day – though unbeknownst to either Christy or Spencer – they publicly became climate change skeptics.” ..the rest of the story here.
I thought satellite monitoring started in 1979. What happened in 1990? Did you start in 1990 with data from 1979?
Yes. Read the abstract here:
http://www.sciencemag.org/content/247/4950/1558
Dr Spencer, let me add my thanks for (a) being a real scientist and going wherever the data leads you, and (b) having the courage to stick it out in the face of criticism.
What? 25 yrs? Can’t be … sigh, seems like the years go by faster each and every year.
Happy Anni Dr. Spencer. At least there is one place a person can get data that bears some resemblance to reality. Keep up the good work.
Congratulations on the 25th anniversary. I hope to see another 25 years.
Twenty five years on the Koch/big-oil payroll! You must be a kazillionaire. (Good work. And cheers.)
Good grief guys, doesn’t anyone recognize it’s April Fool’s Day.
“On the positive side, I could have just been an average researcher who never did anything of note. So I feel blessed to be in the position that I’m in.” — RWS
See the earlier post, this one’s for real.
I agree ,it is an April Fools article.
Thanks for providing the best global thermometer since 1979. And happy April 1st!
Hey congrats, and this is a powerful data set. I am looking forward to clarification about if this is a joke…. bc i dont think I get it. 1978 satellites started collecting a full spectrum of data but that raw data is a great distance from a measurement for temperature that you provide. I am curious (if this is the case) what the initial rational for the satellite data was and why the funding was awarded. The history sounds like a fascinating story.
Dr. Spencer,
Congratulations and thank you for your courage, intestinal fortitude and intellectual integrity.
That’s an enlightening interview.
April Fools or otherwise, good time to send on congratulations to both of you guys for an outstanding job showing how science should be done.
Now…if we could just get Roy up to speed on the 2nd law. đŸ™‚
đŸ™‚
There’s a link in the article at the end:
http://www.al.com/news/huntsville/index.ssf/2015/04/7_questions_with_john_christy.html
This was balanced newspaper article for once. What to believe – reality or a computer model ? The graph is a powerful argument. My hunch is that models have many small biases built in which all add up to a big bias. Any uncertainty it seems the model errs on side of warming. Just like temp history adjustments.
“…reality or a computer model?”
At present, in terms of area:
Southern Sea Ice Anomaly* + 1,152,000 sq km
Northern** Sea Ice Anomaly – 841,000 sq km
Global Sea Ice Anomaly + 311,000 sq km
* Compared to 1979-2008 mean.
** The actual Arctic Basin – where most of the multi-year ice subsists – shows a cover of 4,200,000 sq km, and almost no anomaly.
Source: Cryosphere Today
Global sea ice (we only have 30 years of good measurements) –
http://arctic.atmos.uiuc.edu/cryosphere/IMAGES/global.daily.ice.area.withtrend.jpg
Except for a short period between 2006-2013 where there seems to have been some changes in wind patterns in the Arctic, things look fairly stable. Unfortunately we have such a small amount of data we don’t really have a good grasp of the range of natural variability over decadal time scales. Unless you’re a hysterical person of course, and can see scary things in that graph that aren’t actually there.
Sea Ice Anomalies:
You see, in the South there is cunning land ice slipping off the continent, floating outwards, and PRETENDING to be sea ice. In the North, well that is just the expected melting, n’est pas? A Cambridge Professor told us the Arctic ice would – really, really – be all gone this summer of 2015.
In the alternative, increased energy in the whole system, from global warming, is sweeping ice – before it can melt – in a hidden, mighty, current from the North Pole to the South Pole.
I do not know where the counter-current is; I have not worked out all the details.
Ah yes, this is the insane activist claim that increases in global sea ice means global warming is getting worse.
A “‘jump the shark’ moment.”
For “n’est pas” read “n’est-ce pas.”
I also want to add my “thank you” for the data you provide with or without commentary and the work both of you do. Its not April 1 so its not a joke. I am certain there are not enough of these thoughts these days with the Nuticelli NUTS influencing newpaper readers.
As an earth scientist of 45 years I too use data, and lots of it, to guide me where ever it might go. Its always a fun ride in this field. Sometimes there are preconceptions, I admit, but when the data goes another way its time to rethink one’s habits.
I also lecture to many local groups as to the many deceptions that warmers hold close and seem not to question. Its a rough ride in a state run by a warmer zealot of a governor, but little successes help along the way. I rely on data supplied by you and John Christy, many others, and many published works available. My talk is entitled (borrowed parts from others), A Defense of Carbon Dioxide-A Deconstructing of Global Warming and Demolishing of Ocean Acidification-Climate Lies More Lies-A Tale of Eight Deceptions. Its a bit long but you get the idea. I did a thesis in the tropics dealing with precipitation of limestone, sea water chemistry so I have a good handle on that side of the carbon cycle.