2015 Will Be Record Warm in Surface Temperatures…But Still Below Model Forecasts

June 22nd, 2015 by Roy W. Spencer, Ph. D.

With 5/12 (41.7%) of the votes counted, John Christy and I are now prepared to call 2015 as the winner of the Warmest Year in the Thermometer Record election. The latest exit polling of El Nino forecasts suggests an unusually hot turnout from the East Pacific region this year, which is why we are calling the election early.

Of course, our UAH satellite data analysis (as well as the RSS analysis) for the lower troposphere continue to show nothing spectacular, although the current forecast for a strong El Nino this year will make 2015 one of the warmest years since 1979.

But today’s post will just deal with the latest global warming pause-busting dataset out of NCDC (now NCEI), which purports to remove evidence for a global warming “hiatus” seen in other datasets. Since the KNMI Climate Explorer website has only the ERSST (ocean) data available for new Karlized version 4 dataset, and since the oceans pretty much drive annual averages anyway, we will stick to the oceans between 60N and 60S latitudes.

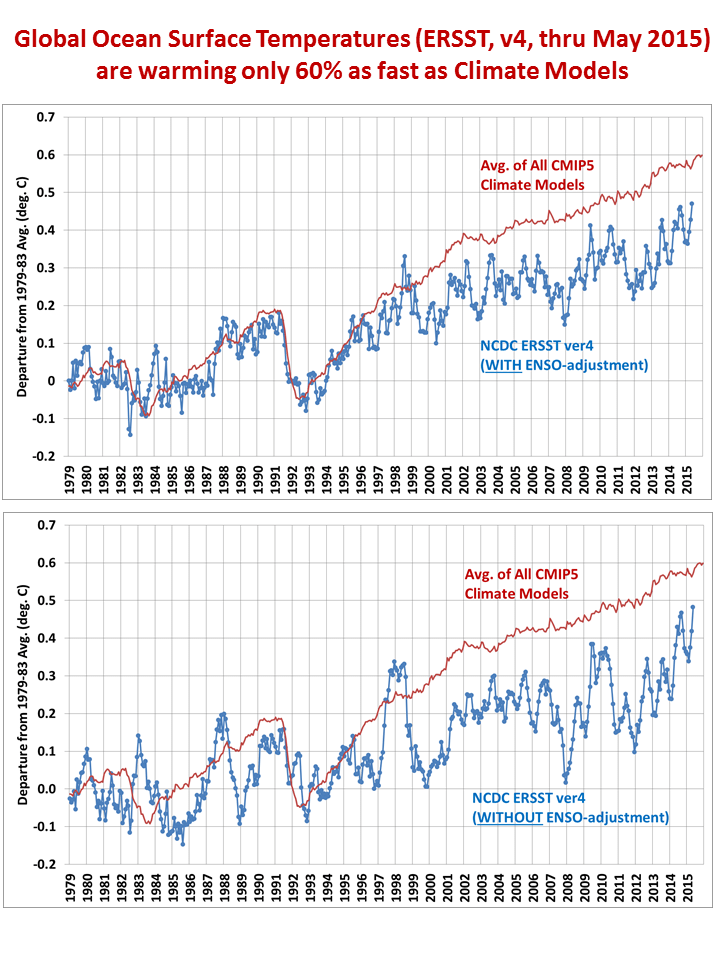
The following plot shows anomalies from the 1981-2010 (30-year) monthly averages, but repositioned vertically on the graph as departures from the 1979-1983 period mean. In the first plot I have removed the average effect of El Nino and La Nina events, which ends up being 0.069 C per MEI index value one month before the temperature measurement (based upon detrended data). The second plot shows the original data.

CMIP5-global-oceans-vs-ERSST-v4

As can be seen, even with the El Nino effect removed (first plot, above) it appears that 2015 is likely to be a record warm year anyway, at least in this official dataset. But even with the highly controversial Karlization procedure applied to the data, the observed warming trend is still only about 60% of the average warming trend in the CMIP5 climate models for the global oceans (+0.18 C/decade for the models, +0.11 C/decade for the observations). This is true whether you compute trends for the entire period, or only since 1996, which is where the two temperature time series diverge more noticeably.

Which brings up a point I have mentioned before: We could have a record warm year, every year, but what really matters is just how much that warming is.

If there was no natural variability, and we had perfect measurements, each successive year could be 0.01 C warmer than the prior year and thus be a new, record warm year…but would we really care?

It’s the long-term difference between (1) the climate models used to promote energy policy changes and (2) the observations, which should drive the global warming debate, not qualitative “record warmest year” statements.

And on that score, even using Tom Karl’s new pause-busting surface temperature dataset, the models continue to come up short.

So, as we approach the United Nations COP-21 (21st Conclave Of the Party-goers) in Paris this December, we’d all better get used to the inevitable “warmest year on record” rhetoric.

Even the Pope is on board this time.


116 Responses to “2015 Will Be Record Warm in Surface Temperatures…But Still Below Model Forecasts”

Toggle Trackbacks

  1. Rick Adkison says:

    What is the current prediction on how long this El Nino will last?

    • NCEP/CPC today says 85% chance it will last through winter. Of course, that’s when El Nino peaks anyway. I suspect it would be very unusual for a strong El Nino to not fade after that, but I’m not an expert.

  2. I think the data Dr. Spencer is using ERSST.v4 is the manipulated data ? If so why are you presenting it as if it is correct?

    Thanks

    • I didn’t call it “correct”. I think i called it “Karlized” and “official”. 😉 We all know that whatever dataset gives the most dramatic effect will get covered the most by the media.

      • DHR says:

        Dr. Spencer

        Re Karlized data and ship cooling water intake temperatures, the Military Specifications of the 70’s or so covered three types of well thermometers of the type used for seawater temperature measurements. These are bimetallic, gas expansion and resistance thermometers. All required an accuracy of plus or minus 2F. I find it difficult to understand how data from such imprecise instruments could be used to come up with a “correction” of sea surface temperatures on the order of 0.1 or so F. Do you know of an explanation?

    • MarkB says:

      I’m not clear why the interval 1979-2015 was chosen for this article aside from the fact that Dr Spencer is a satellite guy hence his world begins in 1979, but the ERSST.v3b and ERSST.v4 have virtually identical linear regression over that period. Differencing the two gives an approximately “V-shaped” plot with the bottom of the “V” circa 2000, that is, v4 runs relatively cooler in the middle of the period and relatively warmer at the beginning and endpoints, but the net warming is is nearly identical.

    • Dirk McCoy says:

      The chart only goes out to 2010… is there one that goes out to 2015? Not having the past five years reminds me of “hide the decline” shenanigans.

  3. Hoi Polloi says:

    Dunno, but it had been coldish all through springtime in Europe and June is far below normal temperature. I guess at the Arctic they’re having extrapolated mediterean subtropical temperatures according ro Cowtan & Way. May be we can have some extrapolated nice weather in W-Europe?

  4. Laurie says:

    Most common capacities are 5000 litres, 10000 litres, and 20000 litres.

    There is considerable expense involved with installing a septic tank.
    The most popular types and styles of these include the following:
    .

  5. mpainter says:

    They obliterated the 2009-10 El Nino and subsequent LaNina.
    The data set appears to be at least 50% fabricated.

  6. geran says:

    If both the Atlantic and Pacific oceans were to freeze over, it would be reported that the cause was AGW!

  7. Max Paola says:

    Dr. Spencer,

    Have you been doing any research into natural variations of the climate system that would cause the discrepancy between the surface record and your satellite LT temperatures? Is this part of some un-named oscillation (perhaps we can call it the Paola oscillation) where periodically the LT temperatures lag surface temps, or the surface temps spike and then return to the LT temps? Since even the BEST data agrees mainly with the other data manipulators, there must be either an error in the satellites or a physical reason why the temps don’t agree. I think it must be physical, because you are too careful to be wrong (and you now agree with RSS!)

    MP

    • Mike M. says:

      Max Paola,

      I agree that the difference between the satellite and surface measurements is important to understand. It seems to me there are two rather obvious sources of disagreement.

      First the “lower troposphere” satellite measurement covers a range of altitudes, extending slightly (I think) into the stratosphere. That would cause the satellite trend to be a little low.

      Second, the surface temperature is the average of daily max and min; from what I understand, that gives a slightly higher trend than daily max. But since min T is often under a nocturnal inversion, and therefore decoupled from most of the atmosphere, it is max T that should correlate best with the satellite measurements.

      Although both factors are in the right direction, I suspect they are not large enough to eliminate the difference.

    • Here is a still-working link to the HadCRUT3 global temperature anomaly, with annual figures and graph (achieved by “optimized averaging” by the Hadley Centre, as opposed to the normal averaging annual figures by the CRU of UEA), smoothed annual figures, and monthly figures:

      http://hadobs.metoffice.com/hadcrut3/diagnostics/global/nh+sh/

      The monthly global data is in this simplified file at WoofForTrees:

      http://woodfortrees.org/data/hadcrut3gl

      Have a look at their graphing of it:

      http://woodfortrees.org/plot/hadcrut3gl

      This has better resemblance to all versions of UAH and RSS TLT than all more modern global temperature datasets and more modern versions thereof, as far as I know. The main difference from latest versions of RSS and UAH TLT is that during the time of TLT datasets, HadCRUT3 warms about .03 degree/decade faster than the latest TLT datasets, and ENSO (especially the 1998 spike) matters less for surface temperature than for TLT. (For that matter, HadCRUT3 shows the 1998 spike more than every more modern surface dataset.)

      The surface-adjacent troposphere seems to me to have warmed .02-.03 degree/decade faster than the main part of the lower troposphere, or the lower troposphere as sampled by TLT weighting curves, according to Figure 7 in http://www.drroyspencer.com/2015/04/version-6-0-of-the-uah-temperature-dataset-released-new-lt-trend-0-11-cdecade/

      One thing I see is that, as best as I understand, the methodology of HadCRUT3 is based on Brohan et al. 2006, according to my first link here. It seems to me that during the time this methodology was developed, which I think was a little before 2006, The Pause had not yet become significant. Smoothed HadCRUT3 according to my first link peaked in 2004-2005, even though HadCRUT3’s warmest individual year is 1998, and that happened before The Pause became obvious. So I think the methodology used for Brohan et al. 2006 is without much consideration for a pause that was not yet obviously existing when that methodology was being developed.

      • Kristian says:

        You’re absolutely right, Donald. As time went by, HadCRU (and their associates) discovered that the global temperatures didn’t continue in the direction they’d planned, and so something had to be done. Their version 3 needed “correction”.

        However, to this day, HadCRUt3 is still the global surface instrument time series that most closely agrees with the satellites:
        https://okulaer.files.wordpress.com/2015/06/uah-6-vs-hc3.png

        As you can see, there is no real discrepancy other than the tropospheric amplitudes being larger. You will however notice that the HadCRUt series has been adjusted down by 0.064K from Jan’98 on. This is due to a never rectified (or even mentioned) calibration error causing a spurious jump in the HadSST2 temps (+0.09K) following a switch in data sources between 1997 and 1998:
        https://okulaer.files.wordpress.com/2014/09/hadsst-vs-the-others.gif

  8. Slipstick says:

    I am always bemused by these “the models aren’t perfect so we should ignore them and pretend there is no reason to be concerned” arguments. Be it 0.05 or 0.15 or 0.25/decade, temperatures and sea level continue to rise and we have a problem; the only question is the scale of the problem. I think it would be most interesting to revisit this topic come January or so and again late next year, after the El Nino has played out (if it hasn’t by then we have a very big problem).

    • Ed Mihelich says:

      “Be it 0.05 or 0.15 or 0.25/decade, temperatures and sea level continue to rise and we have a problem” (Slipstick). There are many obvious problems with this statement. First: 0.5 K per century is certainly no problem at all – this is half the Stephan-Boltzman number. Second: Satellite measurements show that global temperature has been flat for nearly two decades. Third: Catastrophic climate predictions have always depended on warming at the high end. Without that, the argument fails.

      • Slipstick says:

        First: What is the “Stephan-Boltzman number”? I’ve never encountered it.
        Second: In fact, sea surface temperatures haven risen in excess of 0.3 degrees in the last two decades.
        Third: How ’bout we consider avoiding a catastrophe? Costs related to extreme weather events have increased precipitously (yes, that was a sort-of pun) just in the last couple of decades (Don’t believe me, read the reports from the reinsurance companies.) If we pretend there is no problem, mitigation and remediation costs will be in the trillions in the next few decades.

        • An Inquirer says:

          Costs for extreme weather are not going up because of more extreme weather. In the U.S., tornadoes are down, and hurricanes are hitting the U.S. at unprecedented low numbers. There can be increased costs because we are building more where extreme weather hits, because property owners have become more sophisticated in submitted insurance claims (I am one example of that), because government is mandating insurance companies cover costs not previously covered, and because of population increases. Nothing about CO2 is causing those phenomena.

          Concerning ocean temperatures, I have examined the records from buckets to satellites. I see nothing alarming.

          • Slipstick says:

            “It’s not happening in the U.S., therefore it’s not happening” does not follow. The continental U.S. covers less than 2% of the Earth’s surface. How much did the record flooding in SE Europe cost? How about Australia? How about the two consecutive record monsoon seasons in Pakistan that damaged or destroyed every bridge on the Indus River? How about the Pacific typhoons in the last few years? I could go on and on. Oh, and in the U.S., costs in just Dallas from the recent record rainfall were in excess of US$60 million as of a few weeks ago. Get your head out of the sand, it’s getting wet.

          • Lewis says:

            As stated elsewhere, if we didn’t build in flood plains we wouldn’t get flooded. If we didn’t build on the side of mudslide prone hills, mudslides would not be a problem.

            Slipstick, the problem is man, not the variety of natural events. A record flood, since when? Noah’s time? In predicting floods there are 100 year events, 500 year events and 1000 year events. The point is that at some time, a lot of rain is going to fall. The other side of that is it is going to get very dry sometimes.

            Nature has no concern for man or his structures, so if man was as smart as some people think he is, he wouldn’t build on barrier islands, or flood plains etc.

          • An Inquirer says:

            Alarmists love to use the U.S. when it suits their purposes and then are shocked when skeptics point out nothing unusual about what is happening in the U.S. Then they try the world, but for those who know world history, they again fall flat.

            There is nothing unprecedented about Pacific typhoons in the last few years. Despite the shell game tried by a couple of alarmists, honest analysts point out that historic typhoons have been worse. At the start of the last century, the Indus River had worse flooding, but they did not have as many bridges. Historically, Australia has had worse droughts, hotter weather, and more rainfall in the past. Some sort of record Rainfall will be set someplace in the world each year. It is a matter of statistics. Instead of telling clear-headed people to get their heads out of the sand, you would do well to get your head educated.

        • geran says:

          “…we have a problem…”
          “…we have a very big problem…”

          If Alarmists didn’t have any problems, they would invent some.

          Oh, wait….

      • Woody says:

        So. The proverbial frog is put in a kettle of cold water which is then set on a stove with very low heat. The temperature rises – just a fraction of a degree each moment in time. For most of that frog’s remaining moments on Earth, 99% of those temperature increments mean nothing. Then, when it is too late, they do. Your argument seems to be that if AWG = 0.1 degree per year or per decade, so what as long as it is less than models? Similarly, it must be OK if the race car driver that predicted his car could go 240 mph crashes into a wall at only 200 mph because the car underperformed. Your argument presumes you know the temperature increment that does matter. Do you? Really?

        The problem with analyzing a planet with even exceptional knowledge of math, physics, meteorology and a sprinkling of argumentum ad populum (such as suggesting that if a little bit of something is good, then more of that thing must be better); is that natural systems just don’t work that way. Sure systems are resilient and adaptive; but they also have tipping points and unpredictable positive feedbacks; so sayeth the dinosaurs of a bygone era and the North American carrier pigeon since the advent of the Confederate flag. The fact that we will never be able to fully understand and control the tipping points and negative feedbacks is no justification for ignoring the signs.

        And costs? In the U.S. air pollutant emissions have been halved as GDP has doubled; all while surviving the doom and gloom prognostications associated with removing lead from gasoline and excess sulfur and soot from EGUs. Any discussion of costs can include unintended consequences (such as your heartfelt desire to bring the benefits of cheap energy to the poorest reaches of central Africa), but should also include a fair assessment of the cost of no action as well as inclusion of co-benefits such as reduced ocean acidification and reduction of air pollutants that are fellow travelers.

        • Robert Austin says:

          Oh yes, invoke the fabulous tipping points when actual temperature rises do not elicit enough fear. The systems are, by definition, not resilient if they have “unpredictable positive feedbacks”. And why would we want to control negative feed backs? The only plausible “tipping point” is to the next glaciation. There is no palaelogical evidence for a tipping point to regime significantly hotter than our present climate regime, the Stefan-Boltzman relation almost certainly precludes it. You entire logic boils down to hand waving scary scenarios calling for the application of the execrable precautionary principal.

    • ELC says:

      Overall, sea level has been rising for about 12,000 years.

  9. Aaron S says:

    An interesting graph would be the difference between modeled and measured temperature through time. It would show the seemingly systemic error that needs corrected in any ‘best effort’ or unbiased model to represent the base case for future warming.
    The thing I dont understand is how anyone makes the case that there is certainty that the warming is not at least partially natural given: 1. sea level was 6m higher last interglacial (I have collected and described Pleistocene fossils from corals that are quarried in key west and grew to sea level 120kyr ago), 2. that the relationship between the orbital forcing and climate are poorly understood… ie the trends do not match one to one in time, and 3. We do not understand the role of cosmic rays on climate and we are exiting a very active solar phase. This entire warming phase could be a natural event related to random noise during the prolonged peak from orbital forcing or from the pulse of heat from the a stronger sensitivity to the sun with a moderate lag in cooling as the oceans release heat. Not to say CO2 isnt a top contender, but there are other data driven hypotheses and the simplest explanation is the earth is not that sensitive to CO2.

  10. ossqss says:

    Everything will become Paris material. It is what they intend to do!

    I am surprised the very strong G4 solar storm today has not been blamed for something that could be used in Paris already.

    The propaganda dam will burst in the coming months. Sad really, most don’t understand the what the Paris meeting is really after.

  11. mpainter says:

    Slipstick
    Relax, calm yourself. Fright impairs the ability to reason. Read the comment of the Inquirer above. Put aside your fears and _think_.

    • Slipstick says:

      No fright, just realism. The risks and the costs are not hypothetical.

      • Stan B says:

        The “risks” are exaggerated. There is nowhere in the historical record where temperatures went careening wildly out of control in the Geologic Record, even with CO2 levels 5 to 10 times what they are today. Life prefers WARMTH! It thrives in warmer climes and falls off precipitously as you move to the frozen poles. That YOUR life might be disrupted seems a bit egocentric if you ask me….

        • JohnKl says:

          Hi Stan B,

          Actually, the Ice Age onset happened extremely rapidly. For example, millions of mammoths and mastadons froze quickly preserved food remains can still be recovered from their remains. Extensive amounts of additional evidence exists to support rapid freezing.

          Have a great day!

  12. The way I see the graph for CMIP5 average and ENSO-corrected Karlized official data, the divergence between the two starts around the beginning of 1999 and becomes looking statistically significant in early 2004.

    These two times are close to two times when the pause arguably started. One of those times is in late 1988 or very early 1999, when a linear trend of everything that happened afterwards in HadCRUT3, RSS, or UAH V.6.0beta intersects with the falling edge of the 1998 El Nino spike. That time appears to me to divide the 1/1/1979-onwards era into two segments where the standard deviation from two linear trends separated by a small upward step is lowest. However, the slope of the later linear trend is slightly warming. (Standard deviation from two the linear trends appears to me as lower still if the breakpoint is when the upward step is at the leading edge of the 1988 El Nino spike, in mid-late 1997. However, the upward step from the earlier linear trend to the later one is large.)

    Around the beginning of 2004 is another arguable time for the pause to have started, on basis of looking for a breakpoint. That is when the 1/1/1979-onward era can be broken into two subsets whose linear trends in HadCRUT3, RSS, and UAH V.6.0beta meet each other.

    There is yet another arguable starting time of the pause that is in-between. That is when the linear trend in HadCRUT3, RSS or UAH V.6.0beta of after this time intersects with an upward crossing of the monthly data, where the monthly data bounces reasonably evenly about this trend line afterwards, and is mostly below this trend line before that start time. This seems to me as sometime in 2000 or 2001.

  13. Frank says:

    Roy wrote: “It’s the long-term difference between (1) the climate models used to promote energy policy changes and (2) the observations, which should drive the global warming debate, not qualitative “record warmest year” statements.”

    Exactly correct. So why didn’t scientific skeptics like you tell their political friends like Lord Moncton and half of the speakers at the latest Heartland Conference to shut up about the hiatus (which was always likely to end with the next strong El Nino) and focus attention on the difference between projections and observations. That difference is certain to last for the next decade and probably forever.

    • Mike M. says:

      Frank,

      The likes of Lord Moncton don’t listen.

    • Robert Austin says:

      The “hiatus” was there and acknowledged by most climate scientists until St. Karl of NCDC worked his miracle upon the data. The failed warmist climate prophesies are legion but the warmists are given licence to move the climate goal posts with impunity when their egregious prognostications fail.

  14. mpainter says:

    Frank:
    A temperature spike such as a strong El Nino can hardly end the long term flat trend which is the hiatus.

    • FTOP says:

      Climate science always seems to trip over those two challenging subjects – logic and math.

    • lewis says:

      That’s an interesting thought. If the El Nino produces a spike, then the temperatures would drop afterwards showing cooling from one year to the next. That will make for interesting political posturing.

  15. Nate says:

    Yes Frank, the ‘hiatus’ has always owed a thanks to the super El Nino of 1998 for its existence.

    If one performs the El Nino/La Nina removal analysis, as Roy did, then the ‘hiatus’ disappears from all of the ocean data sets, GISS, Hadcrut, etc.

    • Doing ENSO removal to HadCRUT3 seems to me as probably merely delaying the start time of the hiatus to sometime in or around 2001, no later than 2005. More modern surface datasets would get a serious slowdown starting sometime very early this decade.

      • More modern datasets so badly Karlized as to not have much of a slowdown starting around the beginning of this century also show slower warming rate from the mid (or late) 1970s to 1999 than datasets that show a slowdown / pause.

        In any case, all of the datasets are falling short of most of the CMIP5 models, and the extent of this is looking significant.

  16. Lewis says:

    On the Pope’s encyclical:

    Interestingly enough, while the left adores all of Pope Francis’ remarks about saving the environment, it ignores his comments in the same encyclical opposing abortion and other population-control measures. “Since everything is interrelated,” the pope wrote, “concern for the protection of nature is also incompatible with the justification of abortion.” And he continued: “How can we genuinely teach the importance of concern for other vulnerable beings, however troublesome or inconvenient they may be, if we fail to protect a human embryo, even when its presence is uncomfortable and creates difficulties

    From: http://personalliberty.com/the-left-sure-loves-the-popes-encyclical/

  17. mpainter says:

    ENSO removals are simply the acting out of their fantasies by the hard core AGW zealots. More dubious science thrown on the wall in the hope that it will stick. Not a forlorn hope, because a surprising amount of the stuff does.

    • Nate says:

      If you prefer, don’t remove them. But then you are confronted with a new record temperature, which ends the ‘hiatus’.

      You can’t then blame the coming 2015 record on ENSO, as Roy sort of wants us to do, without also blaming the hiatus on ENSO.

      In reality, we should be careful in trying to extract meaning from short-term trends when there is significant climate noise such as ENSO, volcanoes, PDO, etc.

      Looking at the 50 year trend, one can see that the last 15 years do not significantly depart from it. One way to see this is to change the start year or end year and see that that can make a big difference in the ‘trend’

      • Looking at the past 50 years, all versions of both major satellite TLT datasets and HadCRUT3 show a downturn/pause that is looking significant. For that matter, even HadCRUT4 (version 4.0 that is) is showing a noticeable slowdown. And everything is largely departing downward from most CMIP5 models somewhere on the falling edge of the 1998 El Nino spike, and these departures seem to be getting statistically significant around 2004-2005. And it seems to me that not even T. Karl achieved a change from this.

        • Nate says:

          I understand what you are saying. Here’s what I have done. I did a linear fit of the monthly Hadcrut 4 from 1/1965 to 4/2015. I get a nice line thru the data with a slope 0f 0.0153, i.e. 0.153 deg/decade.

          You could find a flattening from ~2002-2013. But is it significant signal within the noise? Is it unprecedented in the 50 y period? I would say no-i.e. it is similarly flat from 1968-1980. I see that the period 2007-2009 is below the line, but 2010 and 2014-15 are above the line. Certainly the rest of 2015 and likely 2016 will be above the line.

          The question is what time periods are expected for the noise on top of the presumed trend? ENSO for one has 3-5 year periods, but also decadal or longer strengthening and weakening.

          What was going on with ENSO during 2002-2013? Overall this period was dominated by weak El Ninos and strong La Ninas compared to the prior 2 decades, There were a string of weak El Ninos in the first half of this period and, a moderate one in 2010, and strong La Ninas in the second half. Hence the flattening that you see, but still fitting the 50 y trendline.

  18. ren says:

    The temperature rises in the northeast Pacific (PDO) and the Indian Ocean.
    Inhibition of the Pacific will wind drought in many parts of the Earth. At the same time drops the amount of water vapor in the atmosphere of the entire earth, which in the long run will cause cooling (in the winter).
    http://weather.gc.ca/saisons/image_e.html?id=daily&img=2015062300_054_G6_global_I_SEASON_tm@lg@sd_000&bc=sea

  19. mpainter says:

    Nate,
    Let me see if I understand you correctly:
    We should remove the ENSO part of the record in order to fabricate a continuation of the “hiatus”.
    That does not appeal to me, nor is it necessary. You forget that El Nino is inevitably followed by a LA Nina. So the pause continues. As Roy pointed out, records are meaningless, except as grist for the cAGW propaganda mill.
    I note that you characterize ENSO, PDO, and what else as climate noise? Ah, the Atlantic thing. What about the increase in insolation circa 1985-2000? Do you call that noise, too? You are dreaming the wet dream of the AGW zealots.

  20. mpainter says:

    And Nate,
    You seem to be saying we are in a 50 year warming trend. Is that straight from HotMoma’s? ah, I mean HotWhopper.

  21. mpainter says:

    Dirk, look closer. The chart is current.

  22. mpainter says:

    Yes, and witches were real for people like the citizens of Salem, Massachusetts in 1692.
    As determined by a judicial proceeding, no less. How really real for the victims of that.

  23. djcecil says:

    Since Roy and John are ready to project 2015 as the winner of the Warmest Year in the Thermometer Record, I’ll go out on a limb and predict that 2015 will be yet another record year for global life expectancy. I don’t have the raw data, but it would be fun to run a correlation between long-term plots of life expectancy:
    http://ourworldindata.org/data/population-growth-vital-statistics/life-expectancy/
    and CO2 or temperature estimates. Just correlating it with global temperature would be at least as sound as a lot of the CAGW stuff that gets published (and press-released) in the journals and science magazines these days.

  24. Mark Luhman says:

    Woody You are the master of Straw arguments, first of all the climate has been warming since we left the little ice age, second this has been the coldest time period since we got out of the last ice age the trend for the last 10,000 years is down not up. Third the climate is not unstable and there in all probability no tipping point towards uncontrolled warning, the geological record does not have any, yet we know there is toward cold, even at that the tropics stay remarkable stable. Lastly you GDP remarks are idiotic yes the GDP has double since we have reduced pollution that does not tell us much without reducing pollution what would the be, a recent study showed that without the cost of government regulation since 1940 the GDP would be much larger to the magnitude of at least over ten times of what it is now, of course we could debate weather we would want to live in such a world, but I inclined that we could have clean air, water and soil and a safe work place with far less government regulation, we are now to a point the cost to benefit ration are far out of whack, the Clinton administration of moving arsenic in water fro 50 PPB to 10 PPB had a cost of over 200 million per life save, if I were to accept that the regulation save those live could we not have use that money to save far more live than that, I also do not truly believe the change in the regulation saved anyone. The EPA use of linear interpretation of a poison is known junk science, most poison after a certain level have no affect, on top of that without some arsenic in our diet we would die.

  25. Tim Wells says:

    Two British papers have just come out with headline that UK is going to be hit by a mini ice age. Funny I have been saying that since I walked out of a Carbon Management company in 2006, after discovering it was a fraud and hoax.

    • wayne says:

      Good for you Tim, walking away. That is about the same time I smarted up to what was happening. The real sad part is I can see that in nearly every industry, not speaking just of scientists manufacturing this supposedly unnatural ‘global warming’ but of shear dishonesty and a lack of integrity across the board.

  26. mpainter says:

    Woody,
    Atmospheric CO2 is entirely beneficial. It is the utmost fundamental substance of life and all life forms will benefit from its increase and those who depict it as some kind of poison are examples of foaming alarmism.
    One of the many benefits of increased atmospheric CO2 is milder winters. This benefit unfortunately has yet to materialize, despite the promises of 97% of the climate would-be scientists. If this promised benefit should materialize, it will mean shorter, less severe winters, less winter mortality, lower fuel bills; a longer growing season for agriculture with less crop damage due to late frosts; this last a most important consideration in a world with a burgeoning population.
    So, relax, put aside your fears, do not let the foaming alarmists infect you with their climate hysterics.

  27. Entropic man says:

    Roy Spencer

    It is disappointing that a scientist would leave out information relevant to the discussion.

    You show that the mean of the CMIP5 models is higher than the actual record. You imply that this is because all the models are wrong and therefore global warming is not a problem.

    What you fail to mention is that, in these models, real world non CO2 forcing were included up to 2005 and then estimated or randomised thereafter on the basis of previous 20th century experience.

    Ten years later we know from observation that the real world non CO2 forcing were more negative than the 20th century average.

    The models with the most negative forcing most closely resemble the actual post 2005 forcing. Those models most accurately forecast the actual post 2005 temperatures.

    Given proper analysis the erformance of the modelsis much better than you represent.

    • Robert Austin says:

      Using hindsight we can pick the models that best conform to the temperature data. Blindingly obvious but I understand that the models that most closely followed the temperature data performed badly at projection of precipitation and other climatic factors. But on the positive side, if the models that most closely conform to the temperature data actually model the climate in some useful way, they indicate a low sensitivity to CO2 concentration, things are not dire and we have lots of “wait and see” time and can stop throwing billions at the alleged problem in a blind panic.

    • TheFinalNail says:

      Indeed, the range in the model projections is there for a purpose: to account for natural variability. The modellers couldn’t know from the outset when ENSO, etc would influence temperatures. As it happens, from 2006 ENSO has been mostly negative (NOAA ENSO index).

      Especially in the early stages, the observations should therefore always be compared to the entire ‘range’ of projections, rather than to the multi-model average. You have to suspect the motives of people who insist on comparing observations to multi-model averages.

      Ed Hawkins (University of Reading) updates IPCC AR5 fig 11.25 annually. This gives a much fairer comparison of model performance versus observations: http://www.climate-lab-book.ac.uk/wp-content/uploads/fig-nearterm_all_UPDATE_2014.png

      2015 is currently on target to fall at the upper end of the vertical green line (UK Met Office 2015 predicted range). Observations are set to remain well inside the 5-95% range of projections.

      • mpainter says:

        TheFinalNail says:

        “You have to suspect the motivations of people who insist on comparing observations to multi model averages.
        ###

        Don’t fret. Roy Spencer’s name is on the list and it is circled.

        But what shall be done about those such as Robert Austin, who above points out that the models which most closely follow the actual temperatures have the lowest climate sensitivity? Imagine what motivations he must have.Surely there is a list for his type.

        • TheFinalNail says:

          mpainter says:

          “…the models which most closely follow the actual temperatures have the lowest climate sensitivity…”

          ###

          That may well be the case. In fact, it would stand to reason that models with low climate sensitivity are more consistent with observations to date, given that natural variability has tended towards cooling during the forecast period of the projections.

          It remains to be seen whether this will still be the case after the current period of > avg ENSO has worked itself out.

        • mpainter says:

          A big El Nino is the cherished dream of the global warmers. They forget that a big El Nino will be followed by a big La Nina if nature takes her usual course, so the so called pause then continues.
          I think that the secret hope is for a step up like the one in 2000-2002.

          • TheFinalNail says:

            mpainter says:

            “A big El Nino is the cherished dream of the global warmers.”

            ###

            I’d prefer to see a period long enough to include several El Ninos and La Ninas before dismissing the CMIP5 model projections. A lot of folk seem very anxious to dismiss them at this early stage, when negative ENSO has largely prevailed over the forecast period.

          • mpainter says:

            In other words, you’re praying for an end to the “pause”, and slim chance of that.

          • TheFinalNail says:

            mpainter says:

            “In other words, you’re praying for an end to the “pause”, and slim chance of that.”

            ###

            I’m not the praying sort. I’m prepared to accept what will be. Nothing I can do about it anyway.

  28. mpainter says:

    Nate gets sore when wiggles and waggles add up to a flat trend. The solution?
    Simple- fix the wiggles and waggles so things look right. Nasty flat line, begone!

    • Nate says:

      I’ll right-let’s make it real simple then. Take your favorite thermometer based global data set. Fit a line to the last 50 years (or 35 if you prefer). That line will have a significant slope, i.e. 0.15 degrees/decade.

      Now notice all El nino years are above the line and all La Nina years are below the line, even for the last 15 y. Volcano years are also below the line (1995).

      If that’s a flat line-well then the Earth must be flat too.

  29. mpainter says:

    Ah, but Robert Austin, if you are not in a blind panic you obviously lack the required judgement.

  30. mpainter says:

    Nate says:
    “Alright -let’s make it real simple then”
    ###
    Okay, but you are not going to like the results.
    Referring to the UAH data set, I see a flat trend from 1979-’98, then another flat trend from 2002 to now. The difference in the two flat trends is about .3°, and this is the 1999-2002 jump. So, the only significant temperature increase in the last 70 years was a sudden jump of about
    .25-.3 °. Explain that in terms of CO2, please & thank you.

    • David A says:

      1) The UAH dataset isn’t 70 years long.

      2) The linear trend over the entire UAH LT dataset is 0.11 C/decade — a warming of 0.41 C.

    • TheFinalNail says:

      mpainter says:

      “Referring to the UAH data set, I see a flat trend from 1979-’98, then another flat trend from 2002 to now.”

      ###

      Yet when we consider the whole data set, without arbitrarily dividing it in two at your convenience, the resulting long term trend is a statistically significant warming of +0.11C/dec.

      Perhaps this tells us something about the predictive value of trends shorter than 20 years.

      • mpainter says:

        In fact, there is no long term trend, but only an abrupt rise in temperature just as I have described.
        The fact that it is possible to fit a long term trend through the last forty years or so does not change this fact.
        This is one of the observations loathed by climate scientists because it constitutes a refutation of the AGW hypothesis. It does not fit, so it is ignored.

        So, FinalNail,care to explain how CO2 caused that abrupt temperature rise?

        • TheFinalNail says:

          mpainter says:

          “…to explain how CO2 caused that abrupt temperature rise?”

          ###

          The trend over the entire period is 0.11C/dec. The trend up to 1998 was 0.09C/dec. So the trend up to 1998 really isn’t very different from the trend over the whole period.

          CO2 doesn’t explain the abrupt rise seen in the satellite record ~ 1998/99. I don’t think anyone is suggesting that it does. It was of course the result of the 1998 El Nino. It was followed by an almost equally abrupt fall.

          The trend since 2000 has been relatively slow (0.02C/dec); however, this is only the case in the satellite record. In the surface record, the range since 2000 is between 0.08 and 0.13C/dec.

          If you remove the effects of the 1998 El Nino and subsequent La Nina, then the trend in both UAH and RSS is consistent with a roughly linear temperature increase since 1979.

          • JohnKl says:

            TheFinal(rubber)Nail,

            Of course, it doesn’t seem to bother you and many people on this website that both the satellite and the surface data sets prove to be ADJUSTED warmer. Raw data appears difficult to find because it probably indicates either no temperature increase or temperature reductions as in NOAA U.S. continental surface data. Which only goes to suggest that catastrophic global warming really seems to be man made in the troubled, addled and often empirically challenged minds of climate modelers.

            Have a great day!

  31. michael hart says:

    “2015 Will Be Record Warm in Surface Temperatures…”

    But, on current trends, by how much will those data-sets have been adjusted downwards in 5 years time?

  32. David A says:

    When are these plots you bandy about going to appear in the peer reviewed literature?

    You know, so they have some credence beyond a blog post by a biased scientist?

    • Robert Austin says:

      Since events have shown that there is little correlation between “peer reviewed” and quality science, your trollish comment can be summarily dismissed.

      • Nate says:

        Bob,

        It is impressive how you can boldly disparage the entire enterprise of climate science, the peer-reviewed work of thousands of PhDs. It must be because you have some experience publishing or attempting to publish in this field? What is your evidence that the peer review process is generally broken in this field?

        • mpainter says:

          In climate science, the critical process has gone awry. The old virtue of scientific rigor has been discarded for faith based science; if it supports the AGW meme, it is embraced by the zealots on that basis. But in fact, the AGW hypothesis is riddled with holes.

          • nate says:

            I know, just like the fake moon landings, and the chem trails and Jade Helm. Everyone is a conspirator….

          • mpainter says:

            When tested against observations, the AGW hypothesis fails repeatedly.
            It is notable that many who style themselves as “climate scientists” utterly ignore such failings and refuse to consider that their cherished hypothesis might need adjusting. In short, they cannot or will not assimilate observations to their views; on the contrary, they will eliminate or invent data as it suits them, a la Karl,or tucking global warming at the bottom of the ocean,a la Trenberth.I could give other examples of the egregious science supporting the views of the “faithful”.

          • nate says:

            You speak of ‘they’ who are doing all these unethical oe even evil things. I suggest you sit down and have a beer with a climate scientist. I think you will find that they are regular people who are just interested in doing there work well, making good measurements or better models. And they are mostly independent operators who are competing with each other to do a better job and criticise the other guys work. Therefore it would quite difficult to fake data and get away with it.

          • mpainter says:

            Nate says:
            “You speak of ‘they’ who are doing all of these unethical oe even evil things”
            ###
            Actually, no, I used no such words as “unethical” or “evil”. Here, I might point out that people from the other camp not infrequently invent words or expressions which they proceed to attribute to me, either directly or by insinuation.
            A blogger by the blognomen “slipstick” did the same yesterday on the above post.
            In my opinion, this is a character trait that slips over into their science.

        • Robert Austin says:

          There is both good and bad science in the climate science field but peer review does a poor job of winnowing out the trash and boosting the meritorious. The situation appears to be even worse in the medical research field. As to evidence of the failure of peer review in the climate science field, we have numerous examples in the multiproxy temperature reconstruction field.

          • Nate says:

            ‘numerous examples’ Such as?

            From what I have read the first attempts to do the difficult reconstructions of the past 2000 y had some problems/issues that were raised by competing groups doing the same kind of work (i.e their peers!). There have since been many refinements and dozens of independent reconstructions and steady improvement in the methods.

            To me, this as science working exactly as it should.

  33. David A says:

    BTW, I was wondering what you make of this claim, which says MERRA reanalysis data from 1996 on shows an LT trend of about 0.2 C/decade:

    https://twitter.com/thingsbreak/status/607374295828996096

  34. mpainter says:

    David A declines to explain it in terms of CO2.

  35. For David Appell, the peer reviewed literature is the gold standard so long as it confirms to what he already believes. If the peer reviewed literature contradicts his beliefs, watch how he explains that the journal is rubbish, the scientists who wrote those other papers are denialists, and how that science was all funded by a giant coal/oil corporate conspiracy. These psychological gymnastics allows him to dismiss 10 observational studies, and hold up the one outlier speculative modelling study as the gold standard.

  36. Nate says:

    Mpainter:

    You said ‘they will eliminate or invent data as it suits them’. That is one of the most unethical things a scientist can do. And is completely unsubstantiated. You also say that climate scientists ‘utterly ignore such failings and refuse to consider that their cherished hypothesis might need adjusting’. Again unsubstantiated bad behavior that is pretty much the opposite of how scientists are trained. I’ll agree that there are individual bad apples in any field. But you seem to think climate scientists, as a group, are both unethical and bad at their jobs. Why?

    • Chris says:

      Bad at their jobs because they can’t actually predict climate change .(what else is a climate scientist supposed to do?).

      Unethical because of statements like “Barrier Reef was threatened by the increasing frequency of cyclones” by David Suzuki which has no basis.

      Sadly there are so many other examples.

      • Nate says:

        You are talking about an individual, who is not even a climate scientist, and you think what he is saying and doing is representative of all climate scientists.

        Seriously?

        I make no claim on the accuracy of statements from politicians, the media, or activists or combos like Al Gore. They are entitled to their opinion, which everyone should understand is opinion, very different from what is in the scientific literature.

        • JohnKl says:

          Hi Nate,

          Regarding a prior statement you made, the very attempt to model a 2000 year prior temperature record is an empirical absurdity since no observational verification of claims can be made.

          Have a great day!

          • Nate says:

            Nothing absurd in principle about looking at the record of temperature in the past, as revealed by ice cores, temperatures in wells and tree rings. I’ll agree it is a difficult task..

          • JohnKl says:

            Hi Nate,

            Ice cores are not thermometers and any claims as to past temperatures involve seemingly innumerable ASSUMPTIONS and in the end SPECULATION NOT SCIENCE. Tree ring data has already proven to have had little correlation to actual temperature measurements. Proxy data comprises assumptions and speculation with little if any observed measurements of the phenomenon investigated. Science should involve the facts and laws of nature. Leave speculation to propagandists and assorted fantasists.

            Have a great day!

          • JohnKl says:

            Hi Nate,

            Proxy data like ice cores and tree rings do not comprise a measured temperature record! It arises from speculation and assumptions not empirical science.

            Have a great day!

        • Chris says:

          David Suzuki is a well known spokesperson for climate change. He was in Australia for that very reason – so yes – I do take what he says as representative. Yes really. Nate – it is very very easy to see who the denier is here.

          • Nate says:

            Yes he is an environmental activist with training in genetics. He is not a climate researcher.

            I always recommend to students to consider the source of information when learning about a topic in science.

            If that source is an op-ed written by someone with a political agenda, no matter which side they are on, chances are they have distorted or cherry-picked facts in order to make their case stronger.

            Leaving out relevant facts and previous work is a no-no when publishing in scientific literature-otherwise you will get called on it by peer-reviewers.

            That’s why several people here have brought up ‘peer reviewed’ as being important.

            If you see an activist distort the facts-it does not follow that the science is all lies.

          • Nate says:

            JohnKl,

            Can temperature only be measured with a thermometer? Near the ground?

            How about with microwaves? From a satellite? In which numerous corrections and assumptions need to be made? In which the trend of temperature of the Arctic was cut in half, and of Australia was nearly doubled, because some assumptions/corrections were recently changed.

            That ok?

  37. ehak says:

    At least the Karlized data have passed peer review.

    Wonder when the Spencerized TMLT (beta 6) data will do the same…

  38. Joe says:

    “2015 Will Be Record Warm in Surface Temperatures” – We’ll see. Joe Bastardi made a good point about this a little while ago – Although the El Nino may spike the global temperature, the spike will be limited by the current cold AMO. During the El Ninos since 1997, the AMO was warm. It’s going to be interesting to see if the cold AMO remains the duration of the current El Nino, and what that does to the global temps.

  39. Matt says:

    Dr. Spencer I do not believe in AGW. I am an engineer. Just to help me understand. If solar activity is decreasing, cosmic ray impact increasing and the earth is getting warmer, what are the possible causes? What are the important contributor to the temperature increases?
    Matt

  40. charles nelson says:

    Hi Roy,
    You responded to a comment I made over at WUWT and because of the structure over there I wasn’t able to ask for clarification.
    My point was that Water Vapour acts as both a heat trapping gas and a ‘cooling’ gas in that it transports heat to colder drier parts of the planet and high into the atmosphere.
    I’ve based my skepticism of Global Warming Alarmism on this simple principle for many years now.
    I watch the satellites and see quite clearly WV rising above the warm oceans and being drawn swiftly to the poles. I note what happens to surface temperatures after evaporation and precipitation events.
    It seems pretty straight forward to me.
    The Warmists have always described Water Vapour as part of a positive feedback loop, to me it looks very much like negative feedback.
    Could you point me towards some scientific literature which would disabuse me of these crazy notions? ‘-)

Leave a Reply