
 Home/Blog
NOTE: This is the tenth monthly update with our new Version 6.0 dataset. Differences versus the old Version 5.6 dataset are discussed here. Note we are now at “beta5” for Version 6 (hopefully the last beta before submission of the methodology for publication), discussed more below.
The Version 6.0 global average lower tropospheric temperature (LT) anomaly for January, 2016 is +0.54 deg. C, up from the December, 2015 value of +0.45 deg. C (click for full size version):
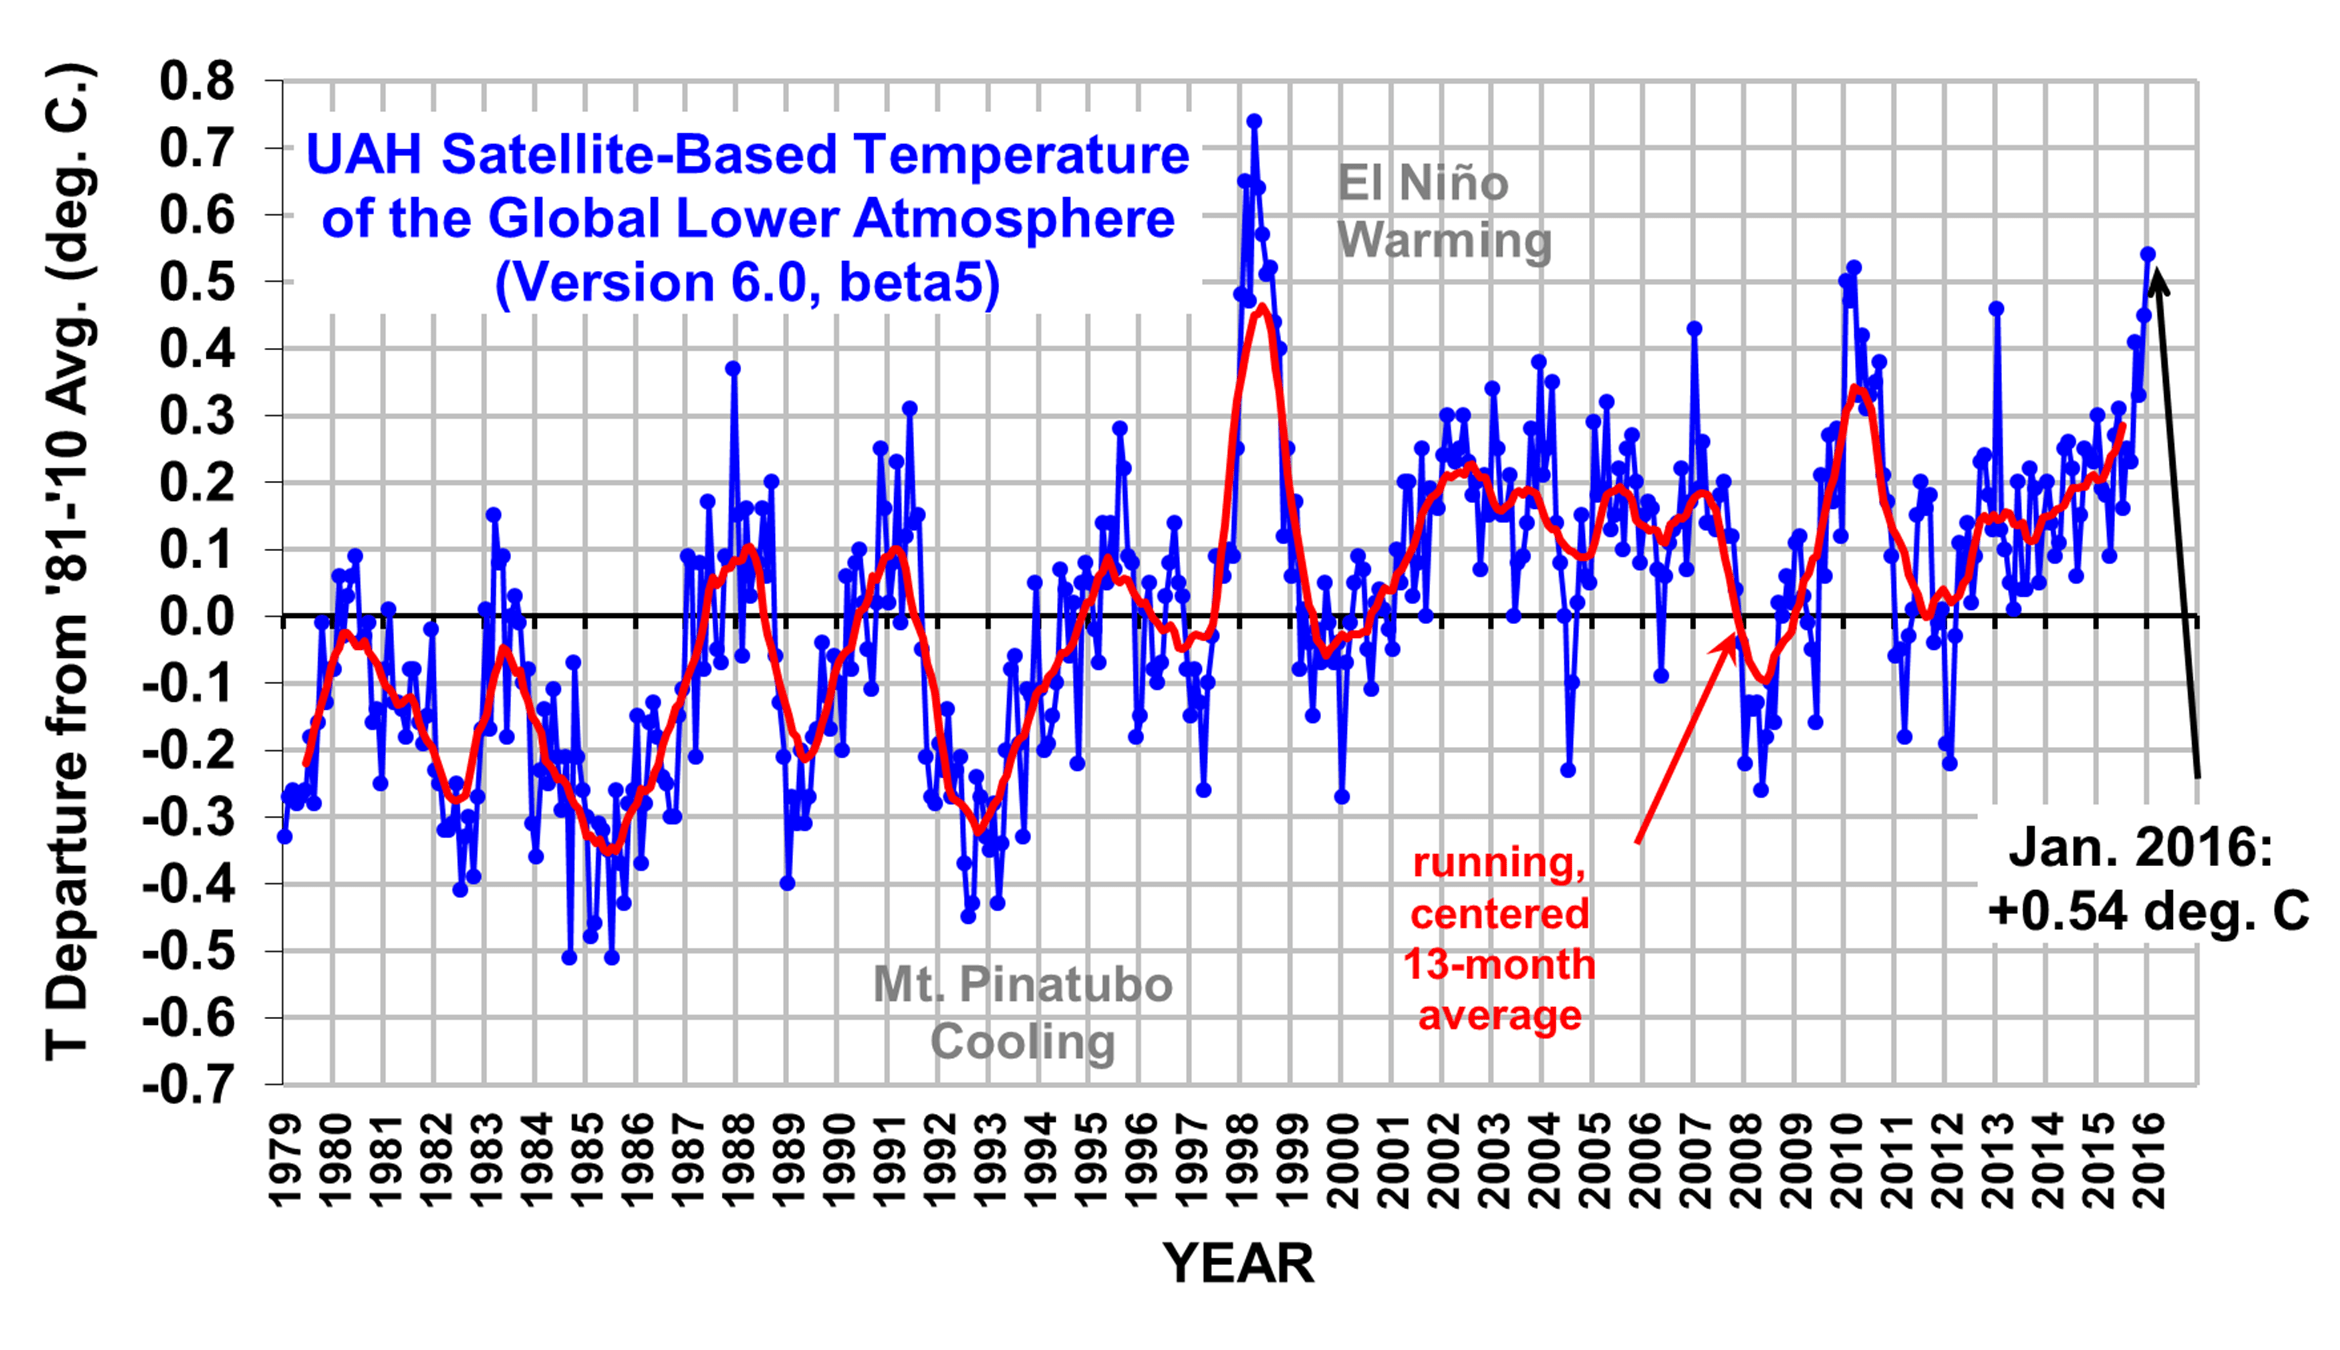
The global, hemispheric, and tropical LT anomalies from the 30-year (1981-2010) average for the last 13 months are:
YR MO GLOBE NH SH TROPICS
2015 01 +0.30 +0.44 +0.15 +0.13
2015 02 +0.19 +0.34 +0.04 -0.07
2015 03 +0.18 +0.28 +0.07 +0.04
2015 04 +0.09 +0.19 -0.01 +0.08
2015 05 +0.27 +0.34 +0.20 +0.27
2015 06 +0.31 +0.38 +0.25 +0.46
2015 07 +0.16 +0.29 +0.03 +0.48
2015 08 +0.25 +0.20 +0.30 +0.53
2015 09 +0.23 +0.30 +0.16 +0.55
2015 10 +0.41 +0.63 +0.20 +0.53
2015 11 +0.33 +0.44 +0.22 +0.52
2015 12 +0.45 +0.53 +0.37 +0.61
2016 01 +0.54 +0.70 +0.39 +0.85
We are now approaching peak warmth in the tropics due to El Nino conditions. Only time will tell if warming continues for a few more months, or whether January was the peak.
The global image for January, 2016 should be available in the next several days here.
The new Version 6 files (use the ones labeled “beta5”) should be updated soon, and are located here:
Lower Troposphere: http://vortex.nsstc.uah.edu/data/msu/v6.0beta/tlt
Mid-Troposphere: http://vortex.nsstc.uah.edu/data/msu/v6.0beta/tmt
Tropopause: http://vortex.nsstc.uah.edu/data/msu/v6.0beta/ttp
Lower Stratosphere: http://vortex.nsstc.uah.edu/data/msu/v6.0beta/tls
Changes with the “beta5” version
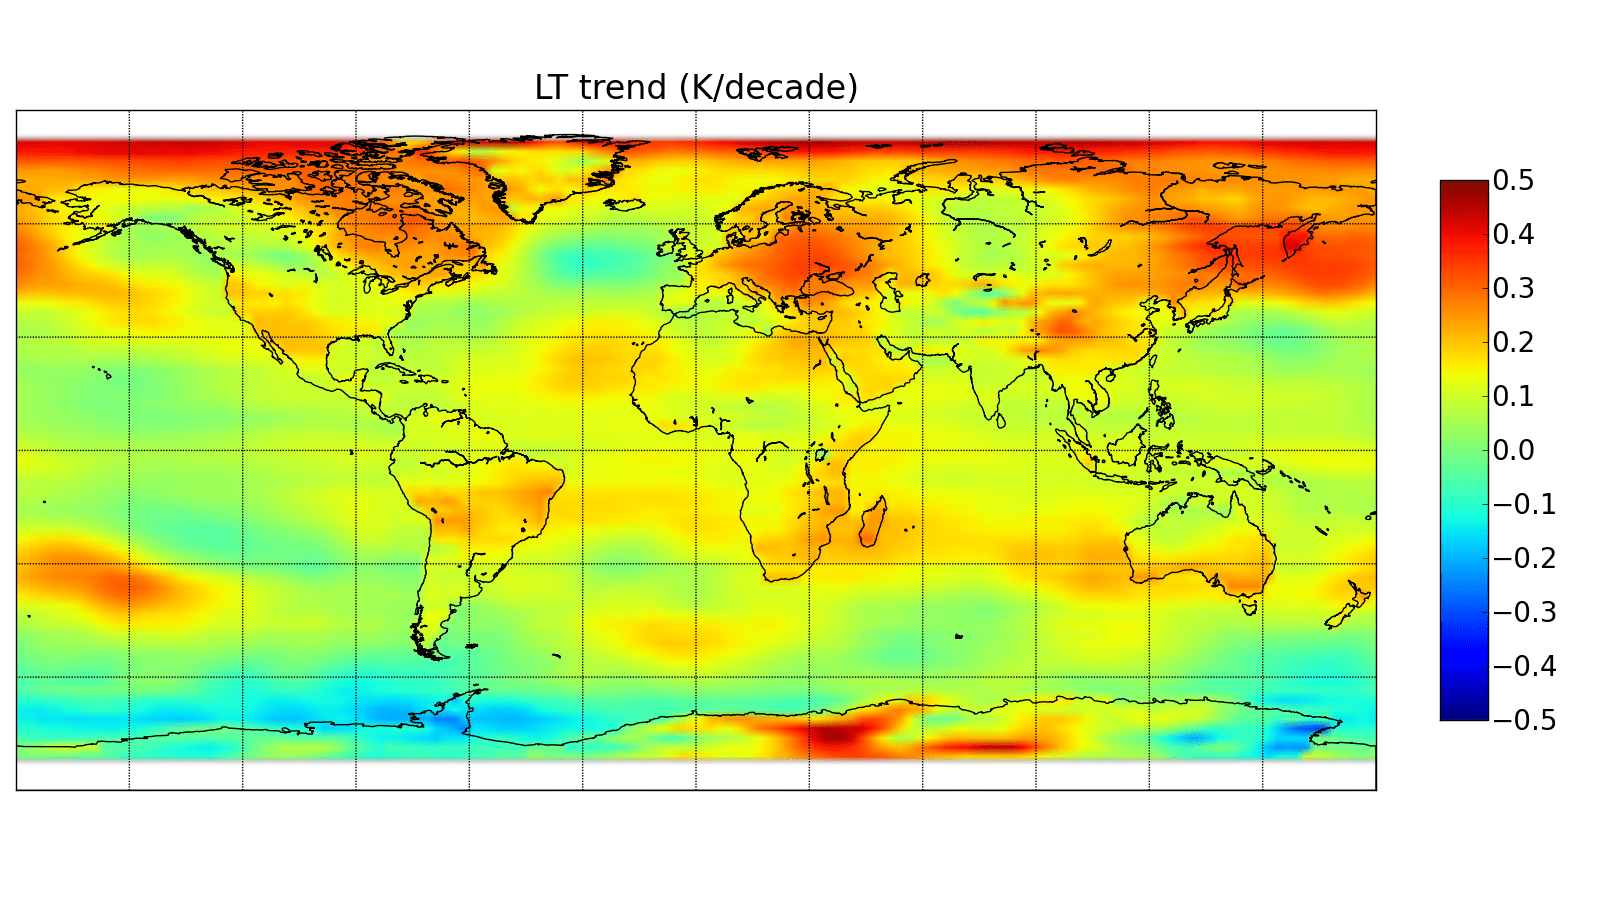
We had been concerned that the LT temperature trends over land were too warm compared to the ocean. One hint that something might be wrong was that the trends over very high elevation portions of the Greenland ice sheet and the Himalayas were much colder than the surrounding regions (see Fig. 4 here). Another was discontinuities in the trend patterns between land and ocean, especially in the tropics.
We determined this is most likely due to a residual mismatch between the MSU channel 2 weighting function altitude on the early satellites versus the AMSU channel 5 weighting function altitude on the later satellites. We already knew AMSU5 peaks lower than MSU2, and had chosen Earth incidence angles in each to get a match based upon theory. But apparently the theory has some error, which we find equates to about 150 meters in altitude. This was enough to cause the issues we see….land too warm at low elevations, too cold for elevated ice surfaces.
We therefore changed the AMSU5 reference Earth incidence angle (from 35.0 to 38.3 deg.) so that the trends over Greenland and the Himalayas were in much better agreement with the surrounding areas. We also find that the resulting LT trends over the U.S. and Australia are in better agreement with other sources of data.
The net result is to generally cool the land trends and warm the ocean trends. The global trends have almost no change from beta4; the change mostly affects how the average trend in 2.5 deg. latitude bands is ‘apportioned’ between land and ocean. Here is the new LT trend image for the period January 1979 through January 2016:
An alternative solution would have been just to intercalibrate the satellites over land and ocean separately. Experiments with this, however, showed what we consider to be a unacceptable amount of spurious features in the resulting trend maps. We therefore opted to change what we believe to the the cause of the problem — an improper choice for the AMSU5 reference Earth indidence angle to match MSU2, and then none of the processing code would need to be changed.


