UAH V6 Global Temperature Update for Feb. 2016: +0.83 deg. C (new record)

March 1st, 2016 by Roy W. Spencer, Ph. D.

NOTE: This is the eleventh monthly update with our new Version 6.0 dataset. Differences versus the old Version 5.6 dataset are discussed here. Note we are now at “beta5” for Version 6 (hopefully the last beta before submission of the methodology for publication), discussed more below.

The Version 6.0 global average lower tropospheric temperature (LT) anomaly for February, 2016 is +0.83 deg. C, up almost 0.3 deg C from the January value of +0.54 deg. C (click for full size version), which is a new record for the warmest monthly anomaly since satellite monitoring began in late 1978. (If clicking on the image leads to an error, this is due to “caching issues” according to my new website hosting company…I don’t know how to fix it.)

UAH_LT_1979_thru_February_2016_v6

The global, hemispheric, and tropical LT anomalies from the 30-year (1981-2010) average for the last 14 months are:

YR MO GLOBE NH SH TROPICS
2015 01 +0.30 +0.44 +0.15 +0.13
2015 02 +0.19 +0.34 +0.04 -0.07
2015 03 +0.18 +0.28 +0.07 +0.04
2015 04 +0.09 +0.19 -0.01 +0.08
2015 05 +0.27 +0.34 +0.20 +0.27
2015 06 +0.31 +0.38 +0.25 +0.46
2015 07 +0.16 +0.29 +0.03 +0.48
2015 08 +0.25 +0.20 +0.30 +0.53
2015 09 +0.23 +0.30 +0.16 +0.55
2015 10 +0.41 +0.63 +0.20 +0.53
2015 11 +0.33 +0.44 +0.22 +0.52
2015 12 +0.45 +0.53 +0.37 +0.61
2016 01 +0.54 +0.69 +0.39 +0.85
2016 02 +0.83 +1.17 +0.50 +0.99

Further Analysis of the Record February Warmth

The 1-month increase of +0.29 C in global average temperature from January to February is not unprecedented…for example, during the last El Nino (2009-10) there was +0.38 C warming from December to January.

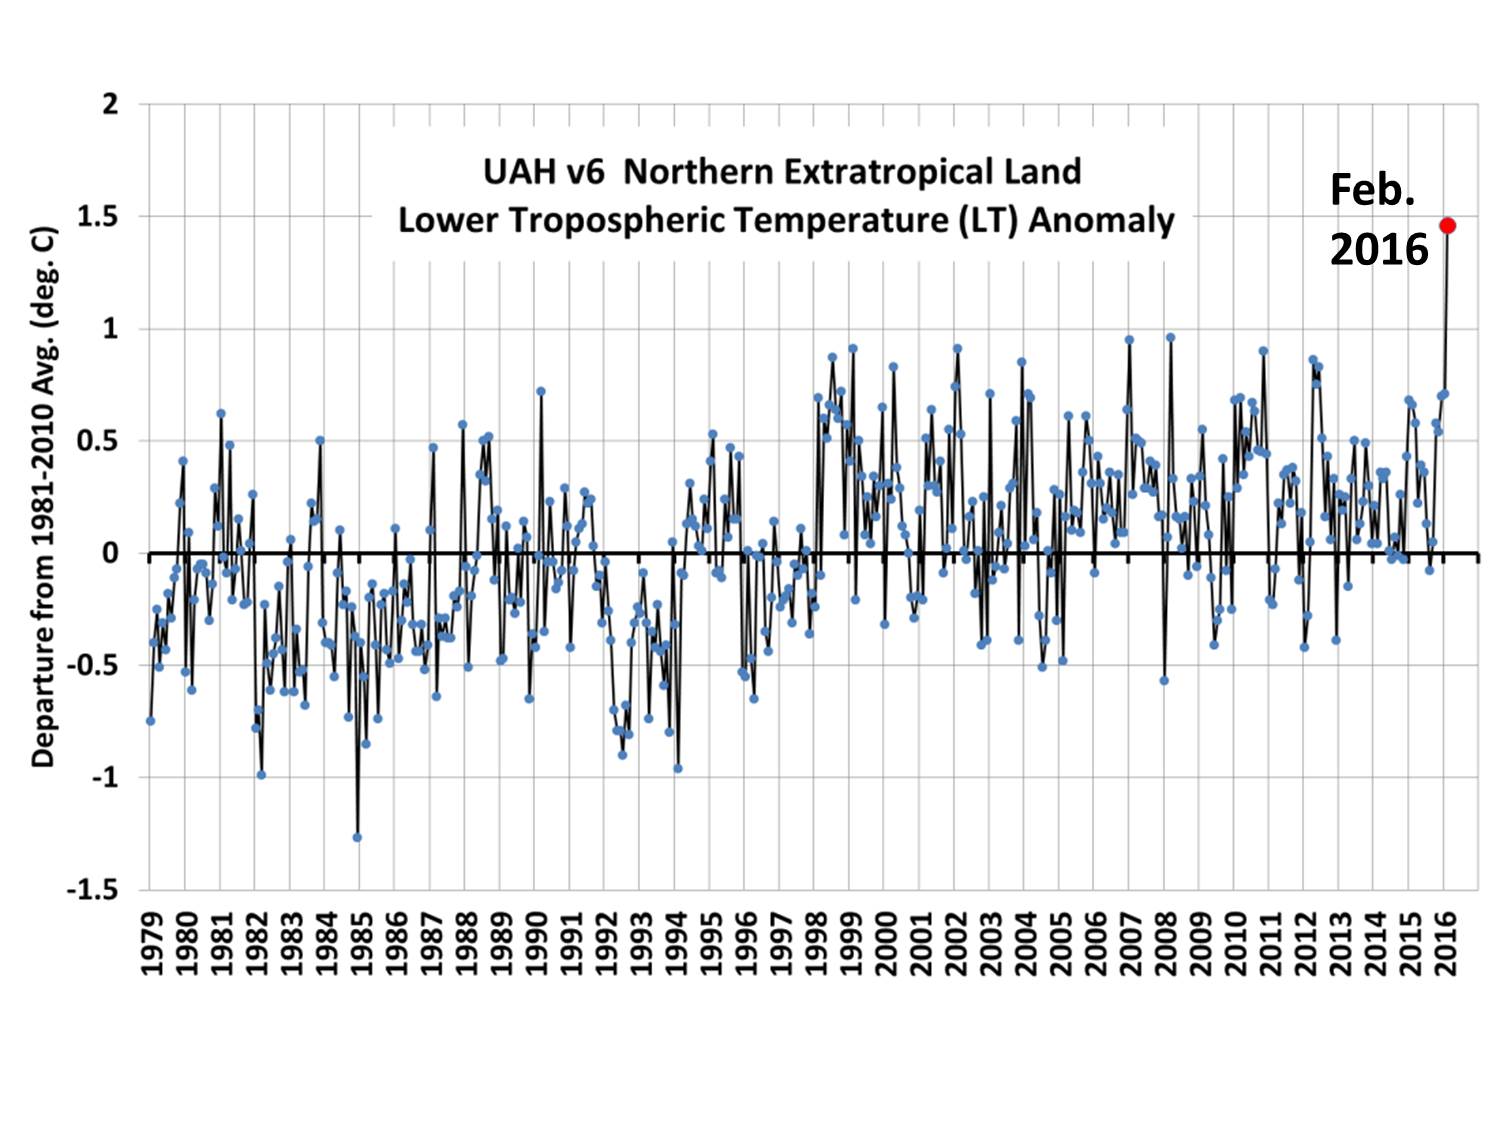
The February warmth is likely being dominated by the warm El Nino conditions, which tends to have peak warmth in the troposphere close to February…but it appears that isn’t the whole story, since the tropical anomaly for February 2016 (+0.99 C) is still about 0.3 C below the February 1998 value during the super-El Nino of that year. In addition to the expected tropical warmth, scattered regional warmth outside the tropics led to a record warm value for extratropical Northern Hemispheric land areas, with a whopping +1.46 C anomaly in February…fully 0.5 deg. C above any previous monthly anomaly (!):

UAH-v6-LT-NExt-thru-feb-2016

As a sanity check on the latest data, I compared our monthly anomalies to the 2m surface temperatures analysed from the NCEP CFSv2 by Ryan Maue at WeatherBell.com. His calculated global average anomalies (from the 1981-2010 mean) for January and February 2016 were +0.51 and +0.70 C, respectively, which is close to our +0.54 and +0.83 C values (some amplification of tropospheric anomalies vs. surface is always seen during El Nino). Here are the regional temperature anomaly patterns for February in the two datasets:

UAH-LT-vs-CFSv2-Tsfc-Feb-2016

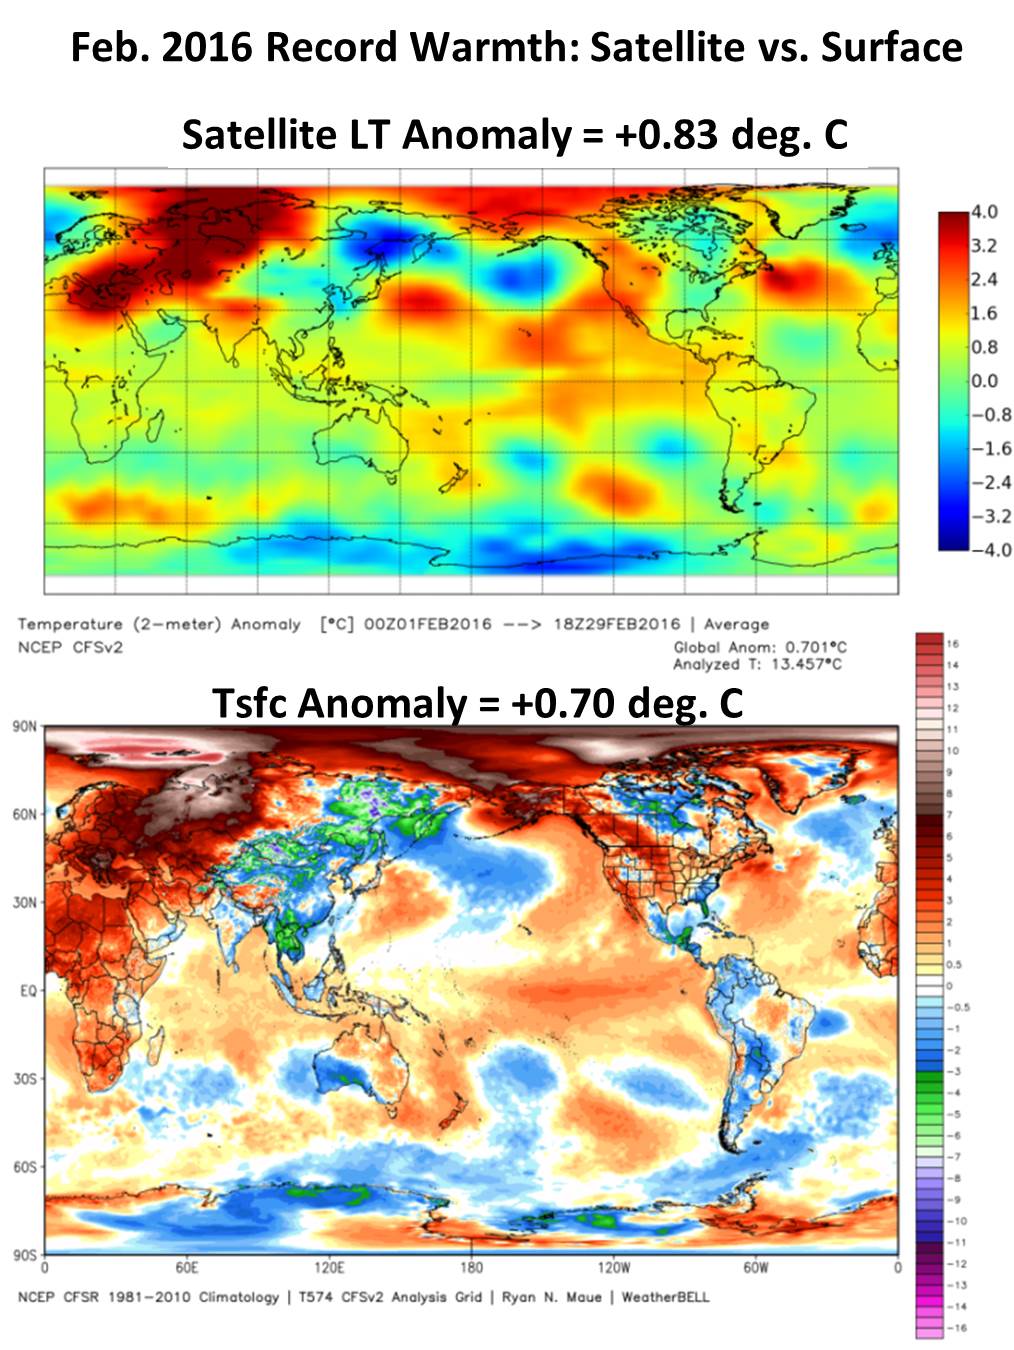
Even though the CFSv2 surface temperature analysis in the above plot is not “official”, I think it is a pretty good representation of what really happened last month, since it includes all sources of data in a physically consistent way within the daily weather forecast model framework. Note that on a monthly time scale we do not expect perfect correspondence between surface temperature and deep-tropospheric temperature anomaly patterns…especially in the deep tropics; the agreement in regional patterns seen above is about as good as it gets.

The “official” UAH global image for February, 2016 should be available in the next several days here.

The new Version 6 files (use the ones labeled “beta5”) should be updated soon, and are located here:

Lower Troposphere: http://vortex.nsstc.uah.edu/data/msu/v6.0beta/tlt
Mid-Troposphere: http://vortex.nsstc.uah.edu/data/msu/v6.0beta/tmt
Tropopause: http://vortex.nsstc.uah.edu/data/msu/v6.0beta/ttp
Lower Stratosphere: http://vortex.nsstc.uah.edu/data/msu/v6.0beta/tls


318 Responses to “UAH V6 Global Temperature Update for Feb. 2016: +0.83 deg. C (new record)”

Toggle Trackbacks

  1. Christian says:

    record yes, but unrealistic cool in the tropics for this kind of el-nino, no typical spike, if this stand so, there could be a tropical issue in Sat-Data.

  2. Greg Harre says:

    Very interesting analysis Dr. Spencer.

    But I think what we are all wondering and really excited about is what mpainter will have to say.

    GH

    • I stopped reading the comments section. Someone named Doug seems to dominate the conversation. 😉

      • Toneb says:

        Put him under a curfew please.
        Bay one post a day.
        Because soon you have many others who have “stopped reading the comments section” – and not just you.
        He’s a Troll and you know it Roy.

        • I can’t block him…he keeps showing up with a new name. I’ve blocked numerous IP addresses, names, and he just keeps showing up. I’ve even blogged about this problem.

          • DougCotton says:

            Because every time my wife or kids can’t get a WIFI connection they solve the problem by re-starting the modem, and the service provider automatically allocates a new ISP. I use a cable connection.

            Why should correct science be blocked Roy? I am the one who has studied physics at Distinction level in second and third year and done extensive post-graduate study in thermodynamics, writing two papers and a book on it that have been well reviewed by people with qualifications in physics who recognize that what I have written is correct and supported by copious evidence.

          • Toneb says:

            Cotton:
            “Why should correct science be blocked Roy? ”

            Because if it is correct then his is wrong.
            And it’s his f*** blog.

            But that’s just the least of your logical fails.
            Like “who’s next to take me on”.

            As though your repeating the same experiment-less and formula-less drivel ad nauseum in answer to your “being taken on” is in anyway a victory for you.
            Least of all “proof” of your science.
            Observation (real world atm) and logic my friend – two things that your “science” lacks.

            This from someone who routinely observed and forecast the outcome of the GHE and a distinct lack of “heat creep” – which is physically impossible in the real dynamic atmosphere – as NWP weather modelling proves on an hourly basis.

            Do you have a pecuniary interest in spamming this site?
            Because sure as hell you aren’t making sense otherwise.

          • David Appell says:

            Doug: You should stop overwhelming this blog with spam simply because Roy asked you to. That’s enough of a reason, and you should respect it.

          • JohnKl says:

            Hi David Appell,

            In the previous thread you provided a good definition of a photon, that it only contains wavelength information. It proved useful to me, since I’ve encountered other definitions that proved absurd. While it seems to me should quantum energy exist it may contain other information, yours proved a much better definition and not at all absurd. Thanks.

            Have a great day!

          • David Appell says:

            John: Thanks for that. You’re welcome.

          • JDAM says:

            Block his Media Access Control (MAC) Address most ISPs use rotatable pool of IP addresses.

            The Blackboard and WUTT have also banned Doug C.

          • DougCotton says:

            Plenty of observation, empirical evidence, experiments and a study all supporting my hypothesis Toneb, as well as correct physics which neither you nor anyone else has correctly refuted in three years. I’ve refuted what Roy (and the IPCC authors) have written regarding radiative forcing.

      • Maurice Meeks says:

        You must have stopped reading. Doug has been surpassed in obnoxiousness by mpainter.

        MM

        • mpainter says:

          Glad to hear you testify. My comment, as always: an El Nino spike makes no difference to the general trend, read and weep. Try explaining that to the global warmers, though. For them, El Nino is a cause for rejoicing. In the unlikely event that the following La Nina is weak, they will be dancing in the streets, no doubt celebrating the beneficence of a wise Creator who gave us fossil fuels.

          As I have also stated before, the real hope of the warmers is a step-up as circa 2001, which followed the 98 El Nino. Fat chance of that.

          • ehak says:

            There he was. Hilarious as always. Makes no difference to the general trend…

            That must of course mean an upward trend.

            Ouch.

          • Paul Hahnel says:

            lol mpainter, disappears all the UAH/RSS data before the 1998 El Nino to start a trend line using that ’98 El Nino spike and then claims El Nino spikes make no diff in the trend line. You can’t make his craycray stuff up.
            And then he goes off on more conspiracy stuff, ‘warmers rejoice at an El Nino rise in temps’. Except isn’t it only the ‘warmers’ trying to warn the public that this is not a good thing? He’s the one who says its no thing. but no its those ‘warmers’.

            His last paragraph is pure conspiracy projection again, now he’s trying to disappear what happened after the 1998 El Nino spike, a ‘step up’ (not a rise) in temps even as he claims the 1998 spike made no difference in the trend. He goes round and round and round.

      • DougCotton says:

        ROY !!!!!!

        That’s because Doug gets annoyed that the IPCC keeps on fooling people like yourself with what is a travesty of physics. You’d realize this if you watched the video which would be as good as me explaining it all to you in person.

        What Postma says about Lukes like you Roy is right – by giving a “tick” to the radiative forcing garbage science for the gullible, you defeat your own purpose, because it just fuels the debate and the last resort is the precautionary principle. False science needs to be totally and utterly scrapped. Rain forests are not 50 degrees hotter due to all the greenhouse gas water vapor that supposedly does most of “33 degrees” of warming.

        YOU WERE TOTALLY AND UTTERLY WRONG ROY IN ASSUMING THE TROPOSPHERE WOULD TEND TO BE ISOTHERMAL UNDER ANY CIRCUMSTANCES BECAUSE SUCH WOULD NOT BE THE STATE OF GREATEST ENTROPY.

        • DougCotton says:

          Continued here.

        • Sbickel says:

          DougCotton,

          I listened to your video about the CO2 being a non issue. I really think you have lost it concerning greenhouse effect from water vapor resulting in cooling. Cloud cover increases ground temperature at night. The vapor acts like a radiative blanket. The shift is obvious. We get low clouds here in San Diego that roll in at night. When in happens you don’t get cold outdoors afterwards (within 30 minutes). The vapor appears to hold warmth and radiate it later.

          • DougCotton says:

            Yes the temperature is warmer, but there is no heat via radiation from the colder cloud to the surface and no effect on the minimum temperature that the surface will get down to that night.

            The extra kinetic energy can only get from the cloud to the warmer surface by non-radiative processes that are increasing entropy, as the Second Law of Thermodynamics tells us.

            We see evidence of such in every vortex tube where, as the radial temperature gradient is developing due to the centrifugal force, there is a net transfer of kinetic energy from the cooling central region to the warming region near the circumference of the cylinder. We can quantify the resulting temperature gradient for dry air in a vortex tube in the same way that we can quantify the dry adiabatic lapse rate, as is in my 2013 paper.

            If you understood that paper then you should be able to draw the diagrams from memory and label the axes correctly. Can you? I doubt it, because you demonstrate no understanding of it whatsoever, and you certainly produce no refutation regarding the entropy considerations involved in the hypothesis.

          • Sbickel says:

            Your logic still does not fit. A blanket is a blanket. It does not have to be warmer than the earth. It only has to be warmer than what it right above the blanket to effect the minimum temp the earth reaches at night. You make no sense.

          • gbaikie says:

            Water vapor and CO2 are transparent to visible light, as are most gases. Clouds are visible and are not gases, instead they are liquids and solids suspended in the atmosphere.

            It is fairly obvious that clouds reduce night time cooling, and are similar to blanket, but clouds are mot greenhouse gases.

          • Sbickel says:

            Makes sense. The CO2 absorbs a small portion of the infrared, and then the resulting heat increases water vapor and then cloud cover. The thin CO2 blanket creates additional water vapor blanket. Most of this has been demonstrated via experiments. Without any atmosphere we would be cold like Mars. With “normal” CO2 atmosphere we keep most of our land ice and the seas go up and down a little. With lots of CO2 we lose enough land ice to raise the oceans somewhere between 2 meters and 20 meters.

            Right now most all of Florida is dramatically threatened in th distant future without any known solution. Plus the East coast cities like NYC, plus Gulf cities, West coast harbor based cities … much of south east asia, …. without a doubt raising the ocean by 2 meters is just the start of the nightmare awaiting humanity in 2-5 hundred years.

        • Kirk says:

          Since you posted a Youtube video,I will do the same. This 9 year old girl proves that CO2 is a greenhouse gas, https://www.youtube.com/watch?v=HdH_G1-5YSo
          Does this mean that through your ignorance, you have essentially lowered your mentality below that of a 9 year old?
          The debate is over. The science is settled. Continual denial will just make it easier for authorities to find you and strap you up in a well deserved straightjacket.

      • DougCotton says:

        ROY

        For your sake – your purposes, not mine, there are a couple of comments starting here that you really ought to read.

  3. Christian says:

    Why wonder? Is said it month ago, also the increase in extratropicals is normal for the El-Nino, its also evident in El-Nino 1997/1998. It look more like, Satdata are Step-warming due rapid adjusts of the oceans.

    Mixing is broken down, upper heat content is increased a lot, so i would not wonder about if next La-Nina is much warmer then the last before

  4. Mick Doley says:

    @Greg Harre

    mpainter should stand by his prediction from last month:

    mpainter says:
    February 5, 2016 at 7:49 PM
    Well, the blob is reported to be gone. The temperature anomaly may be expected to plummet. There is no joy in globalwarmerville, the mighty El Nino has struck out.

    The only suspense is whether he will break his record for most posts in Mar. The El Nino has caused a “step up” in posting frequency from cranks.

    • mpainter says:

      Seems that I have people hanging on my words. Has Ma Nature gotten tired of her game of tormenting the warmers? Probably not. Most likely she is setting them up for another spill, like Lucy holding the football.

      So what’s her new trick? I can hardly bear to wait to see what Ma Nature pulls on the poor global warmers next. Maybe a super-charged ocean overturning with all the eastern boundary currents maximized.

  5. Larry Fig says:

    Dr. Spencer,

    Might I kindly suggest you take another look at your new way of adjusting satellite data to get temperatures? Obviously your Mar. data is too high.

    With respect,
    Larry

    • let me know what you think the answer should be and I’ll correct it. LOL

      • Larry Fig says:

        As long as you don’t make it higher than the peak in 1998 we can say that the the pause continues. What you are doing is very dangerous and irresponsible.

        With respect,
        Larry

        • What we are “doing”? Interesting perspective there, Larry.

        • Massimo PORZIO says:

          Hi Hope you are joking Larry when you wrote:”What you are doing is very dangerous and irresponsible.”

          He is reporting what the instruments says, just that.
          It was probably “dangerous or irresponsible” hiding this events, because if you were right (that is there is something wrong in the temps data), nobody could get it. Instead now, you (and everybody) can scrutinize the measurements to find if there is an issue.

          Have a great day.

          Massimo

          • jimc says:

            Just some perspective: The Doc thinks Feb may be the peak for El Nino. If so, I see less than 0.1deg C from 98 to 16 which is less than 0.56deg C per century. Much closer to Docs estimate (see Blunder) than Brand Xs.

          • Mathius says:

            jimc, I’d caution you about comparing the crazy variations from month to month and trying to use two similar months to describe an overall trend. This El Nino was a lot different than the one in ’98. The center of the warmth this time was further west.

            Feb. 2016 has been interesting because of the wild warmth in Arctic.

          • Bill Laurune says:

            See also my reply below. The correlation between the 5.6 version and the 6.0 beta is different for recent months and back in 1998. If the same correlation held, the Feb ’16 reading would be more like 0.6, and the peak to peak would be right on trend.

            Something is fishy. The 6.0 values are lower than the 5.6 values, except for 1998.

          • Hi, jimc. I’m posting this to try and bookmark this point in the discussion. There are obviously even more problems with selecting out two transient peaks on the graph than there are with taking the beginning and end points which come pre-served, as it were, or the trend rate for such a short record. However, since you have publically committed yourself to accepting this means of calculating the rate I would like to see what the values are for the next couple of months and what rate they yield. I’ll get back to you in a few weeks, perhaps.

      • Bill Laurune says:

        In the chart, it looks like the peak in 1998 was over 0.7, but I don’t see that value in the UAH data set. I see 0.65 and 0.66. And the numbers posted here for a given month are lower than what I see in the UAH data.

        Should the peak in 1998 be more like 0.6-ish?

    • Ric Werme says:

      I’d recommend waiting until RSS data comes out. If they’re similar to UAH, then the recent tweaks will likely not be at fault.

  6. Simon says:

    Ding dong the pause is dead. Well actually only the lower troposphere pause…. the others never really happened.

    • richard verney says:

      But with a following La Nina, it may well reappear, and indeed grow longer than the about 18.5 year period that was seen before this current El Nino really took bite.

      The current next few months may be no more than a short lived spike, as was seen with the 2010 El Nino. IF that is so (and IF there is no long lasting step change as was seen coincident with the 1997/98 El Nino), by 2019, the ‘pause’ may be about 21 years in duration. IF, that is the case, that will make AR6 a rather interesting report.

      Interesting times lie ahead, and much may become clearer.

      • sod says:

        “But with a following La Nina, it may well reappear, and indeed grow longer than the about 18.5 year period that was seen before this current El Nino really took bite. ”

        you do understand that a vanishing and reappearing “pause” will look exactly like the statistical artefact that it would actually be?!?

        You do understand how utterly ridiculous your hope for the reappearance already is?

        It goes like: “hey man, if we have a la nina, and we cherry pick the start date and we ignore the horrible stats of the correlation, then we can claim a pause! Hurrah!”

        • Ayla says:

          I don’t understand. There was no pause. It was a BigOil lie.

          How can you be talking about something that didn’t exist reappearing?

        • TedM says:

          ou do understand that a vanishing and reappearing pause will look exactly like the statistical artefact that it would actually be?!?

          No it will look like a pause, with an ElNino and LaNina occurring during the period of that pause.

          • Nope. If there were no underlying warming trend, the ‘pause’ would continue right through the El Nino, since one Nino would be more or less comparable to the last.

            But that’s not what we’ve been seeing. Separate out Nino years, Nina years, and ENSO-neutral years. Each separate grouping still shows a warming trend.

          • mpainter says:

            Nope, natural is variable and so is ENSO. Or do you claim otherwise?

          • David Appell says:

            ENSO is natural. What doesn’t appear to be is the increase in temperatures from 1982-83 to 1997-98, and then again from 1997-98 to 2015-16 — about 0.4 C each time for surface temperature.

            And ocean heat content has, of course, been increasing all along….

          • mpainter says:

            ENSO is variable because wind, currents, moc, cloudiness, etc. are variable. What warmed the SST, David? For clues, study yesterday’s post wherein Dr. Roy has provided a wealth of observations. You have heard of observations, have you not?

          • David Appell says:

            “What warmed the SST, David?”

            The same thing that warming the rest of the planet.

        • bit chilly says:

          an eighteen year pause is a statistical artefact in a 37 year time series. you are hilarious ken, utterly hilarious.

    • mpainter says:

      Simon: “Ding-dong the pause is dead”

      ###

      From the “Wizard of Oz”:

      Ding-dong, the witch is dead. Which old witch? The wicked witch, ding-dong the wicked witch is dead.

      ###

      I have said this before and it bears repeating now: AGW is a modern-day witch hunt, conducted by a herd of lemmings. Thanx, Simon, for your little ditty.

    • miker says:

      Warning, warning, mass extinction due to global warming underway.

      As the temperatures on all fronts increase to record levels, we are witnessing a monumental extinction event occurring in real time. This event concerns segments of the hard core climate change denial community who claim that there is no evidence for global warming.

      The combination of heat stress and the long term exposure to the DunningKruger virus, thought to be transmitted via the Internet, is thought to be responsible (if you suspect that you or a loved one or an acquaintance could be a sufferer, then you should check out http://rationalwiki.org/wiki/Dunning-Kruger_effect ).

      The long-time survival of this species was also always in doubt due to the characteristic behaviour of the members of this group. In particular, their notorious behaviour of sticking their heads in the sand when approached by predatory climate scientists. They would typically rather asphyxiate than resurface. An astonishing phenomena that is only matched by lemmings.

      Their only other survival mechanism tactic was to hide in valleys or flat regions (unfortunately this became no longer possible due to the recent destruction of the habitat of the hiatus species). However if prodded, they could produce a noxious emanation that could act as a smoke screen. They can also have great difficulties accepting their own mortality and often will produce a snarling response when confronted with reality.

      Dont worry ,it is just the death throes. If they do lash out, then a swift response via hockey stick to an appropriate part of the anatomy is usually all that is required to pacify them.

      This colossal extinction of an entire subspecies is probably the most significant, since that other notorious great extinction of the 60s and 70s, of those who claimed that there was no evidence that cigarette smoke caused lung cancer. The demise of the this species was long delayed by the use of literal and metaphorical “smoke screens” employed by industrially funded scientists, but in the end this tactic failed miserably.

      However the same technique for the current extinction event is proving to be ineffective, despite the industrial and political sponsorship of a similar small cohort of scientists which has unfortunately just delayed the inevitable.

      This segment of the climate change denial community needs to be commemorated for posterity by means of a permanent exhibit at the Smithsonian of some prime examples of the species. My suggestion is a taxidermal exhibit of a British peer and other relevant luminaries of this community, once they depart this mortal coil.

      Alternatively the talents of Madam Tussauds could be employed to create wax effigies, but I wouldnt take children to this part of the exhibit. It would be way too scary. I would stick to the Dark and Mediaeval Ages exhibit that celebrate the contributions to civilization of Attila the Hun and Vlad the Impaler or just visit an expanded dinosaur exhibit where the large number of those who comment here could be accommodated.

      Some people have suggested, in the meantime, that reservations could be established to preserve their habitat. They tend to congregate in communities where they can socialize and avoid any exposure to logic or the complexity of scientific processes, so a careful choice of habitat is required.

      In the future, when most people will disbelieve that such a species existed, we need to provide some concrete evidence of their existence. I suggest that we urgently need to obtain some DNA from a range of this community before they die out. Then to convince the disbelievers, future generations could clone this material and resurrect the species.

      This could be the basis of a commercial enterprise called maybe, Holocene Park. I might need to see someone about the film rights.

      • mpainter says:

        The AGW crowd has it all wrong. Water vapor is not a positive feedback. Increased atmospheric water vapor does not increase temperatures, but moderates them by reducing the diurnal range. Compare the dry Sahara with the humid tropics. This means that climate sensitivity is about 1K. Poor lemmings.

        • Toneb says:

          If you say so painter, it obviously must be.
          FFS.

        • miker says:

          Mpainter.

          Boy you are one confused puppy. Yes you are right that increased water vapor may cause a reduction in diurnal temperature range (DTR). However this reduction could be due to lower maximum temperatures or increasing minimum temperatures or both.

          Consequently a change in diurnal temperature range does not tell you whether the average temperature has changed.

          The evidence is that over long periods, such as the last 100 years or more , DTR has dropped. While this has happened, both minimum and maximum temperatures have increased and of course the average temperature has likewise increased.

          However the rate of increase in minimum temperatures has been greater than the rate of increase for the maximum temperatures and the DTR has reduced accordingly.

          What is important with regard to feedback is whether an increase in water vapour, increases or decreases average temperatures.

          • mpainter says:

            Who is the confused one? It is both tmin and tmax that are moderated by increased water vapor. And you agree, do you not, that increased water vapor means reduced diurnal range, with higher tmin but _lower_ tmax. Now you say that both tmin tmax is increasing? Globally? Prove it. Bald assertions such as that do not pass at this blog.

            And you might also consider this: increased insolation would increase tmax, but not increased water vapor.

          • miker says:

            Mpainter, see the following for the global trends in maxima and minima –

            http://berkeleyearth.lbl.gov/auto/Global/Complete_TMAX_complete.txt
            and http://berkeleyearth.lbl.gov/auto/Global/Complete_TMIN_complete.txt

            Despite it being obvious, I think it is worth repeating for the perenially confused mpainter , that a reduction in DTR does not necessarily mean a lower Tmax in absolute terms, but just a lower value compared to Tmin.

          • JohnKl says:

            Hi mpainter,

            You stated:

            “And you might also consider this: increased insolation would increase tmax, but not increased water vapor.”

            Well stated regarding temperature, insolation has been empirically connected to observed warming and yet many would ignore it in favor of theory.

            Have a great day!

          • miker says:

            To Mpainter it is all very simple. To quote from the above.” And you might also consider this: increased insolation would increase tmax, but not increased water vapor”. And your point being?

            Who would suggest Tmax at the surface would increase due to an increase in water vapour?

            I think you have the causality inverted. Higher temperatures are more likely to increase evaporation and hence water vapour, which in turn moderates any increases in Tmax due to insolation or other possible factors such as the direct or indirect influence of a particular triatomic molecule.

            So increasing water vapour should moderate the rate of increase in Tmax but at the same time it will also increase the rate for Tmin.

            The other points which complicate things are –

            1. Is global insolation increasing or decreasing with time over the relevant time period?

            2. If insolation is changing over the time intervals for which maximum temperatures are increasing, what could be driving it?

            With regard to forcing, the important question is what happens to the average temperature. Only examing the effect upon Tmax is simply dumb.

            A more generous interpretation is that mpainter is trying to take everyone for a ride. JohnKl may have fallen for it but I am hopeful he understands the nuances of the above.

            As the saying goes, everything looks like a nail to a man with a hammer.

            In this case, the appropriate parallel is, everything looks simple to a simpleton.

          • mpainter says:

            Miker, you say:”A more generous interpretation is that mpainter is trying to take everyone for a ride.”
            ####

            You have taken yourself for a ride with your effusion of confusion. I cite observations; You cite a tangle of theory and hypothesis in typical AGW style. Once more:

            Diurnal temperature range of dry Sahara: 85 F; tmax: 125F

            Now, multiply the humidity by 6 (from 0.5% to 3% absolute humidity) and we have the humid tropics:

            Diurnal temperature range of the humid tropics: 12F; tmax 92F

            It’s there for all to see. Increased atmospheric humidity moderates temperatures by moderating the diurnal extremes, reducing the diurnal range. Here comes Miker and argues gobbledygook, thinking to refute this incontrovertible observation.

            AGW dogma holds that projected temperature increase depends on positive water vapor feedback which amplifies the rather insignificant warming of increased atmospheric CO2.
            What does Ma Nature say about this? She says “Nope” and the AGW clowns stick their fingers in their ears while shaking their heads “I can’t hear you!”. Here is the truth: there is no amplification through the so-called positive feedback of wv.

            Bottom line: climate sensitivity is negligible, any AGW effect of increased atmospheric CO2 is lost in the noise of natural variability.

            As I have commented elsewhere, AGW types cannot assimilate observations which are contrary to their dogma.

          • miker says:

            Climatological DTR is a relative measure comparing Tmax and Tmin.

            Another relative measure that has come to prominence lately is anatomical DTR, Donald Trumps hand size relative to his appendage. However what is more important for a possible presidential candidate is the relative size of his brain and his appendage and even more importantly the relative intellectual capacity of the two organs. I am open to suggestions as to which organ has the greater intellect.

            Mpainter, from the calibre of your contribution on March 4 at 8:23am, I can hazard a guess that you are a strong advocate of Trump. With regard to my earlier comment above which proved too complex, I think I am going to have to dumb down it to the level appropriate for mpainter. I might run it past my cat first and then see how that goes.

            Yes, as mpainter points out DTR (the climatological version) is reduced by an increase in water vapour that accounts for the difference between desert and tropical conditions. When comparing two geographical locations it reduces Tmax but it also increases Tmin , but the debate around forcing is about long term trends.
            At danger of repeating myself but to further ensure mpainter can understand, I am going to use some high powered math. Hang on to your seats.

            Using DTR = Tmax Tmin. A reduction in DTR due to increasing water vapour means either a reduction in Tmax or an increase in Tmin.

            Using Taverage = ( Tmax + Tmin ) /2 , if the increase in Tmin is greater than the decrease in Tmax then Taverage will increase.
            The tropospheric Taverage is measured by UAH and RSS satellite while the surface Taverage can be calculated from Tmax and Tmin measurements for surface stations.

            Despite mpainters cognitive deficits which does not allow him to understand graphical information , all these temperatures have increased since 1979 for the satellite data (Taverage) and a lot longer for the BEST data (Tmax,Tmin and Taverage) and also the Hadcrut, Gisstemp, NOAA products (Taverage) .

            Also water vapour has increased as expected see Roys blog above – http://www.drroyspencer.com/2016/03/record-rainy-cloudy-humid-february-over-the-oceans/.

            So TAverage is increasing as water vapour is increasing. Any reduction in the upward trend in Tmax does not, without considering what aslo happens to Tmin, provide any evidence for mpainters statement water vapour is not a positive feedback.

            In summary, mpainters conclusions regarding forcing due to water vapour is long on stupidity but short on logic, which is further evidence for the well known inverse correlation between these two variables

          • mpainter says:

            Miker, you say ” A reduction in DTR due to increasing water vapour means either a reduction in Tmax or an increase in Tmin.”
            ###

            Nope, it means both, not “either” one or the other but _both_ and so you stumble and fall right at the beginning. How tedious to dispute with AGW types who always make things up.

          • miker says:

            Mpainter, I have to agree that regretfully in my attempt to simplify things for you via the equation DR = Tmax-Tmin , I did oversimplify.

            Mathematically DTR could be affected by changes in either parameter or both. However physically , at constant water vapour, both Tmax and Tmin will most likely change( see my caveat below). Thank you for your correction.

            The situation in practice may be very different. The usual reason that Tmax tends to decrease when water vapour increases, is due to the likelihood of an increase in cloud cover that reduces insolation. However in reality an increase in water vapour may not necessarily increase cloud cover because coverage depends on a range of other factors such, the presence of nucleation centres , the presence of up drafts, the degree of water vapour increase etc..

            If clouds do form, then this will typically depress Tmax but in the absence clouds, Tmax may not drop, as the level of water vapour increases. So it is not necessarily the case that increasing water vapour will change both Tmax and Tmin.

            Other than that, I am particularly pleased that you are happy with the remainder of my comments above.

          • mpainter says:

            From my previous comment :

            “How tedious to dispute with AGW types who always make things up.”

          • miker says:

            Mpainter,

            from the brevity of your last comment, I see you have yet again cut your losses and have done another runner. Does this desertion mean you do not have any substantive disagreement with my comments above?

            Look I realize you have been busy trying to emulate the feats of the indefatigable DCott and have spread yourself thinly, so it is understandable to have fled the scene.

            DCott had 1183 posts in January alone at almost 40 posts per day. It was a hard act to follow however you managed to keep up with your own efforts in January of 143 posts in 6 days. You were neck and neck for the first 4 days but you ran out of steam.

            It is nothing to be ashamed of to come second in the lunacy stakes to DCott . However I guess that you might worry that time taken addressing my points, may mean you might be overtaken by some other deranged individual.

          • mpainter says:

            The anonymous Miker once again displays his measure as a scientist.

          • miker says:

            +1 for mpainter.

            He is now up to 49 postings in 6 days He seems to be running away with the tile loonie of the month. With the demise of DCott is there are any other deranged individual that could step up to the plate?

            As for anonymity, mpainter, if could you post your full name, D.O.B, address and social security number, I might consider doing likewise.

            A well-connected Nigerian businessman has contacted me with a marvellous business opportunity and I might pass your details onto him.

            You seem to have all the attributes that he has been looking for.

          • mpainter says:

            Miker, thanx for your last. Well you might maintain your anonymity, after such a comment.

            The foaming AGW types have mischaracterized the so-called greenhouse effect, as can be determined by the simplest of observations.

            We know that the GHE varies from one region to the next. Compare the dry Sahara (absolute humidity ~ 0.5%) with the humid tropics, (absolute humidity ~3%). Thus we compare a six-fold increase in GHE, from the dry Sahara to the humid tropics. Does this six-fold increase in the GHE bring about higher temperatures? Clearly, no. What effect, then? Answer: reduction of diurnal temperature range through a moderation of tmin and tmax, both.

            Please note that we observe a six-fold increase in atmospheric humidity from one instance to the next.

            So, Miker, let’s take your measure as a scientist. With due consideration of the above observation, what effect on the global temperature anomaly will a slight increase in atmospheric humidity have?

          • miker says:

            Mpainter,

            The large differences between the humidity of desert and the tropics is interesting but a trifle simple minded if you are trying to relate it to temporal trends in temperatures.

            One of the major differences between deserts and the tropics is the presence of vegetation in one and the lack thereof in the other. There are large differences in isolation due to differences in cloud cover (which itself is related to water vapour) .The effects of insolation are hugely different due to the different terrain and coverage of vegetation.

            Even in deserts the thermal properties of sand and rock and the moisture content of the soils can affect the temperature when heated by sunlight.

            In contrast, in a tropical forest or grassland the tree canopy, the ground cover etc., etc. play a large part in suppressing temperatures.

            The role of ground conditions and temperature in the Australian context has been studied by Ken Stewart and, to give credit when it is due, the results are interesting see https://kenskingdom.wordpress.com/2015/11/20/why-are-surface-and-satellite-temperatures-different/.

            An additional difference between the two , which again complicates things, is that there are also larger seasonal variations for deserts as compared to the equatorial tropics.

            Therefore it is ridiculous to draw conclusions looking at just the specific humidity in each locale (I gather you meant specific humidity, not absolute, as the latter is expressed in mass of water vapour per unit volume of air while former is the percentage of the mass of water vapour compared to the total mass of air and water vapour).

            The answer to your specific question what effect on the global temperature anomaly will a slight increase in atmospheric humidity have? depends on how you define a slight increase in atmospheric humidity. Does your reference to the slight include 11% see (http://www.drroyspencer.com/wp-content/uploads/SSMI-Vapor-thru-201602.jpg) ?

            It is hard to discern cause and effect but the tropospheric temperature is rapidly increasing while the water vapour rises. if the negative feedback due to water vapour exists, it is doing a really horrible job at suppressing temperatures. Maybe that idea needs to be put out to pasture.

            Mpainter, I am pleased that you actually managed to assemble more than one or two sentences in your comment above. Maybe we are making progress.

          • mpainter says:

            Miker, I see no progress on your part. You are still stepping around the essential issue.

            Let’s take the ultimate GHE : the tropical ocean. In this case the diurnal range is reduced to two or three degrees. Try adding a little more humidity and will temperatures rise? Of course not. My point is that water vapor provides no positive feedback. With no positive feedback, AGW falls flat.

            Once again, increased atmospheric water vapor does not increase temperatures, it moderates them, as per observations. In my school, observations trumped theory and failed hypothesis.

            The egregious AGW meme holds that insolation cannot account for earth’s surface temperature. This is incorrect. The heat of insolation accumulates in the ocean and SST is determined by this cumulative process. GH gases have nothing to do with SST. AGW is unsupportable in view of the simplest observations.

          • mpainter says:

            A six-fold increase in atmospheric humidity, Miker, and you still cannot comprehend the significance of that.

            >cannot assimilate observations to their dogmatic views.

          • miker says:

            Mpainter,

            you keep repeating ad nauseum the statement that water vapour moderates temperatures when you mean it moderates temperature extremes, and lowers Tmax which I have never disputed.
            It as if you think the moderation results in a lower Tmin rather than a higher Tmin!

            I think you need to write a 1000 times on a blackboard and recite at the same time, Bart Simpson style, the following , “moderation means an increase in Tmin not a decrease”.

            You could also include the following. “What is important regarding feedback is the effect of water vapour on the average temperature and not on the extremes”.

            After all the major global satellite and surface temperature measurements are of the average temperature. The major exception is the BEST data set which I referenced earlier which shows a long term decrease since 1850 in DTR while Tmax and Tmin are increasing.

            If you can’t comprehend this then you are in danger of your loved ones turning off your life support system.

            I am not sure what your point about diurnal range and ocean temperatures. Are you referring to SST or air temperatures 2m above the ocean? Either way makes no sense . I think you need to refrain from obsessively posting and get some sleep.

            I thought I covered the 6 fold humidity change between deserts and tropics with my comments above.

            By the way the 3% figure for tropics seems excessive. This corresponds to 100% R.H at 32C see – http://www.rotronic.com/humidity_measurement-feuchtemessung-mesure_de_l_humidite/humidity-calculator-feuchterechner-mr.

            Singapore which lies on the equator, which is one the most humid places in the world the specific humidity varies on average between 1.3% a night (65% R.H at 26 C) and 2.6% at the hottest point of the day (93% at 31C).

            The figure for the tropics as a whole has been estimated at 1.7% see figure 1.9 (b) of http://www.goes-r.gov/users/comet/tropical/textbook_2nd_edition/print_1.htm .

          • mpainter says:

            Poor fellow, you are too thick, and it is impossible to make any headway with you. There is no positive feedback from water vapor, increasing the atmospheric humidity levels does not increase temperatures, AGW is nil, the climate alarmism is a modern day neurosis. To grasp this, all one has to do is compare the dry Sahara with the humid tropics which.you.are.incapable.of.

          • miker says:

            Mpainter,

            The Sahara and the tropics are very large areas. Do you have any particular locations in mind?

            Here is the graph of temperatures in the Sahara for 18 locations. see -http://clivebest.com/blog/wp-content/uploads/2012/01/Avergare-Temperatures.png .

            The data set can be found at http://clivebest.com/data/SaharaAverageMY-Norms.txt.

            The average for this data is 27.1C

            For the tropics the average is around 27 to 29 C see http://www.eoearth.org/view/article/162264/ .

            What is most revealing is the following map of average temperatures globally for the period 1961-1990 see –
            https://upload.wikimedia.org/wikipedia/commons/a/aa/Annual_Average_Temperature_Map.jpg .

            https://commons.m.wikimedia.org/wiki/File:Annual_Average_Temperature_Map.jpg .

            For those who are not familiar with the extent of the Sahara it is shown here http://tinyurl.com/zevfa8d .

            Note that the majority of the Sahara (north, central and most of the south) is at lower average temperature than the tropics. Only the south western region appears to be close in temperature to the adjacent tropical regions further south in Africa and the other tropical regions of the globe.

            Mpainter , now what was your point again?

          • miker says:

            Mpainter

            The Sahara and the tropics are very large areas. Do you have any particular locations in mind?

            Here is the graph of temperatures in the Sahara for 18 locations. see -http://clivebest.com/blog/wp-content/uploads/2012/01/Avergare-Temperatures.png . The data set can be found at the same site. Using this data , the average for this data is 27.1C

            For the tropics the average is around 27 to 29 C see http://www.eoearth.org/view/article/162264/ .

          • miker says:

            To continue from the previous post.

            Mpainter, What is most revealing is the following map of average temperatures globally for the period 1961-1990 –

            https://commons.m.wikimedia.org/wiki/File:Annual_Average_Temperature_Map.jpg

            For those who are not familiar with the extent of the Sahara it is shown here http://tinyurl.com/zevfa8d .

            Note that the majority of the Sahara (north, central and most of the south) is at lower average temperature than the tropics.

            Only the south western region appears to be close in average temperatures to the tropical regions further south in Africa and the other regions of the tropics.

            Mpainter , what was your point again?

          • mpainter says:

            IQ test time for Miker: Which has the greatest insolation? Equatorial Africa or the central Sahara? Also, wintertime in the subtropics? Check it out.So much for your comparison of averages. Funny that you could not figure that out.
            You ask “What was your point again?”
            You don’t really want to hear it again, do you?

          • miker says:

            Mpainter,

            Do you mean insolation at the top of the atmosphere or at the earths surface?
            See https://en.wikipedia.org/wiki/Solar_irradiance#/media/File:Insolation.png .

            Yes the winter effect in the subtropics is real and hence the reduction in the average insolation at the top of the atmosphere. As you can see from the following (http://tinyurl.com/gqldqhm ) the the effect is minimal comparing the insolation at the top of the atmosphere for the average latitude of the Sahara (at about 25 degrees) with that at the mid tropics at about 10 degrees latitude.

            To emphasize this point, from the map in my previous comment, you only have to go a degree or two south of the Sahara to the more tropical regions to see an average temperature increase.

            In comparison, because of the lack of cloud cover, the direct insolation at the surface for the desert is much greater than for the tropics. I would have thought this minimal cloud cover combined with the lack of vegetation would mean the deserts would be considerably hotter, on average, than the equatorial tropics, but it seems not.

            You live and learn.

            I wish I could say the same for mpainter, who seems to have minimal capacity for the latter. However, as they say, the exception proves the rule, and he finally seems to have understood what moderation means, in regard to temperature minimums. Thank heavens for small mercies.

            I wonder where mpainter’s “Gish Gallop” will take us next.

          • mpainter says:

            Your map of average temperatures is not convincing because data points in Africa are sparse or non-existent. Compare the western Sahara with central Sahara. I do not accept the map as reliable. Your map shows polka-dots on Africa: the polka-dotted continent? You are grasping at straws.

            You should know better. But you admit that the GHE does not raise tmax, but lowers it. That is progress. No need to thank me.

            So next time the alarmists screech about record high temperatures, you can tell them that you know better.

            You can tell them that a six-fold increase in the GHE lowers tmax and temperatures are moderated. Yes, the diurnal extremes are moderated.

          • gbaikie says:

            — mpainter says:
            March 10, 2016 at 6:41 AM

            Your map of average temperatures is not convincing because data points in Africa are sparse or non-existent. Compare the western Sahara with central Sahara. I do not accept the map as reliable. Your map shows polka-dots on Africa: the polka-dotted continent? You are grasping at straws.–

            Well we have satellites measuring air temperature and in terms of global average temperatures, I think satellite measurement are the most accurate.

            One aspect about satellite measurements I wonder about, are they measuring temperature above sea level or measuring temperature adjusting for land elevations.

            And which ever way it’s done, can we see results from both ways of doing it.

            Or there are good arguments to measure from sea level but if attempting to mimic a land measurement the elevation of land should the adjustment.

      • Mike Maguire says:

        Yeah, right and next thing that climate science will teach us is that past ice ages and plunging CO2 levels caused life to flourish, after almost being wiped out/extinguished by warmth(-:

  7. ossqss says:

    Welcome back Doc. You had been MIA for quite some time. I wondered if you took a trip to North Sentinel Island 🙂

    Thanks for the update.

  8. Brandon says:

    What’s the likely implication of seeing this record warmth be in extratropical regions as opposed to over the tropics?

    I hope it’s a peak then drop like in 1998. What do you think will happen as this Nino ends?

  9. Brandon says:

    In short regarding the 2nd question I asked I want to know what you predict in global temp trends 2017-2020 timeframe, and how (if at all) the biggest anomalies being extratropical factor into these predictions

    • I don’t have a strong opinion on what will happen. If I had to, I’d guess we will go back to a slow warming trend, even if we get a good La Nina in the next couple years.

      I’d love to see warming stop entirely, which is still a possibility…but I wouldn’t bet on it. Easy for people to make long range predictions when no one will remember how wrong you were.

      • Brandon says:

        A ‘slow warming trend’ means about how much per decade? Do you think anomalies will drop off the El Nino peak values (they will just remain a bit higher than they were before this Nino spike)?

        In all I’m looking for if you expect this is a rapid sustained warming (ie panic/doomsday scenario) like the IPCC and the alarmists say, or if you think the overall warming trend will remain slower compared to those predictions.

        • Mathius says:

          Brandon, you can find ample evidence on this website where Dr. Spencer stands on that.

          The current warming (temperature spike) has heavy El Nino influence on it. Most likely the anomaly is going to come back down this summer into next year. Mother Nature is an unpredictable beast though, you never know what to expect.

      • Brandon says:

        I guess the term I should be using is ‘runaway warminng’ as the main point of my question is if you’re best prediction is for or against such an outcome (when trends are averaged over a sufficiently long period)

        • MarkB says:

          Pretty much no one is predicting “runaway warming”, Dr Spencer in particular. His stated position is that he thinks climate sensitivity and climate change impacts are on the low side of the IPCC uncertainty range. While I don’t agree that this specific position is particularly well supported he does clearly acknowledge the existence of AGW.

      • bit chilly says:

        for that to occur it would have to mean that the amo has no effect on global temperatures roy.

  10. Jim Munroe says:

    Dr. Spencer,

    It seems clear from the data you compared to that it was hottest by far in the arctic and your data doesn’t pick that up. What affect do you think it would have on your temperature if you used the arctic temps?

    Just wondering,
    JM

    • it will have very little effect because the polar area we omit is a very small fraction of the total area.

      • DougCotton says:

        Keep to your temperature data, Roy, as you do that well. But admit your error in your understanding of thermodynamics, so you don’t defeat your purpose.

        The 100% natural pause will continue until 2028 and 500 years of 100% natural cooling will start before the end of this century.

        Correct physics shows water vapor causes the surface to be cooler than the gravitationally induced temperature gradient would otherwise cause it to be.

        Temperatures in all planets build up from the radiating altitude going towards the core, following the expected gradient. Otherwise, how would the surface and sub-surface regions “know” what temperature to be? How does the base of that 9Km deep German borehole “know” it should be 270C and then temperatures reduce towards the surface, coming out at just the right value there?

        Surprising? Not for those who understand the breakthrough physics I have explained, Roy.

        Continued here.

      • DougCotton says:

        Roy

        There’s a deal offered here.

        • Mike O says:

          Doug,
          You are a true lowlife.

        • Mike Maguire says:

          Doug,
          Surely you are aware that your fanatical(disrespecting of Dr. Spencer) tactics are only closing minds to your theory.

          Let’s say there were 2 companies competing to sell a similar product in the same market and you applied for a job in sales at both places, suggesting that they observe your behavior here, as the main determinant for hiring you.

          They would both be anxious to hire you to sell………..for the other company at whatever price they had to pay (-:

          • DougCotton says:

            I don’t disrespect Dr Spencer with his excellent work on temperature data. I just feel obliged to point out his error in assuming the IPCC are correct about radiative forcing and a supposedly isothermal troposphere that could only happen as a complete violation of the Second Law of Thermodynamics, as it would have unbalanced energy potentials with more gravitational potential energy at the top.

            If I can rightly assume that Roy is wanting to calm the concern about carbon dioxide, then I can potentially help him by assisting him to understand what is the correct thermodynamics involved – a specialty within physics in which I have both qualifications and extensive post graduate study and research to draw upon. Do you seriously think that Roy understands entropy matters and thermodynamic equilibrium better than I do? Do you understand such? If so, try refuting my hypothesis for the AU $10,000 reward that has not been claimed for proving me wrong in over three years now.

          • Just as a matter of interest, how can we be assured of the impartiality of the person judging the claim?

            I’m no physicist, but it seems to me that any scientific claim must be judged on the success of its predictions. What predictions does your hypothesis produce, and how would they be testable? If you can state this clearly, then perhaps even a non-physicist could attempt to trawl the literature and look for a falsification. I could use the money, after all. If you cannot state clearly what a falsifying result would look like, I am not sure why anyone would regard your claims as science at all or why they would trust you to accept a claim.

          • gbaikie says:

            –Elliott Bignell says:
            March 3, 2016 at 3:05 AM

            Just as a matter of interest, how can we be assured of the impartiality of the person judging the claim?

            Im no physicist, but it seems to me that any scientific claim must be judged on the success of its predictions. What predictions does your hypothesis produce, and how would they be testable? If you can state this clearly, then perhaps even a non-physicist could attempt to trawl the literature and look for a falsification. I could use the money, after all. If you cannot state clearly what a falsifying result would look like, I am not sure why anyone would regard your claims as science at all or why they would trust you to accept a claim.–

            You make a good point.And D–g has not answered such questions before.
            The Greenhouse effect theory also has the same problem.
            Though clouds do cause nights to be warmer.
            Or easy to find evidence that clouds [droplets of water- not gas] prevent nights to not cool as much compared to clear skies.
            Also the urban heat island effect causes warming- lots of evidence can be found that supports this.
            So clouds and UHI effect do cause warming and they are unrelated to greenhouse gases. And the greenhouse effect theory say that only greenhouse gases can cause warming.

            Also an actual greenhouse causing night time warming- and an actual greenhouse is not related to greenhouse gases.

            Another thing one can find, is the warming effect of solar ponds- which again is unrelated to warming from greenhouse gases.
            Dust storms also cause warming- again any unrelated to greenhouse gases. And you find evidence of this.

          • Other influences that can also produce warming do not represent falsifications of AW. They represent a series of complications in testing for a clear warming signal that COULD falsify AW. Do not forget that the prediction of AW was made in the 19th century, based on a body of science that has stood up to decades of productive use in the intervening period.

            The idea that UHIs are causing the warming signal, for instance, can be eliminated by correcting for UHIs and using data streams that are not impinged upon by UHIs, for instance, and a lot of work is done on this. (Not least the use of satellite telemetry, hint, hint.) At the same time influences like UHIs CANNOT explain further observations that AW predicts, such as stratospheric cooling and polar amplification.

          • gbaikie says:

            — Elliott Bignell says:
            March 10, 2016 at 7:45 AM

            Other influences that can also produce warming do not represent falsifications of AW. They represent a series of complications in testing for a clear warming signal that COULD falsify AW. Do not forget that the prediction of AW was made in the 19th century, based on a body of science that has stood up to decades of productive use in the intervening period.–
            The ‘science” of 19th century, over estimated the warming effect of CO2. And was primarily about attempting to explain the cycles of glacial and interglacial periods.
            About the only thing correct about it, was the assumption that the warming from CO2 would be a good thing. Or it’s been long taken for granted that warming periods within our current interglacial period has been “good” rather than “bad” period in history.
            This of course would be from a mostly European prospective, though it also was in general a sentiment shared by those living in northern part China and Japan. And as there has been and it remains the case, of little change in temperature tropical regions.

            –The idea that UHIs are causing the warming signal, for instance, can be eliminated by correcting for UHIs and using data streams that are not impinged upon by UHIs, for instance, and a lot of work is done on this. (Not least the use of satellite telemetry, hint, hint.) At the same time influences like UHIs CANNOT explain further observations that AW predicts, such as stratospheric cooling and polar amplification.–
            The point was not that UHIs cause significant warming, but rather the same warming effect occurs in nature. It’s just that the recent build up of urban area make it easy to measure the difference in temperatures in comparison to surrounding region which less urban.
            In terms of large scale effects, the oceans have a warming effect as compared to land areas. And vast region converted into irrigated farming areas, have a warming effect.
            So URI are merely a demonstration of warming effects which are possible. That URI effects have make measuring the correct average temperature is factor, but probably the incorrect method of measuring air temperature is a large factor in terms of measurement errors/uncertainties.
            But global sea level rise and warming oceans provide another way to confirm that over last 200 years we have had a global warming period.

            The point is that greenhouse effect theory says that only greenhouse gases cause global increase in temperature, and this is can be demonstrated to be incorrect and thereby invalidates the greenhouse effect theory.

          • gbaikie says:

            Typo, “URI” is meant to be “UHI”.

            Of course another warming effect is from ocean circulation- which again, is another warming effect not related greenhouse gases.
            And other than cyclical effects caused by El Nino and/or PDO,
            one things like the Gulf Stream warming Europe.

            So we have oceans of water and clouds of water which have easily measurable causes of warming. These are actual fingerprints of warming, whereas despite false claims, we actually have no fingerprints of warming caused by CO2.

            I believe CO2 does cause some global warming, but it’s only a theory, rather than belief based upon precise measurements.
            But my belief is limited by the measurements which have done
            and accordingly I suspect that doubling of CO2 causes about 1 C or less of warming.
            Likewise I believe the warming from water vapor
            is of a limited amount. And with water vapor one has other factors other than the H20 gas’s radiant effect. for instance one has the latent heat of water vapor and of course the water vapor creates clouds.

            So, I believe that H20 and CO2 gas does cause some warming due to their radiant effects and because there much more H20 gas, H20 gas results in more warming than the CO2 gas.

  11. Danny says:

    Roy,

    Your previous post loads images just fine, but I can’t get any of your images to show up on this one. It’s odd. I’m running Chrome on OS X. Also, thanks for the updates!

  12. sod says:

    So the pause is dead.

    http://davidappell.blogspot.de/2016/02/the-ted-cruz-pause-is-on-life-support.html

    Good that you stopped using that polynominal trend line. it could start to bend upwards now…

  13. geran says:

    This El Nino has been amazing. Although it has peaked, it is still an official El Nino. But, with ocean temps dropping, either Feb or March should be the peak in UAH. As ENSO temps fall, so should satellite temps.

    A funny consequence of this “high” UAH anomaly is that the Warmist criticisms of UAH should vanish, temporarily….

    • sod says:

      Here you can find a good comparison with the 1998 el nino. It was rather clear, that this one would beat 1998 (if the data method had not been changed too much)

      http://davidappell.blogspot.de/2016/01/ted-cruz-your-18-years-of-no-satellite.html

      So indeed, Roy Spencer will win some recognition back among those who became pretty “sceptic” about his data.

      But the main problem remains: why should people focus on a dataset, that shows these huge spikes every 20 years and that for produces trends with little meaning over the short time spans of data that we have.

      “Sceptics” on the other and might actually really abandon UAH as their flagship dataset (many have already switched to RSS, clinging to the “pause” for as long as possible).

      So i fear you might have noticed the splinter in the eye of the “alarmist”, but you are ignoring a huge amount of wood stuck in the “sceptics” eyes…

      • geran says:

        Nah, I prefer reality over your imagination.

        • sod says:

          The reality is +0.83C, hottest month on record.

          The reality is the end of the pause in the UAH set.

          • geran says:

            The reality is Warmists now flock to UAH reports like moths to a lamp.

          • bit chilly says:

            the reality is it is the hottest month in the satellite record ken. i am looking forward to the nonsense you will be spouting by the end of the year when la nina coupled with a rapidly cooling atlantic finally puts the nonsense from you and your ilk in a box for good.

            along with the establishment distancing themselves from karl et al we have more good news this week http://yaledailynews.com/blog/2016/03/01/climate-change-institute-shut-down/
            the wheels are coming off the bus.

          • barry says:

            “The reality is Warmists now flock to UAH reports like moths to a lamp.”

            They can “flock” to RSS, too, which also has a large, pause-busting spike.

            http://www.woodfortrees.org/plot/rss

            That’s the old v3 RSS data, BTW, not the new data set some are complaining about.

            There’s always the Antarctic sea ice trend for critics to “flock” to to keep the message going.

        • DougCotton says:

          Science of Doom articles are full of mistakes …

          He calculated the solar flux reaching the Venus surface to be well over 100W/m^2 when in fact measurements show it to be less than 20W/m^2. The Venus atmosphere of >97% carbon dioxide has emissivity in the vicinity of 0.19, so Stefan Boltzmann calculations show that the temperature of the atmosphere would have to be over 1,100K in order to emit enough radiation to maintain surface temperatures around 735K. Yet sod thinks Venus surface temperatures can be calculated from radiation values. They can’t be.

          Then of course we have all those “Amazing Back Radiation” articles about how we can supposedly add the flux of radiation from the atmosphere to that from the Sun and use the total (less non-radiative cooling losses) of 168+324-102=390W/m^2 to “explain” the mean surface temperature of 288K.

          The next Science of Doom problem is that the solar flux is very variable and, if you take that fact into account, 390W/m^2 of variable flux that could come from a Sun half the distance away, would still not make the mean surface temperature greater than about 4C.

          Well, when it comes to radiation, sod, there’s no heat from cooler regions to warmer regions, and backradiation does not even penetrate water surfaces by more than a few nanometers. Physicists know it is pseudo scattered just like most of the radiation in your microwave oven that does not warm those plastic microwave bowls. If back radiation could be added, then there would be places in the tropics that would get to well over 80C. And rain forests with far greater than average greenhouse gas (water vapor) above them are not over 50 degrees hotter than similar, but drier regions at similar latitude and altitude. My study confirmed that they are cooler.

          What does happen is at http://climate-change-theory.com .

          • Rik Myslewski says:

            Sorry to jump into this fray somewhat late well, to be perfect.y honest, rather late but as a newbie I gotta ask, who is this “Doug” nutcase? Is he respected around here? Tolerated? Honored? The dude seems to be well beyond rational discourse, but, hey, as I said, I’m new here and am looking for a baseline understanding of discourse.

          • mpainter says:

            He is a victim of a type of dementia. Best ignore him.

        • DougCotton says:

          I just found another howler in Science of Doom …

          In this article sod is trying to make out that back radiation (only penetrating the ocean by a few microns) supposedly raises the temperature of that already-warmer ocean.

          Firstly, he postulates that solar radiation heats the surface because it penetrates and 80% is absorbed in the first 10 meters – well, so far so good. However, the temperature gradient in this ocean thermocline area is relatively steep as temperatures reduce from around 20C near the surface down to 4C or colder near the ocean floor. There is, as I have said, a steep temperature “slippery dip” and of course the Second Law tells us there will be conduction and convective heat transfers downwards from warmer to cooler. The extra thermal energy (especially in the tropics) does not accumulated near the ocean floor but instead must follow isothermals towards polar regions where those ~4C isothermals come back up to the surface.

          But our friend sod thinks otherwise and writes “hotter water expands and so rises” and I can assure you that the minimal expansion of liquid water is nowhere near enough to enable heat transfer back up that steep thermal gradient against all the new heat coming downwards.

          And yet, even with back radiation penetrating just a few microns and supposedly delivering all its energy into that micro-thin surface layer that would rapidly boil, somehow he thinks such a small layer of near 100C water is going to mix with the rest of the ocean and make it, what was it, oh yes, “33 degrees” warmer than it would have been with the otherwise assumed isothermal troposphere. The latter is impossible even without GH pollutants like water vapor, CO2 and CH4 because it would have unbalanced energy potentials due to higher gravitational potential energy in molecules near the top.

          • GeorgeRoberts says:

            “In this article sod is trying to make out that back radiation (only penetrating the ocean by a few microns)”

            Ocean waves are elliptical paths of water about six times the depths of the wave height. This part of the ocean is very well mixed on a very short time scale.

            “back radiation (only penetrating the ocean by a few microns) supposedly raises the temperature of that already-warmer ocean.”

            Solar radiation heats the ocean. The ocean loses energy in the infrared. Greenhouse gases reduce the rate of the energy loss, making the ocean cool less than it would without them.

          • mpainter says:

            Incorrect, George Roberts. Ocean swells have a very low amplitude relative to wave length. For example, a six foot swell could have a wave length of 120 feet. There is no mixing under such conditions.
            The lack of mixing is reflected in the temperature profile of the sea: invariably the temperature cools with depth, under daytime conditions. However, the upper ten meters overturns diurnally, at night, via convection. This is mixing but is wholly a cooling process.

            The LWIR is caught at or within a few microns of the interface. For example, the 15 micron band ( CO2) is absorbed within the top four microns. This absorbed energy is transient, being returned to the atmosphere as radiation (~30%), or latent energy (~69%), or as sensible heat. This happens immediately as LWIR is received. It should be noted that a water molecule at, say, three microns depth, can radiate to the atmosphere, as determined by the attenuation curve of the radiation. There is no energy transferred downward from this interval at the interface because heat flow is always toward the cooler atmosphere.

            Note that the cooling of the sea surface is never accomplished before the ocean current circulates poleward. Heat is cumulative, and it is due to insolation, not LWIR, as explained above.

            It is one of the most egregious of AGW dogma that the atmosphere determines ocean temperature. It is the other way around.

            You’re welcome.

      • TedM says:

        Sod could you please supply a more reliable source in future comments.

  14. Jjs says:

    Now i’m going to have to listen to my brother inlaw for the next few months about how we are going to die if we don’t vote for more big government. I pray for a very strong la nina just to stop his self righteous pretching.

  15. Tim Wells says:

    It has been warm up to Christmas in the UK, we are now back into winter and expecting snow the next few days.

    • bit chilly says:

      since the turn of the year we have seen temps down to -14c in the scottish highlands and even -4 on coastal regions. all that heat from the el nino must be scurrying off to space very quickly, it certainly never made its way to the uk.

    • Richard Barraclough says:

      Not only was it warm up to Christmas, but the “Central England Temperature”, in a series going back to 1659, was the warmest for December by a massive 1.6 degrees C.

      The winter (Dec, Jan, Feb) would also have been the warmest in this record by 0.01 degrees if this had not been a leap year. As it was, February 29th was rather chilly, and pushed the winter into second place behind 1868-69

      • bit chilly says:

        that is why i mentioned the turn of the year .yet the previous winter january and february were much milder richard. the devil is in the detail, and i now understand why even taking temperature readings is a waste of time when trying to compute regional, never mind global temperatures.

        the difference between the temperature outside my front door compared to my back door can be as high as 10 degrees on any given winter day. the entire notion of a global temperature is a nonsense and any trend you like can be computed when you have a global network of constantly changing and evolving recording stations.

  16. Buddy says:

    Hmmmmmm. So I’m confused. The trend goes from the lower left of the chart…..to the upper right of the chart. Where I come from…THAT…is an upward trend.

    The “channel” is clearly lower left to upper right.

    And wouldn’t you know….that actually goes along with what the temperatures on the ground have been saying….and what has been happening to the ice sheets and glaciers.

    Who would have guessed?

    • mpainter says:

      Buddy, you say: “Hmmmmmm. So Im confused. The trend goes from the lower left of the chart..to the upper right of the chart. Where I come fromTHATis an upward trend.
      ####

      Nope…THAT…is cherry-picking your end points. Even in the land of Oz. Does that help clear the fog?

      • Donald says:

        Is this the same mpainter that wrote the following just last month?

        “Yet the trend is flat starting in 98. Of course, you cant see that, I know. All you can see is the latest El Nino spike.”

        I know a foolish consistency is the hobgoblin of little minds, but aren’t you overcompensating a little?

        • mpainter says:

          No warming in the UAH plot above prior to 1998. None. Two flat trends connected by a step-up. And see the poor lemmings scamper over the brink, the poor, little neurotics.

          • Donald says:

            If your characterization of the data is correct, then Buddy is not cherry picking – maybe oversimplifying, but not cherry picking.

            Your previous statement, however… requires a fruit tree to be present.

          • Donald says:

            Also, and has been pointed out to you, choosing _any_ starting month in the UAH dataset between 1979 and 2010, there are _no_ periods ending last month that do not have a positive trend line slope.

            Now, there were only 7 months out of almost 400 that did not have positive least squares trend slope if using the previous month (January) as the end point. But then you really do need to cherry pick to come up with such a trend line.

          • mpainter says:

            This is an intelligence test and you flunk. Anyone can eyeball the UAH plot and see the flatness of the trend since 98. As for the warming, it shows as a step-up, but it is also detectable in the ENSO cycle, especially in the La Nina which did not match the previous temperature dips.

            Does CO2 explain that stepup? Nope, but increased insolation does. See John McLean, 2014, Late Twentieth Century Warming and Variations in Cloud Cover.

          • Donald says:

            mpainter,

            The data are all there, all 400+ months. Calculate the trends using any starting date you wish, ending in February 2016. You will see that the slope of each and every one of those trend lines is positive – you may choose to simply eyeball the graph, but the details are in the actual data. Also, your eyeball is undoubtedly having a difficult time integrating the last two months into your subjective analysis.

          • Donald says:

            mpainter,

            BTW this: “Anyone can eyeball the UAH plot and see the flatness of the trend since 98”

            is, again, the cherry picking that you point out in others.

          • Donald says:

            mpainter,

            even using your cherry-picked starting period – please, calculate the linear trend. Is it positive?

            I will point out, however, that a positive trend line does not necessarily equate to warming over that period. But ‘eyeballing’ one’s on trend line also does not disprove a particular theory, either.

          • mpainter says:

            Two flat trends connected by a step-up. Look again, squint your eyes or ask your sister, she will point it out. You can plot a trend line starting in 79 and ending today but this is fallacy. The real fact is there was no warming before 98 or after 02.

          • Donald says:

            mpainter,

            and I repeat – choose whatever month you want in 1998 – use that as a starting point. Calculate the linear trend ending last month.

            The slope is positive.

            Regardless, using particular end points to understand any underlying trend is a fool’s errand. Why? Because the inter-annual anomalies dwarf the purported underlying trend.

            If that is unclear to you, think about this: in 1999, the UAH anomaly dropped down below what it was in 1997 – there was no step up in 1998, even using your own logic.
            1997: -0.009
            1998: 0.48
            1999: -0.018
            2000: -0.020

            Look at the data – no step. 1999 and 2000 were both lower than 1997. If anything, that’s a step _down_ according to the logic you seem to be using.

            Sure, you can come up with a hypothesis that is different from a long term, steady increase in temps that is masked by inter-annual fluctuations – but that hypothesis doesn’t disprove the other hypothesis; it isn’t even evidence against the other hypothesis.

          • mpainter says:

            Donald, you are a hard case. Do you have any science background? If so, what, pray tell.

            1. The spike is transient and hence insignificant, which incontrovertible fact your type obdurately refuses to acknowledge. It will make no difference on the trend as the inevitable cooling will confirm very shortly. Really, you flunk every item on the test.

            2.You didn’t squint nor ask your sister did you? So you missed the step-up again. It is circa 2000-2002. And it connects two flat trends.

            3. No hypothesis, Donald, but an observation. Do you understand the difference between the two? Let me repeat it for you: the step-up is an _observation_, you see. That is, if your brain is working, you can see. If you look further, you will _observe_ that there was no warming prior to 1998 nor post 2002, in terms of trend. The step-up connects two flat trends. It seems that you are one of those types who are incapable of observing. That’s not unusual, climate science abounds with those types.

          • Donald says:

            mpainter,

            OK, here are the full calendar year annual anomalies from 2000-2006 (V6beta5)

            2000: -0.024
            2001: 0.156
            2002: 0.147
            2003: 0.376
            2004: 0.047
            2005: 0.084
            2006: 0.168
            2007: -0.036
            2008: 0.021

            Yes, the anomalies increase from -0.024 in 2000 up to 0.376 in 2003.

            But then they fall right back down (though less far than they did in the 1990s): 0.047 in 2004 -0.036 in 2007. 2003 is in fact double the anomaly of any other year in this time frame. So no, no step upwards there.

          • Donald says:

            Maybe this will make it clearer to you. Looking at the graph, there is very clearly a step _down_ in 1999. From 1979 to 1998 there is a very clear warming trend, then bam! a huge drop in temps – a full 0.5C drop – God must have flushed.

            After that one anomalous year, the strong warming trend reasserts itself, and from 1999 to 2016 there is another strong warming trend.

            See – line fitting is fun!

          • mpainter says:

            No help for you, Donald.

          • Donald says:

            mpainter,

            You aren’t convincing anybody of anything here. You can try to understand better, though.

            Seriously, look at the data I just listed above – look at the annual anomalies. Look at the graph that Dr. Spencer provided above, even, and notice that, in 2008 and 2009, the UAH anomaly drops below even the long term average.

            Try to synthesize that fact, with your claim of a step increase 8 years earlier.

            Use the data provided by V6Beta5 above. Make an argument based on that data, and show how that data is consistent with your claim.

          • mpainter says:

            Donald, you have a very bad problem. You are beyond help. Everyone but you sees the step-up, though some may argue it is inconsequential. I suggest that you seek help. Maybe see an eye doctor.

        • Donald says:

          Just show in the data what you mean, mpainter. The data is right there.

          Don’t just wave your hands around and insult people. Show your actual argument.

      • miker says:

        Mpainter,

        With respect to cherry picking, the data, shown in Roy Spencers figure at the top of this blog, starts at the beginning and finishes at the end (apologies for the tautology) with 445 data points in betwen.

        I do know, like anyone familiar with the inanities of mpainter, is that he has a form of myopia that does not allow him to discern trends but can only see steps. In fact only one step. Any number greater than that and he tends to lose count.

        Mpainter If you cannot discern a trend visually, then let Excel do the work for you. Fit a trend line to all 447 points and discover whether the trend is positive, negative or zero.

    • bit chilly says:

      buddy, where were you during several years of increasing antarctic sea ice extent ? now we have one year of decrease up you pop. best off back to the asif echo chamber , your nonsense will be questioned here, no neven to censor enquiring minds.

  17. Dan Pangburn says:

    The huge effective thermal capacitance of the planet mandates that this temperature spike can not represent significant energy change to the planet. Average global temperature is now about the same amount above the annual trend as the spike in 1997-8. Cool down from that took about a year and a half.

    • mpainter says:

      The huge AGW propaganda mill is cranking out the alarms and trying to make the world think that CO2 causes an El Nino spike. The gullible will swill it down, as usual.

  18. DougCotton says:

    WOW! An increase of about 0.1 degree in 18 years between the 1998 peak and this 2016 peak! That’s about 0.55 degree in a century, much like what happened every century between the Dark Ages cooling and the Medieval Warming Period – oh, and also since the Little Ice Age. Just what I said it was seen to be in the graph in the Appendix of my 2012 paper published on several websites four years ago.

    • DougCotton says:

      If anyone wants to know what will happen in future centuries it’s all in the stars right here.

    • gbaikie says:

      It seems to me that it’s possible that in next couple months for it to higher, but after a couple/few months it probably be lower.
      So within 6 months we probably know if Feb is the peak of the spike in temperature.
      It’s seems unfortunate for the pot bangers that this is occurring in winter with all snow on the ground in the northern hemisphere considering the possibility that by summer it will be dropping back down.

  19. Aaron S says:

    Thanks Dr. Roy. Its hetting harder and harder (for me) to disagree that CO2 causes some warming (something you have always suggested). Now the question is what is the climate sensitivity to CO2. I still believe data suggests the sun and cosmic rays are a bigger player than included in the IPCC models. So that suggests to me that since the solar trend is currently negative then the CO2 forcing would be a bit higher than the trend from a temperature record (the two forcings cancel each other). I remain excited to see this La Nina and data trend onward. Learning so much.

    • DougCotton says:

      Correct physics shows that water vapor cools and all the carbon dioxide does too, but only by a minuscule amount less than 0.1C in total. Proof is here and in various comments by myself on last month’s thread.

    • gbaikie says:

      This warming is caused by ocean circulation- EL Nino.
      I think increasing CO2 levels might cause warming. What is obvious is that increasing levels of CO2, eventually follow warming, but as obvious, higher levels of CO2 do not prevent cooling.
      We are currently recovering from the Little Ice Age and present peak in temperature from the El Nino indicate to me that this recovery is not yet over.
      I think at moment things are getting interesting, and I hope we don’t get a large volcanic eruption because I think with or without one, and with us heading toward solar min we get a lowering of global temperature. Or it’s easy to predict we come off this peak, but I mean after that temperature will remain lower. Of course if it doesn’t that would interesting also.
      I also guessing if include this present peak in temperature it’s top is still below the temperature predicted by modeling.
      And after this peak is done, the models will be proven to more inaccurate than they have already proven themselves to be.

  20. Adam says:

    Is there any reason that the warming is concentrated over Eastern Europe and Russia?

  21. Timboss says:

    Gee. What a surprise, a new record setting temp just like the IPCC scientists predicted based on physics.

    Must be some kind of conspiracy.

    • mpainter says:

      Nope, its a swarm of lemmings.

      • jimc says:

        Just some perspective: The Doc thinks Feb may be the peak for El Nino. If so, I see less than 0.1deg C from 98 to 16 which is less than 0.56deg C per century. Much closer to Docs estimate (see Blunder) than Brand Xs.

        • DougCotton says:

          As I said in this comment.

          • jimc says:

            Sorry, for the sake of my sanity, I have adopted a policy of studiously avoiding your comments.

        • Nate says:

          jimc,

          The tallest president of 19th century was 6’4″ (Lincoln). The tallest of the 20th century was 6’3.5″ (LBJ).

          So the trend in presidential height is -0.5″/century.

          Or not. You see the problem here?

      • Mack says:

        Each El Nino gives rise to the “enhanced” “greenhouse effect”. The “greenhouse” malaise is reactivated and enhanced in the brain of the sufferer, but the syndrome has now widely recognised to be linked with the constant drinking of Koolaid in the early, formative years.

        • DougCotton says:

          According to the IPCC, the enhanced GH effect is all about radiative forcing whereby back radiation from the cooler atmosphere is supposed to heat the warmer surface, thus helping the Sun to achieve higher temperatures than it could on its own. In fact, when they add the 324W/m^2 to the solar input (less non-radiative cooling) they get 390W/m^2 of variable flux which would achieve a mean surface temperature of no more than 4C. Not close enough for my liking. That’s why I spent a few thousand hours working out what really happens, and you can read it all free at http://climate-change-theory.com but there’s no obligation for you to study such, of course. Not everyone wants to know the truth as some feel threatened by it and the potential loss of research grants.

      • Simon says:

        mpainter
        It seems you are up against it at the moment with all the warming and melting going on, but it must give you some comfort to know you have DougCotton playing on your team.

        • mpainter says:

          According to the latest NASA study Antarctica gained circa 100 gt of ice/year this century. See Zwally, 2015. Read and weep, uninformed would-be scientist person. So much for melting.

          See UAH plot above and Dr. Roy’s top post. So much for warming, ditto.

          • Simon says:

            Mpaianter serial misinformer!!!!!
            Arctic sea ice at lowest point in recorded history for time of year. Antarctic sea ice lowest point for 15 years.
            Earths ice mass balance negative and loss increasing. Truth not a friend huh?

          • Little Lay Man says:

            Are YOU a scientist, mpainter?

            No scientist I have ever met in my life behaved like you…

            And if you were one, you would perfectly know that the ice accumulation described by Jay Zwally

            https://www.sciencedaily.com/releases/2015/10/151030220523.htm

            was a late reanalysis of sat data collected between 1992 and 2001 resp. between 2003 and 2008, and concerned ice buit by snowfall thousands of years ago.

            One of the comments by Zwally:

            ‘If the losses of the Antarctic Peninsula and parts of West Antarctica continue to increase at the same rate they’ve been increasing for the last two decades, the losses will catch up with the long-term gain in East Antarctica in 20 or 30 years — I don’t think there will be enough snowfall increase to offset these losses.’

            *

            I’m no warmist, but it’s not a reason for me to appreciate unscientific stuff.

            If you really want to get informed about land ice loss, please have a look at this:

            http://climate.nasa.gov/system/internal_resources/details/original/499_GRN_ANT_mass_changes.csv

            There you see:

            Greenland Trend (2002 – 2014): -287 Gt/yr
            Antarctica Trend (2002 – 2014): -134 Gt/yr

            Of course I imagine you telling us: ‘What? NASA? All warmist stuff! Don’t believe them!’

            Yeah…

            P.S. The Greenland trend perfectly fits to that measured by the Danish Meteorology Institute.

          • mpainter says:

            I cite Zwally, 2015. Refute that, or call me names- your choice.

            Grace shows no loss in Greenland ice mass. The loss is accomplished by tinkering with GIA. Look it up. Latest study on that shows that Greenland GIA is “poorly constrained”
            Look it up read up and educate yourself.
            Or call me names- your choice.

          • mpainter says:

            Same to you little layman. I am a scientist, what are you? Go inform yourself how Polar ice cap mass loss is really computed. It is through GIA tinkering. The figures you cite are meaningless because they are simply poorly constrained/unconstrained theoretical Glacial Isotatic Adjustments applied to Grace data, which data itself show no ice loss. Zwally 2015 is important because he had better data (IceSat) and better GIA constraints (GPS) which constraints had been ignored by previous investigators.
            Go see Climate Audit December 3 post last year where Steve McIntyre covers this topic very well. Or don’t, I care not.

            Also, you seem thick. You quote Zwally without seeming to understand his quote.

            I get tired of the knuckleheads that cannot take the measure of this farce called climate science who then attack me when I do. You have swallowed everything that the AGW crowd cranks out. But Eric Steig admits that about half of the Antarctic specialists see no AGW effect on Antarctic mass balance. Go call him names.

          • Simon says:

            mpainter
            “I get tired of the knuckleheads that cannot take the measure of this farce called climate science who then attack me when I do. ”
            Not tired enough to actually understand what you read huh? Do you really believe the earth is not losing ice? Do you really think the glaciers are losing mass? Do you really think the arctic is not shrinking? Or perhaps you just want to lead the knucklehead pack?

          • mpainter says:

            Simon, do you remember admitting that you were no scientist? I can dig that admission up for you, if you like.

          • Simon says:

            mpainter
            What’s your point? That only anyone with a degree related to climate science has a point? If so why don’t you listen more to those who do study it? I’ll tell yo why. You are too worried about someone robbing you of your hard earned dough to allow the fog to clear and the truth to shine. Your posts are little more than a hotch potch of denial. It’s fun watching yo sink though under the weight of evidence. Death by a thousand cuts.

          • mpainter says:

            The point is that you are no scientist but only one who pretends. Does that suit you? Fine, so be it.

        • mpainter says:

          And furthermore, you are in no position make a call. I have tested you and you have no comprehension, no judgement. Yet you call me a “serial misinformer” when I expose the fallacy of AGW dogma. You are foulness.

          • Ross says:

            Embarrassing yourself again mpainter?

          • HarryWiggs says:

            Good at it, isn’t he? It’s all he’s capable of, because his assertions lack any more of scientific rationale.

          • Toneb says:

            Yes, that’s what he does Ross.
            But, don’t you know, he says so – so must be true.
            Science settled.
            Scienceless.
            Because of his “tax dollars”.
            FFS

          • Mack says:

            The neurotic, politically driven loon, Ross, gangs up with the UKMO retiree of 37yrs,Tonyb,(he who hath spent a lifetime sucking on the tit of the UK govt.), to lambast Painter, for pointing out to them the farce of climate science.
            Ross and tonyb..two gullible AGW brainwashed clowns..funny,not. Just foul the with dogma of AGW.

  22. barry says:

    Please please please let RSS show a cool month so I can continue babbling about temps since 1997/98. If not, I’m forced to devolve to telling alarmists that a la Nina may/will come so I can hold on to the shreds of my predilections.

    • Mathius says:

      Tell anyone who doesn’t understand natural year to year variability and the influence of El nino and La Nina on the climate that this month was the warmest on record.

      What’s going to happen?

      Panic.
      Panic everywhere.

    • DougCotton says:

      You see Barry, that’s the problem when Lukes like Roy Spencer, Judith Curry, Joanne Nova and husband, David Evans sit on the fence and still acknowledge the false claims about radiative forcing, thinking it’s just an issue as to how much happens. They feed the debate and defeat their own cause.

      The radiation “science” is totally wrong, and we need to expose it, explain what really happens due to non-radiative processes, and dismiss the whole IPCC garbage. How on Earth could the greenhouse gas water vapor be warming the surface by over 25 degrees? It’s ludicrous to think it could, and there’s not a single study showing moist regions to be the warmest.

      http://climate-change-theory.com

      • barry says:

        Thank goodness we have the moon to compare with, Doug, where night-time temps match Earth’s night-time temps without the so-called “greenhouse” effect.

        Yes, at midnight it gets to around -153C on Earth, just like la luna, because the greenhouse effect is hokum, and water vapour cools. It’s surprising that the Earth is not actually colder than the moon at night.

        • DougCotton says:

          Yes indeed barry. My hypothesis is all about how atmospheres raise the mean temperatures in planetary tropospheres, surfaces and sub-surface regions and reduce the temperature variations.

          It’s surprising to some that, for the planet Uranus that receives less than 0.2% of the solar radiation that Earth receives, the temperature at the base of its 350Km high nominal troposphere has been estimated from extrapolation of measurements made by the passing Voyager II to be 320K. Actually by my hypothesis I figured it should be 305K plus or minus 25 degrees or so, but we won’t worry about the detail. I also estimated the temperature in the 9Km deep borehole in Germany would be 240C to 280C. The scientists were very surprised to find it was 270C.

      • Little Lay Man says:

        That we know
        Nous le savons
        Wir wissen es
        Lo conosciamo
        Vi vet det

        Some more languages?

  23. fonzarelli says:

    Yes, Doug, and me thinks that yours is the best comment so far…

    • fonzarelli says:

      (me also thinks that dr spencer’s comment page ain’t workin’ like it used to. Really miss the old format, dr s…)

  24. barry says:

    What is this “step-change” nonsense?

    Are we to entertain the idea that el Ninos are the cause of global temperature rise? Work that backwards and we see that global temperature must have been 10C cooler a few hundred years ago.

    And if there is another, longer trend underneath these ‘step changes’ (like PDO/AMO) then they’re not step-changes, are they, just the statistical artefact of a quasi-periodic oscillation over a long-term trend.

  25. DougCotton says:

    I’ll STOP POSTING COMMENTS ROY IF …

    you agree to this deal…

    (1) You write a post in which you respond to the QUESTIONS THAT STUMP LUKES AND WARMISTS near the end of my blog and you then study my website and the linked 2013 paper and watch the 43 minute video. Then attempt to refute the thermodynamics in that paper with appropriate reference to the Second Law process of maximum entropy production.

    (2) You allow my response to all your comments and you read all mine and respond to such.

    (3) You are then seen to be the first in the world to prove me wrong regarding the gravitationally induced temperature gradient and the resulting downward free (natural) convective heat transfer that delivers what was originally solar energy absorbed in the atmosphere into the surface, thus supplying the necessary extra kinetic energy that back radiation cannot supply to that warmer surface.

    • mpainter says:

      So now you are an extortionist, Cotton.

      • DougCotton says:

        No, in fact I’m offering AU $10,000 reward (US $7,100) which Roy might be the first to win for proving me wrong.

        Try yourself! Details here but make sure you don’t make blunders like Ball4 when he wrote “entropy of Earth system does reduce at night” (which I trust you understand is fictitious physics) here.

        • Toneb says:

          “No, in fact Im offering AU $10,000 reward (US $7,100) which Roy might be the first to win for proving me wrong.”

          No chance of anyone winning that is there Cotton? as you would be the judge.

          Just another logical fail folks.

          • DougCotton says:

            No problem with the judging, Toneb as nobody has submitted any refutation of the entropy considerations etc in the hypothesis, as you can see on my blog.

            Anyone thinking of submitting such should keep a copy o ftheir post on my blog and perhaps post here and/or on my Facebook “Why It’s Not Carbon Dioxide” group for a wider audience.

            There’s a pretty comprehensive discussion on the earlier thread here with over 3,000 comments. Let me know if you think you can find any comment there that discusses entropy and refutes what I have deduced from the Second Law of Thermodynamics.

            Maybe you can put me to shame by proving me wrong and saying you never got the money, although I can easily pay it via PayPal. Just do it with open comments that I shall respond to if they are actually discussing the hypothesis.

  26. DougCotton says:

    “Yes, Doug, and me thinks that yours is the best comment so far”

    Thanks Fonzarelli.

  27. mpainter says:

    The NH extratropical temp anomaly for land is extraordinary. Can anyone explain it? And please, no wisecracks about it being due to CO2.

    • Norman says:

      mpainter

      I think this article may explain the abnormal warmth in the NH.

      https://www.aer.com/science-research/climate-weather/arctic-oscillation

      From what I can tell from reading this is that the upper pressure gradients are such that warmer air from the south (which is normal for them but very warm up north). I guess it is do to a change in the AO cycle that switches how large scale air flows.

      • DougCotton says:

        And Norman, do you still think molecules at higher heights have less gravitational potential (relative to some imaginary floor in the troposphere) than ones at lower heights because we can’t use the same reference level, or some weird reason known only to yourself?

        Oh, and I hope you don’t think your mate Ball4 was right when he claimed that “Entropy of Earth system reduces at night.”

      • Toneb says:

        Norman:
        It’s probably due to the abnormal persistence of the Aleutian Low in the N Pacifc – it’s been pumping warm sub-tropical air northwards for most of this winter. Again a normal feature of an El Nino.

        • mpainter says:

          A “semi-permanent” feature, not solely an El Nino phenomenon, right? So what gives? Has this feature been magnified this season?

          • Jet stream waviness pumping more energy poleward has indeed been enhanced this season.

          • mpainter says:

            Through this Aleution low? Interesting. And the jet stream is influenced by the little boy?

          • Not just the Aleutian Low but rather by the currently extreme conflict between the bottom up oceanic and top down solar effects on the gradient of tropopause height between equator and poles.
            That gradient and the degree of jet stream waviness affects global cloudiness

          • mpainter says:

            So, then has it been cloudiness over the Arctic that has made this a milder winter? I’m just trying to get a handle on this. Increased cloudiness could well explain it, if there had been a substantial increase.

          • bit chilly says:

            to add to stephen wilde’s comment, this is yet another planetary cooling mechanism. everywhere i look i see negative feedbacks as a response to warming .

    • Little Lay Man says:

      I know mpainter: this answer you won’t like that much.

      http://images.remss.com/msu/msu_time_series.html

      Have a look at 1979-2015
      (1) NH: 0.17 C / dec
      (2) NoPol: 0.33 C / dec

      For you, UAH5.6 of course has disappeared, but not for me:

      NoPol Land Ocean 1979-2015

      0.43 0.40 0.48 C / dec

      Maybe this has an influence on the current NH situation?

      Indeed, 6.0beta5 won’t explain…

      0.22 0.20 0.25 C / dec

  28. barry says:

    Dr Spencer, you once estimated the divergence betwen RSS and UAH v5.6 was because of this.

    “Anyway, my UAH cohort and boss John Christy, who does the detailed matching between satellites, is pretty convinced that the RSS data is undergoing spurious cooling because RSS is still using the old NOAA-15 satellite which has a decaying orbit, to which they are then applying a diurnal cycle drift correction based upon a climate model, which does not quite match reality. We have not used NOAA-15 for trend information in yearswe use the NASA Aqua AMSU, since that satellite carries extra fuel to maintain a precise orbit.”

    http://www.drroyspencer.com/2011/07/on-the-divergence-between-the-uah-and-rss-global-temperature-records/

    Has your position altered now that v6 is much closer to the RSS record?

  29. Eli Rabett says:

    Some, not Eli to be sure, might think apologies are due those who kept pointing out that if the 1998 El Nino were the pattern, this year’s El Nino would show up strongly in the satellite record in the early months of 2016, indeed, if the pattern is followed there will be further increases in the coming months.

    The interesting scientific question is why the lag btw the surface and the lower troposphere.

  30. Dr No, says:

    Ha ha ha.

    The “pause” has gone (as predicted) in a puff of smoke/carbon dioxide !

    20% of the worlds population will eventually have to migrate away from coasts swamped by rising oceans. Cities including New York, London, Rio de Janeiro, Cairo, Calcutta, Jakarta and Shanghai will all be submerged !

    My son Donald marches onward, getting stronger by the day !

    Mayhem, chaos, anarchy followed by world government!

    (Dr No appears courtesy of SPECTRE)

    • AndyG55 says:

      There’s the El Nino spike.

      The pause is gone for now…

      to return re-invigorated and longer in a few months.

      Oceans rising at less than 2mm/year.. SCARY !!! PANIC !!!

  31. Mack says:

    Looking at Dr Roy’s graph..the 1998 El Nino took off at about the 0.0 line in 1997, then plummeted back to even just below that line by 1999. There’s no reason to assume that this El Nino may behave any differently.ie in about a year (or two?) the temperature should plummet back down to the 0.0 line or probably more likely to bounce along at about the +0.1 or +0.2 mark again.
    We’ve had a few really hot days this Feb….but come just yesterday, 1st March, (just as the media people blathered about our Feb being the hottest evah)the nights have suddenly got colder, the sun awning pulled in, the fans put away, and windows closed…I get the impression that heat can be lost very quickly…also have..just call it a gut feeling..that this El Nino may be sharp and short.

    • bit chilly says:

      the warmists either forget or do not know that an el nino is a cooling event.

      • AndyG55 says:

        INTENTIONALLY FORGET, because it gives them a brief reason to CROW like cocks after 18 years of basically zero warming.

        It will be hilarious to watch them crawl back into their crevasses as the temps drop down over the next several months, and the “plateau” comes back even stronger and longer than before. 🙂

      • barry says:

        “the warmists either forget or do not know that an el nino is a cooling event”

        Funny no one here pulled you up on that. Maybe the word cooling works like a charm.

      • barry says:

        Or maybe the word warmists works like a charm. So you double-charmed the regulars into letting that slide.

  32. Dr No, says:

    Ha ha ha!
    You are:” Just wishin’ and hopin’ and thinkin’ and praying’ plannin’ and dreamin’ .”

    • AndyG55 says:

      Dr No-nothing.

      You obviously have zero comprehension about climate patterns etc.

      Please keep digging your hole.. you are going to need it 🙂

  33. Stephen Wilde says:

    The El Nino has approximately coincided with the peak of cycle 24 and since both El Nino events and raised solar activity cause the climate zones to shift poleward we have seen a much enhanced flow of equatorial air across the middle latitudes of the northern hemisphere and into the Arctic.

    That has allowed the global temperature as seen from space to just tip above the 1998 figure but it actually represents a faster loss of energy to space than that which followed the 1998 spike.

    The whole system is a complex interplay between the bottom up ocean effect and the top down solar effect with the balance between El Nino and La Nina constantly changing as the climate zones shift latitudinally to and fro.

    So, yes, it is a fraction warmer than the 1998 peak for a short while but only because of the different timing of the oceanic and solar effects with no statistical significance.

    As others have pointed out above, that tiny rise above 1998 after an 18 year delay does not in any way validate the model projections of a far,far greater warming response from our very much increased CO2 emissions over that 18 year period.

    It will not need much of a La Nina to pull the average back to flat and over the next few ENSO cycles I expect to see the average global temperature begin to show a slow decline despite this recent peak.

    • barry says:

      “As others have pointed out above, that tiny rise above 1998 after an 18 year delay does not in any way validate the model projections of a far,far greater warming response”

      The el Nino effect has only just made itself felt in the MSU data. So for last month and this, we’ve moved from the near the middle to near the top of the climate model ensemble. Check out Dr Spencer’s graph here….

      http://www.drroyspencer.com/2014/02/95-of-climate-models-agree-the-observations-must-be-wrong/

      Dec 2015 = 0.54C
      Jan 2016 = 0.83C

      1998 el Nino peaked in April.

      • ENSO is not a simple annual process so the individual months are not directly comparable from one ENSO cycle to another.

        Even if we see a few more months of warmth from this El Nino the models over the 20 year period remain invalidated and that will become strikingly obvious during the next La Nina.

      • mpainter says:

        “Top of the climate models ensemble.”
        ####

        Barry’s reply substantiated my claim that the poor befuddled warmers joyfully seize upon any temperature spike to proclaim the correctness of the AGW collapsed house of cards. This requires ignoring 1) the transcience of the El Nino spike and 2) the ever-growing gap between the GCM projections and reality, meaning, the flatness of the global temperature trend.. Barry succeeds quite well in this.

        • AndyG55 says:

          “barry succeeds quite well in this.”

          probably his only success in life.

        • barry says:

          I take my cue from critics, who are forever saying “It’s cold today, what global warming?”

          I know the perils of pointing at spikes – I caution against it usually – but its fun to watch the same people who rely on them to push their message changing their tune when the results are off-message. Now that you’ve sprung the trap…

          Can we agree once and for all that short-term trends and spikes are poor indicators of underlying change? And that this merchandise will never again be peddled by ‘skeptics’?

          I thought not. Look for the next low spike in sea ice/sea level/global temps/ocean heat content blared at WUWT and so on.

          • mpainter says:

            Fine, barry. No more whooping it up over ENSO spikes and dips. But when the foaming AGW type points at the spike, I shall point at the dip. Turnabout is fair play.

            And when you point out that the spike reaches the GCM ensemble envelope, as above, I consider you fair game.

          • mpainter says:

            Also, barry, it is not the sceptics who are at fault, as you seem to be saying. It is the foaming AGW types who trumpet the spikes who are the problem, not the sceptics who merely point out the nature of ENSO variation. It is always the foaming AGW types who trumpet alarmism. Their happiness is disaster for mankind. They pervert science for ideological goals, now turned political. They excite profound disgust in me and others. They are something foul in the path that one must step around.

          • barry says:

            No more whooping it up over ENSO spikes and dips.

            Excellent. When this applies to temporary spikes in sea ice, sea level, ocean heat content etc, the conversation gets rational.

            Such spikes can be misleading when stationed at the beginning or end of short-term trend analysis. That’s another bad habit I’d like to see end, or at least appropriately qualified when applied. IOW, just as it is inappropriate to start a trend in 1997/98, it is inappropriate to end one 2015/16 (unless the time period is multidecadal [30 yrs+], where such spikes have minimal impact on the trend).

    • bit chilly says:

      as stephen says, el nino events are not similar events. the wind patterns have been very different to the 98 event. the build up was a lot slower with less energy build up in all nino regions bar 3.4 due to these wind patterns .

      to me it looked like the heat was constantly being wicked away instead of building up to a major event. in turn, again imo, this means lt temperatures will not show a similar response as in 98 as there is just not the same amount of heat to dissipate.

      the fact we have a slightly higher peak in february would confirm stephen’s assertion that the cooling from peak is happening much faster than the 98 event. again imo. happy to be wrong, only my observations.

      one query for roy though.how much effect does the change from in versions have on the absolute value for february ?

  34. AndyG55 says:

    And again, its NOT warm.

    Most of the anomaly is in the NH winter.

    Yell and scream about that, if you really must, but I’m pretty sure that many people up there would be quite grateful.

    • barry says:

      What about global average do you not get?

      • AndyG55 says:

        What about most of the anomaly being in the NH winter don’t you get !.

        • barry says:

          Oh I get it.

          What about global average do you not get? The global average could go up and up, and one will almost always be able to localise the effect when the average trend is clear. As if the whole globe has to be uniformly hotter to be able to claim the average is hotter…?

          The quibble is meaningless. At points in the past NH Winter was feeling extreme heat relative the the rest of the world, and yet those events were cooler than the last. What does that suggest to you?

          Seriously, if you don’t get averaging… I just don’t have the words to describe that level of incomprehension.

      • AndyG55 says:

        Seems that lowercase barry thinks a high global average means the whole globe….. pretty dopey, is barry.

        https://wattsupwiththat.files.wordpress.com/2016/03/february_2016_map.png

        • barry says:

          Nah, that’s your preferred interpretation for an easy but erroneous “win.” My first post referred to the average. That’s some extreme blinders you’re wearing.

  35. mpainter says:

    It’s been a mild winter in my neck of the woods and a warm February. Spring came a week early. But it’s not a typical El Nino, because we have seen very little rain. That is the bad news, because La Ninas invariably bring searing temperatures and killing drought. The alarmists will joyfully screech about CO2, in ignorance of the lower global temperature anomaly.

  36. ehak says:

    RSS 4.0 on its way:

    http://journals.ametsoc.org/doi/abs/10.1175/JCLI-D-15-0744.1?af=R

    In better agreement with other temperature related satellite measurements. Like water vapor.

    • Toneb says:

      Yes –
      And……

      “The new data-set shows substantially increased global-scale warming relative to the previous version of the data-set, particularly after 1998. The new data-set shows more warming than most other middle tropospheric data records constructed from the same set of satellites. We also show that the new data-set is consistent with long-term changes in total column water vapor over the tropical oceans, lending support to its long-term accuracy.”

    • mpainter says:

      Are you going to explain the plot, toneb?
      Or do you hope someone will explain it for you?

      • Toneb says:

        Apart from the obvious – no.

        You see it’s FAR to complicated.
        That’s why there’s an algorithm to do it.
        Or in another words a Model – those things that in the sceptic’s eyes are “worthless”.

        One like UAH uses and recently was, err corrected to v6, to match RSS in a slower warming rate.
        Do you think it will be “corrected” upwards now.

        You know, like the Surface data has been – and as in this case -legitimately.

        Would be interesting to see if RSS now matches RATPAC sonde data.
        If the case, then Mears has done a good job.
        It’s a shade more believable now.

    • Kristian says:

      Toneb,

      That’s TMT, not tlt. The tmt trend has been unnaturally low anyway. Why? Because it’s ‘contaminated’ by substantial stratospheric weighting which doesn’t exist in the tlt product.

      This correction brings it neatly in line with the RSS tlt trend and the NOAA STAR tmt trend. As it well should …

      http://data.remss.com/msu/graphics/TLT/plots/RSS_TS_channel_TLT_Global_Land_And_Sea_v03_3.png
      http://www.star.nesdis.noaa.gov/smcd/emb/mscat/images/MSU_AMSU_Global_Trend.jpg

      • Kristian says:

        And the Pause is still there 🙂

        • Toneb says:

          No.

          “WUWT
          Werner Brozek March 2, 2016 at 12:17 pm

          RSS update

          RSS for February has come out at 0.974. (This is very close to my projection of 0.977!) The pause is now over for RSS. The 0.974 sets a new record for RSS by beating April 1998 which was 0.857.”

      • mpainter says:

        Yes, tmt, not tlt, which explains it all, thanks. Toneb says thanks, too.
        I think.

      • Toneb says:

        Kristian:

        “Thats TMT, not tlt. The tmt trend has been unnaturally low anyway. Why? Because its contaminated by substantial stratospheric weighting which doesnt exist in the tlt product.”

        There is nothing there with which I disagree – however that is not what Mears is giving as the reason for the adjustment…..

        from the paper’s abstract….

        “Previous versions of the RSS dataset have used a diurnal climatology derived from general circulation model output to remove the effects of drifting local measurement time. In this paper, we present evidence that this previous method is not sufficiently accurate, and present several alternative methods to optimize these adjustments using information from the satellite measurements themselves. These are used to construct a number of candidate climate data records using measurements from 15 MSU and AMSU satellites. The new methods result in improved agreement between measurements made by different satellites at the same time. We choose a method based on an optimized second harmonic adjustment to produce a new version of the RSS dataset, Version 4.0.

        So how would TLT be affected differently to TMT given the above?

        • Toneb says:

          This from an email to Watts from Spencer….

          “The paper is for MT, not LTbut I think we can assume that changes in one will be reflected in the other when Mears completes their analysis……”

          http://wattsupwiththat.com/2016/03/02/the-karlization-of-global-temperature-continues-this-time-rss-makes-a-massive-upwards-adjustment/

        • Kristian says:

          So how would TLT be affected differently to TMT given the above?

          I don’t know. But I do know that it would simply be stupid to now go and make the tlt product similarly ‘warmer’ as the tmt product. Because there is no physical reason why tmt should follow a trend over time lower than the tlt, which means the tmt trend up until now has definitely been too low. Now it fits with the tlt, which is a good thing. If RSS now go and spoil it all by ruining this new neat tlt-tmt match with an equal upward adjustment of the tlt product, then all the worse for them …

  37. mpainter says:

    At this instant the sandhill cranes are milling about overhead, congregating in their migration northward and making their music, calling in their peculiar tremulo call. It is an early and a warm spring. Thanks be to a beneficent Creator who gave us fossil fuels…?

  38. DougCotton says:

    All this discussion of temperature trends just fuels the fire and keeps the debate alive and the science unsettled. You Lukes who even suggest that carbon dioxide can warm the surface a bit are in effect supporting the IPCC.

    You’re implying they are right with their fictitious, fiddled fissics pertaining to “radiative forcing” and their energy budgets which treat atmospheric radiation exactly the same as solar radiation – just adding them together and using the total (less non radiative cooling) in Stefan Boltzmann calculations that are only valid for Planck functions from a single source, not a double humped conglomeration of two totally different non-overlapping Planck functions which has nothing remotely like the shape of a Planck function. How could the integral of that camel have any relationship with a Stefan Boltzmann equation based on the integral of a standard Planck function?

    The radiation from the atmosphere isn’t even full spectrum and it can in no way heat the warmer surface, but the energy diagrams imply it does, just like the Sun. And variable flux of 390W/m^2 (as it is with back radiation incorrectly included) does NOT produce as high a mean temperature (288K) as would uniform flux falling on a flat Earth without day or night.

    You can only defeat the IPCC with the correct physics. You will never understand that physics unless you spend an hour or two really studying it here. It explains all temperatures and heat transfers everywhere.

    The more that Lukes scoff at me, the more they work against what it is they hope to achieve. I DO HAVE THE CORRECT PHYSICS as you will learn sooner or later. When someone of influence (like Roy) steps down off their high haunches, discusses it with physicists (who do likewise) and consider it with open minds, then, and only then will there be progress in defeating the greatest hoax of all time.

  39. DougCotton says:

    Back in 2011 I predicted (in an archived on-line page) that the pause will continue until at least 2027. After that there will be 30 years of warming to the tune of about 0.4 to 0.8 degree, but before the end of this century about 500 years of long-term cooling (with superimposed 60 year cycles) will commence, and carbon dioxide will have nothing but a slight cooling effect as it helps rid the atmosphere of energy in, mostly, nitrogen and oxygen that hold over 98% of the energy in the atmosphere.

    But what is more relevant are the independent estimates of temperatures on Earth, under the Earth and on other planets that can be made with my 2013 hypothesis. Applying conventional statistics, the probability of the hypothesis being wrong is millions to one against.

    So, if you are a Luke, I would suggest it is not a good idea to assume I’m wrong and support the scoffing that the Alarmists will love to watch, rather like internal conflict in an opposing political party. It only defeats your purpose and you kill the goose that laid the golden egg.

    • DMZ says:

      Don’t like the idea of cleaner air?Get used to it. The energy revolution is here and the race is now on for more efficient and cheaper power storage systems,solar power generators,energy efficient building design,alternative base load power etc.etc.The Jeanie is out of the bottle and won’t be going back in with the potential for profits that is being seen by corporations and investors.Your theories are irrelevant.

      • Mack says:

        Nobody minds clean air DMZ. What we mind, here, is that CO2 is lumped in with the uncleanliness. What we mind is the AGW climate change crap heaped onto the clean ,odourless, essential trace gas. This is a climate blog, hadn’t you noticed?.

        • DMZ says:

          “clean ,odourless, essential trace gas.”

          This is a climate blog, hadnt you noticed?.

          The irony,the irony.

      • DougCotton says:

        It’s easy to get cleaner air by just reallocating all the research funds wasted on the CO2 hoax into available modern technology for the coal industry and coal fired power stations and any other companies sending soot into the air. Let economic factors determine market shares for energy companies.

      • JohnKl says:

        DMZ,

        You informed DCotton:

        “Your theories are irrelevant.”

        Indeed, theories and conjectures do not comprise science. Facts and the Laws of Nature do. So why do your theories/conjecture trump his?

        Have a great day!

          • bit chilly says:

            what energy source will be used to create those batteries and dispose of them at life end .i will give you one small clue, it won’t be solar or wind.

        • JohnKL – “Indeed, theories and conjectures do not comprise science. Facts and the Laws of Nature do.”

          Popper characterised the process as “Conjecture and Refutation”. His model of scientific progress is not universally accepted but is the most generally accepted among working scientists. He descibed falsification as the “modus tollens” logical mode of investigation – if A then B; not B; therefore not A. Conjecture, therefore, is central.

          “Laws of Nature” and arguably even “Facts” are not really science’s criterion of demarcation, as this would circularly undermine any claim by science to have found them. What science does is to explain observations in a consistent and reproducible manner that yields predictions. As David Attenborough put it when asked about his atheism, to presume that nothing can emerge that we cannot explain would be unscientific per se. There may be phenomena that cannot be reduced to laws.

          So far I am not aware of any such.

    • So what reviewed paper or experimental result separates your hypothesis from all the other perpetual motion machines which lie forgotten in the undocumented history of fringe science?

      • DougCotton says:

        Positive reviews by peers qualified in physics and having a correct understanding of entropy maximization and thermodynamics. Over 800 experimental results plus empirical evidence and a study of real world data. It might be best if you just read the 2013 paper and ask any genuine questions.

      • DougCotton says:

        And Elliott Bignell, what evidence and experimental results do you have to support the implication in IPCC, K-T and NASA energy budget diagrams that back radiation can be added to solar radiation, treated as if identical, with the total then being used in Stefan Boltzmann calculations that tell us 390W/m^2 of this conglomerate radiation with a camel of a double-humped distribution (nothing remotely like a Planck function) yields a mean temperature of 287.99K despite the fact that the solar radiation is very variable and even 390W/m^2 from a Sun half as close would only produce a mean temperature less than 4C not 14C?

        Meanwhile the back radiation, which does not penetrate the oceans anyway, would be violating the Second Law of Thermodynamics in every independent process in which there is supposedly heat from cooler regions to warmer ones helping the Sun to raise the surface temperature each morning because its own direct radiation is, on average, far too weak to do so. No “net” effects excuse this violation – as physicists know and understand.

        Footnote: Gutter tactics referring to perpetual motion (which is totally irrelevant and well known to be impossible) will get you nowhere. There’s a reward of thousands for proving me wrong, as offered on my blog so be the first to do so in the three years this has been on offer. Get all your Alarmist friends to help you, and consider spending a little less time promulgating the hoax that is costing countless lives and causing immeasurable poverty.

        • So basically you have nothing: No journal article, no reviewers, no publication number, no replicable results, no testable predictions, no experimental method… Only empty bluster. The answer, then, as to what separates your “breakthrough physics” from that underpinning every perpetual motion machine in history appears to be “nothing whatsoever”.

          Why, then, would anyone trust you to hand over the money, especially when you cannot even state with precision what would qualify as a falsification?

        • “Theres a reward of thousands for proving me wrong”

          So to whose binding arbitration do you submit in deciding any dispute?

  40. Bindidon says:

    Why does this good old Anthony Watts complain about RSS up’ing their global average temperatures?

    I remember that in July 2011 Roy Spencer communicated that something went wrong concerning the one or the other satellite, and that therefore UAH averages would become a bit higher than those of Carl Mears’ RSS corner.

    That’s life! C’est la vie.

    But I remember also that skeptic people commenting climate articles e.g. in french newspapers at that time suddenly all switched from UAH to RSS when presenting the ‘pause since 1998’ in Wood for Trees charts, because UAH wasn’t good enough anymore to to the job 🙂

    In the surface corner, some do warmer, some do cooler. Think for example of Japan’s JMA and its Tokio Climate Center: I have compared their anomalies for 1979-2015 with the satellite data, and they are just between UAH6.0beta5 / RSS and UAH5.6, far below any other surface temp provider.

    So the best is simply to build a mean of all, instead of thinking ‘the others are all wrong’.

    What a boring attitude indeed!

    • bit chilly says:

      the best would be to accept what they all are in reality. wigglenomics ,with a hat tip to physical reality.

  41. Toneb says:

    “Why does this good old Anthony Watts complain about RSS uping their global average temperatures?”

    Because you have been taken into the conspiracy by the nascent global gubmint if you adjust data upwards.

    Verboten indeed.

    It’s only “science” if you adjust down don’t you know.

  42. Hans says:

    I have been following this graph for a couple of years now. Always wonder how that ‘baseline’ of 1981-2010 averaged data is justified. Shouldn’t the line of reference be the 1980 to mid-1990 data? Or at least 1980 to 2000. If you shift the upper point you can hide any warming trend quite conveniently.

    • mpainter says:

      Be specific, Hans. Do you claim that the UAH plot above is devised so to hide a warming trend? If this is your claim, then why do you not download the data and make your own baseline?
      But you won’t because there is no conspiracy to “hide any warming trend”.

    • bit chilly says:

      the 30 year period is the period it has been determined you need to detect a climate trend apparently . it would be 1000 years for me, but it is what it is.

    • Gordon Robertson says:

      @Hans…”Always wonder how that baseline of 1981-2010 averaged data is justified”.

      It’s a heck of a lot better baseline than the biased baseline used in the surface record. They are still using a baseline of 1950 – 1990. The 50s and 60s were times of relative cooling and that biases the data to show warming.

    • Bindidon says:

      ‘Shouldnt the line of reference be the 1980 to mid-1990 data?’

      Why? What does that matter? Do you think e.g. RSS’ baseline (1979-1998) be a better choice? Baselines before 1979 anyway have no sense for trivial reasons.

      What imo is important: to avoid comparing 1901-2000 apples with 1979-1998 beans and 1981-2010 onions with 1961-1990 oranges.

      The extreme influence of the ENSO phenomenons on the lower troposphere, for example, is a fact that you can’t manage to increase or decrease just by changing an anomaly baseline.

      You must live with it, and me thinks that you don’t like to do so much…

  43. Dr. Mark H. Shapiro says:

    OMG Dr. Roy finally may have to admit that global warming is real.

    • Hans says:

      Yep, won’t be long now

    • Gordon Robertson says:

      @Mark Shapiro…”OMG Dr. Roy finally may have to admit that global warming is real”.

      Will you be back in a few months when the La Nino strikes to average out the global temps?

    • barry says:

      Dr Spencer does not doubt that global warming is real, or that the basic GH effect is well-established. He expects further warming in the future, but disagrees with the IPCC range of how much, how soon. Spencer is no crazy person.

      (I’m with the mainstream, BTW. I disagree with some of Spencer’s views. But disagreement doesn’t have to be disagreeable)

  44. Norman says:

    NormansTutor

    Mr. Tutor.

    When you were linked to this thermodynamics text book Chapter 10
    you obviously chose not to read anything and then post a comment about it. NormansTutor needs a real tutor to educate him.

    http://web.mit.edu/lienhard/www/ahttv131.pdf

    To make it easy for Tutor scroll down to Chapter 10 and look at page 560.

    They discuss effects of multiple surfaces on one surface. Note the quote! “the irradiating heat transfer on surface i, is the SUM (my emphasis) of radiations reaching i from all other surfaces, including itself”

    NormansTutor it is time for you to learn REAL physics. Read and learn and learn you are wrong and have been wrong a long time and will continue to be wrong until you open your eyes and learn what you have never before learned.

  45. Bindidon says:

    Some people are so busy with shouting against warming that they even don’t understand the mostly historical reason which led to the choice of a given baseline.

    NOAA has 1901-2000; GISS 1951-1980; HadCRUT 1961-1990; JMA 1971-2000.

    That has nothing to do with a seek for “warmed results”.

    When comparing all them, the anomaly sets are anyway recomputed wrt to a common baseline: otherwise the comparison would become meaningless.

    And a look at several series equally baselined (here: 1981-2010) reveals, for e.g. the period 1979-2015, how similar they are in reality: they land in a nutshell with a trend difference of about 0.4 C / century.

    http://www.directupload.net/file/d/4288/jwu22nb5_pdf.htm

    • sorry this was originally deleted…don’t know how that happened.

      • Bindidon says:

        Many thanks!

      • Bindidon says:

        Maybe Roy Spencer finds some little time to explain a ‘detail’ concerning the comparison of time series as made in

        http://www.directupload.net/file/d/4288/jwu22nb5_pdf.htm

        It was a nice experience for me unexperienced guy to collect all that data, to adjust them to a common baseline and then plot the results, with the use of no more than good ol’ Excel (solely JMA was a bit more work due to their 5×5 gridded data).

        But has a fair comparison level been reached so far?

        I thought before doing: certainly not, and reading, in BEST’s data, these laconic lines

        % Estimated Jan 1951-Dec 1980 global mean temperature (C)
        % Using air temperature above sea ice: 14.762 +/- 0.049
        % Using water temperature below sea ice: 15.299 +/- 0.049

        gives one a clear hint not only about BESTs accuracy at work.

        I intuitively feel some need not only for a common baseline but for a common absolute temperature standard, e.g. 290 K.

        Shouldn’t it be a goal for all institutions busy in temperature measurement – despite their different approaches and motivations – to speak in a hopefully near future a rather common language, based e.g. on a satisfying proposal made by the WMO?