
 Home/Blog
It’s been about eight months since I’ve updated the SSM/I- and SSMIS-based satellite estimates of the RSS ocean products (vapor, clouds, rain, and surface wind speed). Given the record warm tropospheric temperatures in February, and the likely role of El Nino in that, I thought it would be interesting to see if (for example) there was a big increase in rain activity, which is how the troposphere can warm so rapidly…through the latent heating of the air as heat is transferred from the ocean surface to the atmosphere.
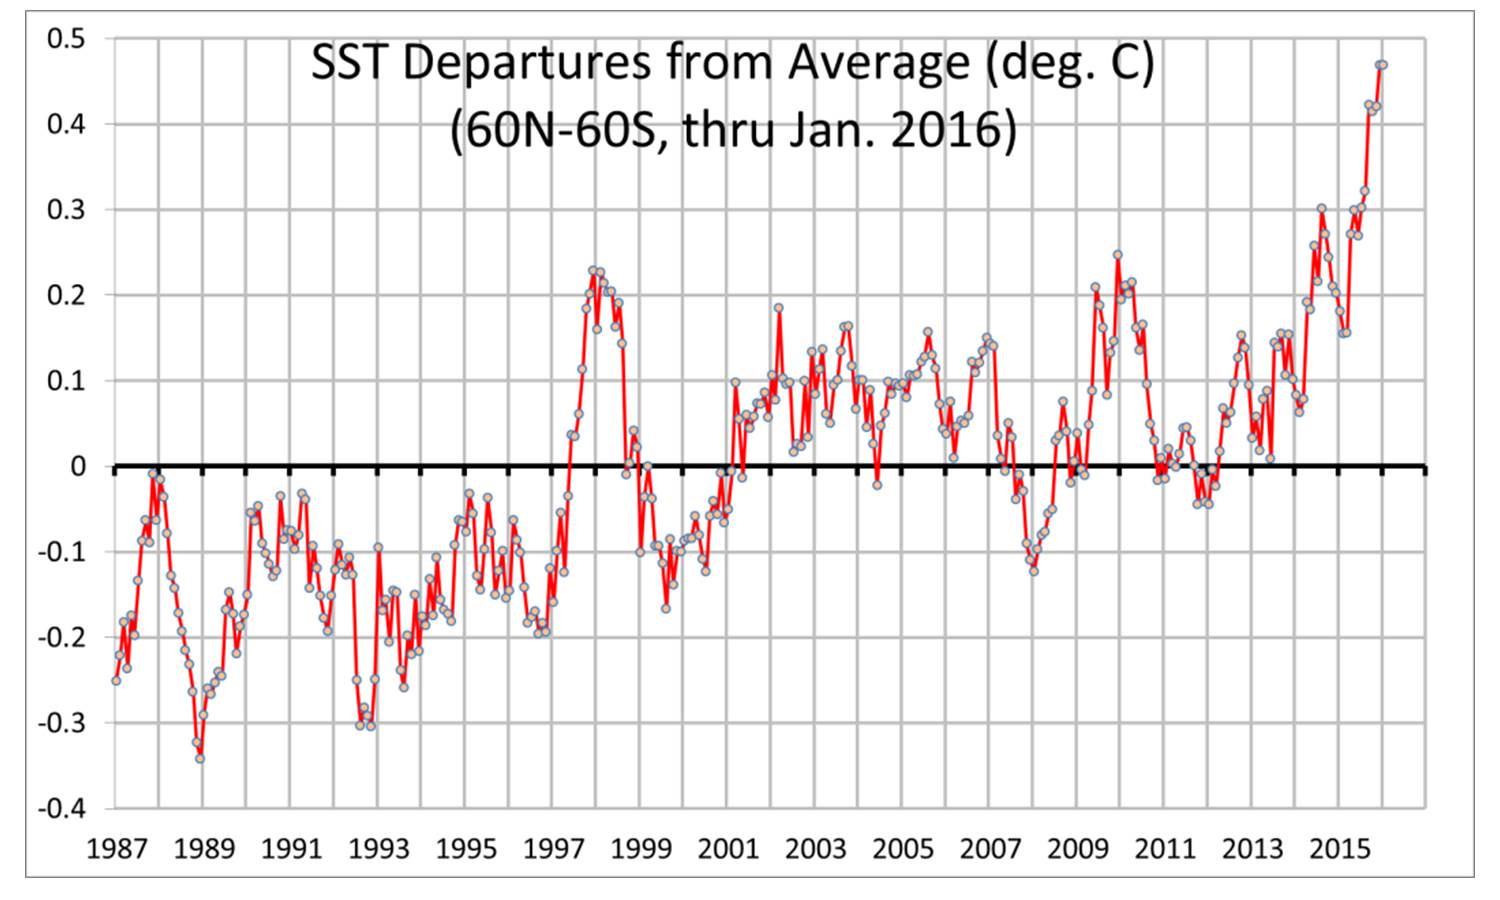
By way of background, here are the monthly HadSST3 sea surface temperature anomalies (thru January). The anomalies are calculated over the same period that we have SSM/I data (since July, 1987), and they indicate record-warmth in the global ocean average (60N to 60S):
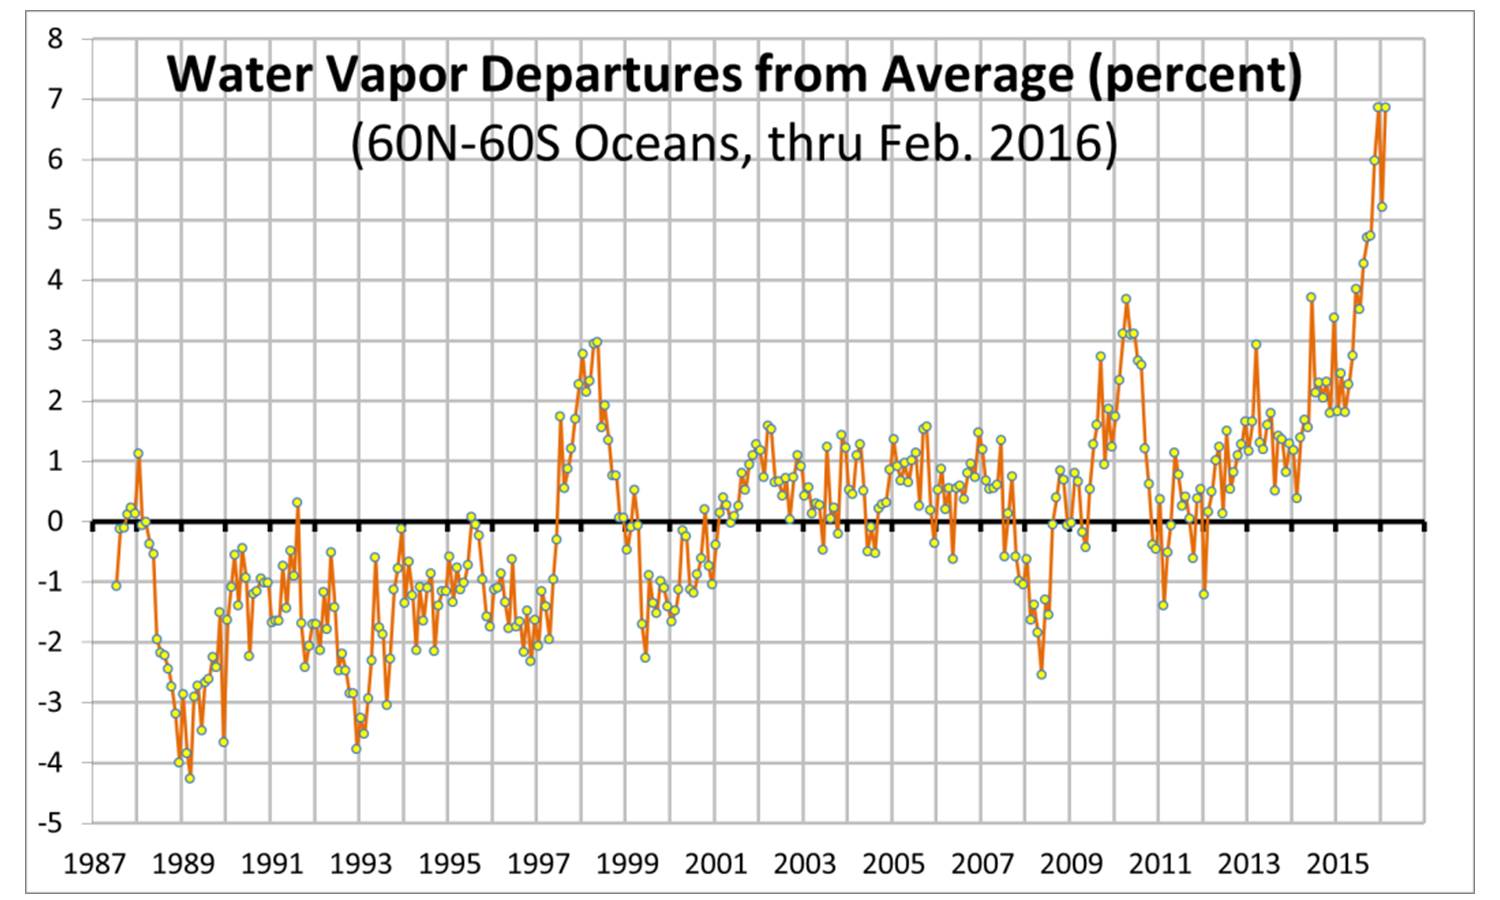
The SSMIS vertically integrated water vapor anomalies, which are dominated by boundary layer vapor and are tightly coupled to SST variations, mirror the SST anomalies with record high vapor amounts in December and February:
When the anomalies are computed at the gridpoint level, we see that most of the “action” is occurring in the central tropical Pacific, consistent with the mature El Nino conditions (I’ve included Feb. 1998 for comparison):
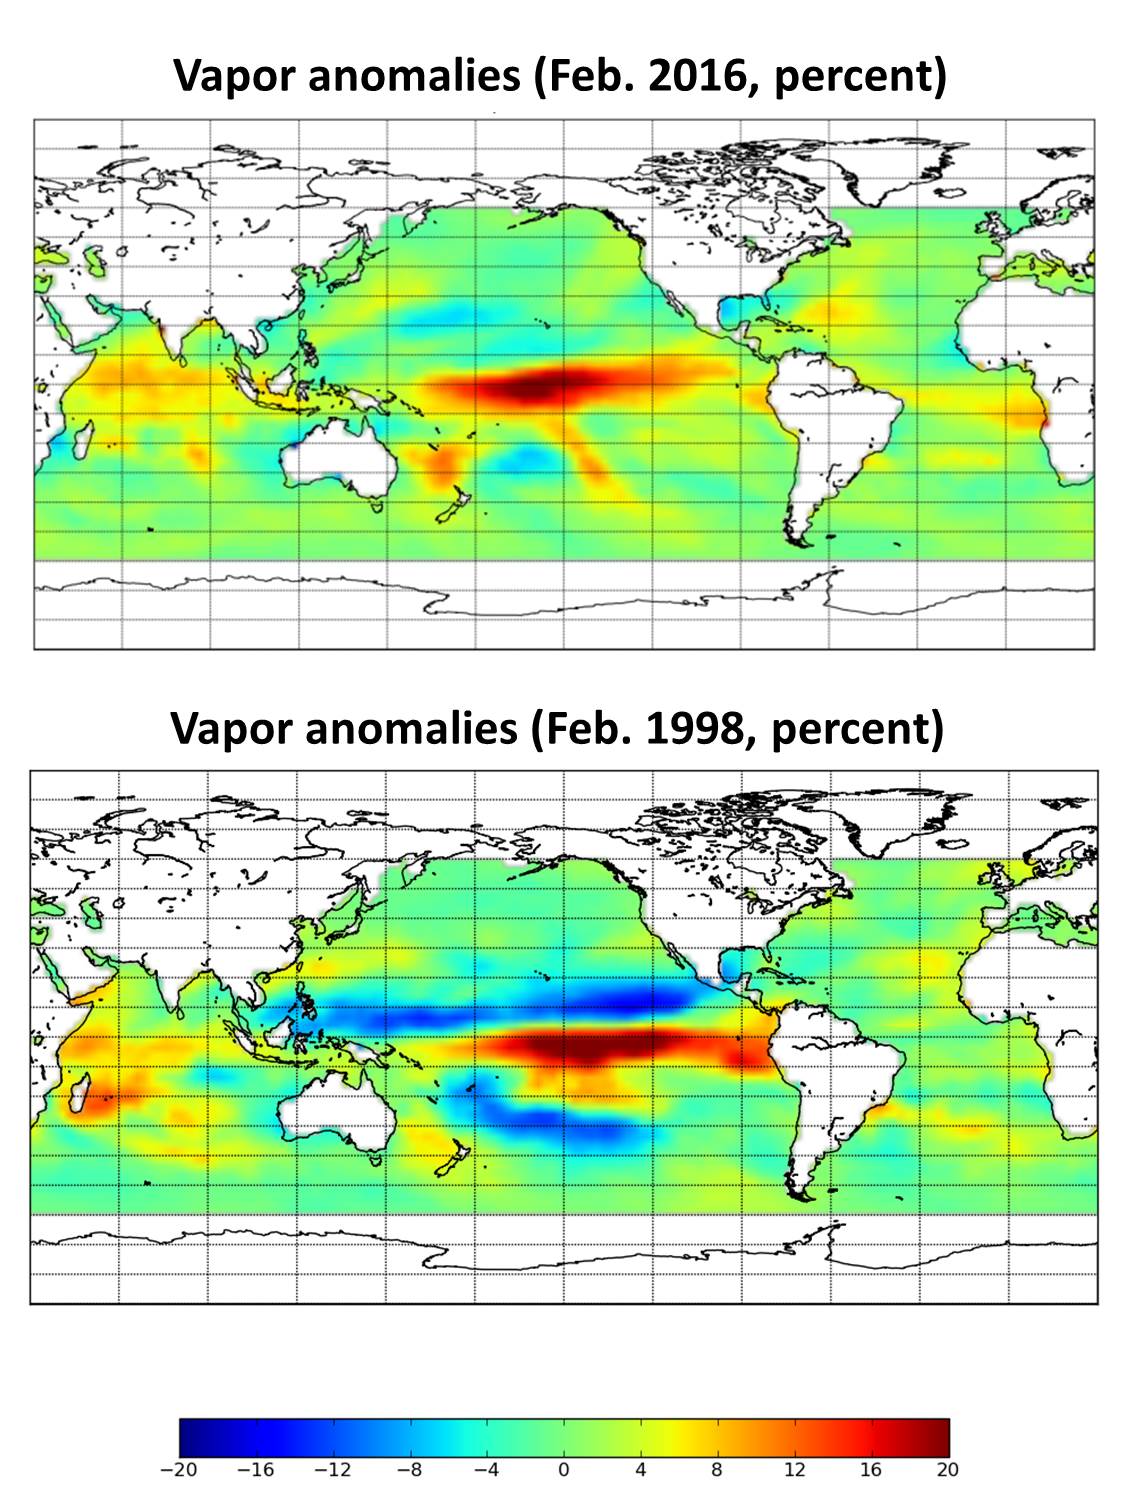
Note that the current El Nino does not seem to have the ring of depressed water vapor values around the region where the enhanced rainfall activity occurs in the high-vapor zone that was seen in 1998. That depression in 1998 was likely due to subsiding air driven by the convection pushing the top of the humid boundary layer downward, making a thinner layer of moist air. I have no explanation for this difference between the two El Ninos.
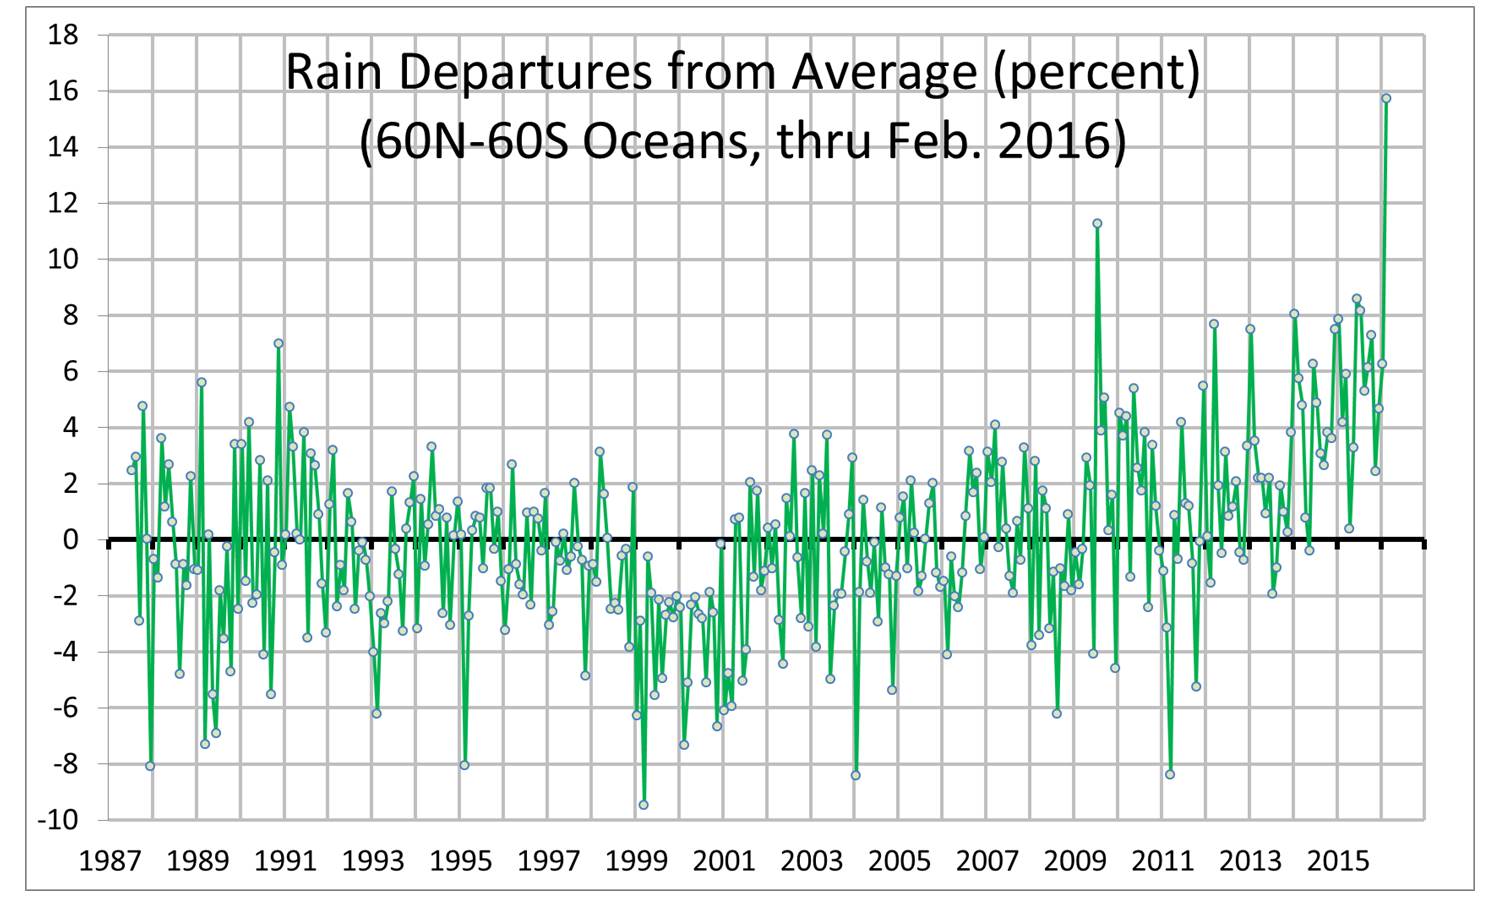
What is exceptional is the rainfall anomaly in February, with a global ocean anomaly of almost 16% above the 29-year average:
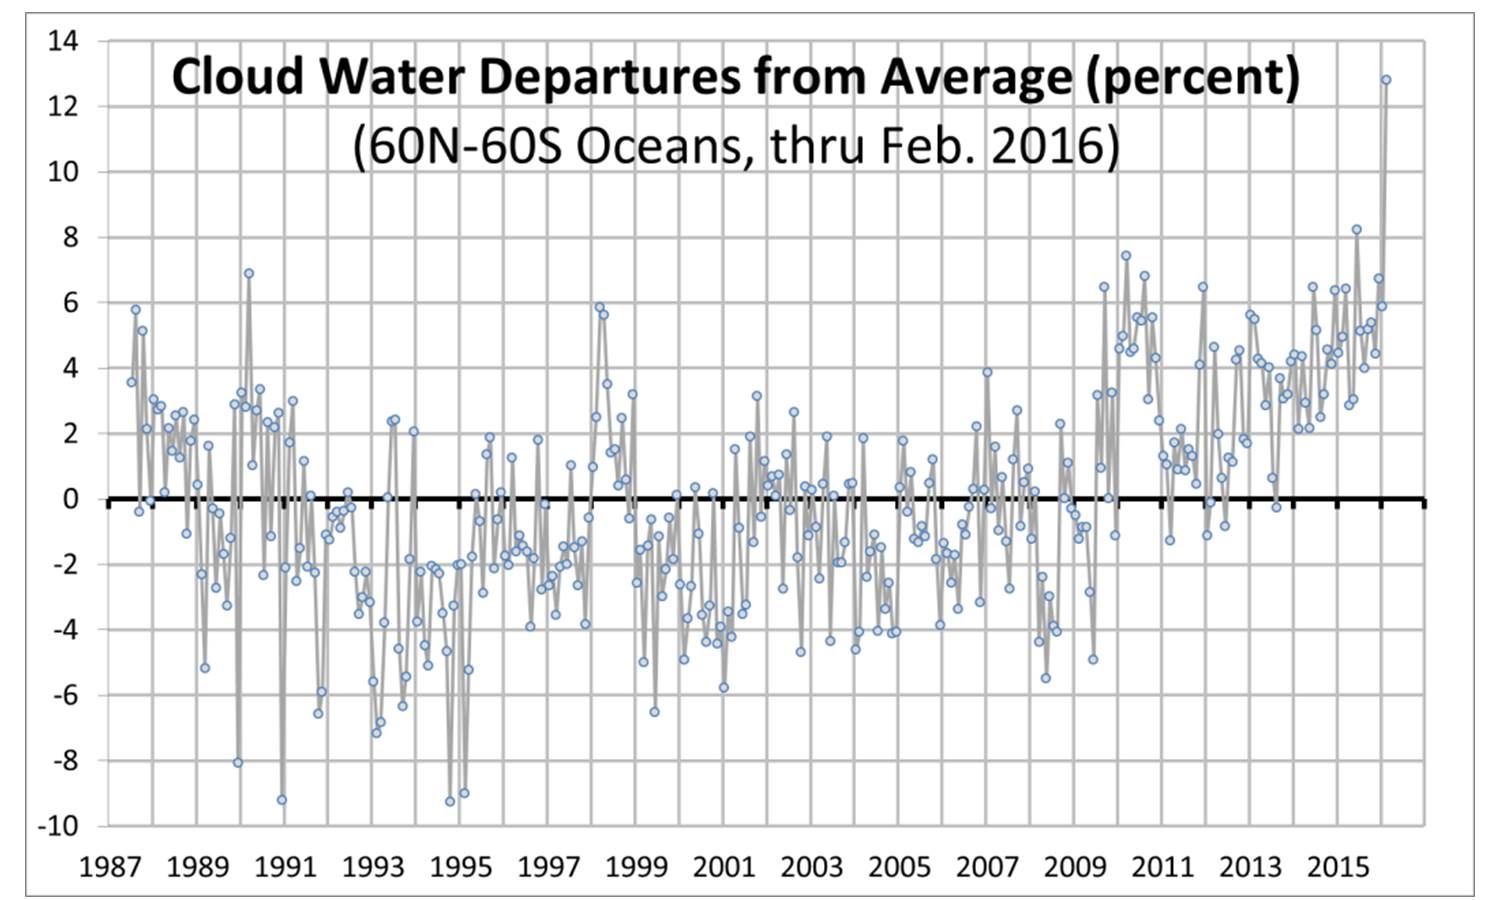
The total cloud water anomaly for February was also at a record high, at 13% above average:
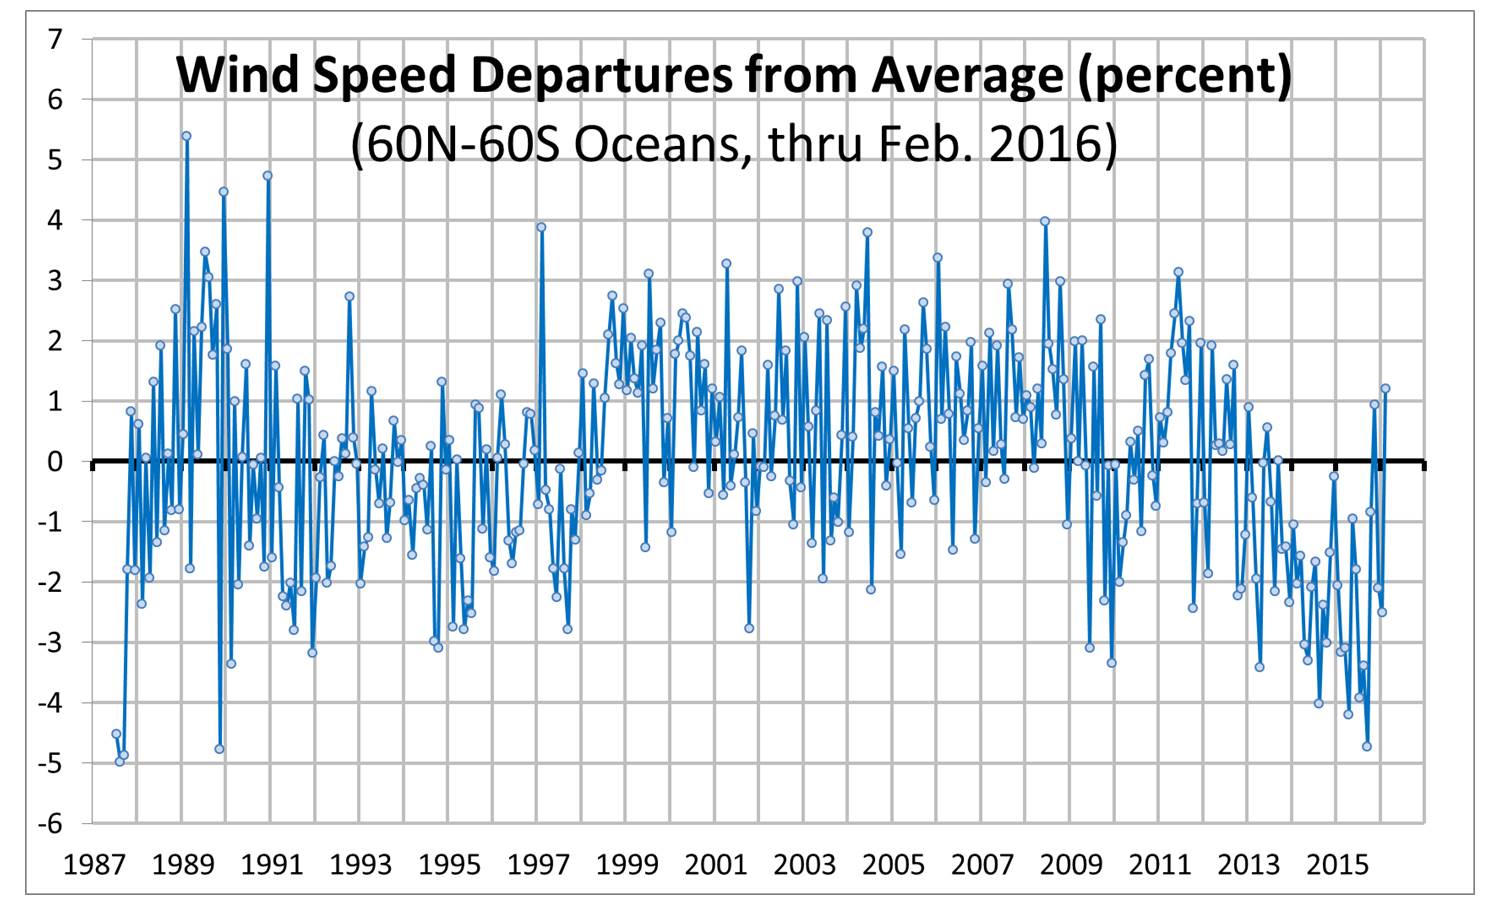
Finally, the ocean surface wind speeds from SSMIS are seen to be recovering in the last few months…they are typically low during El Nino…supporting the view that El Nino is beginning to weaken:
I will remind folks that I still think there are problems with the SSMIS water vapor, as it is increasing considerably faster than expected based upon a 7% increase per degree of SST increase. I believe this is due to assumptions in the water vapor retrieval algorithm. The retrieval assumes a vertical water vapor profile shape, and if that shape has changed, it can bias the retrieval. I believe RSS also assumes a climatological average SST field in the retrieval, which might also affect the results.
So, it seems that much of the exceptional tropospheric warmth in February was driven by a rather spectacular “burp” of convective energy released by storms into the troposphere.


