UAH Global Temperature Update for October 2016: +0.41 deg. C

November 1st, 2016 by Roy W. Spencer, Ph. D.

October Temperature Down a Little from September

NOTE: This is the nineteenth monthly update with our new Version 6.0 dataset. Differences versus the old Version 5.6 dataset are discussed here. Note we are now at “beta5” for Version 6, and the paper describing the methodology has just been accepted for publication.

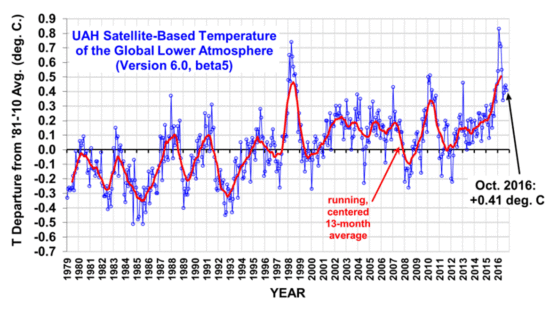
The Version 6.0 global average lower tropospheric temperature (LT) anomaly for October 2016 is +0.41 deg. C, down a little from the September value of +0.44 deg. C (click for full size version):

uah_lt_1979_thru_october_2016_v6

The global, hemispheric, and tropical LT anomalies from the 30-year (1981-2010) average for the last 22 months are:

YEAR MO GLOBE NHEM. SHEM. TROPICS
2015 01 +0.30 +0.44 +0.15 +0.13
2015 02 +0.19 +0.34 +0.04 -0.07
2015 03 +0.18 +0.28 +0.07 +0.04
2015 04 +0.09 +0.19 -0.01 +0.08
2015 05 +0.27 +0.34 +0.20 +0.27
2015 06 +0.31 +0.38 +0.25 +0.46
2015 07 +0.16 +0.29 +0.03 +0.48
2015 08 +0.25 +0.20 +0.30 +0.53
2015 09 +0.23 +0.30 +0.16 +0.55
2015 10 +0.41 +0.63 +0.20 +0.53
2015 11 +0.33 +0.44 +0.22 +0.52
2015 12 +0.45 +0.53 +0.37 +0.61
2016 01 +0.54 +0.69 +0.39 +0.84
2016 02 +0.83 +1.17 +0.50 +0.99
2016 03 +0.73 +0.94 +0.52 +1.09
2016 04 +0.71 +0.85 +0.58 +0.94
2016 05 +0.55 +0.65 +0.44 +0.72
2016 06 +0.34 +0.51 +0.17 +0.38
2016 07 +0.39 +0.48 +0.30 +0.48
2016 08 +0.43 +0.55 +0.32 +0.50
2016 09 +0.44 +0.50 +0.39 +0.37
2016 10 +0.41 +0.42 +0.39 +0.46

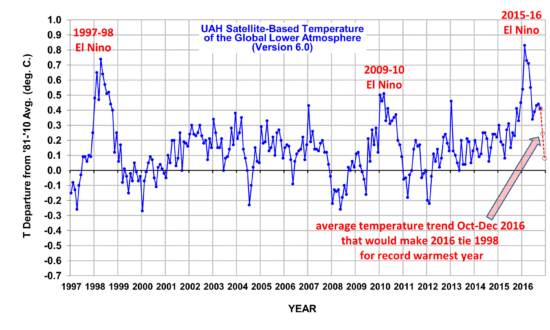
To see how we are now progressing toward a record warm year in the satellite data, the following chart shows the average rate of cooling for the rest of 2016 that would be required to tie 1998 as warmest year in the 38-year satellite record:

uah-v6-lt-with-2016-projection

Based upon this chart, it would require strong cooling for the next two months to avoid 2016 being a new record-warm year (since the satellite record began in 1979) in the UAH dataset.

The “official” UAH global image for October, 2016 should be available in the next several days here.

The new Version 6 files (use the ones labeled “beta5”) should be updated soon, and are located here:

Lower Troposphere: http://vortex.nsstc.uah.edu/data/msu/v6.0beta/tlt/uahncdc_lt_6.0beta5.txt
Mid-Troposphere: http://vortex.nsstc.uah.edu/data/msu/v6.0beta/tmt/uahncdc_mt_6.0beta5.txt
Tropopause: http://vortex.nsstc.uah.edu/data/msu/v6.0beta/ttp/uahncdc_tp_6.0beta5.txt
Lower Stratosphere: http://vortex.nsstc.uah.edu/data/msu/v6.0beta/tls/uahncdc_ls_6.0beta5.txt


626 Responses to “UAH Global Temperature Update for October 2016: +0.41 deg. C”

Toggle Trackbacks

  1. barry says:

    Quick again with the monthly update. La Nina hasn’t materialized, and a record warm year looks very likely now.

  2. skeptikal says:

    It’s starting to look like we’ll get a new record-warm year… but two months is a long time and anything is possible.

  3. barry says:

    the paper describing the methodology has just been accepted for publication

    Congratulations.

    • David Appell says:

      But Karl et al Science 2015 didn’t publish their numbers until their paper was accepted and published.

      UAH has been publishing non-peer reviewed, nonpublished v6 numbers for 19 months. That’s not standard scientific practice.

      Also, UAH’s changes were huge — about three times higher than Karl et al’s. I wonder what changes will happen in v7.

      • John Robert says:

        “UAH has been publishing non-peer reviewed, nonpublished v6 numbers for 19 months. That’s not standard scientific practice.”

        Doesn’t mean it’s a bad thing. The Internet is changing the hegemony/monopoly of scientific journals. Get used to it.

        • Toneb says:

          “The Internet is changing the hegemony/monopoly of scientific journals. Get used to it.”

          The internet has changed many things.
          It doesn’t mean that that is all good.

          There has to to be a certain standard of things.
          The Internet has created a democracy in knowledge but what of those people who do not have the knowledge (nor even common-sense) to discriminate good from bad?
          Not to say those that do not even want to?
          But just use any and all Internet acquired *knowledge* to confirm their bias.
          And along the way talk to like-minded people on Blogs, and in so doing further entrench their bias, whilst also gaining the false impression that their numbers are meaningful.

          Taken to the ridiculous, how about we give equal credibility to psychic surgeons, because we can see them on the internet and they maintain that they can expung your cancer.
          No peer-reviewed journals there.
          But plenty of people wanting to believe.
          Standards my friend.

          Idea: How about we drag people in of the streets and ask them to review science?
          No expert knowledge of the subject required.
          Now that’ll inprove things enormously.
          FFS

        • David Appell says:

          John Robert says:
          “The Internet is changing the hegemony/monopoly of scientific journals.”

          No it isn’t. Whatever gave you that idea?

          Peer review, at a minimum, is still important.

          • AndyG55 says:

            You have ZERO idea what climate science peer-review is for, do you, rotten-appell.

            Its a journalistic gatekeeper mechanism, to protect the AGW scammers from real competent scientists.

      • Gordon Robertson says:

        David Appell…”UAH has been publishing non-peer reviewed, nonpublished v6 numbers for 19 months”.

        What has peer-review got to do with the scientific method? It’s not a requirement. PR was put into practice only to prevent laymen from publishing in scientific journals. Due to the nature of PR, where a journal editor farms out to an unknown reviewer to solely determine the merit of a paper, it is essentially useless as a measure of scientific worth.

        Today, in climate science, PR is used to prevent skeptics from publishing in scientific journals. It’s also a tool used by effete snobs who are alarmists to discredit skeptical claims.

        • michael hart says:

          He’s just seemingly very ungrateful that Dr Spencer is willing to publish his data as it produced. Why he’s so ungrateful, I’m not entirely sure, though I have my suspicions. Many other scientists do the same thing at various US government-funded agencies but David Appell doesn’t seem to hate them in quite the same way, if at all.

  4. ren says:

    La Nina will develop during the winter months, as usual.
    http://www.tropicaltidbits.com/analysis/ocean/nino34.png

  5. Tim Wells says:

    Its been unseasonably warm in the Uk, 22 C in Swansea yesterday. However temperatures are starting to drop considerably. Another year like 2010 in the UK and temperatures could be reversed very quickly.

  6. RW says:

    Thanks for the report, Roy.

  7. Slipstick says:

    A side observation, global sea ice is now at its lowest extent for this time of year in the satellite mapping record; this is consistent with the reported temperature anomaly.

    • RAH says:

      Considering that a considerable portion of the anomalous warmth reflected in global temps is in the Arctic region that is what one would expect.
      http://ocean.dmi.dk/arctic/meant80n.uk.php

      This truck driver doesn’t like it. A pattern like that seems to almost always mean winter driving conditions in the north east and east central US where I drive most are going to be miserable. Look out for heavy lake effect this year. I guess the ski resorts in the NE will be happy though.

      • Slipstick says:

        Given the instability over the last few years, I’ve pretty much given up extrapolating from past patterns.

      • Slipstick says:

        Actually, the value for the tropics this past month is higher than that of both the northern and southern hemispheres.

  8. ren says:

    Dr. Spencer,
    Thank you for honest science. I think that this winter could be attacks on real scientists.

    • David Appell says:

      Of course, there have been attacks on many real scientists for over a decade.

      • David Appell says:

        Correction: Make that at least two decades, going back to Ben Santer.

        • jim says:

          You mean like exposing Mann’s fraud?
          Or the guy that wanted to get rid of the Medieval warm period?
          Or the ones that “hid the decline’ because it negated much of their warming evidence?

          Or the ones that kept quiet about the above frauds?
          thanks
          JK

          • David Appell says:

            “You mean like exposing Manns fraud?”

            What fraud?

          • David Appell says:

            jim wrote:
            “Or the ones that hid the decline because it negated much of their warming evidence?”

            Jim, what do you think “hide the decline” meant? Decline in what?

          • SkepticGoneWild says:

            OMG if you are THAT uninformed on “hide the decline”, head on over to Climate Audit.

          • barry says:

            Do they know at climate audit that “hiding the decline” was not Mike Mann’s “trick?”

          • Gordon Robertson says:

            David Appell…”You mean like exposing Manns fraud?

            What fraud?”

            Talk about denial.

          • Gordon Robertson says:

            David Appell…”Jim, what do you think hide the decline meant? Decline in what?”

            It’s a reference to the declining temperatures in tree ring proxies on the hockey stick when the real world temperatures were increasing.

          • wert says:

            Its a reference

            to grafting an instrumental record on top of the truncated tree ring proxy to make a frawdulent claims on past temperatures.

          • Toneb says:

            “Its a reference

            to grafting an instrumental record on top of the truncated tree ring proxy to make a frawdulent claims on past temperatures.”

            Fail:

            It was for a presentation slide only. NOT for a paper.
            It was merely correcting the well know divergence problem of temperatures reconstructed from the latewood densities or, in some cases, widths of tree rings in the far northern forests…..

            “While the thermometer records indicate a substantial warming trend, many tree rings from such sites do not display a corresponding change in their maximum latewood density. In some studies this issue has also been found with tree ring width.[2] A temperature trend extracted from tree rings alone would not show any substantial warming. The temperature graphs calculated in these two ways thus “diverge” from one another since the 1950s, which is the origin of the term.”

            https://en.wikipedia.org/wiki/Divergence_problem

            https://www.youtube.com/watch?v=7nnVQ2fROOg

          • barry says:

            It’s odd to see skeptics implying the tree-ring proxies should be more accurate than thermometer temps and satellite temps.

            The divergence problem is not hidden at all. It’s discussed in the literature and in the IPCC reports.

          • Greg says:

            Toneb Fail : don’t think you will get an honest account of anything controversial from WonkyPedia.

            “Hide the decline” ™ was Phil Jones’ words describing when he used “Mike’s Nature trick” ™ to crop of the inconvenient part of Briffa’s data which showed that tree rings were not a reliable temperature proxy. This was done for the cover image of the Y2K WMO report and was used extensively by the IPCC which was fraudulently pretending that it only used PR sources.

            “Mike’s Nature trick” was done in a PR paper in: Nature.

            Mann silently cropped off the inconvenient data and replaced it with the temperature record. Jones went one better on the fraud scale by using the same line colour for the two datasets giving the impression it was all Briffa’s data.

            That was a clear case of scientific fraud.

          • Toneb says:

            “to crop of the inconvenient part of Briffas data which showed that tree rings were not a reliable temperature proxy. This was done for the cover image of the Y2K WMO report and was used extensively by the IPCC which was fraudulently pretending that it only used PR sources.”

            In Briffa’s tree ring data, some of the data sets show a decline in tree ring width and/or density after 1960, and hence are not a good proxy for temperature after that. There is no reason to think they are not good proxies for temperature prior to 1960.

            The data from MBH, does NOT come just from tree rings but from a variety of proxies. Further, the tree rings used in MBH 99 do not show any decline after 1960. In other words, there was no decline to hide in MBH 99. “Hide the decline” has nothing to do with MBH 99 except that MBH’s results have been published alongside Briffa’s results in some publications. Some denier’s have, of course, deliberately fostered the confusion which you are exhibiting.

            The graph prepared by Phil Jones for the WMO “Statement on the Status of the Global Climate in 1999”, had a caption inside the describing it as ….

            “Northern Hemisphere temperatures were reconstructed for the past 1000 years (up to 1999) using palaeoclimatic records (tree rings, corals, ice cores, lake sediments, etc.), along with historical and long instrumental records”.

            Here is the graph in TAR sec6….

            http://www.ipcc.ch/ipccreports/tar/vol4/english/pdf/wg1spm.pdf

            Instrumental data at the end clearly labelled.
            In Chapter 2 of the full Working Group I report, Figure 2.20 (IPCC 2001, p 134) indicates in the caption that the instrumental data is in red. In Figure 2.21 of the same report (IPCC 2001, p 134), the instrumental data is in a distinct colour, identified in the legend and in the caption.

            So, very plainly your accusation that scientific data has been used to mislead is misplaced. The “misleading” here is purely a function of your own confusion on the issue, and the deliberate fostering of that confusion by leading deniers -Notably McKitrick at ClimateAudit.
            I say again that it is not a peer-reviewed paper that you a carping about.

      • AndyG55 says:

        Yes, you have done so..

        Got those pics of the birds killed by coal fired power stations yet?

        • AndyG55 says:

          See how the rotten-appell just ignores producing any real proof of anything !

          RUN and HIDE, appell-worm

        • Greg says:

          I have some good pictures of miners killed by coal-fired generation if that will do. Don’t know about birds, apart from canaries.

  9. ray says:

    ren says:

    “La Nina will develop…”

    The Climate Prediction Center of the National Oceanic and Atmospheric Administration is a little less definite:

    “La Nina is favoured to develop (~70% chance) during the Northern Hemisphere fall 2016 and slightly favoured to persist (~55% chance) during winter 2016-17.”

    (October 31st 2016)

    http://www.cpc.ncep.noaa.gov/products/analysis_monitoring/lanina/enso_evolution-status-fcsts-web.pdf

  10. Steven Fraser says:

    Thanks for the update, and congrats on the upcoming publication.

    A nit in the chart… Probabably meant 2016, not 2017 for October.

    Regards

  11. Werner Brozek says:

    It is rather puzzling. Despite falling ENSO numbers all year, the last 4 months have been at least 0.05 above the June anomaly.

    • Nate says:

      May be due to the Blob in n. pacific

      • David Appell says:

        Or it could be, you know, that the planet continues to accumulate heat from atmospheric greenhouse gases.

        • AndyG55 says:

          Would be a first.

          No sign of that anywhere at all.

          Just ocean cooling events, discharging heat into the atmosphere

        • tonyM says:

          For a well mixed, gas your CO2 heat accumulator certainly gave my neck of the woods a wide berth. September was the coldest in over 120 years; October the coldest in 11 years.

        • You mean the Co2 that only accounts for 0.04% of the atmosphere! Sure!

          • That makes total sense David

          • There are 3 molecules of Ozone to 10 million molecules of air…and yet life on earth would struggle without it.

          • And…… Your point is?

          • Toneb says:

            “You mean the Co2 that only accounts for 0.04% of the atmosphere! Sure!”

            “There are 3 molecules of Ozone to 10 million molecules of airand yet life on earth would struggle without it.”

            “And Your point is?”

            Michael made it before I could.
            And, err, it’s ….
            That a substance is present in small quantities does not preclude it’s importance.
            That is the case with atmospheric O3 and CO2.

            Now when we consider that CO2 has been raised by mankind from 0.028 to 0.04%, it’s doing what it does 1.4x greater.

          • You say: Now when we consider that CO2 has been raised by mankind from 0.028 to 0.04%, its doing what it does 1.4x greater.

            I don’t think so. Look at historical graphs of changes in co2 over millions of years and you’ll see that there have been much greater fluctuations in co2 then there were today

          • “That a substance is present in small quantities does not preclude its importance.
            That is the case with atmospheric O3 and CO2.”

            Oh really? So if i was to take a shit in my bathroom the size of an ant that makes up less then 0.1 % of the bathroom 30% of the bathroom is still going to smell like shit?

          • Even a two year old knows that’s not true

          • Toneb says:

            “I dont think so. Look at historical graphs of changes in co2 over millions of years and youll see that there have been much greater fluctuations in co2 then there were today”

            Ah, goalpost shifting. Of course.
            I said “mankind” increased it by 40%.
            No humans around “millions of years” ago.
            So natural changes occurred to do that then.
            Yes
            What did it then were orbital changes causing global temperatures to rise and atmospheric CO2 followed.
            See, not so hard eh?

            “Even a two year old knows thats not true”

            Nah, most 2 year olds have more common sense than that.

            Oh, and never mind smelly shit.
            Try drinking a 0.04% concentration of diluted cyanide my friend.
            I think you’ll find that big consequences can follow small effects.

          • “Ah, goalpost shifting. Of course.
            I said mankind increased it by 40%.
            No humans around millions of years ago.
            So natural changes occurred to do that then.
            Yes
            What did it then were orbital changes causing global temperatures to rise and atmospheric CO2 followed.
            See, not so hard eh?”

            Of course not! all you have to do is look at past Ice core data and you’ll see that the actual opposite occurs!

          • “Oh, and never mind smelly shit.
            Try drinking a 0.04% concentration of diluted cyanide my friend.
            I think youll find that big consequences can follow small effects.”

            Says who? 97% of the the worlds chemists? lmao! Link please

          • so you just answered your own question! If co2 does follow temp caused by the earths orbit then how in the world will it be the primary driver in temperature changes? Affect causes the causes to happen. I don’t think so. Clearly co2 isn’t even close to being the main driver of climate change

          • What did it then were orbital changes causing global temperatures to rise and atmospheric CO2 followed.

            Try watching evan svensmark “the cloud mystery” then come back and tell me if the earths orbit was the main driver of climate change!

          • Toneb says:

            “Of course not! all you have to do is look at past Ice core data and youll see that the actual opposite occurs!”

            It doesn’t actually. The carbon cycle works the way I stated. The only way CO2 would have come first in the ice core data is if added outside of the CC – say a meteor strike or massive volcanic eruptions.
            BUT
            Thanks for confirming that CO2 is a GHG and therefore the GHE can drive global temp when added above the natural carbon cycle quantity.

            “Says who? 97% of the the worlds chemists? lmao! Link please”

            Ah, another Flynn (and some dear departed here) Sky-dragon slayer.

            I’m not doing your studying for you. If you wish to learn ( Sky-dragon slayers by definition don’t) then do it yourself. You could start with the work of Tyndall some 150 years ago followed up by Arrenhius.
            Empirical science my friend and not up for argument.
            If it didn’t do what it does the Earth would freeze.

          • “Thanks for confirming that CO2 is a GHG and therefore the GHE can drive global temp when added above the natural carbon cycle quantity.”

            Cherry picking are we? Only two can play at that game! I never said co2 wasn’t a greenhouse gas nor did I say it drives global warming when added to the atmosphere. Thanks for putting words in my mouth. What I said was that co2 is not the MAIN driver of climate change. It is one of the many drivers that drive the global temperature therefore it is not detectable. Until you provide me a link that supports your claim you cannot say that lint in water or whatever it is can have a huge affect on your body! I will provide a link proving my eveidence and I encourage you to do the same as well. If you cannot do this have no right to talk and start making false absurd claims

          • Toneb says:

            “Try watching evan svensmark the cloud mystery then come back and tell me if the earths orbit was the main driver of climate change”

            Hey, Mr Sky-dragon slayer.
            You are obviously not aware that solar insulation can vary by over 100 W/m2 at 65 deg N over the course of the Earth’s orbital changes.
            You do know how much that is?
            And what it means when most of the world’s land mass straddles that latitude … and therefore the most ice-sheet during glaciation?

            Ah well – just another little something for you to study.

            Oh, and one unproven theory does not gainsay 150 years of empirical science (correlation and causation).
            Also studies done at CERN, showed that aerosols produced by cosmic rays were much to small to allow for condensation.

            Aside from that CR’s follow the inverse of the Sun’s magnetic field strength (proxy sunspots).
            Which cycles up/down over the average length of the SS cycle (11 years).
            And with which there is no correlation with global mean temp.

          • All talk no proof! Wow! You globull warming alarmists are just as dumb as the next!

          • “Also studies done at CERN, showed that aerosols produced by cosmic rays were much to small to allow for condensation.”

            How do you think clouds form nitwit?!

          • Toneb says:

            “All talk no proof! Wow! You globull warming alarmists are just as dumb as the next!”

            Mr Sky-dragon slayer:
            If you want to remain ignorant all your life then be my guest.
            What people generally do to learn things is to put themselves out a tad and go hunt for answers.
            That involves inhabiting places that don’t just confirm your ideological bias.
            Contrarian blogs are such places….. well no if you didn’t have a closed mind you could look at the (97%) of the science that blows your bias out of the water, and is linked to by those of use that don’t inhabit the rabbit-hole.
            In the case of the GHE, the science is 150 years old, and which our host is certain of.

            The day that hand-waving a la Flynn dominates mankind’s thinking, I actually find more frightening than any consequences of AGW.
            One only has to look to the Middle East to view that.
            In my world you don’t get to overturn logic and insist snow is black just because of your warped view of reality.
            Ignorance should always be denied.

          • And if you want to continue to believe in Pseodo science driven by paid off shills then you be my guest as well mr. Dragon slayer. Anyways I’m done wasting my precious time arguing over the facts with people like you who just can’t seem to get a grip on reality! Peace!

          • Another link to prove you wrong once again. Here I go doing all the work for you

          • I already found some links on your stupid cyanide claim! Have you ever tried drinking cynanide yourself? No! Because those bafoon scientists told you not too because it can have a real bad affect on your body! You can’t just assume something is true unless you test it out yourself! That’s what a real scientists does! Have fun having egg all over your face 5 years from now dragon slayaaaa boy!

          • The least you could have done was actually provide a link that I already found for you as fake and absurd as it is. I did that! You didn’t even do that. Now you just made your self look a billion times worse. Have a nice day dragon dude!

          • Gordon Robertson says:

            Toneb…”You mean the Co2 that only accounts for 0.04% of the atmosphere! Sure!

            There are 3 molecules of Ozone to 10 million molecules of airand yet life on earth would struggle without it.”

            Without ozone we might have a few more cases of skins cancer in people who insisted on sun-bathing all day in a northern Australian summer. I hardly think life would struggle without it.

            Furthermore, you have not address the question of CO2 at 0.04% being responsible for 9% to 25% of warming, according to climate modelers. They obviously picked that number out of a hat.

          • Toneb says:

            “I hardly think life would struggle without it.”

            http://science.howstuffworks.com/science-vs-myth/what-if/what-if-ozone-layer-disappeared.htm

            “Within days of the ozone layer’s disappearance, many plants would die. The intensity of the sun’s radiation would make photosynthesis a process by which plants convert light energy into chemical energy to fuel their growth an impossibility for all but the largest and slowest-growing florae. And even these holdouts, primarily massive trees, would eventually die, too. Without plants, the food chain would collapse. Herbivores would starve. Omnivores and carnivores could feed off their bodies for a time, but their food supply would dwindle and cause widespread extinction”

          • Toneb says:

            “I already found some links on your stupid cyanide claim!”

            http://chemsee.com/poison-detection/poison-detection-resources/cyanide-poisoning/

            “Post mortem analysis of blood of poisoned people shows that concentrations of about 3 micrograms cyanide per ml were sufficient to kill the person. Incorporation of cyanide, mainly HCN, via the breathing, is a lot more rapid than via ingestion. A person will die instantly if the HCN concentration is above 270 ppm, (Parts per million), and after 10 and 30 minutes respectively if the HCN concentrations are respectively 180 and 130 ppm.”

          • Let me ask you something mr tone b? Did you even Bother to look at any of the links I sent you? Or even watch the video on Murray salby who knows a hell of a lot more about the science of the greenhouse affect then you do. You should watch it. Who knows? Maybe you’ll end up learning a few things! Snicker…. Snicker

          • While you may be right there is still plenty of evidence that co2 in particular while more of an effective greenhouse gas then it’s tiny concentration. The facts are right there in the links. It is your choice if you want to except them or not but remember those who won’t seek the past are condemned to repeat it!

          • Toneb says:

            I sometimes envy Sky-dragon slayers.
            It must life oh-so-simple – travelling through it in your own little world and simply making IT conform to your view of the way it should be.
            Yes, very comforting.
            And reminiscent of certain religions.
            Which developed to explain life in a comforting way when science could not.

            However as a species – where would we be if it were endemic.
            Mmmm a certain part of the world comes to mind.

          • Toneb says:

            “Let me ask you something mr tone b? Did you even Bother to look at any of the links I sent you? Or even watch the video on Murray salby who knows a hell of a lot more about the science of the greenhouse affect then you do. ”

            Yes and no.

            “http://www.populartechnology.net/2013/02/the-1970s-global-cooling-alarmism.html?m=1”

            Nope – just a popular journalistic meme of the day.
            Don’t confuse good headlines with the direction of the consensus science of the day.
            Besides it was ~45 years ago.
            The science has moved on a tad since then.

            http://journals.ametsoc.org/doi/pdf/10.1175/2008BAMS2370.1

            Murry Salby is someone who disagrees with AGW theory.
            Fair enough.
            He is wrong – as common-sense should tell you as he goes against the consensus.
            But that’s where you are coming from – so you-pays-yer-money and takes-yer-choice.

            http://www.skepticalscience.com/Murry-Salby-CO2-rise-natural.htm

            However a rational person does not take it as a given that a view contrarian to the consensus is correct.
            If you go to 100 doctors for a diagnosis and 97 ay you have cancer but it’s curable, yet 3 say it isn’t. What is the sensible option to take?
            You do know that people can be contrarian by their very nature?
            After all we are told that 1 in 100 of us are psychopaths!
            It is unreasonable to expect unanimity on any subject.
            Does not your observation of human nature tell you that?
            This unless of course you advocate a conspiracy.
            In which case you bury yourself even deeper into the rabbit-hole.

          • “If you go to 100 doctors for a diagnosis and 97 ay you have cancer but its curable, yet 3 say it isnt. What is the sensible option to take?”

            What did I say before? Did you even see the comment? Here I go again repeating myself as usual like a mother of a two year old child! I said science was never about consensus in the first place! It’s about using the scientific method and making your own observations based on what happens! You hear that 97 out of 100 doctors say that liver causes food poisoning yet you try it yourself and find out that nothing happened! There is no 97% consensus! It’s made up bullshit that the government uses to trick you into thinking there globull warming crap is true! Ever heard the expression follow the money? Oh and by the way that link only supported one of Murray Salbys movies was wrong which I read it and is a bunch of made up tripe as a lot of stuff is on the Internet. He came out with two other movies that demolish that link you just posted. If your going to post a link at least try to do it for the right presentation!

          • Also co2 does cause global warming as Murray salby says in the video I sent you but the warming affect is buried in the forest of natural changes of natural variability. Try doing some more exploring and read and watch links more carefully before just cherry picking made up government funded garbage and posting it as a link as evidence support your theory that man causes major global warming. Man does cause warming as I said before. In fact I posted it before and said it earlier I even highlighted it in bold! Man does not cause MAJOR GLOBAL WARMING. Big enough print for you? Either learn to read properly or see an eye doctor to have your eyes checked so that they work proporaly!

          • Toneb says:

            “There is no 97% consensus! Its made up bullshit that the government uses to trick you into thinking there globull warming crap is true! ”

            Just a small proportion of your rant my friend.
            No, actually it’s more than 97%, as that was just a poll of published papers.

            You truly are well, well, away with the fairies.
            Not the only one on here (and elsewhere in the *Denialosphere*).

            As I say in another post on here – I actually find your psychopathy more frightening than the consequences of AGW.
            And I note that it seems to be a major make-up of right-wing Republicans in the US (Vis 25% of Trumps voters polled vowing to dispute the election if he loses).
            It’s the idea that because you are not getting your own way – you throw your toys out of the pram and scream “CONSPIRACY”.
            “Infamy, infamy ….. they’ve all got it infamy.

            https://www.youtube.com/watch?v=kvs4bOMv5Xw

            Look, sensible as it obviously does not seem to you.
            You don’t get to link to an extreme denier bog to prove a point.
            It destroys your point.
            As it is by definition BIASED view.
            I elect to preserve my sanity.
            Ta Ta.

            Oh, and one last thought
            3 options….
            a) The whole of the world’s experts in Earth sciences (not just climate) are incompetent.
            b) The whole of the world’s experts in Earth sciences, are frauds and scammers.
            c) They know more than you.
            That the answer is c) is blatantly obvious to the sane among us.

        • crakar24 says:

          0.05c omg we are all going to die, get a life appell before it passes you by

    • Slipstick says:

      Given that the climate is a chaotic, turbulent system with innumerable oscillations, both near-periodic and aperiodic, with time scales from seconds to millenia, inherent non-linearities (cloud and ice formation, vulcanism, etc.), and a variable primary input, all of which are coupled, why do you expect linear behavior and correlations on a relatively short time scale?

  12. Kevin White says:

    Looks like now that La Nina is finally commencing the last two months of the year should be considerably cooler. El Nino and its lingering thermal hangover effect kept atmospheric temperatures artificially high for the past 18 months but now that is about to end and the transition to a La Nina regime will force strong cooling that should be evident during November-December.

    • barry says:

      “artificially” ?

      • Kevin White says:

        As in anomalous and not very often, El Ninos only occur once every 5-10 years after all. When they do occur they cause global temperatures to temporarily spike until after they die down when temperatures regress back to the mean which is where they are most of the time.

        • barry says:

          I guess that means that la Ninas ‘artificially’ lower global temps. I think it’s an odd choice of word.

        • Gordon Robertson says:

          David Appel…”Agreed. La Ninas and El Ninos are natural fluctuations its long-term trends that count”.

          There has been no long-term trend with them the past 20 years and little or none the past 35 years, according to UAH data sets. Since 1998, the ENs and LNs have canceled each other. That will likely happen again.

  13. David Brewer says:

    Indeed a record warm year in 2016 is almost a certainty.

    But consider the margin. If temperatures stay where they are over November and December, the previous 1998 record will be broken by about 0.05 C. More than likely temperatures will fall a bit and the margin will be even lower maybe around 0.03 C thats three hundredths of a degree.

    A result in this range is way lower than what IPCC models would predict. They have been saying temperatures should rise by 0.2 degrees a decade, and the 2016 conditions for warmth were on balance very similar to 1998 a slightly weaker though longer El Nino, a more recent solar maximum, and even longer since a volcano that put significant amounts of ash into the stratosphere. So where is the 0.3-0.4 C higher annual temperature that those models would predict after 18 years of warming at 0.2 C per decade?

    • fonzarelli says:

      David, great comment… it’s my recollection that 2010 was a “statistical tie” (doctor roy’s words) with ’98 as well.

      • Will says:

        That used to be the case. Last year temperatures in the 2000s were adjusted downward on average 1/10th of a degree– approximately .07 for the years closer to 2000 and approximately .13 for the more recent years.
        This year would be a large step in temperature from those years without the adjustment.

    • David Appell says:

      “…almost all model ensemble members show a warming trend in both LT and MT larger than observational estimates (McKitrick et al., 2010; Po-Chedley and
      Fu, 2012; Santer et al., 2013).”

      – IPCC 5AR WG1 Ch9 p773.

      • crakar24 says:

        Its been colder than a witches tit here David, coldest September on record for Perth, Adelaide October 1.3c below ave, Melbourne and Hobart similar figures in fact most ski resorts still open one month from summer.

        Can your beloved computer model explain this or is it simply a case of global warming causes global cooling like some of your brethren are now suggesting in an effort to tin plate their asses from the public blow back they are about to receive?

        • barry says:

          You’ve been around way long enough to know that weather is not climate.

        • David Appell says:

          crakar24 says:
          “Its been colder than a witches tit here David, coldest September on record for Perth, Adelaide October 1.3c below ave, Melbourne and Hobart similar figures in fact most ski resorts still open one month from summer.”

          Interesting. So far this year, my city, Salem, Oregon, has been 2.9 F above the long-term average. Could you help me extrapolate that to the entire globe? Thanks.

          • David Appell says:

            PS: The climate normal period for this anomaly is 1981-2010.

          • crakar24 says:

            I will remind Barry and yourself about that artificial figure of 30 years the next time you transgress and claim a storm as a sign of the approaching apocalypse should not be too long now before you do.

            The point is your ilk are now saying the polar vortex will bring cold to the nh this year and its all due to co2.

            The only consistent aspect of AGW is the propaganda which is maintained at saturation levels to keep the flock of sheeple in check.

          • Toneb says:

            “The point is your ilk are now saying the polar vortex will bring cold to the nh this year and its all due to co2.”

            Nope- only people that reduce the complications an modulation in the climate system to create seasonal weather think that.

            Has it ever crossed your mind that the climate system is not one homogeneous thing?
            That there are vast differences in parts of the planet in term of albedo, surface temp (and deltaT on a seasonal basis), incident TSI ?

            That changes in these things alter interaction between those regions?
            That the atmosphere is affected right up to the top of the stratosphere by such things – and by changes in solar UV that can in addition to things such as O3 transport via the Brewer-Dobson circulation – and so modulate the stratospheric polar night jet.

            And no it’s not ALL of the NH, it’s parts of it, as in any year where the NH has severe spells, the flip is that other parts will have a much warmer winter. It’s called a meridional pattern to the PJS and unless the Arctic pressure falls to a vacuum then air from southern climes must move north to replace the cold air advected south (over the NE US and Europe FI).

            You will find, if you’d care to look, that in the last severe winter in the E/NE states, the west of the US had a warmer the average one, as did Alaska.

            https://img.washingtonpost.com/blogs/capital-weather-gang/files/2015/03/taveanom-201502-20150310.gif

            So no, of course CO2 does not directly cause the “polar vortex (to) bring cold” to (parts of) the NH, but climate conditions that would have tipped the balance that way anyway combined with AGW changes such as the open waters in the Barents/Kara Seas tip the balance further.

          • crakar24 says:

            Yes it has crossed my mind toneb, has it ever crossed yours that what you describe is impossible to model?

          • Steve Richards says:

            Seems to indicate that the concept of ONE global figure for the temperature is pointless, not relevant, not helpful or useful for anything especially in science.

          • barry says:

            “I will remind Barry… about that artificial figure of 30 years the next time you transgress and claim a storm as a sign of the approaching apocalypse should not be too long now before you do.”

            You’ll be waiting a very long time to do that.

            See? You do know the difference between weather and climate.

            Or do you?

            “The point is your ilk are now saying the polar vortex will bring cold to the nh this year and its all due to co2.”

            I’m not saying that, so am I still of the ilk?

          • crakar24 says:

            Barry,

            The ipcc claim man has influenced the climate since as far back as 1750. If this is so then surely it would make sense to try and determine mans influence from this date rather than rely solely on one 30 period incorporating one metric. A metric period is determined by individuals and based on who knows what.

            Please feel free to continue to cling to your belief based on a temp record spanning 40 odd years and compared to a manufactured reference which has no basis.

          • Toneb says:

            “Yes it has crossed my mind toneb, has it ever crossed yours that what you describe is impossible to model?”

            You might as well throw up your hands and say it’s impossible to model the weather, and give up on weather forecasting – yet great strides have been made in that, even since I retired from the field 10 years ago….

            http://www.nature.com/nature/journal/v525/n7567/images/nature14956-f1.jpg

            Point is, models aren’t meant to be exact predictors, as aren’t NWP ensemble predictions beyond around T+120.
            They are USEFUL.
            We learn things from them.
            Such as the role of PDO/ENSO in the recently ended slow down in warming
            Same with GCM’s, especially as we cannot know the forcing path that will be followed.

          • Gordon Robertson says:

            crakar25…”The ipcc claim man has influenced the climate since as far back as 1750″.

            The IPCC conveniently forgot to point out that 1750 was in the middle of the Little Ice Age where global temps were 1C below normal. Since the LIA ended circa 1850, the globe has warmed about 1C. The IPCC blamed that rebound warming on human activity.

            All the IPCC has demonstrated is that 2500 reviewers can be wrong. That’s especially true when they put out a Summary for Policymakers, written by 50 lead authors, before the main report, then amend the main report to fit the claims of the Summary.

        • Nate says:

          crakar,

          I opened my fridge and saw lots of food. No way there’s hunger in the world.

          • crakar24 says:

            That would have to be the worst analogy I have ever read.

          • Nate says:

            Yeah-sounds as bad as ‘Its darn cold in my backyard, there is no way there’s global warming’

            Problem is lots of people try to make this argument.

            Senator Inhofe bringing a snowball into the capital to demonstrate there’s no global warming.

            BTW, the same week that it was so cold in your backyard we broke heat records all across southern US.

    • Nick L says:

      Yup. And if we trace a line from 1986 to 2016, we obtain something very close to 0.6
      Or should we fixate on the peaks only?

    • barry says:

      They have been saying temperatures should rise by 0.2 degrees a decade

      That figure is from AR4 (2007), The actual quote is:

      “For the next two decades, a warming of about 0.2C per decade is projected for a range of SRES emission scenarios…”

      The linear trend from January 2007 to present is 0.34C.

      We’ll have to wait another 10 years to see how that projection panned out.

      • crakar24 says:

        Wrong Barry,

        You forgot about all the heat in the pipeline you can add another .4c or so to that at least according to Hansen or are we not listening to him anymore?

      • barry says:

        Dunno who you think you’re talking to, but I’m pretty sure it’s not me.

      • Gordon Robertson says:

        barry…”The linear trend from January 2007 to present is 0.34C”.

        Only someone who had failed a course in probability and statistics would make such a claim. Still, that person may get a job at NOAA.

        • barry says:

          That’s the mean trend. I do hope you’re about to mention the uncertainty interval. It’s so hard to get skeptics to deal with that. Please help!

  14. Kristian says:

    Spencer, you say:

    (…) the paper describing the methodology has just been accepted for publication.

    I’m delighted to hear that. Congrats!

  15. Olof R says:

    Your paper has been accepted, Congratulations!

    Since the paper is accepted, I would also like to congratulate that you finally have found the elusive tropical hotspot, at least in the period covered by the superior AMSU-instruments.

    You have suggested an index for the upper troposphere, TUT = 1.4*TTP – 0.4*TLS here:
    http://www.drroyspencer.com/2015/05/new-satellite-upper-troposphere-product-still-no-tropical-hotspot/
    The trends of the upper and lower troposphere in the tropics, from 2000 til now (2000 is in the middle of the MSU/AMSU-transition) are:

    0.33 C/decade for TUT
    0.14 C/decade for TLT

    Thus, the trend of the upper troposphere is about 2.3 times larger than that of the lower troposphere. Alternative start dates of the AMSU era, 1998 or 2001, do not affect the this trend ratio very much.

  16. OleKlemsdal says:

    Congratulations with the publication, highly welcomed!
    If I’m not mistaking, the average temperature anomaly for the first ten months of this year is 0,537 – almost identical with 1998; 0,542.
    Assuming that the Ninos are rather comparable; what in your opinion (if anything) does this tell us about climate sensitivity?

    • barry says:

      IMO, it tells us nothing about climate sensitivity.

      • OleKlemsdal says:

        Well, according to IPCC4 (2007) a temperature incline of 0,2 degrees per decade (Celcius) were to be expected for the next decades, so we’re missing around 0,36 degrees. Is that still compatible with a high climate sensitivity?

        • David Appell says:

          OleKlemsdal says:
          “Well, according to IPCC4 (2007) a temperature incline of 0,2 degrees per decade (Celcius) were to be expected for the next decades, so were missing around 0,36 degrees.”

          Trying to calculate a temperature trend from two peak years is mindless.

        • Olof R says:

          Yes, the UAH v6 TLT index shows no climate sensitivity since the last big el Nino. But that doesn’t mean that the free troposphere isn’t warming according to plan. The Ratpac global 850-300 mbar index has a trend of 0.25 C/decade since 1997.

        • David Appell says:

          Olof R says:
          “Yes, the UAH v6 TLT index shows no climate sensitivity since the last big el Nino.”

          You are using the term “climate sensitivity” incorrectly.

      • barry says:

        That figure is from AR4 (2007), The actual quote is:

        For the next two decades, a warming of about 0.2C per decade is projected for a range of SRES emission scenarios

        The linear trend from January 2007 to present is 0.34C.

        Well have to wait another 10 years to see how that projection panned out.

        • OleKlemsdal says:

          “The linear trend from January 2007 to present is 0.34C.”
          Do you really think that this is a good description of the UAH temperature trend in this period? (By the way: Since you mention January 2007: UAH in January 2007 was 0,43. The latest value in Oct 16 is as reported 0,41)

        • barry says:

          Do you know what a linear trend is?

          For UAH, the linear trend is 0.32C/decade since 2007.

          If you think working out the trend consists of picking 2 points among a hundred and getting a ruler, you are seriously doing it wrong.

          • OleKlemsdal says:

            Well, of cause we can have a new discussion in 2037 (if I’m still alive), Barry, that’s fine.
            Otherwise, some people might find it interesting to see where were heading, and how good the prediction is doing as yet. And you don’t have to read IPCC statements as some people read the Bible,- it is possible to try and absorb the essensiell message. The revised Bible will soon be here, and new predictions will make most people forget about the 2007 prediction, I’m afraid.

          • Gordon Robertson says:

            barry…”For the next two decades, a warming of about 0.2C per decade is projected for a range of SRES emission scenarios”

            Read that with great care. Note the word ‘projected’ rather than ‘predicted’. The IPCC were forced to interchange those words by expert reviewer Vincent Grey who pointed out the obvious, that unvalidated models can predict nothing.

            That’s right, no climate model has been validated, meaning there is nothing in reality with which it can be verified.

            The other thing to note is ‘scenarios’. That’s right, the IPCC is dabbling in fairy tales regarding what they think the future holds. That’s after admitting in TAR that future climate states cannot be predicted. The IPCC creates these fairy tales then ‘projects’ and outcome. A projection on a fairy tale is another fairy tale.

            Bad science all around.

          • Gordon Robertson says:

            barry..”For UAH, the linear trend is 0.32C/decade since 2007.”

            No, barry, that’s your trend based on a manipulation of the data on woodfortrees. There was no trend till this El Nino struck in early 2016.

            All things shall pass and so will this EN, to be replaced with an LN that will re-stabilize the 20 year hiatus.

          • barry says:

            The IPCC were forced to interchange those words by expert reviewer Vincent Grey who pointed out the obvious, that unvalidated models can predict nothing.

            You’ve made this claim before, and when you provided a reference from Grey it post-dated the very same language used by IPCC.

            Dunno where you got this idea from but it’s rubbish. Yet another invented to story to trash the IPCC.

          • barry says:

            No, barry, thats your trend

            Once again a mindless skeptic doesn’t read the thread and blames me for a period chosen by another skeptic.

            This happens again and again. It’s 3 stooges dumb, but keeps happening. Makes it very challenging to take such skeptics who do this seriously at all.

        • barry says:

          Here is what the trend looks like.

          http://tinyurl.com/jnuckd6

          The difference between your method and the right one is that the right one uses ALL the data points between Jan 2007 and present.

          Using your method, I could look for a day in summer that was colder than one in the previous winter, and conclude that this meant it was actually winter.

          This is the difference between a weather event and climate.

          • OleKlemsdal says:

            Ever heard of cherrypicking?
            Please answer whether you think a decadial trend of 0,32 is a good estimate for UAH the last couple of decades? If yes, try and see if dr. Spencer agrees.

          • barry says:

            The IPCC projection was quoted by someone else (a skeptic, above). I’m not cherry-picking, I’m following the argument put by someone else.

            The trend since 2007 is statistically non-significant. That is, the uncertainty in the trend is much greater than the trend itself. Specifically,

            UAH 6.0 trend since 2007 is: 0.32C/decade (+/- 0.49)

            So one cannot really say what the trend is. But 2007 was the given start date per the IPCC projection that someone else cited, so that’s what we’ve got.

            The trend since 1998 is, likewise, statistically non-significant. The uncertainty is larger than the trend. We have to go further back to get a statistically significant trend, but then we’re unable to apply it to the IPCC projection, which starts from 2007. The projection is different if we start earlier. IPCC 2001, for example, projects a warming of 0.1C/dec to 0.2C/dec over the “next few decades.”

            As I said in the original reply, we have to wait another 10 years to see how the projection panned out. We also have to use surface temp data, because the projection was for surface temps, not tropospheric (hence not UAH or RSS). Once again, I constrain myself to what the projection actually was, not what I would prefer (unlike some).

            What’s going on here is that that someone has fuzzily remembered something about the IPCC, and I’ve specified what that was. The projection is from 2007. Not 1998. Not 2001.

          • barry says:

            This happens all the time. A skeptic posits something about a certain time period, and then a little later in the discussion a different skeptic accuses me of cherry-picking the time period when all I did was follow up from someone else’s pick.

            We reach a new absurdity this time, because it is the same skeptic who chose the time period (when citing IPCC AR4 2007) who now accuses me of cherry-picking it.

          • OleKlemsdal says:

            At least now your making some sense (comment below). Anyone knows that the lower troposphere responds markedly to changes in ENSO. So, if you want to calculate a trend that ends in 2016 – the only adequate starting point is 1998, its the only Nino episode of comparable size after UAH started it’s measurements. So that’s why I find a comparison between the first 10 months of 1998 and 2016 of interest.
            If you don’t want to use two extreme years – then go ahead start at 2001 (In fact being after a long period of negative enso) and end in the beginning of 2015 (after a short period of positive enso), as I linked to earlier; the result is the same: No increase in UAH and RSS.
            And please don’t try with “The trend since 1998 is, likewise, statistically non-significant. The uncertainty is larger than the trend”
            If there is no trend, than 10 or 20 more years won’t make the trend significant. But as is clealy stated on RSS home pages regarding RSS, “..The troposphere hasnotwarmed quite as fast as most climate models predict.” and further.. “For the time period before 2005, the models were forced with historical values of greenhouse gases, volcanic aerosols, and solar output. After 2005, estimated projections of these forcings were used. If the models, as a whole, were doing an acceptable job of simulating the past, then the observations would mostly lie within the yellow band. For the first two plots (Fig. 1 and Fig 2), showing global averages and tropical averages, this is not the case.”
            Hence, we don’t have to wait 10 more years to establish that the increase in lower troposphere temperature after 2005 is statistically significantly lower than projected. http://www.remss.com/research/climate

          • barry says:

            1) The projection you cited is from 2007. Not 1998, not 2001.

            2) Statistical significance matters. You can’t wish it away when you light on some mean trend that suits you.

            3) The projections were for surface temps 2 meters from the ground. Not for the temps through 4-6 kilometers of lower atmosphere. UAH and RSS are inapplicable. Apples to apples.

            The 20th Century trend according to IPCC 2001 is 0.067C/decade. Clearly they are positing acceleration thereafter. So you can’t apply the 2007 projection retrospectively, only from2007.

            The projection from the 2001 IPCC was 0.1 to 0.2C/decade.

            Any of the global data sets (including the tropospheric data) meets that projection at current times – owing to the uncertainty. The uncertainty intervals well overlap this projection.

            Now, if you think that the uncertainty is meaningless and only the mean trend matters, then warming has resumed since 2007 at an alarming rate. More than 0.3C/decade.

            If you understand why that trend is not *true*, and what the uncertainty means, then you must apply the same knowledge about uncertainty in trends since 1998, 2001 etc.

            You can’t willy-nilly dispose of uncertainty when it suits you.

          • barry says:

            Amending:

            The projection from the 2001 IPCC was 0.1 to 0.2C/decade, over the next few decades. Which in English means a minimum of 3 decades.

          • barry says:

            Reading further the RSS page you linked:

            Why does this discrepancy exist? One possible explanation is an error in the fundamental physics used by the climate models. In addition to this possibility, there are at least three other plausible explanations for the warming rate differences. There are errors in the forcings used as input to the model simulations (these include forcings due to anthropogenic gases and aerosols, volcanic aerosols, solar input, and changes in ozone), errors in the satellite observations (partially addressed by the use of the uncertainty ensemble), and sequences of internal climate variability in the simulations that are difference from what occurred in the real world. We call to these four explanations model physics errors, model input errors, observational errors, and different variability sequences. They are not mutually exclusive. In fact, there is hard scientific evidence that all four of these factors contribute to the discrepancy, and that most of it can be explained without resorting to model physics errors. For a detailed discussion of all these reasons, see…

          • OleKlemsdal says:

            “Now, if you think that the uncertainty is meaningless and only the mean trend matters, then warming has resumed since 2007 at an alarming rate.”
            Did I say that uncertainty is meaningless? When observations are outside 95% confidence intervals, that means that they’re beyond acceptable uncertainty.
            Now, since you bothered to quote the further discussion of this problem on the RSS page, you obviously acknowledge the fact that even the top experts in the field have recognized that the increase in temperatures (lower troposphere)is much lower than expected. So why can’t you accept the samme?
            Hence it appears quite absurd that you spend time arguing that these data are not in conflict with the models, or that the linear trend since 2007 shows a large increase, or the uncertainty is way to high etc. etc.

          • barry says:

            You need to read critically, and not assume.

            I said nothing abut models, only compared your cite from IPCC, which you have yet to acknowledge is from 2007, not 2001 or 1998. For both IPCC 2001 and 2007 statements on the next couple of/few decades, the global temp trends uncertainty overlaps with those estimates.

            It’s not my problem that you are changing the subject as we go.

            Models show more warming than observed. As stated at RSS, there are multiple possibilities for why this is.

            RSS (Meres) also state that the surface records are probably more reliable than satellite records. Am we still to take this source seriously? I trust you will urge consistency on this.

            The most recent values for RSS put the anomalies well within the model ensemble envelope. I do not think that this is especially meaningful, but you seemed to think so in your post upthread when you compared Jan 2007 to Oct 2016.

          • crakar24 says:

            Barry you are arguing over tenths of degrees despite all that extra carbon pullishion, when will the omni potent god you call co2 reveal itself to the world.

          • OleKlemsdal says:

            Well, at least we can agree on some facts, you now say “Models show more warming than observed. As stated at RSS, there are multiple possibilities for why this is.”
            But then you go on with “I said nothing abut models, only compared your cite from IPCC, which you have yet to acknowledge is from 2007, not 2001 or 1998. For both IPCC 2001 and 2007 statements on the next couple of/few decades, the global temp trends uncertainty overlaps with those estimates.”
            Yes, IPPC4 was published in 2007, and the reason why this was referred to is that in contains the most specific prediction of temperature rise (i.e. 0,2 degrees/decade). This does not mean that 2007 is the only interesting year to start examining whether observations and predictions fit.
            It should be obvious that a trend of 0,2/decade is not meant to start abruptly the 1.th of January 2007, and that for instance the trend from 1997 to 2007 might be much lower.
            If the main mechanism causing temperature rise is the continuous increase in greenhouse gases (primarily CO2), then this underlying mechanism was almost identical from 1997-to 2007, and hence the temperature rise should be very much the same.
            The bottom line is that we now have 18 years of observations with very little increase in tropospheric temperatures. This does not rule out that there is a steadily increasing greenhouse effect because of increasing CO2 (I believe there is), but it speaks strongly against a high climate sensitivity (i.e. TCR > 2 degrees).

          • barry says:

            It should be obvious that a trend of 0,2/decade is not meant to start abruptly the 1.th of January 2007

            In 2007 IPCC stated:

            For the next two decades, a warming of about 0.2C per decade is projected for a range of SRES emission scenarios

            How can it possibly be read that they meant for any period prior to 2007?

            Is English your first language? Not being rude. Just puzzled at how you could mistake what is quite clear language here.

            Here’s more: The same report said trend for 20th century was 0.067C/decade. That report said the trend was accelerating. So it makes a difference when you start your period of trend assessment.

            Furthermore, IPCC 2001 said rate would be 0.1C-0.2C/decade over “the next few decades.”

            So a slightly smaller prediction only 7 years previous.

            You should use IPCC 2001 forecast if you want to test from 2001 (and 1998 I guess).

            But you should also test what IPCC actually says. Which means we have to wait until 2026 for the AR4 prediction and at least 2030 for the TAR prediction. “The next few decades” is at least 30 years – straightforward English. “The next two decades” is self-evident.

            Does something about the word “next” confuse you?

          • OleKlemsdal says:

            I think we may agree that predictions are about the future, hence any report published in 2007 will not ‘predict’ what has already happened. Does that make it impossible to make any comparison of predictions and observations?

            Well, as you suggest: “Furthermore, IPCC 2001 said rate would be 0.1C-0.2C/decade over the next few decades.
            So a slightly smaller prediction only 7 years previous.
            You should use IPCC 2001 forecast if you want to test from 2001 (and 1998 I guess).”
            Fine, so we use the prediction of 0,1-0,2 for the first 9 years (lets say 0,15 C), and the prediction of 0,2 for the next 9 years. That leaves us with a predicted 0,135 + 0,18 = 0,315 degrees to be expected for the period from 1998 to 2016.
            In my first post i wrote : “so were missing around 0,36 degrees.
            So, this huge mistake should now be corrected to “around 0,32 degrees”, which makes alle the difference??

            And as you correctly pointed out, these predictions were probably not meant for tropospheric temperatures anyway. So, perhaps the discussion is more properly conducted if we compare models and observations, as we have already been through regarding RSS.
            Again, you can twist and turn words and details as much as you like, the fact remains that the temperature rise for UAH and RSS the last couple of decades have been much smaller than predicted.
            As long as this is acknowledged by both Dr. Spencer and Carl Mears, I may have to live with the fact that Barry sees it otherwise.

          • barry says:

            So, this huge mistake should now be corrected to around 0,32 degrees

            We’re also missing a decade or so. The time frame was given. It has not elapsed. As I said, we have to wait to see how the predictions panned out.

            If you insist on ignoring the period given – as if one can simply make up one’s own parameters and claim that’s what the IPCC said – then at least observe the uncertainty in the trend.

          • barry says:

            In observed trends since 2001, the 95% uncertainty interval well overlaps the predicted trend at this early stage, which is unsurprising.

            If you want to rubbish IPCC predictions/projections, you’re better off sticking with the models rather than the statements.

          • OleKlemsdal says:

            “In observed trends since 2001, the 95% uncertainty interval well overlaps the predicted trend at this early stage, which is unsurprising.”
            Sorry, but I don’r think this gives the right picture of the facts, you will have to excuse me for relying more on the information below.

            http://www.drroyspencer.com/2014/02/95-of-climate-models-agree-the-observations-must-be-wrong/

            From RSS page, figure 1 legend: “Global (80S to 80N) Mean TLT Anomaly plotted as a function of time. The blue band is the 5% to 95% envelope for the RSS V3.3 MSU/AMSU Temperature uncertainty ensemble. The yellow band is the 5% to 95% range of output from CMIP-5 climate simulations. The mean value of each time series average from 1979-1984 is set to zero so the changes over time can be more easily seen. Note that after 1998, the observations are likely to be below the simulated values, indicating that the simulation as a whole are predicting too much warming.”

          • barry says:

            Sigh.

            As I said, use the models if you want to try and rubbish IPCC projections.

            But if you are going to use the statements, apply the period as they are stated.

            Which means start your trend in observed temps from 2001 or 2007 – NOT from 1979.

            The starting values are different, the trends are different, the uncertainty is different.

            The prediction statements from IPCC are not going to help you promulgate the contrarian messaging. We’re at least a decade off seeing if they will pan out. What do you not get about “the next two decades” or “the next few decades?” The prediction period isn’t even half over!

            Just stick to the models.

          • Gordon Robertson says:

            barry…”Here is what the trend looks like”.

            Thought so…more woodfortrees smoke and mirrors. If you play with the parameters enough you could show a cooling.

            Keep the start point where it is and watch the +ve trend come down as the La Nina sets in then watch it go -ve.

          • barry says:

            Mindless skeptics…

            http://www.drroyspencer.com/2016/11/uah-global-temperature-update-for-october-2016-0-41-deg-c/#comment-229157

            You can get a cooling if you start your trend from or near the peak of the latest el Nino – around Feb this year. There is no trend from before 2015 to present that gives you cooling.

            Yep, that could change with some seriously cold global anomalies. But that should make abundantly clear that we are then monitoring weather fluctuations, not climate trends.

            Dunno why skeptics are barracking for a cooling trend from 1998 to return. It’s not as if it will change their minds if it doesn’t.

  17. Dan Pangburn says:

    Thermalization explains why CO2 has no significant effect on climate. CO2 absorbs EMR in a narrow band (nearly all within 1 micron) around 15 microns which makes it a ghg but the energy and momentum are immediately shared with other molecules same as for the EMR absorbed by water vapor molecules (the dominant ghg). At less than very high altitudes, essentially all subsequent radiation is at wavelengths that only water vapor molecules can emit/absorb. At very high altitudes the molecules get far enough apart that contact time between them becomes long enough that CO2 molecules have enough time to emit photons and join with other ghg molecules to radiate to space.

    It looks like the rising water vapor is having enough warming effect to counter the cooling that would otherwise be occurring.

    • bobdroege says:

      CO2 molecules also get excited by collisions with other atoms and molecules, which means it does have an effect on climate.

      The mark of a charlatan is one who makes up terms like thermalization, when one could use the proper term.

      • Mike Flynn says:

        bobdroege,

        May I point out that strictly speaking, atoms don’t collide. Even less can “excitation” occur by “collisions” at temperatures likely within the troposphere.

        Feynman surmised that all interactions between light and matter could be described in terms of the following –

        An electron moves from place to place.

        A photon moves from place to place.

        An electron absorbs and emits a photon.

        I haven’t seen anything that contradicts these statements.

        All physical processes not involving gravity or nuclear reactions can be explained in terms of the above three statements.

        As to climate, it’s just the average of weather – no more, no less. Everything affects the motions of the atmosphere. The consequences are generally completely unknown, because the future is involved.

        Cheers.

        • David Appell says:

          Mike Flynn wrote:
          “Feynman surmised that all interactions between light and matter could be described in terms of the following

          An electron moves from place to place.
          A photon moves from place to place.
          An electron absorbs and emits a photon.”

          You are mistaking Feynman diagrams for physical processes. They are not — they are simply and nothing more than a pictorial representation of a calculation. Feynman’s work didn’t envision electrons and photons as point particles — they are quantized fields.

          Even Compton knew that electrons scattered via photons. So did Einstein.

          “All physical processes not involving gravity or nuclear reactions can be explained in terms of the above three statements.”

          Wrong — you missed weak interactions, and most of quantum chromodynamics.

          • Mike Flynn says:

            David Appell,

            I was merely quoting Feynman. Maybe you are right, and he misunderstood his own work.

            As to your nonsensical statement that ”Even Compton knew that electrons scattered via photons. So did Einstein.”, you might refresh your recollections –

            “Compton scattering, discovered by Arthur Holly Compton, is the inelastic scattering of a photon by a charged particle, usually an electron. It results in a decrease in energy (increase in wavelength) of the photon . . . “, which is rather the opposite of what you said.

            As to weak interactions, they relate to the nucleus, and I excluded them.

            Maybe you need to realise that QED and QCD relate to entirely different things. I specifically excluded nuclear reactions, for which I apologise. I meant to say nuclear processes. However, quoting Feynman –

            “For example, out of quantum electrodynamics come all known electrical, mechanical, and chemical laws: the laws for the collision of billiard balls, the motions of wires in magnetic fields, the specific heat of carbon monoxide, the color of neon signs, the density of salt, and the reactions of hydrogen and oxygen to make water are all consequences of this one law.”

            I am surprised that a person with a Ph.D. in Physics, State University of New York (SUNY) at Stony Brook, does not seem to appreciate the difference between nuclear processes, and non nuclear processes.

            Keep throwing around sciency words. Maybe someone will believe you know what you are talking about.

            Cheers.

          • David Appell says:

            Mike Flynn:

            Clearly you don’t know the first thing about Feynman’s work on QED.

            If you did, you wouldn’t interpret his pictures literally. They aren’t meant to be interpreted literally, they are simply pictoral representations of perturbative calculations of Feynman path integrals.

            “As to weak interactions, they relate to the nucleus, and I excluded them.”

            Wrong again. Neutrinos scatter only via weak vector bosons, not via the strong force. Neutrinos don’t interact with the strong (“nuclear”) force at all.

          • Mike Flynn says:

            David Appell,

            I know you believe you can boil water by wrapping it with an overcoat. You can’t. No GHE, no heating water (or the Earth, for that matter), by insulating it from its external heat source.

            Dream on, David. You can’t even provide a falsifiable GHE hypothesis.

            Stick with your overcoat fixation. Maybe physics is beyond you. English comprehension certainly seems to be beyond your grasp.

            Others can make up their own minds, I guess.

            Cheers.

          • David Appell says:

            Mike Flynn says:
            “I know you believe you can boil water by wrapping it with an overcoat.”

            Misquoting me isn’t evidence in your favor — it’s just misquoting and more misdirection.

            You know very well why one wears a coat. And you know its reduction in heat loss keeps you warmer. And you understand that CO2 reduces heat loss.

        • bobdroege says:

          Mike, any chance you could explain Brownian motion to me?

          • Mike Flynn says:

            bobdroege,

            Of course I could.

            What part of Brownian motion do you not understand?

            Cheers.

          • bobdroege says:

            How it works relative to this statement of yours

            “May I point out that strictly speaking, atoms dont collide.”

            My understanding, which comes from Albert’s explanation is that the particles move randomly due to the different number of molecular collisions on different sides of the particle.

      • Dan Pangburn says:

        The numerical basis for the above is in my blog. If you are uncomfortable with this, 5 other examples of compelling evidence are provided there.

        Thermalization is the correct word . . . and I didn’t make it up.

        • bobdroege says:

          The number of “thermalizations” equals the number of excitations due to collisions, thus the “thermalizations” have no effect on the greenhouse effect.

          A CO2 molecule can reach an excited state by absorbing a photon, or through collision with another molecule or atom. It can lose the energy by emitting a photon, or by collision with another molecule or atom.

          This leads to a near constant concentration of CO2 molecules in each particular excited state and thus a near constant emission of energy, hence the greenhouse effect.

          If you were using the correct term, you would be spelling it correctly.

          Checkmate

          • Mike Flynn says:

            bobdroege,

            There is no GHE. You haven’t the faintest idea what you are talking about, unless you are redefining normal physical terms as you go.

            Atoms and molecules do not “collide” at the quantum level. Your use of the term “excited” implies action at the quantum level. If you wish to be inconsistent, maybe you should explain why, as you go.

            Your comment is a mish-mash of truth, half-truth, and utter garbage. Ignorance at best, and intentionally misleading at worst. Maybe you obtained your PhD at the same time as David Appell.

            Cheers.

          • David Appell says:

            Mike Flynn says:
            “There is no GHE.”

            Mike Flynn is getting petulant again. This always happens when he is presented with questions he can’t answer. It’s the best response he can muster.


            Mike Flynn wrote:
            In cold conditions, I wear clothes to reduce the rate of heat loss.

            http://www.drroyspencer.com/2016/08/uah-global-temperature-update-for-july-2016-0-39-deg-c/#comment-219326

          • bobdroege says:

            Mike, are you denying that the CO2 molecule vibrates at the Quantum level?

            And absorbs and emits infrared radiation when changing the amount of vibration.

            It’s all in the spectra, and established science.

            Some of us do have liberal arts degrees with a lot of required math, physics, and chemistry etc.

    • David Appell says:

      Dan Pangburn says:
      “Thermalization explains why CO2 has no significant effect on climate.”

      Then explain this:

      http://www.giss.nasa.gov/research/briefs/schmidt_05/curve_s.gif

      • Dan Pangburn says:

        Nice graph. Figure 1 in my blog is very similar and accompanied by a couple pages of explanation. Click on my name to link to it.

        • David Appell says:

          I’m not going hunting. Link to it.

          • bobdroege says:

            I did, and found this

            “Thus, at sea level conditions, it is approximately 6/0.0002 = 30,000 times more likely that a CO2 molecule, after it has absorbed a photon, will bump into another molecule, losing at least part of the momentum and quantum of energy it acquired from the photon.”

            You can’t lose part of a quantum.

            Epic fail!

            Dan doesn’t understand Quantum Mechanics, not that many of us do.

          • Dan Pangburn says:

            bob I am certainly no expert in quantum mechanics but IMO there is a quite a bit of speculation that takes place using QM with its murkiness as justification.

            Because photons of different wavelengths contain different amounts of energy and momentum, the quantum that cannot be divided must be much smaller (10^-34 J ?). Delete the words ‘quantum of’ from the statement.

            In any event, the final result matches measurements 98% 1895-2015.

            Also, the momentum must be conserved.

          • bobdroege says:

            Well Quantum Mechanics explains why a CO2 molecule, or any other molecule or atom can absorb or emit certain frequencies of radiation.

            Deleting the term “quantum of” makes your statement make even less sense.

            You should read up on why the CO2 spectrum is what it is.

          • Gordon Robertson says:

            bobdroege…”Thus, at sea level conditions, it is approximately 6/0.0002 = 30,000 times more likely that a CO2 molecule, after it has absorbed a photon, will bump into another molecule, losing at least part of the momentum and quantum of energy it acquired from the photon…”

            Has anyone ever seen a photon absorbed by a CO2 molecule in the atmosphere?

            Nope.

            Has anyone ever seen a photon?

            Nope.

            A photon is defined as a particle of EM with momentum and zero mass. Obviously it is a model created to make it easier to visualize EM as particles. No one has ever isolated a photon and no one knows if they exist.

            Einstein claimed that anyone claiming he/she knows EM is a particle or a wave is wrong.

          • bobdroege says:

            Gordon, I see them all the time.

            Einstein was correct, they are both a particle and a wave at the same time.

            Looks like you need to study some Quantum Mechanics as well as some spectroscopy.

    • Gordon Robertson says:

      Dan Pangburn…”CO2 absorbs EMR in a narrow band (nearly all within 1 micron) around 15 microns which makes it a ghg…”

      The entire spectrum of CO2 is swamped by the water vapour spectrum and how anyone can separate the two is a mystery.

  18. Again this period in the climate is not usual and the warmth is on it’s last legs.

    Solar now starting to reach my criteria and we will soon see.

  19. 2015 12 +0.45 +0.53 +0.37 +0.61
    2016 01 +0.54 +0.69 +0.39 +0.84
    2016 02 +0.83 +1.17 +0.50 +0.99
    2016 03 +0.73 +0.94 +0.52 +1.09
    2016 04 +0.71 +0.85 +0.58 +0.94
    2016 05 +0.55 +0.65 +0.44 +0.72
    2016 06 +0.34 +0.51 +0.17 +0.38
    2016 07 +0.39 +0.48 +0.30 +0.48
    2016 08 +0.43 +0.55 +0.32 +0.50
    2016 09 +0.44 +0.50 +0.39 +0.37
    2016 10 +0.41 +0.42 +0.39 +0.46

    Looks like it is getting lower and yes much of this has to do with recent El Nino ending but this is the beginning of the cool down not the end.

  20. WHY DOES THE CLMATE CHANGE?

    I think we should look to the suns primary variability and the secondary climatic effects associated with that solar variability moderated by changes in the strength of the earths geo magnetic field, and lunar influences.

    These factors bringing the terrestrial items that influence the climate either toward a warmer mode or cooler mode, and if these terrestrial factors are pushed far enough in one direction or another climatic thresholds could be reached which result in a complete reorganization of the climate.

    THE TERRESTRIAL ITEMS

    changes in atmospheric circulation patterns

    changes in oceanic current patterns

    changes in frequency of major volcanic activity

    changes in sea surface temperatures

    changes in global cloud coverage

    changes in global snow coverage

    changes in global sea ice coverage

    Milankovitch Cycles yes, Continental Drift yes they do cause the climate to change but that is in the big very gradual climate change picture but these forces can not and do not explain all of the many abrupt climatic changes which have sometimes according to Ice Core evidence taken place in a decade or two. I mean swings of 4 or 5 or 6F, not necessarily for the entire globe but at least in the northern latitudes of the N.H. which is significant enough.

    CURRENT SITUATION WILD THIS WINTER SEASON?

    Even looking at the current situation in the N.H we have snow coverage way above normal and the area of temperatures below freezing way above normal. I have always said who cares if the Arctic is above normal because it is still far below freezing. Who cares if the N.H is above normal in temp. if much of it is due to the very high latitudes.

    Is it not funny that the AO is tending more negative once again as solar EUV light has been on the decline. Is it not amazing that this also happened in the 2008-2010 period of time. My bet is look for -AO to be the rule gong forward , and let us watch global sea surface temperatures and see if any declines start to develop. I think they will if UV light remains weak enough and sunspot numbers average less then 40. I am talking about much longer wavelengths here in respect with UV light /sea surface temperature as opposed to EUV light which is more involved with ozone.

    OTHER SHOE TO DROP ?

    Right now half of the solar parameters have reached my criteria to cause global cooling those being cosmic ray counts, solar flux, EUV light , and sunspot numbers.

    What is left is for the solar wind and AP index to plummet which should occur in the not to distant future if coronal hole activity on the sun subsides which it will if sunspot numbers stay low to non existent over a long enough duration of time.

    GETTNG BACK TO ABRUPT CLMATE CHANGE MAYBE THIS EXPLANATION ?

    I think primary solar variability is a little greater then what is being portrayed, and I also think the geo magnetic field of the earth when in sync with solar variability can magnify given solar effects which I think could go a long way in explaining why the climate at times changes so abruptly. It does because the terrestrial items which control the climate are pushed to such limits that cause the reorganization of the whole climatic system from atmospheric circulation changes to ocean current circulation changes and those will translate if changes are dramatic enough to major climatic changes.

    THE UPSHOT OF WHAT I AM SAYING.

    I am not saying this will occur in the present situation but I am saying this is the greatest potential for such an event to occur since the end of the Dalton Solar Minimum. More likely at the very least I think things are in place to at least bring enough global cooling going forward which should put an end to AGW theory which will satisfy me immensely.

    • barry says:

      Sun and temperature doing the opposite for the whole satellite temp record.

      http://tinyurl.com/hg6u8ew

      • Wrong Barry , the sun up to 2005 was very active and above my criteria which is the following for global cooling. From 1979-2005 the sun should have been causing global warming according to my studies.

        solar flux sub 90

        cosmic ray counts 6500+

        solar wind 350 km/sec or lower

        ap index 5 or lower

        euv light 100 units or less

        imf – 4.0 nt or less

        solar irradiance off .15%

        The only time this criteria has been met since the satellite era was 2008-2010 period although since 2005 we have had sub solar activity in general.

        Going forward if my above criteria is the rule I say expect global cooling.

      • fonzarelli says:

        Barry, have you ever turned the flame down on a kettle of water? Did the kettle of water continue to warm?

        • David Appell says:

          Depends on the settings. At some settings, of course it can continue to warm.

        • barry says:

          If there is a purported lag, let it be specified. Then there is something to test.

          • fonzarelli says:

            You don’t need specifics to show just how bogus your concept is. Maybe there is a lag, maybe there isn’t. What i’m trying to say here is that your argument doesn’t mean much…

          • barry says:

            It’s Salvatore’s concept we’re talking about. If there is no way to falsify it then it’s not much of a hypothesis/theory. I’ve attempted to do so, and asked him to supply a way in which he can falsify it himself (below), in case my attempt failed whatever strictures he deems necessary.

      • Dan Pangburn says:

        bar – It is disturbing to see egregious mistakes like that graph. It is like putting the trajectories of your speedometer reading and odometer reading on the same graph and wondering why they have different shapes.

        SSN is a forcing (or a proxy for a forcing), not energy. The correct comparison is the time-integral of the SSN anomaly vs. temperature anomaly. The reference SSN to determine the anomalies for V2 SSN is about 60.

        • fonzarelli says:

          Dan, is this just because of ocean warming or does that include land warming, too? And is the driver of solar warming increasing water vapor over time due to the raising of the ocean surface temperature? thanx…

        • barry says:

          SSN and TSI correlate very, very closely. But TSI data is out of date at the website where you can quickly gin up a graph. Sun spot numbers go through to present.

        • barry says:

          Dan, solar intensity (SSN->TSI) is a direct change in energy, taking 8 minutes to reach Earth.

          I don’t see why we have to derive solar radiation as an integral of time. We lose long-term trend with that operation, for a start.

          I have little to no calculus, but this seems like a strange step to take when the ‘forcing’ has a direct impact on the target.

          If someone wants to argue a lagged response in global temps, that seems reasonable. That might be so over sea, much less so over land. And there are, of course, other factors – but Salvator is focusing on pure solar, so I’m testing it out with him.

          I’ve seen people use the derivative of CO2 to “discover” a match with the temp record – I know enough about calculus to know that this does remove the trend, and emphasises – entirely – the extremely short-term (monthly) fluctuations. Any trend in the derivative of CO2, in this example, is showing acceleration. It also shows the minute fluctuations that are connected to temp changes – orders of magnitude less in amplitude than the annual flux and quite a bit less than anthropogenic emissions.

          I’m leery of applying operations without good reason. The main difference between global temps and solar variation is that there is a strong, clear, fairly regular cycle with solar, but not so with surface temps. When comparing temps to solar activity I normally ensure to match phase at beginning and end of solar period, but in this case Salvator is calling the time periods, so I’m going with what he says.

          • Dan Pangburn says:

            Bar – TSI is a rate of energy change. It must exist for a period of time to accumulate energy. That is what taking the time-integral does.

            If you turned the fire on under a pot of water and immediately turned it off the pot of water would warm hardly at all. To heat the water (increase its energy) requires that the fire (the forcing) be on for a period of time. That is, take the time-integral of the forcing.

          • barry says:

            This lagged effect would apply to the oceans, but not so for land.

            How about taking land-only temp observations. The lag effect is small to non-existent there. If you’re still concerned about the effect of the oceans, then remove coastal thermometers from the reckoning.

            I put it to Salvatore upthread to specify what he thinks the time lag will be, so as to furnish information to test his theory that the sun (and related components) done it. Are you able to supply this information?

      • barry says:

        From 1979 to 2005 solar intensity waned slightly overall, while global temps, even while the data set with the lowest trend (UAH) increased.

        From 2008-2010 (Jan 2008-Dec 2009), there was an increase in temps while, by your metrics, cooling from solar and associated was occurring.

        I probably have some perodicity wrong.

        Have you done this? Have you picked a time period purely from your model of solar variables that should have caused cooling, and then – and only then – looked at the temp record for the same period to see if your model worked?

        Maybe you could pick a cooling period from your solar model and we can compare that against the temp record together?

  21. Dave the sun was above my criteria THEN ,that is why my prediction did not materialize.

    If the sun was at or below my criteria then you would be correct but it wasn’t so the verdict is still out.

    • David Appell says:

      Sure Salvatore. But you make lots of declarative predictions that make no caveats about the sun. For example,

      “here is my prediction for climate going forward, this decade will be the decade of cooling.”
      – Salvatore del Prete, 11/23/2010
      http://ourchangingclimate.wordpress.com/2010/10/20/andrew-dessler-debating-richard-lindzen/#comment-8875

      Salvatore, do you stand outside your town every night crying warnings about wolves? I’m guessing you do.

    • Aaron S says:

      Salvatore,
      I think you assumed we were going into a major solar minimum, and we did not. This cycle looks a lot like about 100 yrs ago. That minimum was nothing compared to the Dalton or Maunder examples based on the radiogenic isotope records or SSN. The sun is periodic at the 11yr cycle and magnetic hale cycle that drives it, but the longer cycles that impact climate are not stationary through time and any composite periodicity is complex already. Thus, it is really not possible to predict like it is in the more periodic orbital parameters.

      Lesson learned, and I agree with you that the current moderate sun defines a new solar climate phase (leaving the long term max). I just have zero clue how to judge when the system has equilibrated so that the impact can be evaluated.

      Cheers,
      Aaron

  22. Cordilleran says:

    La Nina conditions have materialized. The running 3 month average for the NINO3.4 anomaly is -0.5C. That’s using ERSSTV4. For the other SST datasets it is probably cooler.

  23. doctor no says:

    Some fun with numbers.

    The linear trend (December 1978 to October 2016) is:
    +0.123 deg per decade (pd)

    12 months ago the trend was:
    +0.111 deg pd

    10 years ago it was:
    +0.149 deg pd

    How about we (conservatively) assume the trend stays about the same (+0.123 deg pd) into the medium-term future.
    After 10 years (i.e. in October 2026) the average UAH anomaly will be about +0.4 deg.
    Doesn’t sound much, does it?
    BUT, consider that this new AVERAGE equates to conditions only experienced briefly during 1998, 2010, 2013 and 2016 (look at Roy’s graphs).
    Also, an El Nino in 10 years time will most likely crack +1.0 deg – for which there is currently NO analog.

    AND THIS IS ONLY 10 years away!
    Feeling a bit nervous now?

    • Mike Flynn says:

      Not at all.

      How about we admit the future is unpredictable?

      Assumptions are fine. Occasionally, they come to pass.

      I’ll let you be nervous on my behalf. I don’t believe in the GHE, and so far it doesn’t seem to have any adverse consequences. Worry away, I’ll enjoy life for you, in exchange.

      Cheers.

      • doctor no says:

        I’m glad for you that you are not worried. Maybe you should seek help.

        ‘The ostrich problem is the idea that there are times when people would rather not know how they’re doing. Avoiding monitoring may allow people to escape from negative feelings associated with an accurate appraisal of progress’

        http://www.dailymail.co.uk/sciencetech/article-2525602/Burying-head-sand-Youre-feeling-guilty.html#ixzz4Oq7rJqGS

      • “How about we admit the future is unpredictable? ”

        That’s a little defeatist in a scientific context, as the only aim of scientific models, ultimately, is to make useful predictions. However, it’s also no salve for frayed nerves, as a simple statement of defeat does not tell us if the actual course of events will be better or worse than the doctor’s scenario.

        • Mike Flynn says:

          Elliott Bignell,

          You call it defeatis, I call it realistic.

          The GHE does not exist, any more than the ether, phlogiston, caloric or N rays.

          If your nerves are frayed by worrying about something that cannot be shown to exist, then you might care to apply a liberal portion of non existent salve. That should work.

          As you point out, nothing can tell you what the future holds, either for better or for worse.

          Worry away. I’ll just keep enjoying myself, whether you think I should or not.

          Cheers.

          • nt Bignell says:

            “The GHE does not exist”

            No even halfway-educated person could ever make this assertion. Only a month or so ago on this very blog I linked to a high-school level science experiment that demonstrates it.

            Even our very own Dr. Roy, about the last surviving sceptic within the field, is quite clear upon its existence. The most that can possibly be sustained is a residual hope that the effects of increasing it will not be as severe as forecast. But any such faith-based speculation is by definition at odds with the forecasts made by those working in the field. Not, therefore, a basis for rational decision-,making, which also by definition relies on the consensus of expert opinion and not on mere faith.

            “Ill just keep enjoying myself, whether you think I should or not.”

            The danger of science-denial in a nutshell.

          • AndyG55 says:

            “No even halfway-educated person could ever make this assertion”

            It is the half-way educated ones that do make that UNPROVEN assertion.

            You seem to be one of those.

            Now go back and get the other half of your education… because it is drastically LACKING.

      • Slipstick says:

        Mike Flynn,
        The operative word in your statement is “believe”, and it is this far too common belief, in the face of all evidence to the contrary, that is going to leave our descendants a global mess with which to contend.

        • Mike Flynn says:

          Slipstick,

          There is precisely no evidence to support your belief that the GHE exists. Every physical experiment using real gas, real IR, and real measuring instruments supports the radiative transfer equations – showing that gases absorb incident energy in varying degrees, and thus reduce the amount of radiation penetrating the gas. Sad but true.

          NASA’s figure for the atmosphere is that about 30% of the the insolation does not reach the surface. GHE enthusiasts invoke magical powers to claim that less absorbed radiation results in higher temperatures. Sorry, no magic allowed these days.

          If you choose to believe that you can peer into the future, bully for you! Be as despondent and depressed as you wish – you obviously enjoy it, otherwise you wouldn’t do it, would you?

          You may have noticed that nobody can actually provide a falsifiable GHE fypothesis – resorting to pointing out that gases can be heated, as if this is either new or relevant. Cargo Cult Scientism at best.

          Cheers.

          • Norman says:

            Mike Flynn

            Your claim: “NASAs figure for the atmosphere is that about 30% of the the insolation does not reach the surface. GHE enthusiasts invoke magical powers to claim that less absorbed radiation results in higher temperatures. Sorry, no magic allowed these days.”

            So Mike what do you speculate happens to the 30% of the solar energy directly absorbed by the atmosphere? You think it will do nothing? It will not end up warming the atmosphere (1st Law, energy does not disappear)? If it does end up adding energy to the atmosphere what do you propose then happens to IR active gases? What happens to radiant energy when a surface is heated? Does the radiant energy amount go up? Why would a different physics apply to the atmosphere? If the 30% insolation is absorbed it does not just “disappear” some will turn into increased temperature that will result in a higher emission of IR from the IR active gases present.

            Some of this energy will head towards the Earth’s surface which will absorb it, warm and then start emitting it as upward IR.

          • Slipstick says:

            “Peering into the future” is the entire point of science. A scientific theory, by definition, produces verifiable predictions. Actually, there is a falsifiable large-scale GHG experiment using CO2 currently in progress; the whole of the Earth is the testbed and its life forms the test subjects. The results so far? A positive correlation, albeit non-linear, at least in the short term, between atmospheric CO2 concentration and climate temperature does exist.

      • DHMacKenzie says:

        Mike, you keep saying there is no GHE. But that is the same as saying CO2 and water vapour do not absorb nor radiate infrared heat, an easily experimentally proveable fact. So pretty much like saying you don’t believe trees or rocks exist, you only prove you are not worth having a discussion with.

        • Mike Flynn says:

          DHM,

          No it’s not. Everything absorbs and radiates infrared. Everything. All matter will cool to absolute zero, if allowed to do so. All matter can be heated above absolute zero. All matter. No exceptions.

          No GHE. No increase in the temperature of anything heated by an external heat source, such as the Earth being heated by the Sun, just by surrounding it with gas of any sort.

          GHE supporters cannot provide any evidence of such a nonsensical proposition, so resort to stupidities such as “it’s the same thing as . . . “, or “it’s pretty much like . . . “.

          The Earth has cooled for four and a half billion years, and I’m assuming will continue to do so, until the interior is no longer molten.

          If you don’t want to accept reality, be my guest. If you don’t consider it worth your while to engage me in discussion, by all means, don’t bother.

          No falsifiable GHE hypothesis means no science. Cargo Cult Scientism at best.

          • David Appell says:

            Why are you asking for evidence? You ignore all of it. It’s the only way to maintain your facade.

          • Mike Flynn says:

            David Appell,

            No GHE. Not even a falsifiable GHE hypothesis, against which to judge observation and experiment. To a GHE believer, anything and everything is evidence of a GHE. Hot spells, cold snaps, flood, drought, famine, pestilence . . . , all due to the magical workings of the GHE.

            Unfortunately, not even a scientific GHE hypothesis that can be falsified. What a pity!

            Care to come up with something remotely resembling the scientific method? All reproducible scientific experiments to date, and all normal radiation theory (all those boring radiative transfer equation thingys) indicate that your beloved GHE is a delusion.

            If you had some theory and fact to support your unfalsifiable assertions, you might have produced them by now. But of course, you haven’t. Sorry, but I’ll continue to disbelieve the GHE, phlogiston, the indivisible atom, even unicorns! I’ll leave those for such as yourself. You can believe twice as hard on my behalf. That should keep both of us happy.

            Cheers.

          • David Appell says:

            Mike Flynn wrote:
            “To a GHE believer, anything and everything is evidence of a GHE. Hot spells, cold snaps, flood, drought, famine, pestilence . . . , all due to the magical workings of the GHE.”

            {chortle}

            “If you had some theory and fact to support your unfalsifiable assertions, you might have produced them by now.”

            You ignore all the evidence presented.

            But you don’t get to lie about it not being presented. That just makes you a liar.

          • DHMacKenzie says:

            Mike, The formula for heat transfer between parallel surfaces is standard course material for engineering and physics second year students. Do a search, many solved examples, course notes, etc.
            But bottom line is Nitrogen and Oxygen have zero emissivity at infrared wavelengths. But emissivity of water vapor, clouds,and CO2 is significant.
            If you were Arnold’s alien enemy, Predator, and looked up at a sky devoid of water and CO2, containing only O2 and N2, the sky would be seen to be 3 Kelvin. But because of the presence of clouds, water vapor, and CO2, the sky would appear to Predator to be about freezing for clouds and about -55 for open sky. This fairly warm sky temperature, relative to outer space, reduces the rate at which daytime solar energy absorbed by the ground and ocean, can be radiated to frigidly cold outer space.
            This means at ground level where we humans live, it is warmer with greenhouse gases in the atmosphere than without them. That is the GHE, Mike. End of story. Denial is futile.

          • DHMacKenzie says:

            Ahha, Mike does not believe in AGW, anthropogenic greenhouse warming, and is just misusing the acronym GHE green house effect.
            GHE exists, AGW as stated in the popular press is about 15% true and 85% fantasy by number of pages written (but that is just my opinion which like Mike I am allowed to be incorrect on)

          • David Appell says:

            Why would you want to hold an incorrect opinion??

          • AndyG55 says:

            “Why would you want to hold an incorrect opinion??”

            Irony at its best, seeing your IRRATIONAL belief in the AGW RELIGION.

        • Toneb says:

          ” So pretty much like saying you dont believe trees or rocks exist, you only prove you are not worth having a discussion with.”

          Yep.
          Then why bother.
          I don’t.

      • David Appell says:

        Mike Flynn wrote:
        “I dont believe in the GHE….”

        Funny (and telling) that you think it’s a matter of belief.

        It’s not.

        You only maintain your “belief” by refusing to consider data and evidence. Your position is really one of anti-intellectualism, of an opposition to knowledge itself.

        • Mike Flynn says:

          David Appell,

          You’re the believer. I don’t believe the GHE exists, any more than I believe in the existence of the luminiferous ether. You may even believe that Gavin Schmidt is not just a pedestrian mathematician, or that Michael Mann is a Nobel Laureate.

          I’m a non believer in nonsense. You may believe any fairytale you wish. It won’t make it come true, will it?

          Keep believing. Cargo Cult Scientism thrives on believers.

          Cheers.

          • David Appell says:

            The GHE isn’t a matter of “belief” — it’s a matter of science.

            Given the observational evidence for it, what is your evidence that there is no greenhouse effect?

          • AndyG55 says:

            Poor rotten-appell, you have yet to give even the slightest proof that CO2 causes warming in a convectively controlled atmosphere.

            Your irrational, anti-science BELIEF in you baseless RELIGION is all you have, isn’t it.

            Have you got those pictures of birds killed by coal fired power stations yet.

            Or are you going to MAINTAIN that LIE as well.

    • tonyM says:

      doctor no; the nervous nellie.

      On another thread he is nervous that the wrath of God is upon us saying;
      Speaking of the wrath of God, he/she may be getting ready to inflict another flooding/sea level rise event on us:
      referring mainly to sea ice melt.

      He is nervous that his God will change physics laws.

      He is nervous about an El Nino eventuating next based on his interpretation of SOI.

      Now he is nervous fiddling with some T data.

      Seems very much like a nervous wreck. Go hide under a bed, quick! The bed won’t collapse, promise!

      • doctor no says:

        “referring mainly to sea ice melt.”
        No, sea level rise is mainly caused by both thermal expansion plus the contribution from melting land-based ice (not sea ice).

        “He is nervous that his God will change physics laws.”
        I don’t think the above explanation violates any physics.

        “He is nervous about an El Nino eventuating next based on his interpretation of SOI.”
        No, I am simply pointing to model predictions for the NINO3.4 index.

        “Now he is nervous fiddling with some T data.”
        No, I am not fiddling with the data. Simply making a very basic interpretation of the data. If you think that is “fiddling”, then your scientific expertise is severely limited.

        “Seems very much like a nervous wreck. Go hide under a bed, quick! The bed wont collapse, promise!”
        Sometimes, when dealing with idiots, I get irritated – but never nervous.

        • tonyM says:

          doctor no:
          Are you writing from under your bed after looking up Wiki.

          This is the bulk of your prior post:
          Speaking of the wrath of God, he/she may be getting ready to inflict another flooding/sea level rise event on us:
          “The Northwest Passage, a mythical link through the Canadian Arctic between the Pacific and Atlantic until 1854, is now a viable commercial route. Until 2009, the Arctic pack ice prevented regular marine shipping throughout most of the year but the Arctic sea ice decline has rendered the waterways more navigable. Currently, the Arctic sea-ice extent shows a record low for late October, as calculated by the National Snow and Ice Data Center after measurements began by satellite measurements in 1979.
          The years Antarctic ice extent peaked very early, on August 31, and is now at its second-lowest value on record for late October, beaten only in 1986. ”

          October 31, 2016 at 4:16 PM

          I did suggest:
          You need help urgently; time to bypass Dr Lew and go straight to the top!

          You delude yourself if you believe your numeric fiddling of limited one off events is “very basic interpretation of the data.”

          You did conclude your post with:
          ” AND THIS IS ONLY 10 years away!
          Feeling a bit nervous now?”

          Sounds pretty much like a nervous nellie to me.

          • doctor no says:

            I am glad you agree that Arctic sea ice is declining.
            I am glad you agree that Antarctic sea ice is declining.
            I am glad you agree that UAH temperatures are increasing.
            I am glad you agree that surface temperatures are increasing.
            I am glad you believe in the laws of physics. These state that sea levels will rise due to thermal expansion and land ice melting.
            I assume you agree with the experts that sea level is rising (on average by 3 mm per year).
            I assume you agree that sea level rise will continue and accelerate over time.

            However, I conclude you are somewhat confused about what the future holds other than “everything will revert to “normal”. Please seek help.

          • tonyM says:

            doctor no

            As has already been put to you before it is not about what I think on these matters but rather what you have claimed. Now you presume to know what I specifically agree to which perhaps implies another mind reading gift from your God. Let’s cover the basics.

            Your other post verbatim:
            “Re failed La Nina.
            I have just noticed that the 30-day average SOI has gone negative for the first time in a long while.
            What are the odds of an El Nino next year?
            That thought will make the deniers nervous!”

            So it was very much about the SOI despite your emphatic denial of this above when you said “No, I am simply pointing to model predictions for the NINO3.4 index.” Wonder what your God makes of lies. I showed earlier in the other post your interpretation of BOM SOI to be garbage.

            Further one should note your reference to the all encompassing “THE DENIERS being nervous.”

            When challenged to name even one such denier who was nervous you decided to invoke God’s forgiveness and pretend to be a denier:

            “Secondly, If I was a (god forbid!) denier, I would be thinking at this moment: blah blah blah”

            Your God gives you these extraordinary powers to know what others think and feel yet you can’t produce one “denier.” Extraordinary reasoning but seems to be in line with your modus operandi.

            Your comment:
            “Speaking of the wrath of God, he/she may be getting ready to inflict another flooding/sea level rise event on us: etc etc”

            So your God now intervenes; CO2 is let off the hook. Whew that would likely call for being nervous. Physics laws have changed to God deciding when to intervene in physical changes. Theology is the new post normal physics and will no doubt become a prerequisite in all science courses.

            Not being as blessed as you I don’t pretend to have God given insights into the future. But such is your affliction that I repeat:
            You need help urgently; time to bypass Dr Lewandowsky and go straight to the top!

          • doctor no says:

            “I showed earlier in the other post your interpretation of BOM SOI to be garbage.”
            No you didn’t. There was no interpretation – only a stated fact that the 30-day average SOI value had gone negative.

            “… yet you cant produce one denier.
            I confess! I made it all up!
            There are no deniers!
            And if they existed, none of them would be nervous!
            Furthermore, none of them would be irritated!
            Are you happy now?

            “Physics laws have changed to God deciding when to intervene in physical changes.”
            Why are you so literal in your interpretations?
            Do you have a sense of humour?
            Where are you on the spectrum?

            Do you have any scientific points to make?

          • tonyM says:

            You can’t help yourself, can you? You just keep doing it. Denial about what you wrote in keeping with your being a true denier of facts.

            Now I could say you have a great propensity to lie or to being logically incoherent or both but gave you the benefit of the doubt that you are simply afflicted by an extreme case of Cognitive Dissonance (CD).

            Hence I previously called you out as Dr No thy name is CD. I thought your affliction could be handled by Dr Lew part of your three amigos grouping and expert who wallows in CD himself.

            But alas, you are way beyond his help hence I said and repeat:
            You need help urgently; time to bypass Dr Lew and go straight to the top!

            It may be too late!

    • sky says:

      There’s nothing “conservative” about assuming that the LSE trend estimated from the beginning of a relatively short record will stay “about the same in the medium-term future.” That would be the case only if the underlying process lacked oscillatory components longer than a small fraction of the record length. That clearly is not what measured or proxy temperature records show. Therefore the conclusion about temperatures “10 years away” rests upon a foolish assumption.

      BTW, even now El Nino anomalies persistently crack 1.0K in the tropical Pacific.

      • Dr No says:

        Wrong on two counts:
        (1) a linear trend can be meaningful if the oscillatory components are small compared to the entire record length. For example, the stock market.
        (2) “El Nino anomalies persistently crack 1.0K in the tropical Pacific”
        I am referring to the UAH temperature anomalies, not to surface temperature anomalies in the Pacific.

    • AndyG55 says:

      Straight through the El Nino steps.. confirming YET AGAIN that those El Nino steps are required to give any warming.

      When will you BOZOS ever learn that by doing that, you continue to prove that the ONLY warming in the satellite record is REGIONAL effects due to EL Nino and ocean oscillations.

      So thanks for doing it yet again..

      May the Shwartz be with you.

      If the next El Nino is 10 years away, the temperature will have dropped considerably by then.

      That COOLING is the main thing to worry about.

      WARMING + EXTRA aCO2 = VERY GOOD

      COOLING = BAD.

      • Dr No says:

        “.. the ONLY warming in the satellite record is REGIONAL effects due to EL Nino and ocean oscillations.”
        Good. Firstly, you admit there is warming in the satellite record.
        Secondly, by your reasoning, the next El Nino (and the one after that, and the one after that..) will contribute more warming. You can call it El Nino-induced warming if you like – others prefer to refer to it at greenhouse-induced warming.

        “If the next El Nino is 10 years away, the temperature will have dropped considerably by then.”
        Where did you dream this?

        • AndyG55 says:

          “Firstly, you admit there is warming in the satellite record.”

          Yes.. but ONLY from SOLAR forced El Nino and ocean effects.

          CO2 has ABSOLUTELY NOTHING to do with it

          You know that, but are too embarrassed to admit that you have been CONNNED.

          NO, the next EL Nino will be a transient only, just like the present one.

          You will figure it out eventually, Mr know-nothing

        • AndyG55 says:

          People who call the EL Nino warming step, greenhouse effects, are TOTALLY IGNORANT

          You appear to be one of those.

          But we have known that for a long time.

        • AndyG55 says:

          Poor mr know-nothing.. do you know that by equation El Nino to greenhouse effects, you have ANNOUNCED you ABJECT IGNORANCE to EVERYBODY reading this blog.

          Well done, BOZO !!

          Dr of barista is about all you are fit for, although I doubt you could manage even that.

          • doctor no says:

            Calm down.
            You are heading for a heart attack.

          • AndyG55 says:

            Is that all you have, and a low-level mock.

            PATHETIC as usual.

            You are an EMPTY MIND, with nothing to offer to anyone.

            And deep inside… you KNOW it.

          • doctor no says:

            You remind me of this Monty Python sketch:

            A man walks into an office.

            Man: (Michael Palin) Ah. I’d like to have an argument, please.

            Receptionist: Certainly sir. Have you been here before?

            Man: No, this is my first time.

            Receptionist: I see. Well, do you want to have the full argument, or were you thinking of taking a course?

            Man: Well, what would be the cost?

            Receptionist: Well, It’s one pound for a five minute argument, but only eight pounds for a course of ten.

            Man: Well, I think it’s probably best if I start with the one and then see how it goes from there, okay?

            Receptionist: Fine. I’ll see who’s free at the moment.

            (Pause)

            Receptionist: Mr. DeBakey’s free, but he’s a little bit conciliatory. Ahh yes, Try Mr. Barnard; room 12.

            Man: Thank you. (Walks down the hall. Opens door.)

            Angry man: WHADDAYOU WANT?

            Man: Well, Well, I was told outside that…

            Angry man: DON’T GIVE ME THAT, YOU SNOTTY-FACED HEAP OF PARROT DROPPINGS!

            Man: What?

            A: SHUT YOUR FESTERING GOB, YOU TIT! YOUR TYPE MAKES ME PUKE! YOU VACUOUS TOFFEE-NOSED MALODOROUS PERVERT!!!

            M: Yes, but I came here for an argument!!

            A: OH! Oh! I’m sorry! This is abuse!

            M: Oh! Oh I see!

            A: Aha! No, you want room 12A, next door.

            M: Oh…Sorry…

            A: Not at all!

          • Nate says:

            Andy

            What’s with all the insults? They serve no purpose in convincing anyone here. Stick to science and logical arguments, please.

          • AndyG55 says:

            Poor mr-no-science goes on a moronic ADHD rant resembling a 5 year old tantrum. 🙂

            Well done , mr- no-science… your true nature revealed.

          • AndyG55 says:

            Nate. you should make that comment to mr-no-science

            Do your REALLY want to be put in the same slimy basket as him and the rotten appell..

            Surely you have more brains than that.

            Oh wait.. I just read some of your other posts.

            Poor boy.

            You have marked yourself, as a GULLIBLE TWERP.

          • Nate says:

            Andy,

            You really got me with that clever retort.

            As many have pointed out before, resorting to insults means that you have nothing intelligent left to say:

            Personal insults are the last refuge of the intellectual coward. ~Rabbi Shmuley Boteach.

            Personal insults are the last resort of exhausted minds. ~Pat Buchanan

            “Insults are the last resort of insecure people trying to appear confident in their weak position.” ~Pastor Rick Warren

            “Insults are the last refuge of the out-argued.” ~Unknown

            “When the debate is lost, slander becomes the tool of the loser.” ~Socrates

            When You Resort To Name Calling, Youve Lost The Argument,

            Anthony Watts

  24. ren says:

    Snow cover in the northern hemisphere on 1 November.
    http://www.natice.noaa.gov/pub/ims/ims_gif/DATA/cursnow.gif

  25. Massimo PORZIO says:

    fonzarelli said:
    “Barry, have you ever turned the flame down on a kettle of water? Did the kettle of water continue to warm?”

    David Appell replied:
    “Depends on the settings. At some settings, of course it can continue to warm.”

    Interesting David, which conditions are you arguing about?
    Fonzie had a kettle of water and reduced the input energy by just turning down the flame, what’s your point?

    Have a great day.

    Massimo

    • Any setting where the input of heat energy from the reduced flame exceeds the rate of heat loss due to boiling water, conduction and so forth, one presumes.

      • Massimo PORZIO says:

        No Elliott,

        I don’t think fonzie was arguing about a non thermal equilibrium kettle of water, but I realize that David could have interpreted his message this way.

        Have a great day.

        Massimo

        • fonzarelli says:

          Hi Massimo, long time no see… Mine were just rhetorical questions to which i didn’t expect answer (at least not like david’s). Barry got my point and that’s about all that i was looking for.

          Say, i’ve always been somewhat curious, is the pope’s overt stance on agw a big (or at least bigger than elsewhere) deal in Italy? i think he’s got a lot of nerve telling scientists not to be skeptical. What with all that galileo thing et al. (from here it sounds almost like he’s ready to lop off a few heads! ☺) Good thing we don’t live in medieval times…

          • David Appell says:

            “i think hes got a lot of nerve telling scientists not to be skeptical.”

            Scientists are the most skeptical people on the planet. That’s why so many ridiculous ideas get no traction — and why, when scientists do figure things out, all the ideas our technologies operate on, those technologies perform miracles.

          • fonzarelli says:

            “That’s why so many ridiculous ideas get no traction”

            Your kidding right? Ever heard of a false paradigms? (like the incredible edible egg)?

          • Massimo PORZIO says:

            Hi Fonzie,
            the Pope is no longer so influent on the Italians, not the majority at least.
            I think he is a good man and he does and tell what he feels good for the poorer of the planet, but sometimes being honest but ignorant, leads to more damages than being trickster and skilled.

            Have a great day.

            Massimo

          • fonzarelli says:

            yeah, maybe he ought just stick to poping…

          • Norman says:

            Massimo PORZIO

            Are the earthquakes in Italy a normal thing or is the underground getting more active?

          • Massimo PORZIO says:

            Hi Fonzie,
            I fully agree with you.

          • Massimo PORZIO says:

            Hi Norman,
            Oooh! Good answer is your.
            I live in the north-west in the Padana valley where the underground is made of sediments of the river Po, almost sand and gravel. This made this area very safe against earthquakes.
            The central and south parts of Italy instead is the result of surfacing of land because of two tectonic plates movement. The adriatic plate moves westward while the eurasian plate is moving eastward pushed up by the african plate. Which partially explain why the north-east is not so safe as where I live despite the underground is almost the same.

            So, about your question, yes except for the north-west of Italy most of the other parts of my country is usually subject to earthquakes. I have a friend who have a seismograph, and said me that practically every day we experience at last one earthquake of magnitude 2 (Richter scale).

            Here is our national earthquakes center report from april 2005, it reports 36065 earthquakes till now (is updating so maybe that when you read it this value is grown more).

            http://cnt.rm.ingv.it/events?starttime=2016-10-28+00%3A00%3A00&endtime=2016-11-04+23%3A59%3A59&last_nd=0&minmag=2&maxmag=10&mindepth=-10&maxdepth=1000&minlat=-90&maxlat=90&minlon=-180&maxlon=180&minversion=100&limit=50&orderby=ot-desc&tdmt_flag=-1&lat=0&lon=0&maxradiuskm=-1&wheretype=area

            Have a great day.

            Massimo

  26. Man, I’m SO glad we had mpainter around to tell us that this couldn’t happen! What would we do without an expert?

    No snow below 2,000m around here for the whole last month. There has been a dusting on and off above 2,000m on the Pizol and Chserugg, which is about right for October. Another expert to thank there, although I can’t remember who it was that said it would snow down to 1,000m.

    Someone thank him for me. I needed the entertainment.

  27. Dr. Mark H. Shapiro says:

    OMG Dr. Roy’s prediction of record-breaking cooling following the end of El Nino has fizzled. Oct. 2016 just as warm as Oct. 2015. Could it be the dreaded global warming genie?

    • barry says:

      No. Not possible. It’s not warming. It’s cooling. We are about to see cooling. CO2 isn’t a GHG. It’s a trace gas. We’re not causing its increase in the atmosphere. It’s a minuscule amount compared to the annual flux. It’s 0.012% change. It is too small a change to affect anything. It’s greening the planet. More CO2 will save the poor in Africa. Sea level isn’t accelerating, and it is rising only as fast as the data set which shows the slowest rise and won’t get any quicker. And that has nothing to do with CO2. It’s the sun. It’s step-changes. It’s clouds. It’s galactic cosmic rays. It’s the AMO. It’s the PDO. It’s el Nino. It’s gravity. It’s the orbital variation of other planets.

      It’s ABC.

      • Mikey says:

        Wow Barry – you nailed it. Virtually any random argument in favour of denialism goes. And of course, those arguments which conflict with each other will never actually cause any sort of debate. Deniers basically see each other as allies, no matter how much they agree with each other. Warming due to natural causes is somehow consistent with global cooling, and so on.

        Also you forgot – It’s cold in Siberia!

      • AndyG55 says:

        “CO2 isnt a GHG. Its a trace gas”

        FINALLY, the Swartz has awoken to the truth. !!

        Well done !!

        Hold your Swartz, its all you have, barry.

      • AndyG55 says:

        “Its greening the planet.”

        YES.. Finally a glimpse of REALITY enters the Swartz.

        Hold it Swartz… its your first glimpse in many a year. !!

        https://s19.postimg.org/acl8ewfqr/CO2_green_p_LANET.jpg

      • barry says:

        Well I learned that Andy has a) clinically tight blinders, or b), is playing for points, not for understanding.

  28. Dan Pangburn says:

    It is amazing that, although it is commonly understood that the presence of water vapor has made the planet warm enough for life, instead of realizing that the steadily rising water vapor has contributed to global warming and is now countering global cooling, it is blamed on CO2 which has no effect on climate.

    • Toneb says:

      WV is a condensing gas.
      It condenses and precipitates out of the atmosphere with the average life of a H2O molecule ~10 days.
      The hydrological cycle.
      What is it that regulates the absolute humidity of the atmosphere?
      Temperature.
      Without rises in temperature there can be no more WV present (on average).

      What would happen if there were just condensing GHG’s in Earth’s atmosphere?
      Go on have a go.
      Given that you accept that GHG’s cause the Earth to be ~33C hotter than would be the case due absorbed TSI alone.
      How would WV be able to stay as a gas in the atmosphere?
      What would prevent it from precipitating out as snow and eventually the surface water freezing to further prevent evaporation with continued cooling taking place.
      Say, in places where little WV is present (Vis: deserts Antarctica).
      What is it that prevents the interior of Antarctica from plummeting toward absolute zero FI?

      There MUST be a floor to prevent the freezing process from being reached (on a global scale).
      It is the no-condensing GHG’s (principally CO2) that stop that from occurring.

      https://chriscolose.files.wordpress.com/2010/03/lacis_etaal.jpg

      “Time evolution of global surface temperature, TOA net flux, column water vapour, planetary albedo, sea ice cover, and cloud cover, after zeroing out all of the non-condensing GHGs. From Lacis et al (2010)”

      • Mike Flynn says:

        Toneb,

        Maybe there’s more to humidity than temperature.

        The arid tropical deserts have very high temperatures.

        The Antarctic has very low temperatures.

        Both have very low humidity.

        As a matter of interest, temperatures in the Antarctic fall below the freezing point of CO2. No plummeting towards absolute zero. Maybe the fact that the Earth is >99% molten rock and iron might explain why a surface of absolute zero is a physical impossibility, even without the Sun.

        Still no GHE. Not even a falsifiable GHE hypothesis, Strange, isn’t it? Billions spent to avert the disastrous effects of something that doesn’t actually exist.

        Cheers.

        • David Appell says:

          Still avoiding the hard and relevant questions, I see. That’s always the Mike Flynn way, and all it ever is.

          • Mike Flynn says:

            David Appell,

            If you had a hard or relevant question, I’d be amazed.

            All you’ve shown to date is an endless stream of mindless attempts at “gotchas”, a bizarre belief that you can increase the temperature of a bottle of water by wrapping it in an overcoat, and so on.

            There is no GHE. If you knew the location of a falsifiable GHE hypothesis, I assume you’d provide it, to the delight of the assembled GHE handwavers. Neither Gavin Schmidt, Michael Mann or James Hansen have ever managed to put forward any scientific explanation for the supposed increase in temperature resulting from providing less energy to an object.

            Is your PhD in physics like Michael Mann’s Nobel Prize? Or are you just too modest to use the hard earned appellation of Dr?

            I’m surprised, given your qualifications, that you dismiss the normal requirements of the scientific method so lightly. Cargo Cult Scientism, based on wishful thinking rather than fact, is not usually an effective way of increasing human knowledge.

            I see why you chose scribbling for a living. The world is obviously not ready for a physicist of your peerless brilliance, I suppose.

            Keep it up. A good laugh never hurt anybody!

            Cheers.

          • David Appell says:

            Still avoiding direct questions. It’s the Mike Flynn way.

          • David Appell says:

            Mike Flynn wrote:
            “Neither Gavin Schmidt, Michael Mann or James Hansen have ever managed to put forward any scientific explanation for the supposed increase in temperature resulting from providing less energy to an object.”

            {snigger}

            You misunderstand the science, and then you denigrate others based on your misunderstanding.

            Classic Flynn.

          • AndyG55 says:

            “Still avoiding direct questions.”

            That’s HILARIOUS coming from you rotten-appell

            You really are a sick-minded little Chihuahua. !!

            No pictures of birds killed by coal fired power stations

            YOU ARE A LIAR who cannot back up anything you say with any real evidence,..

            you just RUN and HIDE. !!

          • David Appell says:

            See how Mike Flynn avoids questions?

          • AndyG55 says:

            RUN and HIDE rotten appell, you pathetic little grub. !

      • Dan Pangburn says:

        Ton – It is egregious that so many have been misled by that. Water vapor is by far the most important greenhouse gas. It is driven from the liquid into the atmosphere by its vapor pressure which increases exponentially with the water temperature. The process is called evaporation.

        • David Appell says:

          This is why scientists say, “water vapor is a feedback, not a forcing.”

          • AndyG55 says:

            Still RUNNING and HIDING hey, rotten appell..

            Are you so INCOMPETENT that you cannot produce one single thing to back up ANYTHING you refer to ??

            Don’t answer that,… everybody KNOWS you are.

          • Dan Pangburn says:

            Vapor pressure does not go to zero if there is no CO2 around. Every credible scientist knows that.

          • David Appell says:

            “Vapor pressure does not go to zero if there is no CO2 around.”

            No one ever said it did. I certainly didn’t say that.

            CO2 creates leading warming. Only with a positive temperature change can water vapor increase — at our present point, about 7% per 1 deg C of warming.

            Again, go learn the Clausius-Claperyon equation.

          • Dan Pangburn says:

            DA – Again, you obviously do not know what the Clausius-Clapeyron equation is about . . . and are too stubborn to find out.

          • Dan Pangburn says:

            DA – Water vapor increase, nearly all from irrigation, initiates the contribution to warming associated with water vapor. CO2 has no significant effect.

            If you were not too stubborn to look, you would find the links to the NASA/RSS data at Ref 11 in my blog.

          • David Appell says:

            Dan Pangburn says:
            “DA Water vapor increase, nearly all from irrigation, initiates the contribution to warming associated with water vapor….”

            So you won’t go learn the Clausius-Claperyon equation.

            Like with Mike Flynn, this kind of refusal to confront facts and established science is essential to the more vacuous forms of climate change denial, like yours.

            You are the essence of anti-intellectualism.

    • Toneb says:

      Mike Flynn:
      I note that you posted *something* in response to my post (in reply to Dan Pangbourn).
      As I’ve said to you elsewhere you are more than welcome to do so, as your hand-waving Sky-dragon slaying bollocks is most helpful in reflecting onto and eroding credibility amongst the wider *contrarian* faithful.
      Do keep it up.
      However, as I’ve also told you, I prefer to remain above ground where both science and my sanity can be found and assured.
      I leave you to your rabbit-hole.
      IOW: I do not read you *comments*.
      As you would say (I see that).
      Cheers.

      • Mike Flynn says:

        Toneb,

        Thank you for inviting me to respond to your posts. I appreciate your support, and I’ll do my best to keep it up, as you request.

        Unfortunately, your GHE passion doesn’t seem to be supported by real science.

        Just continued assertions that GHGs have magical planet heating properties. Apparently, they can’t heat anything else, and only increase temperatures in the presence of bright sunlight. As soon as a cloud obscures the Sun, the GHE seems to stop working.

        It doesn’t appear to have much effect indoors, in the shade, or at night, either.

        But keep believing. I’ll keep not believing, and waiting for some sign of science from the GHE believers.

        Cheers.

        • David Appell says:

          Mike Flynn wrote:
          “Apparently, they cant heat anything else, and only increase temperatures in the presence of bright sunlight. As soon as a cloud obscures the Sun, the GHE seems to stop working.”

          {snicker}

        • b fagan says:

          Something else for Mike to ignore

          First Direct Observation of Carbon Dioxides Increasing Greenhouse Effect at the Earths Surface
          Berkeley Lab researchers link rising CO2 levels from fossil fuels to an upward trend in radiative forcing at two locations
          FEBRUARY 25, 2015

          http://newscenter.lbl.gov/2015/02/25/co2-greenhouse-effect-increase/

          This was the press release, there’s a paper in Nature.

          • Mike Flynn says:

            “The influence of atmospheric CO2 on the balance between incoming energy from the Sun and outgoing heat from the Earth (also called the planets energy balance) is well established. But this effect has not been experimentally confirmed outside the laboratory until now. The research is reported Wednesday, Feb. 25, in the advance online publication of the journal Nature.”

            So the surface heats up in sunlight, and cools at night.

            Gee. Who’d have thought such a thing?

            Well established? Shared delusions, contradicted by every experimenter from Tyndall onwards. You’ll notice that sciencey terms like “radiative forcing” only appear in so-called climate “science”.

            I don’t ignore the fact the Earth has cooled for four and a half billion years. GHE enthusiasts can’t seem to accept this simple fact. They just ignore inconvenient truths.

            Correlation is not causation. Without a falsifiable GHE hypothesis, all you have is hope and faith. I might point out that the IPCC accepts that the most important GHG is supposedly H2O. What about the H2O that results when a hydrocarbon is burnt? Unimportant? Only CO2 counts?

            No GHE. just more fantasy.

            Cheers.

          • David Appell says:

            Mike Flynn wrote:
            “Well established? Shared delusions, contradicted by every experimenter from Tyndall onwards.”

            Which experimenters?

            Name 3, and their relevant studies.

          • David Appell says:

            Here’s the paper in Nature:

            “Observational determination of surface radiative forcing by CO2 from 2000 to 2010,” D. R. Feldman et al, Nature 519, 339343 (19 March 2015)
            http://www.nature.com/nature/journal/v519/n7543/full/nature14240.html

          • Mike Flynn says:

            David Appell,

            Demands, demands, and yet more demands!

            Foolish fellow. Maybe you might care to read Tyndall’s publications first.

            I’m not sure why you demand that I provide you with things three at a time, in the format you demand, but I suspect you might be looking for a “gotcha”, rather than knowledge.

            If you disagree with Tyndall’s results, please provide details. If you can’t, details of other experiments supporting Tyndall would appear to be superfluous.

            Facts are not decided by consensus, or democratic vote. Apart from Cargo Cult Clinatological Scientism, that is.

            Keep those demands going! I’ll keep ignoring them, even if you get upset.

            Cheers.

          • David Appell says:

            Mike Flynn, again avoiding any and all questions.

            You’re fearful of confronting the science. It might get in the way of his dogma.

          • Mike Flynn says:

            David Appell,

            You make demands, and then try the foolish Warmist tactics of deny, divert, and confuse, when I decline to participate in your fantasy.

            You believe in a non existent GHE.

            For all I know, you might consider Gavin Schmidt a first rate scientist, and probably believe that Michael Mann received a Nobel Prize.

            You persistently demand some sort of “proof” that the non falsifiable GHE is, indeed, false. This is why science requires a falsifiable hypothesis to examine. Of course, you have nothing except never ending attempts to bend others to your will.

            Keep up the assertions and hand waving. More and more real scientists are abandoning the Ship of Fools. I suppose you want a list? Google has several – it’s not my fault if you’re too lazy to look!

            Cheers.

          • David Appell says:

            Mike Flynn, why won’t you answer even simple, direct questions?

            You avoid any and all challenges to your claims, and then insult those who ask them.

            Why do you do this?

          • Toneb says:

            “Why do you do this?”

            David, I don’t know why it s you do not realise this, but …

            It’s called Trolling.
            And you’re feeding him.

          • Mike Flynn says:

            David Appell,

            What is this simple direct question to which you seek an answer, because you wish to increase your knowledge?

            Or are you just asking rhetorical questions in a bizarre attempt to proclaim your lack of knowledge?

            Do you deny that the Earth has cooled over the last four and a half billion years? Do you deny that the Earth is still more than 99% molten? Do you deny that the surface heats in sunlight, and cools in its absence?

            Of course not!

            You twist and squirm, and attempt to deny, divert and confuse, as far as I can see.

            Correlation is confused with causation by such as James “Death Trains” Hansen, Gavin “CO2 knob” Schmidt, and Michael “I really deserve a Nobel Prize” Mann. These may be your heroes. Obviously, I prefer real science to RealClimate Scientism.

            Still no planet heating properties listed for CO2 in an experimentally supported list that I know of.

            No GHE. Not even a falsifiable hypothesis proposing such a silly thing.

            Cheers.

          • David Appell says:

            Flynn is willfully blind, of necessity:

            “Observational determination of surface radiative forcing by CO2 from 2000 to 2010,” D. R. Feldman et al, Nature 519, 339343 (19 March 2015)
            http://www.nature.com/nature/journal/v519/n7543/full/nature14240.html

            Press release for Feldman et al: “First Direct Observation of Carbon Dioxides Increasing Greenhouse Effect at the Earths Surface,” Berkeley Lab, 2/25/15
            http://newscenter.lbl.gov/2015/02/25/co2-greenhouse-effect-increase/

  29. argus says:

    Seeing you guys argue is overwhelming. It’s like one big Trump/Clinton fest all the time. I am not an -ogist of any sort, I j but here’s what makes sense to me.

    Pro – You can’t change the environmental mix without the environment changing. Unintended consequences happen all the time, why would the environment function any differently? Increased warmth would even make sense from a worldwide Manifest Destiny perspective.

    Con – Perhaps you’ve heard the entire population of the Earth, given 2 sq ft each, could fit into Duval County (Jacksonville). Regardless, we’re big but yet much smaller than we conceive. It’s a stretch that such a limited group could cause such an enormous shift in climate as is being predicted.

    Ultimately, the -ogists I trust say something like, “it’s conceivable man has attributed to global warming, probably from Industrialization”. One of those guys, if I understand correctly, happens to Dr Spencer.

    • David Appell says:

      This is exactly the kind of hand-waving stuff that is, frankly….absolutely useless and meaningless.

      It’s OK not to know enough to have an infored opinion. But don’t make up reasons pretending to.

      • AndyG55 says:

        Speaking of your VACUOUS HANDWAVING, rotten appell…

        Have you got pictures of those surface stations yet?

        have you got pictures of birds kill by coal fired power stations yet?

        Or are you going to continue to RUN and HIDE like the vacuous sci-fantasy non-entity that you are.

        ——–

        And seriously? you talking about informed opinions, is like a Chihuahua barking at a Bull Mastiff.

      • Lewis says:

        David,

        I noticed you are trying to hold Salvatore to his exact quote. Do you also hold the (C)AGW advocates to their exact predictions? Since we know the answer is no: please explain why?

        Happy Thanksgiving

        • David Appell says:

          What does “catastrophic” mean? It isn’t a scientific term.

          And what predictions?

          • AndyG55 says:

            It means baseless rant of the sort you and your alarmist mates keep putting to press in moronic anti-science headlines.

          • Lewis says:

            David,
            While you’re being obtuse – the predictions of increasing temperatures in line with increasing CO2. The predictions are very specific – You can look them up. You look up or have saved Salvatore’s prediction, surely you can look up the text of your religion.

            Otherwise….

            Let me be more specific. Proving your genes are related to a donkey is not something the rest of us need to be reminded of, but, since you insist, we’re reminded.

          • David Appell says:

            Lewis, again, what predictions are you thinking of?

            Climate models aren’t even capable of predictions. Only projections.

          • Lewis says:

            David:

            From M Webster:

            Projection: estimate of what might happen in the future based on what is happening now

            Prediction: a statement about what will happen or might happen in the future

            David, while being obtuse, you’re also pretending intelligence – pretending that the difference between the words projection and prediction is enough to avoid answering the question.

            Seriously David, for all your book learning you just ain’t that smart. You’re not even very good a being a SA.

            So, did your mother pick your name from your initials?

          • David Appell says:

            Lewis, for the third time, what predictions are you talking about?

            You can’t even link to them?

            Do you still not understand that climate models don’t make predictions?

      • argus says:

        David you in no way spoke to my points. Give me your non-argumentative counterpoints, give me something reasonable to think about if I’m in left field. Otherwise, you’ll continue to be ignored.

  30. AndyG55 says:

    Roy, do you know when the full data set at http://www.nsstc.uah.edu/data/msu/v6.0beta/tlt/
    will be available?

    Thanks for your continued great work.

    • doctor no says:

      DONT GIVE ME THAT, YOU SNOTTY-FACED HEAP OF PARROT DROPPINGS!
      (see my post above for context)

      • AndyG55 says:

        Poor mr no-science.

        You still don’t know anything, do you

        EMPTY and PATHETIC are the only words to describe your posts.

      • AndyG55 says:

        Let me guess, you are TILL aching from being shown up as an IGNORANT MORON last time about the full set of numbers.

        But it is so, so easy to show you up as an ignorant moron.. …. heck, you do it yourself with your every post.

    • AndyG55 says:

      ZERO context.. EMPTY baseless ranting is all you have, mr no-science.

      • doctor no says:

        YOUR TYPE MAKES ME PUKE!

        (let’s face it, you enjoy this banter don’t you?)

        • Norman says:

          AnydG55 and doctor no

          You two may be having a barrel of laughs with your posts but they do degrade the scientific content of this blog. It is okay to disagree with each other but the barrage of insults does nothing for either of your respective cases.

          • doctor no says:

            I agree.
            Except that AngryG55 has never provided any scientific content to this blog – only abuse.

          • Norman says:

            doctor no

            I am currently researching the available data from the CERES source page and I would like you to explain where is the signal that the 8% increase in Carbon Dioxide is the cause for a warming globe.

            https://ceres-tool.larc.nasa.gov/ord-tool/jsp/EBAFSFCSelection.jsp

            I have the spacial resolution set for the globe. You click on the tab at bottom “Visualize Data”.

            On the graph page that pops up scroll down to “Surface Net Total Flux All-sky” and click on a graph to bring up another pop-up. On this pop-up click on the “Area Average Time Series” to see the graph from 2000 to 2015. The energy (shortwave up and down as well as longwave up and down) shows no increase and even a little decrease.

            I can’t directly link to the graph as it just gives and error message but going through these steps will lead you to the graph I am talking about.

            Since the radiant budget is not the cause for the continued warming as seen in the GISS graphs (Roy’s shows warming from El Ninos where the ocean warms the air during its cycle and that is the source of the warmer global temperatures) then you would need to consider that something is changing the evaporation rate or thermals leading to a warmer surface measurement but not an enhanced GHE.

        • Norman says:

          doctor no

          Looking at the GISS data.

          http://data.giss.nasa.gov/gistemp/graphs/

          They have the globe (water and land) increasing from 0.42 C above in 2000 to 0.87 C above in 2015. A 0.45 C increase in 15 years.

          This would result in a need for 2.45 W/m^2 extra energy to maintain this higher temperature.

          I do not see such an increase in the total surface flux of the CERES data.

          If GISS data is valid (Tony Heller at RealClimate science often brings up how NASA graphs keep changing to show an increase of warming via some unknown adjustment process) then the change in the energy would be in the other mechanisms that remove surface energy, less evaporation by a couple watts or a decrease in loss by thermal energy. I do not see the evidence to suggest an increase in radiant energy is causing the warmer surface.

          • Norman says:

            doctor no

            From the Tony Heller blog (RealClimate Science)

            This graph:
            http://realclimatescience.com/wp-content/uploads/2016/11/Screen-Shot-2016-11-03-at-3.11.18-AM.gif

            The satellite graphs match what CERES shows, GISS does not.

            Why?

          • David Appell says:

            Norman, have you read GISS’s papers over the years to keep up with their adjustment process?

            I’m sure Tony Heller hasn’t.

          • Norman says:

            David Appell

            No I have not looked at the latest GISS papers. I read one a few years back concerning Urban Heat Island effect. I have personal observation to know this is a very real effect and it is quite large. If they weigh the city temperature and move up the surrounding temps then they are wrong. The onboard thermometer of the vehicle I drive will rise 3 F most days and nights from country to city and even more in winter. I have witnessed temperature rise from -2 F outside the city to up to 8 F within the city.

            If you have a chance check the link to the CERES data and look at the total surface net flux all-sky and explain where the needed 2+ watts/m^2 exist to explain a warmer continuous temperature. An El Nino increase is only a temporary temperature rise with a warmer ocean surface heating the atmosphere above which drops rapidly after the initial effect. A continuous rise in temperature would require an increase in energy received by the surface (or a decrease in the energy leaving). If the GISS data is valid the culprit to explain the rise they demonstrate would not be radiant energy inbalance but the result of either thermals or evaporation not removing as much energy as they did in the year 2000 vs 2015.

  31. Bindidon says:

    A somewhat unusual view on our planet…

    Activate the two following links (Nick Stokes’ wonderful globe plot facility, and a gridded temperature dataset), e.g. in Chrome or Firefox

    https://s3-us-west-1.amazonaws.com/www.moyhu.org/maps/webgl/grid.html

    http://m.uploadedit.com/ba3s/1478209143722.txt

    in a tab each, copy the whole text from the second one, paste it into the “Data” field, and click on “Plot new”.

    Any idea of what it might be?

  32. John Hurley says:

    Hyperbole much?

    When science is done in the open, it allows a lot more peers to engage in review. It simply pulls back the curtain on the process.

    • Nigel Harris says:

      When science is done in the open, it allows a lot more people with no relevant knowledge and experience, many of whom are strongly motivated by opinions or views that are not necessarily supported by facts, to engage in review.

      There, I fixed it for you.

      Peer = someone of similar standing or knowledge.

      • David Appell says:

        So you’d prefer to restrict who can see and read scientific studies and data??

      • AndyG55 says:

        “it allows a lot more people with no relevant knowledge and experience, many of whom are strongly motivated by baseless opinions”

        Well done, you have described the rotten-appell to a tee.

        The appell grub is NOTHING but a low end sci-fantasy writer for a stagnant, putrid, backwater rag.

  33. Bindidon says:

    The intellectual level of commenters like AndyG55 is simply amazing.

    Has http://www.drroyspencer.com recently been acquired by Rupert Murdoch?

    • AndyG55 says:

      “The intellectual level of commenters like AndyG55 is simply amazing.”

      Thank you, at age 11, my IQ was measured as off the top of the charts.

      Yours is, as expected from an AGW cultist, in the two digit range.

    • barry says:

      Amazing coincidence. So was mine (152). As an adult I’ve dismissed the result as an easy test. It was mainly pattern recognition, after all, general knowledge not really featuring at that age.

  34. barry says:

    La Nina tracking:

    NOAA‘s ONI index (SSTs NINO3.4 region) has been beyond la Nina thresholds for 3 months, and for 2 consecutive ‘seasons’ (any 3-month period). La Nina is called with 5 consecutive ‘seasons (or 6 straight months of three-month averaged la Nina conditions).

    Halfway to full blown la Nina for NOAA. They predict 70% likelihood of this occurring over the next few months, and 55% chance of Nina persisting to 2017.

    Australia’s Bureau of Meteorology shows cool but ENSO-neutral conditons – BoM has a higher bar for ENSO events than NOAA. The Southern Oscillation Index moved into ENSO neutral territory mid-September, having been in la Nina profile from early August. Now sitting close to el Nino thresholds.

    BoM always cites 8 international climate models. The average of these favour ENSO neutral conditions till next year, but 2 models (NOAA and JMA) give likelihood of weak la Nina over Christmas into early 2017.

    JMA considers that la Nina conditions (SSTs NINO3 region) are present, and that weak Nina conditions are 60% likely to remain over Christmas, heading to neutral by March 2017.

    • barry says:

      NOAA’s update is from October 31. BoM is due to update in a couple days time, and JMA will update on the 10th Nov.

  35. barry says:

    RSS just released the global TLT anomaly. Where UAH dropped by 0.03C from September to October, RSS dropped by 0.2C.

    Here are the anomalies for the year to date, RSS.

    0.679
    0.991
    0.868
    0.784
    0.543
    0.485
    0.492
    0.471
    0.578
    0.35

    The average anomaly of the year to date is 0.62C. 1998 annual average was 0.55C

    To avoid beating the 1998 record, the next 2 months combined must average less than 0.2C.

    Some may say that, should 2016 (RSS) end up warmer than 1998, it won’t be a statistically significant result. But I wonder how many of those have been hailing 1998 as the record-holder when it is not statistically distinct from 2010 (RSS).

    • dave says:

      barry says :

      “…1998 … is not statistically significant from 2010…”

      What is the data?
      What is the statistical model?
      What is the null hypothesis?
      What are the assumptions about the error term in the statistical model?
      What is the p-value?
      What was the defined alpha-value?

      • dave says:

        Did not correctly copy barry’s statement, which was:

        “…1998…is not statistically distinct from 2010…”

        • nigel says:

          “…1998…is not statistically distinct from 2010(RSS).”

          That does not mean that our comparison point should be RESET to 2010.

          I do not see any scientific point to the comment.

          • nigel says:

            Of course, since El Ninos usually straddle two calendar* years one cannot really say much about any single calendar year, except to say that the peak was at a certain time and the temperature anomaly reached a certain, very temporary, level, about then.

            *Calendars are man-made. Until not so long ago the year in England started on March 25th. It drove me nuts reading in older history books “the battle took place in February 1343/4”
            Didn’t they know which year they were fighting in!? I was very shy, and never asked the History teacher. Perhaps he did not know either.

          • barry says:

            I do not see any scientific point to the comment.

            It is addressed to interlocutors less ascetic than yourself – a little dig at double standards.

            But I think you knew that.

          • barry says:

            “calendar years…”

            1998 was the warmest 12-month period in the satellite record until a few months ago.

          • nigel says:

            barry says:

            “[My comment] is…a little dig…I think you knew that.”

            The Dictionary definition of this sort of “dig” is:

            “a remark intended to mock or criticize,”

            with synonyms:

            snide remark – cutting remark – jibe – jeer – taunt – sneer – insult – barb – slur – slight – affront – insinuation – wisecrack – put down.

            If I chose before not to regard the comment as such, I know it now

          • barry says:

            The unconscious ironies people throw out are some small entertainment. In deploring little digs you make one. But perhaps you mean to defend double standards? That part’s not so clear…

  36. ren says:

    Temperatures in northern areas dipped below freezing for the first time this winter in Poitou, Nancy, Dijon and Nevers on Friday. Meanwhile, those living in the southeast will not be spared. Little more than a week after Marseille basked in 25C sunshine, residents will wake up to temperatures of 5C on Monday.

    While forecasters have rejected claims that this winter will be one of the coldest on record, the good news for winter sports fans looking to book holidays is that between 30cm and 60cm of snow is expected in the Alps at altitudes about 200m, as temperatures dip 8C below the norm for early November.
    http://www.connexionfrance.com/weather-cold-winter-snap-rain-alert-orange-meteo-france-18595-view-article.html

    • dave says:

      Well, as was said a few weeks ago, the overall patterns are similar to those of late 1962 which, in Great Britain, was followed by an appalling, cold, cloudy, STILL, winter. It was “Chaos” headlines then. God help us if it happens now, with the tiny safety margins in the electricity grid, and relying on wind turbines to boot.

  37. dave says:

    RSS LT global anomaly has, indeed, dropped, 0.2281 C (say 0.23) in one month and is now 0.64 C lower than its “2016 El Nino high.”

    It is 0.51 C below its “1998 El Nino high.”

  38. dave says:

    “…in Toronto…it will be cold and sunny.”

    Whereupon, in my parents’ household, the topic immediately would be,

    “Gulf or Atlantic side of Florida?”

  39. barry says:

    BoM have updated their ENSO forecast.

    http://www.bom.gov.au/climate/enso/

    BoM is the only portal I know of that assesses (briefly) and compiles forecasts from other international groups. However, each group has different thresholds for el Nino/laNina events. BoM characterizes all other groups forecast under BoM metrics, not the metrics used by the other groups.

    EG, BoM threshold for el Nino/la Nina is sustained +/- 0.8C anomaly in the NINO3.4 region, whereas NOAA requires only +/- 0.5C anomaly being sustained for that region. JMA (Japanese Meteorological Association) uses +/-).5 C threshold, but in NINO3 region, which can be quite different to combined NINO3.4.

    You can get an idea of the international spread of models here:

    http://www.bom.gov.au/climate/model-summary/#tabs=Pacific-Ocean

  40. ren says:

    Weak solar wind and very high galactic ionizing radiation in the lower stratosphere.
    http://images.tinypic.pl/i/00838/53vz9v2yox95.png

  41. dave says:

    barry:

    Still waiting for that test statistic and its rationale.

    You see, you started this thread on November 1 with:

    “A record warm year looks very likely now.”
    No mention that it had to be statistically significant to BE a (new) record, and no indication there, or by you on November 6, how that question should be decided.

    RSS has a difference of 0.1 Deg. C (approx) between 1998 and 2010 and yet you say that 1998 and 2010 are not statistically distinct. In that case, what would make 2016 statistically distinct (a record-holder not a joint record-holder)? You must mean at least 0.1 C higher than the 0.55 Deg. C of 1998 (i.e. over 0.65 Deg. C) and, for that, the next two months must be about 0.8 C. each.

    • barry says:

      Unfortunately I have only online discussions, and reference to a private conversation with John Christy to go on.

      While RSS has discussed structural uncertainties as well as statistical, and have given values, I have only found information for that on trends, not annual anomalies.

      AFAIK, UAH sat record publications have not discussed structural uncertainties, so I rely on the tidbits I’ve picked up on the web.

      While NOAA and GISS discuss structural uncertainty and give confidence intervals for anomalies, that information is not supplied by the compilers of the satellite records, and without info on structural uncertainties, it is impossible to calculate. So I go on stuff like;

      http://tinyurl.com/zgyqto9

      And compare that with the error bars on annual surface temps (about +/-0.2C) – you can see it visually here

      Wish I had something better, but hearsay (from ‘skeptics’) and comparison is the best I have.

      If you have better information, I’d love to know it. People (skeptics) have been saying that 2016 annual anomaly will be statistically indistinct from 1998. I’ve assumed they see the uncertainty as I do, so if you know better, help us all out.

    • barry says:

      Out of curiosity, are you asking questions to gain better understanding or for a ‘gotcha’?

      There are various school of thought on what ‘record-breaker’ means. I move comfortably among them. I favour awarding it to the highest ranked anomaly (or averaged anomaly), and stating the likelihood of that being the warmest/coldest. Highest percentage wins. But skeptics here have recently preferred overlap to mean no difference, with regard to a potentially warmer 2016. As I mused at first – I wonder if it’s the same people poo-pooing a record-breaker on that basis that called RSS 1998 the warmest, when 2010 was statistically indistinct from it.

      Yes, there is less 0.1C between 1998 and 2010 annual average.

  42. ray says:

    It is barry who specifies the RSS data to use, by the way – on November 6.

    Back in the day (Jan 2011) UAH and Dr Roy had 1998 and 2010 differing by 0.01 Deg. C but the present version has a difference of 0.18 Deg. C.

  43. ray says:

    In Dixville Notch, New Hampshire (which has midnight voting) Hilary Clinton beat Donald Trump four votes to two. Can he whittle down this lead?

    • ray says:

      “Can he whittle down this lead?”

      Not in New Hampshire (too many Boston commuters, perhaps)…but elsewhere…

      • ray says:

        When the Conservative William Buckley was running for Mayor of New York he was aked “What would you do if you actually won?” and he immediately replied “Demand a re-count!”

  44. TIME FRAME- I had said 10 years of sub solar activity in general which we have had post 2005 followed by 6 months of solar values at or below my solar criteria before solar effects start to impact the climate in a more visible way.

  45. ray says:

    Actually, Salvatore, you ALSO posted in that Jan 2011 thread.
    I admire your persistence though not your occasional prolixity. I thought, even then, that you expected the possible effects of wobbles around the barycenter, and internal solar dynamics, to happen too quickly, and too obviously.

    The stage is “set.” Whether the actors appear and speak their lines is a question which will be answered by SC 25.

  46. ren says:

    Congratulations to the United States.

    • ray says:

      ren:

      When President Nixon was told by his Chief of Staff, one day ,that the Italian Lira was under pressure, he replied

      “I don’t give a f**k about the Italian Lira!”

      When President Trump is told, one day, by his Chief of Staff that CO2 is still increasing…

      This blog is now irrelevant.

      Farewell.

      • Gordon Robertson says:

        ray…”When President Nixon was told by his Chief of Staff, one day ,that the Italian Lira was under pressure, he replied

        I dont give a f**k about the Italian Lira!”

        Perhaps the most stunning saying by Nixon is, “A lie is not always a lie”.

        I think he believed that. I think he thought it was OK to lie as long as there was a justification for it.

    • AndyG55 says:

      Isn’t it WONDERFUL. !!!

      If true to his word, the climate change SCAM is dead in the USA !!!

      SUCK ON THAT, climate trolls 🙂 🙂

      China, India, and many many other countries building or planning to build coal fired power stations.

      USA almost certainly to cut all subsidies for wasteful unreliable non-renewables.

      PLENTY of increased CO2 emissions for the world’s plant life..

      and there is ABSOLUTELY NOTHING YOU CAN DO ABOUT IT.

      (biggest grin I can manage)

      • AndyG55 says:

        “ABSOLUTELY NOTHING YOU CAN DO ABOUT IT.”

        Whoops, sorry ren.. got carried away, thought I was talking to the climate scammers.

        ABSOLUTELY NOTHING THEY CAN DO ABOUT IT.

    • Gordon Robertson says:

      ren “Congratulations to the United States”.

      Thanks for calling it by it’s proper name and not by the continent in which it resides.

  47. dave says:

    I am signing off for good, too.

    Farewell.

  48. nigel says:

    Moi aussi.

  49. Dan Pangburn says:

    CO2 has no significant effect on climate. Thermalization and the short relaxation time of some rotational modes for water vapor molecules explain why. Terrestrial EMR absorbed by CO2 is simply rerouted to space via water vapor.

    Increased irrigation, especially after about 1950, is substantially increasing water vapor. The WV increase has been measured by NASA/RSS using satellites and has been reported since 1988. (http://globalclimatedrivers2.blogspot.com contains graphs and links to the data). Water vapor is the most important ghg and has made the planet warm enough for life. Currently the increasing WV is countering the cooling that would otherwise be occurring.

    NASA/RSS measurements show WV increase rate trend of about 2.3E13 kg/yr which is the approximately 2% which stays in the atmosphere of the 110E13 kg/yr used for world irrigation. The other 98% apparently rains out. The data on irrigation was calculated using information mostly from here: http://www.fao.org/nr/water/aquastat/didyouknow/index3.stm
    WV from energy production (fuel & cooling) is tiny (about 1E13kg/yr) compared to WV from irrigation. (Renewable energy wont help significantly)

    Rapidly receding water tables in some places and increased flooding in others as increasing water vapor rains out, is compelling evidence humanity needs to aggressively attend to rational management of fresh water and stop wasting time and resources on the mistaken perception that CO2 has a significant effect on climate.

    • Gordon Robertson says:

      Dan…”Terrestrial EMR absorbed by CO2 is simply rerouted to space via water vapor”.

      Why focus on something as trivial as water vapour when 99% of atmospheric gases are comprised of nitrogen and oxygen?

      When air warms in a room it is N2 and O2 doing the warming. Water vapour can affect the warming by changing the humidity but it hardly contributes to warming the room. On the Canadian prairies in winter, the relative humidity can drop to 10 or 15%, meaning there is very little w/v in the air. The air warms just the same with a heater.

      With a hot air furnace in the basement, the warm air blown up to the living room is virtually all N2 and O2 molecules. Even with a radiant electric heater, the warming is from N2 and O2, not by CO2 and water vapour absorbing infrared from the heater.

      • Dan Pangburn says:

        Gor What you are describing is convective heat transfer. All of the gas molecules participate in convective heat transfer. I am talking about radiation heat transfer. N2 and O2 do not absorb/emit radiation in the wavelengths of significant terrestrial thermal radiation but ghg like water vapor and CO2 do.

      • David Appell says:

        Gordon:

        Wow.

        N2 and O2 are not greenhouse gases.

        That’s why

    • David Appell says:

      Dan Pangburn says:
      “CO2 has no significant effect on climate.”

      Of course it does:

      http://www.giss.nasa.gov/research/briefs/schmidt_05/curve_s.gif

      Radiative forcing measured at Earths surface corroborate the increasing greenhouse effect, R. Philipona et al, Geo Res Letters, v31 L03202 (2004)
      http://onlinelibrary.wiley.com/doi/10.1029/2003GL018765/abstract

      “Observational determination of surface radiative forcing by CO2 from 2000 to 2010,” D. R. Feldman et al, Nature 519, 339343 (19 March 2015)
      http://www.nature.com/nature/journal/v519/n7543/full/nature14240.html

      • Dan Pangburn says:

        I responded to your first link up-thread but you are apparently too stubborn to look.

        As to your other links, apparently, invalid preconceived notions can lead to misinterpretation of observation and if you can find like-thinkers to peer review your work, you can even get it published.

        Take the blinders off and try to understand what is going on instead of simply remembering what others have done which might or might not be objectively and/or correctly interpreted. You are not grasping what Mother Nature is doing.

  50. WizGeek says:

    LOL. OMG. You all need to get a life. Or teach.

  51. Gordon Robertson says:

    Now that Trump is president hopefully we can get a proper investigation into why NOAA and NASA GISS have amended the historical temperature record to show record warming the IPCC did not see in it’s 2012 review.

    A US senate committee has been investigating NOAA but have had no cooperation from them releasing documents and it appears NOAA was protected by the Obama administration.

  52. barry says:

    Does Trump’s election mean that we will be getting more politics on science blogs like this one?

    I sure hope not.

    • RAH says:

      How can one separate the issues. The reasons why climate change exists as a public issue are 100% political on both the domestic and international fronts. US refusing to fund the UNs climate agenda? Trump will be making great changes that will effect not only public policy and the agencies which support that policy with their “data” on weather and climate, but also the “green energy” monster whose very existence is based up that policy and “data”.

      There will be multiple battles on many fronts and “the science” will be at the center of it all.

    • barry says:

      How can one separate the issues.

      I find it extremely easy. I would not be surprised to find that others cannot, but i would be quite unimpressed.

      Just upthread someone said they were signing out of the conversation for good (a skeptic).

      Another skeptic replied that they understand – that discussion was not needed any more.

      They were never in it for the science, obviously. And that has been the modus for many participants. I think it’s a kind of a disease

      Politics may be discussed, of course. It’s the inability to separate that is the disease.

      • AndyG55 says:

        Again, you misrepresent what was said.

        You are a LIAR, Swartz, always have been, and always will be.

      • WizGeek says:

        When government offices are allowed to pick winners and losers by virtue of taxpayer-funded subsidies, grants, programs, etc., then politics is inappropriately intertwined with science. (Read Ayn Rand’s “Atlas Shrugged” for a dramatic walk-through of this meddling.) Consensus is not science–even if it’s a 97% consensus of a cherry-picked subset of a cherry-picked sample. Scientific *laws* are based on reproducible, empirical, evidence-based experiments and evidence. Scientific *theory* is a possible explanation of empirical evidence alone. Scientific *hypothesis* (like the stuff offered by the IPCC and public-funded alarmists) is anything someone throws up on the wall to see if it sticks. The only reason it has “stuck” so long is because it plays upon the fears of the unknowing masses who in turn allow taxpayer-funded subsidies of said fear mongering entities.

        • barry says:

          Are you part of the unknowing masses? Or do you think you can separate politics from science?

          If the latter, then you are living demonstration that it is possible to separate politics and science. If the former, then no wonder you think no one else can do it.

    • Gordon Robertson says:

      barry…”Does Trumps election mean that we will be getting more politics on science blogs like this one?

      I sure hope not”.

      I would hope not either. I mentioned it only because NOAA and NASA have been getting away with scientific misconduct backed by the Obama administration. I am curious to see whether the investigation of NOAA will escalate now that Obama is out of the way.

      It is scientific misconduct to slash 5000 surface stations from a global pool of 6500 then use a climate model to re-synthesize the data. That’s up there with Mann et al clipping off tree ring proxy data that was showing cooling and splicing in real data that was warming.

      We’ve had this discussion and you back NOAA. I think they need to be thoroughly investigated no matter what the motives are by those investigating. We need this misconduct discussed openly and have it revealed to the public why NOAA’s recent spate of record warming is smoke and mirrors.

      • Norman says:

        Gordon Robertson

        I think you are correct with your post.

        Here is a NOAA claim
        https://insideclimatenews.org/news/04062015/global-warming-great-hiatus-gets-debunked-NOAA-study?gclid=CPOmlqH2n9ACFQIaaQodDWEB6w

        Wood for Trees shows close correlation with GISS and UAH
        http://www.woodfortrees.org/plot/gistemp/from:1995/to:2016/every/plot/uah5/from:1995/to:2016

        It seems that the scientists of IPCC were correct and then the manipulation begins.
        Here is what they had intitially found: “Previous calculations estimated the world had warmed 0.113 degrees Celsius per decade from 1950 to 1999, and 0.039 degrees Celsius per decade from 1998 to 2012, according to the United Nations’ Intergovernmental Panel on Climate Change. Global surface temperature “has shown a much smaller increasing linear trend over the past 15 years [1998-2012] than over the past 30 to 60 years,” the IPCC concluded in its Fifth Assessment report.”

        Later in the article they change this to 0.116 C/decade.

        Quote from Gavin Schmidt “There will be a very predictable chorus of ‘data manipulation’ and ‘fraud’ as they see a talking point disappear, and so it will just continue as before,” said Schmidt. “Just remember, their objections have little or nothing to do with science.”

        I have posted this above for doctor no and David Appell, so far neither has addressed the science.

        Going to CERES tool I looked at the total average flux reaching the Earth’s surface and it has not increased. It would seem the IPCC was correct in finding a very low valvue of 0.039 C/decade valid, it matches the reality of the CERES data while the new findings match no science and seem suspect.

        https://ceres-tool.larc.nasa.gov/ord-tool/jsp/EBAFSFCSelection.jsp

        On this link click the “Visualize Data” button. It is set for Global Mean values. Scroll down in the graphs to Surface Net Total Flux All-Sky and you will not see an increase of energy to the surface from 2000 to 2015 (which matches the very low quantity given by the IPCC). If the energy amount reaching the surface is not changing then the surface temperature will remain the same (as long as the cooling mechanisms are not changing to remove less energy…convection and evaporation).

        • Norman says:

          Gordon Robertson

          Also with the CERES tool you can clearly see clouds overall reduce energy to the surface by a considerable amount. You can see the difference in Total Flux on all sky and clear sky. Clear sky has an average of around 132 W/m^2 hitting the surface while All-sky has around 108 W/m^2 a massive 24 watt difference.

          • Gordon Robertson says:

            Norman…” Clear sky has an average of around 132 W/m^2 hitting the surface…”

            There’s a difference between what is measured by an IR meter and what reaches the surface. Look up colour temperature. Basically it is the equivalent temperature of a hot body based on it’s colour alone.

            If you heat a piece of iron with a torch, it can get so warm it glows a near white. The colour of the iron at the temperature it looks white can be used to estimate temperatures that shine at an equivalent colour. In other words, in order for a body, like the tungsten in an incandescent bulb, to shine at the temperature of heated iron, it would have to be at the same temperature as the iron.

            Based on what Bohren said in his book Atmospheric Radiation, if you point an IR meter at clear sky it measures something like -50C. If you move it over till it’s pointed at clouds, it jumps to around -3C. Clear sky at -50C is not transferring any heat to the surface although it’s colour temperature may indicate that it can.

          • David Appell says:

            Gordon wrote:
            “Clear sky at -50C is not transferring any heat to the surface although its colour temperature may indicate that it can.”

            Direct measurements show this wrong:

            “Observational determination of surface radiative forcing by CO2 from 2000 to 2010,” D. R. Feldman et al, Nature 519, 339343 (19 March 2015)
            http://www.nature.com/nature/journal/v519/n7543/full/nature14240.html

            Press release for Feldman et al: “First Direct Observation of Carbon Dioxides Increasing Greenhouse Effect at the Earths Surface,” Berkeley Lab, 2/25/15
            http://newscenter.lbl.gov/2015/02/25/co2-greenhouse-effect-increase/

        • Gordon Robertson says:

          Norman…”I think you are correct with your post”.

          I don’t know if that’s a typo or you meant ‘disagree’. The article to which you point about NOAA is seriously off base. It was the IPCC who claimed a hiatus from 1998 – 2012, not alarmists. Schmidt is totally out to lunch by claiming it is ingrates making the claim. It was 2500 reviewers on the 2012 review.

          “page 6…straight from 2012 review.

          http://www.climatechange2013.org/images/uploads/WGIAR5_WGI-12Doc2b_FinalDraft_Chapter02.pdf

          Despite the robust multi-decadal timescale warming, there exists substantial multi-annual variability in the rate of warming with several periods exhibiting almost no linear trend including the warming hiatus since 1998. The rate of warming over 19982012 (0.05C [0.05 to +0.15] per decade)”

          NOAA is also full of it. They admitted to slashing 5000 stations from a global pool of 6500 stations then used a climate model and smoke and mirrors to re-synthesize the missing data.

          Why???

          There can be only one reason and that became apparent in their claim of 2014 as the then warmest year ever. It turned out they had offered that claim based on a confidence level of 48%.

          Again, why???

          With a 90% confidence level, 2014 moves to 4th place. NOAA had a political interest in the propaganda that recent years have been record years. Maybe 2016 will be a new record but it’s based on an El Nino, not AGW.

          • David Appell says:

            “It was the IPCC who claimed a hiatus from 1998 2012, not alarmists.”

            New and better data has come in since then, as summarized in Karl et al Science 2015.

            You need to keep up with the literature.

      • David Appell says:

        “Thats up there with Mann et al clipping off tree ring proxy data that was showing cooling and splicing in real data that was warming.”

        Gordon, ever hear of the tree ring divergence problem?

        Of course you haven’t.

        On the Divergence Problem in Northern Forests: A review of the
        tree-ring evidence and possible causes, Rosanne D’Arrigo et al, Global and Planetary Change 60 (2008) 289305.
        http://www.ldeo.columbia.edu/~liepert/pdf/DArrigo_etal.pdf

      • barry says:

        Gordon,

        It is scientific misconduct to slash 5000 surface stations from a global pool of 6500 then use a climate model to re-synthesize the data. Thats up there with Mann et al clipping off tree ring proxy data that was showing cooling and splicing in real data that was warming.

        Weve had this discussion and you back NOAA.

        You have this completely wrong. You also have completely wrong that the IPCC described the temps 1998 to 2012 as a “pause.”

        Though presenting you with clear demonstration of your errors, you cling to them, repeating them in nearly every thread here throughout the year. I do not know if you lack honesty or the ability to click a link to evidence that might upset your opinions.

        Here it is again for the umpteenth time – the real reason why stations were ‘dropped’ from the record.

        Only 1500 or so stations worldwide report their data to NOAA. This has been the case for a few decades.

        In the 1990s, NOAA undertook a project to collate hand-written data record from around the world and digitise them.

        That project finished about 1997. The 1500 stations that reported kept reporting throughout, but NOAA has ammassed thousands of other station data. Those were never part of the data stream. Maybe one day NOAA will undertake a similar project and once add in much more data since 1997 that is not automated.

        Ironically, thousands of stations didn’t ‘drop out’, because they were never online with NOAA to begin with – they were ADDED.

        And 20 years after that project it is still utterly misrepresented by the usual quarters. Some ‘skeptic’ lies are hard to kill, even with clear, unambiguous information.

        • David Appell says:

          I’ve heard that we only need 50-100 stations to get an accurate (enough) number for global temperature.

          • Olof R says:

            Yes, that is absolutely true. I have tested whether the Ratpac A radiosonde index, based on only 85 stations worldwide, has a decent global representation. I did it with “synthetic” UAH data:

            https://drive.google.com/open?id=0B_dL1shkWewaT083ZHdiWHhieTA

            Just to make sure that this radiosonde validation of UAH v6 is fair:

            https://drive.google.com/open?id=0B_dL1shkWewaNDVmS0t1bjZjQXM

            Hence, an unvalidated product has just passed peer review. Is it acceptable that the tropospheric AMSU-era trend is 0.2 C/dec lower than that of real thermometers carried aloft by balloons?
            Is it acceptable that the three satellite teams widely disagree on the TMT-trend with their most recent products? Is the trend 0.08, 0.14 or 0.14 C/decade? Validation with radiosondes suggest that the latter two are least wrong..

          • Kristian says:

            Olof R says, November 12, 2016 at 2:16 AM:

            Is it acceptable that the tropospheric AMSU-era trend is 0.2 C/dec lower than that of real thermometers carried aloft by balloons?
            Is it acceptable that the three satellite teams widely disagree on the TMT-trend with their most recent products? Is the trend 0.08, 0.14 or 0.14 C/decade? Validation with radiosondes suggest that the latter two are least wrong..

            You cannot and should not try to validate the satellite temperature series against radiosondes, Olof. It is not the radiosonde data itself that makes the radiosonde series such a mess and so clearly wrong in their portrayal of tropospheric temperature trends. It’s in the way that this data is assembled into global and extended (climate-range) timeseries. That takes a lot of tinkering …

            You need to consider how the task of combining a whole bunch of what is basically local weather measurement data from individual instruments sent up daily from a handful of separate balloon stations around the world into what is supposed to be a consistent and coherent global climate dataset, might present you with some definite difficulties.

            If you want to validate the satellite temperature series, you will have to do it against 1) surface temperature series, and/or 2) ToA outgoing long-wave radiation (OLR) flux measurements (ERBS, CERES), since the OLR flux at the ToA can basically be used as a direct gauge of tropospheric temperatures, especially when spanning beyond the interannual noise of large-scale weather events.

            – – –

            The radiosonde datasets do not in any way represent “Troposphere Truth”. They rise much less steeply than the surface from 1979 to 2001 and much steeper than the surface from 1999 to 2015. This doesnt make much physical sense, especially considering how the satellites (UAH) were so roundly criticised for having too low a trend from 1979 to ~2000, how there were such persistent demands of wholesale corrections that were eventually complied with. The errors (the “drift”) pointed out were real, and amended accordingly.

            By the satellite teams, that is. NOT by the radiosonde teams …

            So the satellites and the surface timeseries agree to an impressive extent all the way from 1979 to 2005; the radiosondes constitute the obvious outlier here. The “drift” is clearly between the surface/satellites and the radiosondes, NOT between the surface/radiosondes and the satellites.

            You can read more about this here (be sure to focus on the plots – they more than anything are what builds the case against the radiosonde datasets):
            https://okulaer.wordpress.com/2016/02/21/taminos-radiosonde-problem-part-1/

            Finally, here’s OLR at the ToA (ERBS+CERES) vs. UAHv6 tlt, from 1985 to 2016:
            https://okulaer.files.wordpress.com/2016/06/uahv6-tlt-trop-x.png

            Great validation of the UAHv6 satellite dataset!

          • Kristian says:

            HIRS OLR data vs. UAHv6, from 1985 to the end of 2012:
            https://okulaer.files.wordpress.com/2016/06/hirs-vs-uahv6-b.png

            Further validation.

          • Olof R says:

            Kristian, read again and try harder… I have demonstrated that Ratpac A has a fair global representation. Satellites should and can only be validated by radiosondes. If you subsample the right geographic locations, and give radiosonde data the right weighting profile, then the comparison is apples to apples. Try this chart, a combination of those two above

            https://drive.google.com/open?id=0B_dL1shkWewaVUdobkJYcjM5VmM

            Radiosonde data may have major homogeneity issues in the early decades, but not in the recent 20 years. Ratpac A is not adjusted per se since 1995, station series are only cut at metadata breakpoints. Validation of satellite data with unadjusted Ratpac B , or unadjusted Rich/Raobcore give the same result, i e something is wrong with satellite TMT in the AMSU- era. Actually UAH 5.6 perform best and UAH 6.0 worst among all datasets. I think it depends on how much Noaa-15 is used.

            It is nothing peculiar that the troposphere warms faster aloft than at the surface, its called the tropospheric hotspot. It is also discernible in UAH data, read:
            http://www.drroyspencer.com/2016/11/uah-global-temperature-update-for-october-2016-0-41-deg-c/#comment-228987

          • Kristian says:

            Olof R,

            No, you read again and try harder. All you do is waving your hands and laying out red herrings in order to avoid the real issue at hand.

            The radiosondes show a much gentler overall temperature rise than the surface series (GISTEMP LOTI) during the early 1979-2001 segment, basically sporting a “Radiosonde Pause” when there was none at the surface (or in the troposphere, according to the satellites, which agree perfectly with the surface between 1979 and 2005, the radiosondes absolutely do not). Then, during the late 1999-2015 segment, all of a sudden the radiosondes suggest a much steeper overall temperature rise than the surface series (and the troposphere, according to the satellites):
            https://okulaer.files.wordpress.com/2016/02/trends-79-01.png
            https://okulaer.files.wordpress.com/2016/02/trends-99-15.png

            There is no tenable physical explanation to such a massive reversal in relative warming rates between the surface and the troposphere above it. Rather, this glaring discrepancy is a clear indication of methodological errors

            We all agree that there was no near-“Pause”, neither in surface nor in tropospheric temps, between 1979 and 2001, and so the radiosonde datasets are clearly WRONG in their portrayal of the progression of tropospheric temperature anomalies from 1979 to ~2001.

            So why (!) should we trust your assurance that over the last 20 years or so (from about 1996) the radiosondes are suddenly definitely CORRECT? Meaning that BOTH the satellites AND the surface series would be wrong …

            You have nothing, Olof, except your own words.

          • Olof R says:

            Kristian, you may have some problems with reading and understanding…
            Radiosonde trends do not differ more than 0.05 C/decade from satellite or surface datasets in the msu-era (1979-1999). That is not stastistically significant. Have you ever heard of trend uncertainty?
            Also, the surface and the free troposphere is not the same thing, and probably less so during a period with two major volcanic eruptions.
            Radiosondes have become more reliable from a technical point of view, less sensitive to solar heating and rain cooling, etc. There is also better metadata on equipment and procedure changes. Hence, radiosonde data are more reliable in the Amsu-era (2000- now), and UAH v6 diverge more from them here, ie losing 0.2 C / decade

          • Kristian says:

            *Yawn!*

            You’re handwaving, Olof. It seems handwaving is all you’ve got.

      • David Appell says:

        Norman says:
        “I have posted this above for doctor no and David Appell, so far neither has addressed the science.”

        Norman, for the Nth time, the 5AR is already out of date, replaced by Karl et al Science 2015 and work referenced within.

    • Gordon Robertson says:

      Salvatore…when you think about it, why should CO2 levels keep rising exponentially, with or without vegetation as a sink?

      An exponential annual rise suggests CO2 sources are rising exponentially, but are they? The measurement of CO2 in the atmosphere is not an exact science and the suggestion that CO2 is rising exponentially may be more consensus than fact.

      It’s interesting that one of the measurement sites for CO2 in the atmosphere is on the slopes of an active volcano which is immediately over the ocean. The oceans are a major source of atmospheric CO2, accounting for 50% of it.

      The location of the aforementioned sensor is above warm ocean water where CO2 is out-gassed. CO2 is absorbed by cold water and released by warm water.

    • Mike Flynn says:

      CO2 is plant food.

      In the presence of more food, there should be more plants. This seems to be happening.

      Unfortunately, Nature sequesters more CO2 than is produced naturally. Creating CO2 by burning fossil fuel helps by putting back at least some of the CO2 stored by Nature millions of years ago, presumably for our use now.

      No fuss. No bother. No GHE.

      Just Nature at work. All part of the rich tapestry of life.

      Cheers.

      • Norman says:

        Mike Flynn

        This is one of your posts I mostly will agree with except for your “No GHE”. If you had claimed no AGW I might almost agree with you. You still do not understand the physics of the GHE and you probably never will and you will probalby not attempt to try and understand the mechanism.

        • Gordon Robertson says:

          Norman…”You still do not understand the physics of the GHE and you probably never will and you will probalby not attempt to try and understand the mechanism”.

          Who does understand the physics behind it, Norman?

          Lindzen claims it is overly simplistic and Gerlich and Tscheuschner, both with expertise in thermodynamics, claimed there is nothing in physics to support it. It’s talked about a lot in the literature but no one has offered a realistic explanation for it. All that’s offered is a thought experiment based on a planet with no atmosphere and no oceans.

          The GHE is based on the notion that greenhouse gases block surface radiation hence slowing down the escape of heat to space. There’s nothing in physics to back that theory, it’s pure consensus.

          As far back as 1909, Woods demonstrated convincingly that warming in a real greenhouse has nothing to do with the blocking or trapping of infrared radiation. He showed that greenhouses heat because convection is blocked. The atmosphere is rife with convection and there’s no reason why radiation from the surface should be trapped to any degree.

          Woods also claimed that gases are poor conductors of heat and that surface radiation will become so weak by the time it’s a few feet above the surface as to render it ineffective as a warming agent.

          • David Appell says:

            Why would you believe Gerlich and Tscheuschner when they contradict tens of thousands of scientists, and their flaws have been pointed out many of times?

            Are you interested in the truth, or not?

          • Norman says:

            Gordon Robertson

            Your question above “Who does understand the physics behind it, Norman?”

            In reference to GHE.

            I think many coal fired power plant engineers understand it. Babcock and Wilcox. In order to properly design such a furnace you have to take in the effect of water vapor and carbon dioxide on radiative heat transfer.

            Here is an online version of one of their books:
            http://www.academia.edu/12075401/Steam_its_generation_and_use_Edition_41

            Please go to Chapter 4-12 and read this section and then you will answer your question.

          • Norman says:

            Gordon Robertson

            You state: “The GHE is based on the notion that greenhouse gases block surface radiation hence slowing down the escape of heat to space. Theres nothing in physics to back that theory, its pure consensus.”

            I am not sure that is what the GHE is based upon at all.

            My current understanding (which could be wrong but it makes sense calculating available data) is that the surface warms the atmosphere and the GHG it contains will start to emit IR in all directions as would any surface, based upon the temperature of the gas.

            Here are charts of the emissivity of GHG (carbon dioxide and water vapor).
            http://fchart.com/ees/gas%20emittance.pdf

            This matches the data found in this article.
            http://www.patarnott.com/atms411/pdf/StaleyJuricaEffectiveEmissivity.pdf

            Table 1 shows the emissivity to be above 0.9

          • Norman says:

            Gordon Robertson

            If you go back to the CERES tool in this link
            https://ceres-tool.larc.nasa.gov/ord-tool/jsp/EBAFSFCSelection.jsp

            You can find the Downwelling Global average IR is around 345 W/m^2

            In order for GHG to generate this flux with an emissivity of 0.95 the gas temperature would be 9.7 C somewhat cooler than the surface but most the GHE would come from the first few hundred feet of air as IR does not penetrate far at the absorbing wavelengths of GHG.

            The surface IR flux upwelling is around 398 W/m^2 and would give a surface temperature of around 15.8 C.

            The 9.7 C air with GHG is generating a downward IR flux of 345 W/m^2. The IR is not “trapped”, some of the upwelling IR is absorbed by the GHG’s that then warm the air they are part of and this warmer air emits.

          • Norman says:

            Gordon Robertson

            One more look at CERES tool.

            https://ceres-tool.larc.nasa.gov/ord-tool/jsp/EBAFSFCSelection.jsp

            Look at the Net Longwave flux. It is about -53 W/m^2. Without the GHG returning a large amount of the upwelling IR you would cool at a rapid rate.

            Consider the moon. Only in the dark for two weeks but gets down to -153 C. Then on Earth’s Antarctica which will be in the dark 6 months it only gets down to -89 C.

            If you play with the CERES tool you can make a regional map of just the Antarctic and see that even in the darkest part of its winter the Downwelling IR is still 160 Watts/m^2. This is energy that would have been lost if the GHG were not present but since they are the surface will not cool as much as the Moon’s surface.

          • Kristian says:

            Gordon Robertson says, November 11, 2016 at 4:09 AM:

            The GHE is based on the notion that greenhouse gases block surface radiation hence slowing down the escape of heat to space. Theres nothing in physics to back that theory, its pure consensus.

            As soon as you replace the vacuum of space with a massive atmosphere as the immediate thermodynamic surroundings of a solar-heated planetary surface, you will naturally upset the dynamically equilibrated heat budget of that surface. You do so because the massive atmosphere, contrary to space itself, is able to warm. And so the solar-heated surface will have to adapt to the physical properties of its new surroundings in order to maintain its heat balance. This can only happen through a rise in its average temperature. The massive atmosphere, as it warms, simply acts as an insulating layer on the solar-heated planetary surface.

            Once the new dynamic equilibrium has been established and the surface has attained a higher T_avg, we have reached a steady state and nothing more will happen, as long as the solar input to the surface (its ASR) and the atmospheric mass stays unchanged …

            How about a change in the atmospheric concentration of radiatively active gases at this stage …? Nope. Won’t matter.

          • Kristian says:

            Norman says, November 11, 2016 at 11:21 PM:

            The surface IR flux upwelling is around 398 W/m^2 and would give a surface temperature of around 15.8 C.

            The 9.7 C air with GHG is generating a downward IR flux of 345 W/m^2. The IR is not trapped, some of the upwelling IR is absorbed by the GHGs that then warm the air they are part of and this warmer air emits.

            There is no separate macroscopic 398 W/m^2 upwelling flux from the surface, Norman. This is only a calculated number, based on the surface temperature. The real radiative flux from the surface is the 53 W/m^2 worth of radiant heat. This is the one we actually measure, as in ‘detect’ with radiometric instruments.

            There is also no separate macroscopic 345 W/m^2 downwelling flux from the atmosphere. This is only the number you get when you subtract the actual detected flux (the net LW) from the theoretical (mathematically derived) blackbody emission (the UWLWIR) of the surface: 398-53=345.

            Look at the Net Longwave flux. It is about -53 W/m^2. Without the GHG returning a large amount of the upwelling IR you would cool at a rapid rate.

            No, with the atmosphere being at almost the same temperature as the surface (a direct consequence of it possessing a (thermal) mass) AND being radiatively active, the average radiant heat loss from the surface in our particular current global situation is about 53 W/m^2 only. While the TOTAL heat loss from the surface of course equals the solar input, on average (~165 W/m^2).

            If the atmosphere had been warm, but radiatively inactive, it wouldn’t have been able to limit the radiant heat loss from the surface. It would simply have been thermodynamically disconnected from the surface and so its temperature could not affect it, no matter how hot it got.

            On the other hand, if the atmosphere had been radiatively active, but unable to warm beyond the temperature of space, it also would’ve been unable to limit the radiant heat loss from the surface.

          • Norman says:

            Kristian

            Sorry but I have used FLIR and just IR tools enough to know your opinion is not correct.

            The IR detecting devices used to measure downwelling and upwelling IR are directional. They point towards the surface for upwelling and toward sky for downwelling The upwelling device is measuring the radiant energy emitted by the surface not a net amount.

            If you would ever use an actual FLIR you may understand what I am saying. You point the FLIR at a hot valve and it shows it in bright colors, point it at a bucket of ice and it shows not only cool colors but also gives a temperature. If you use this device and get an actual thermometer you will find the FLIR reads very close to what the thermometer is reading.

            It is directional. It also can view multiple surfaces at once and give each a unique temperature.

            Look at some of the images in this link so you might “get” what I am trying to state.
            https://www.google.com/search?q=FLIR+images&espv=2&biw=1920&bih=950&tbm=isch&tbo=u&source=univ&sa=X&ved=0ahUKEwj6t4TehqTQAhWqy4MKHWZOAdYQsAQIGg

            You have your opinion on things, you just have zero support for your claims. You make them often but provide no evidence to support them and your claims are contrary to accepted physics and also contrary to a working FLIR camera.

          • Kristian says:

            Norman says, November 12, 2016 at 2:30 PM:

            Sorry but I have used FLIR and just IR tools enough to know your opinion is not correct.

            The IR detecting devices used to measure downwelling and upwelling IR are directional. They point towards the surface for upwelling and toward sky for downwelling The upwelling device is measuring the radiant energy emitted by the surface not a net amount.

            Norman, just above you declared the following to Mike Flynn:
            “You still do not understand the physics of the GHE and you probably never will and you will probalby not attempt to try and understand the mechanism.”

            No. YOU do not understand the physics of radiative transfer. For the umpteenth time: You need to distinguish between individual photon movements and the probabilistic average of all photon movements (the macroscopic flux, W/m^2) within the radiative field between two warm objects. The former is a quantum phenomenon, the latter a thermodynamic one. There is ALWAYS ONE macroscopic radiant flux ONLY between two objects at different temperatures – the net movement, the radiant “heat”.

            I have asked you multiple times to read what the manufacturers of the instruments in question actually say about their principle of operation. You apparently still haven’t bothered to. I find that remarkable …

            They distinctly do NOT (!!!) measure (as in ‘detect’) individual fluxes inside an integrated radiant heat transfer. How do you suppose that would work physically? You can only ever detect the NET movement of energy, Norman. You need to start thinking this thing through. Reflect. Not just assume and assert.

            If you would ever use an actual FLIR you may understand what I am saying.

            The ‘problem’ is, I understand it much better than you do. I know how they operate, on what principles of radiative transfer they are based. You clearly do not. I see how confused you are.

            You point the FLIR at a hot valve and it shows it in bright colors, point it at a bucket of ice and it shows not only cool colors but also gives a temperature. If you use this device and get an actual thermometer you will find the FLIR reads very close to what the thermometer is reading.

            It is directional.

            OF COURSE it’s directional. Because HEAT is inherently directional. When you point the device towards something hot, the heat moves INTO its sensor. When you point it towards something cold, the heat moves AWAY FROM its sensor. The sensor will detect either transfer and translate it into an electric signal. There’s nothing to it …

            It also can view multiple surfaces at once and give each a unique temperature.

            Yes. It’s all done relative to the sensor itself. Or its done with a super-cooled detector.

            You have your opinion on things (…)

            It’s not my opinion, Norman. I’m telling you the way it is. You simply don’t get what I’m trying to tell you. It’s nothing revolutionary. It’s all standard physics.

            You’re simply incapable, it seems, of distinguishing between reality and a conceptual/mathematical model of reality. They’re NOT the same thing!

            You make them often but provide no evidence to support them and your claims are contrary to accepted physics (…)

            You continue to make this bizarre claim that what I say is somehow “contrary to accepted physics”. This is precisely what tells me that you don’t KNOW the physics, and that you don’t understand what I’m actually saying. There is nothing “contrary to accepted physics” about it. It IS accepted physics. You just need to separate between the microscopic (quantum) and the macroscopic (thermodynamic) realms, and you’ll see. But you’re seemingly unable to … Or you don’t want to, for some reason.

            (…) and also contrary to a working FLIR camera.

            Just the opposite. What YOU’RE claiming is contrary to the common understanding of how these cameras work. And this is exactly what I am trying to explain to you, time and time again …

            * * *

            Norman, please read and take to heart.

            On a microscopic level, photons fly in MILLIONS and BILLIONS of different INDIVIDUAL directions NOT just two inside a radiation field. THAT’S why we need to average their movements to find the NET macroscopic movement of energy, which goes ONE way, from hot to cold.

            You would only find what appears to be a “bidirectional transfer” across an imaginary (temperatureless), twodimensional plane dividing the radiation field between two warm objects or regions. Simply because that plane has two sides. IOW, it is purely an artefact of the geometric constraints that YOU have decided to impose on the system. If you placed an imaginary (temperatureless) CUBE inside the radiation field instead, that cube would tell you that there is in fact a HEXAdirectional transfer of energy going on. And so on, and so forth …

            This is the entire reasoning behind the idea of a “bidirectional transfer”. The hypothetical, twodimensional (temperatureless) plane dividing the threedimensional radiation field in two. Thing is, you could tilt this imaginary plane in any direction and at any angle and you would still get what seems to be a bidirectional transfer, because there are photons flying about in ALL directions, not just the two. And so in order to get the ACTUAL average of all these directions (and intensities), you would have to include ALL those potential planes, at ALL angles, giving a UNIdirectional net movement of energy as a result:
            https://okulaer.files.wordpress.com/2016/11/radiation-sfc-atm.png

            This shouldn’t be so hard to picture.

            Bottom line, in reality, nothing here is BIdirectional. Either its UNIdirectional (macroscopically), or its SUPER-MULTIdirectional, meaning every photon has its own direction (and frequency/energy level) (microscopically).

            Again: Photons fly in ALL directions, not just two. HEAT, though, (the net movement of thermal energy) spontaneously goes towards a lower temperature, always, direction doesn’t matter, only the temperature difference. If you had a radiometric instrument and you pointed its cryogenically cooled detector, not UP, not DOWN, but in a horizontal direction, do you think it would detect a “photon flux” coming in from there as well? Of course it would. The air temperature is higher than the detector temperature in that direction also. Does that mean we should account for a “lateral-welling long wave IR” flux as well? Not just the DWLWIR and UWLWIR ‘fluxes’. How about we flip our instrument around 180 degrees? Wouldn’t it detect yet another “photon flux” coming in from that direction? So let’s just continue. Let’s point our detector in any direction imaginable. How many separate “photon fluxes” would we find, Norman? The answer is simple: As many as we could be bothered looking for!

            Again, one needs to distinguish between the MICRO (quantum) realm and the MACRO (thermodynamic) realm. I’m ONLY talking about the latter. Simply because this entire issue is distinctly a thermodynamic problem. In the end, all these “photon fluxes” that we “found”, they add up (or net out) to ONE macroscopic movement of radiant energy, from the warmer to the cooler object or region … ONLY.

      • David Appell says:

        Mike Flynn wrote:
        “Unfortunately, Nature sequesters more CO2 than is produced naturally. Creating CO2 by burning fossil fuel helps by putting back at least some of the CO2 stored by Nature millions of years ago, presumably for our use now.”

        Another Flynnerism.

        Atmospheric CO2 concentration was essentially constant for millennia before the industrial era. And the world plants were doing just fine.

        Are we managing climate for plants, or for people?

        • Mike Flynn says:

          David Appell,

          You don’t dispute anything I said, but still try to deny, divert, and confuse.

          All the fossil fuels contain carbon sequestered from the atmosphere. Fact.

          “Essentially constant” is not only pointless, but also meaningless.

          You can’t “manage climate” at all. Delusionary thinking.

          Without sufficient CO2 and H2O, plants perish. Shortly thereafter, so does all oxygen breathing life on the planet. So yes, without plants, no people. You best look after your food source, at all costs.

          You obviously believe in magic, if you believe you can survive without food.

          Cheers.

          • David Appell says:

            Mike Flynn says:”
            “Essentially constant is not only pointless, but also meaningless.”

            Now you’re denying arithmetic.

            “You cant manage climate at all. Delusionary thinking.”

            We’re doing it right now. And there are trivial ways to cool the planet — just mimic a volcano.

            Without sufficient CO2 and H2O, plants perish.”

            Why not plants on Venus? Mars? Both have 96% atmo CO2.

  53. Ken Gregory says:

    Here is the Remote Sensing System temperature revision, October – August 2016:
    https://www.friendsofscience.org/assets/images/RSS_Revision_Oct2016.jpg

    Both are LT Ver. 3.3. I see no explanation for the large revision on the RSS website.

    Does anyone know why there was the large revision? I submitted this question to the RSS website.

  54. WizGeek says:

    When government offices are allowed to pick winners and losers by virtue of taxpayer-funded subsidies, grants, programs, etc., then politics is inappropriately intertwined with science. (Read Ayn Rands Atlas Shrugged for a dramatic walk-through of this meddling.) Consensus is not scienceeven if its a 97% consensus of a cherry-picked subset of a cherry-picked sample. Scientific *laws* are based on reproducible, empirical, evidence-based experiments and evidence. Scientific *theory* is a possible explanation of empirical evidence alone. Scientific *hypothesis* (like the stuff offered by the IPCC and public-funded alarmists) is anything someone throws up on the wall to see if it sticks. The only reason it has stuck so long is because it plays upon the fears of the unknowing masses who in turn allow taxpayer-funded subsidies of said fear mongering entities.

    • Gordon Robertson says:

      WizGeek…”When government offices are allowed to pick winners and losers by virtue of taxpayer-funded subsidies, grants, programs, etc., then politics is inappropriately intertwined with science”.

      That’s been a concern since the 1950s when Eisenhower started funding science with government grants. He expressed his concern that the funding could be abused and he was right.

    • David Appell says:

      The private sector only funds science that is profitable or potentially profitable.

      It isn’t interested in scientific truth for its own sake.

      Hence it’s the people who must fund science if they want the truth.

      PS: Most people read Ayn Rand in high school. And most see her ideas’ huge flaws by the time they graduate college.

      • Lewis says:

        David,

        It is easy to see abuse in many of the ways funding is awarded along with what the funding actually pays for. Seriously, do you want to have your entire tax bill paying for the study of ” Funded by: U.S. Department of Health and Human Services o Summary: Series of taxpayer-funded studies to determine if stressed-out monkeys with access to cocaine are vulnerable to cocaine abuse” – cost $1.4 Million.

        I could go on, but you’re in denial. The point being that government collects your money, then wastes it on projects you would never spend the money on if it was yours.

        Seriously David, do we need a study of the drugs you’re doing and how they affect your perception?

        Lewis

  55. The lower global temperature trend will be intensifying as we move forward.

    • David Appell says:

      “here is my prediction for climate going forward, this decade will be the decade of cooling.”
      – Salvatore del Prete, 11/23/2010
      http://ourchangingclimate.wordpress.com/2010/10/20/andrew-dessler-debating-richard-lindzen/#comment-8875

      • ralph says:

        Julius Caesar: The Ides of March are come.

        Soothsayer: Ay, Caesar, but not gone.

      • Lewis says:

        David,
        Still harassing Salvatore I see. Have you decided to harass the purveyors of the AGW claims yet, just to be consistent. You know the ones, where for every once of additional CO2 in the atmosphere, global temperature rises a bit?

        No? Why not? Would that be because you’re a religious zealot who spends his time proselytizing?

        You say not! All zealots say not.

        Enjoy President Trump.

        • Mike Flynn says:

          Lewis,

          David’s still trying to get a subsidy for his CO2 house heating system. He’s calculated that filling wall cavities with CO2 will cause them to rise in temperature.

          At a modest 2 C per doubling, around 500,000 ppm should raise the temperature 20 C. Of course, this is on top of the 33 C temperature rise already claimed by GHE enthusiasts!

          Maybe his system runs far too hot, and he needs to figure how to reduce the GHE, so the occupants won’t fry, boil, roast or toast!

          Unfortunately, the GHE enthusiasts can’t accept that insulators provide no energy. They heat nothing. David claims to have a PhD in physics. Maybe he had a cold, and missed the lectures relating to energy, heat, temperature and so on.

          No GHE. Mild insulating effect – nothing more, nothing less.

          Cheers.

          • Norman says:

            Mike Flynn

            You state: “Unfortunately, the GHE enthusiasts cant accept that insulators provide no energy. They heat nothing. David claims to have a PhD in physics. Maybe he had a cold, and missed the lectures relating to energy, heat, temperature and so on”

            Too bad you cannot accept the mechanism that is the GHE instead of continuing along lines that have not been claimed by people who understand the physics and how it works. Your lack of understanding seems to be a flaw within your own logical processing and not found outside your limited view of physics and science or heat transfer.

            Insulators do not create energy is a true statement. Who said they did? I have not read a post by David Appell making such a claim or anyone else. I have heard many make the correct claim (including Roy Spencer on many occasions). Insulators will make a source of energy warmer than it would be without an insulator. A room in winter with an energy source (I think I might have to repeat that 100 times for it to sink into your thoughts)…ENERGY SOURCE (maybe repeat those words) will be warmer if insulated than if it is not insulated.

            The GHE works because the Earth has a constant input of solar energy. You are either a dense one or purposefully being a troll. I think the latter is the correct one. No one could continue to repeat the same flaw in reasoning hundreds of times after being correct the same amount of times and still post it every chance they get.

            I think you just like to get under the skin of David Appell. Not sure why this appeals to you. I would prefer to learn and understand the physics involved. I guess we are just wired differently.

          • Mike Flynn says:

            Norman,

            Insulators work both ways.

            Putting an insulator between you and the Sun reduces your temperature.

            GHE supporters apparently deny this. Do you think that putting an insulator between you and the Sun makes you hotter? Even NASA agrees that the atmosphere reduces the amount of insolation by around 30%!

            Cooler, not hotter.

            As to the Earth receiving a constant amount of solar energy, after four and a half billion years of receiving solar energy, the surface temperature has dropped by some thousands of Kelvins.

            At night, the surface cools, losing all the heat it absorbed during the day (plus a wee bit more from the interior, as Fourier pointed out over a century ago).

            No GHE. Not even a falsifiable GHE hypothesis! Some science.

            Cheers.

          • Norman says:

            Mike Flynn

            Your point: “GHE supporters apparently deny this. Do you think that putting an insulator between you and the Sun makes you hotter? Even NASA agrees that the atmosphere reduces the amount of insolation by around 30%!”

            I have already addressed your point in an earlier post. You do believe in the 1st Law of Thermodynamics correct? What happens to the 30% absorbed by the atmosphere? It does not disappear correct?

            That energy warms the atmosphere and becomes part of the IR flux some goes up some goes down. The down part is energy that is absorbed by the surface allowing it to reach a higher temperature than if no GHG were present.

          • Norman says:

            Mike Flynn

            You really have to get over your mindless repetition that the Earth has cooled for the last 4.5 billion years.

            Yes scientists believe the Earth was molten when formed but it cooled quickly and did not continue to cool as the solar energy maintains a basic temperature for the surface. I really don’t know if you are that mentally lame or pretending to be for your own amusement.

            Last million years of temperature data.
            http://www.heritage.org/multimedia/infographic/2016/04/bg3119/global-temperatures-fluctuate-over-past-million-years

            Overall (if you can determine patterns in sine waves or see trends in them) the temperature is basically the same over a million years. It goes up and down in cycles but shows no overall trend in cooling. Your point is very lame and not supported by any known data. I think your belief must be repetition makes it true.

          • Mike Flynn says:

            Norman,

            I see you stick to denial.

            The Earth’s surface has cooled since its creation, whether you choose to believe it or not. No amount of cherry picking, whether it’s tens, hundreds, or millions of years will make a fact go away. It will continue to cool until it becomes isothermal beyond the influence of the Sun. Ask any geologist, or geophysicist.

            As to insulation making the surface hotter. You’re dreaming, surely! The Moons surface gets far hotter than the Earth’s – no atmosphere at all. No insulation effect.

            The hottest places on Earth have the least amount of the most important alleged GHG, H2O. These are the arid tropical deserts.

            So keep believing your fantasies. If you believe you can make something lying in the Sun get even hotter by putting an insulator between it and the sunlight, maybe you should patent your brilliant idea, and make a large fortune. No GHE. Not even a scientific falsifiable GHE hypothesis.

            You may call it what you like, but science it certainly is not.

            Cheers.

          • Norman says:

            Mike Flynn

            Your statement: “The Earths surface has cooled since its creation, whether you choose to believe it or not. No amount of cherry picking, whether its tens, hundreds, or millions of years will make a fact go away. It will continue to cool until it becomes isothermal beyond the influence of the Sun. Ask any geologist, or geophysicist.”

            The first part is true. It has cooled since it was formed in a molten state. Your following statement is incorrect. The surface of the Earth does not continue to cool. It cools and warms in cycles but does not continue to cool. I am sure no geologist will agree with you statement. I have linked you to information that shows the interior is barely cooling since it is being sustained by radioactive decay. I am not sure where you are getting the information you post or why you post it with such certainty when it is flawed.

            Also you have no ability to comprehend averages or understand why they are used in science. The moon’s overall surface (average) is much cooler than the Earth’s.

            Averages are used in data when you are looking for trends. You average many points and determine if in time the average is going up, down or staying the same. It is useful to use in thing like death rate. Your point about the moon getting hotter during its long day than a point on Earth is like saying you know someone who smoked and lived to a hundred so smoking makes you live longer.

            I think you really are not trying much to think about what you are posting, not much science in it. You seem to lack understanding of some fundamental tools used in science to understand things. There is always hope the light might go on in your head some day.

          • Mike Flynn says:

            Norman,

            Average temperatures are quite meaningless, even if you could work them out, which you can’t. Sorry about that. Insolation changes moment to moment, albedo changes from moment, cloud cover, aerosols and so on change from moment to moment.

            Arid tropical deserts range from > 50 C to -10 C. The average is a comfortable 20 C. Foolish.

            The Earth under the unconcentrated rays iof the Sun can range from 85C to – 90 C. The average is meaningless. What is your local temperature? Average?

            An object on the surface of the Moon heats faster than the same object on the Earth. It is exposed to something like 30% more insolation. GHE enthusiasts obviously believe that more energy results in lower temperatures. Complete nonsense of course.

            Move a thermometer into the sunlight after being in the shade. You will notice its temperature goes up, not down.

            And at night, temperatures fall. The GHE only seems to work in direct sunlight! What a load of rubbish!

            Cheers.

          • Norman says:

            Mike Flynn

            I do like discussing things with you but you do get things wrong.

            For determining a comfort level an average temperature would not help but to determine a trend, averages help considerably.

            Are people getting taller? Heavier? Individual cases will not help determine this at all. Long term averages of the group will help determine trends.

            An average temperature of the Earth will not help you determine personal comfort but a long term trend can let you know if the overall temperature is warming, cooling or staying the same. If you are honest with the bulk measurements and not trying to adjust things to come up with results you want, it is a valid science and a good research study.

            Mike, Mike. Your statement: “An object on the surface of the Moon heats faster than the same object on the Earth. It is exposed to something like 30% more insolation. GHE enthusiasts obviously believe that more energy results in lower temperatures. Complete nonsense of course.”

            No GHE enthusiast believes more energy results in a lower temperature. No one is claiming the Moon’s surface does not get hotter than the Earth’s, the claim is you must take the total surface to get an average. The sun side of the moon is much warmer but the cold side is much colder, averaged out between hot and cold the moon’s overall surface is colder than the Moon’s. You can compare the two since they are quite similar. You have strange and twisted logical thought processes.

            You do not understand the GHE at all and maybe if you tried you would not post complete nonsense. Number one: The GHE does not warm the Earth’s surface. Please work to understand this reality. It is quite similar to an insulating effect. It keeps a surface warmer than what it would be without the effect but it alone warms nothing. You can be told this hundreds of times and still not understand it.

          • David Appell says:

            Mike Flynn says:
            “Average temperatures are quite meaningless, even if you could work them out, which you cant.”

            snarf!

          • David Appell says:

            Norman wrote:
            “You [Mike Flynn] do not understand the GHE at all and maybe if you tried you would not post complete nonsense.”

            Worse, he has no interesting in understanding it. Or confronting the evidence for it. He’d rather turn his brain off — and then insult people.

            It’s pretty weird, if you think about it.

          • David Appell says:

            Mike Flynn says:
            “The Earths surface has cooled since its creation, whether you choose to believe it or not.”

            Dumb garbage.

            The surface is about 8 C warmer than it was 25,000 years ago.

            It’s now rising by about 0.2 deg C/decade.

            Ignoring known facts is the only way you keep your bonzo ideas going.

        • David Appell says:

          Lewis says:
          “Still harassing Salvatore I see. Have you decided to harass the purveyors of the AGW claims yet, just to be consistent. You know the ones, where for every once of additional CO2 in the atmosphere, global temperature rises a bit?”

          “every once?” ounce?

          Anyway, your last sentence is true, so, no, I don’t “harass” people about it.

          PS: Salvatore deserves it.

  56. ralph says:

    This site seems to hate attempts at formatting tables!

  57. ren says:

    Temperature anomalies in Russia beyond the Urals exceed 10 degrees C below normal.
    http://pamola.um.maine.edu/fcst_frames/GFS-025deg/DailySummary/GFS-025deg_NH-SAT3_T2_anom.png

  58. Bindidon says:

    Oh no! The cerberus is here again, comments dropped. A bit frustrating indeed…

  59. Sea surface temperatures are coming down nicely, the AO looking to be negative this winter as I expected due to very low solar activity.

    Global temperatures have been down since the summer and this should intensify going forward, now that the sun is finally starting to reach my criteria.

    When one looks at the global temperature situation it is bullish for a cooling trend and what is significant is the warm areas of the globe most of them are located in latitudes above 70 degrees latitude, while EXTREME COLD especially in the N.H is common between latitudes 40 to 70 degrees north which is where it matters.

    It matters for two reasons, first the population is greater in those areas and secondly this area is the area that can increase the amount of global snow coverage and the percentage of the globe having below freezing temperatures.

    The latitudes above 70 N being below freezing and snow covered regardless if the temperature averages are above normal this time of year.

    So once the AP index and Solar Wind drop off to join the other low average value solar parameters the solar climate impact is just going to become more apparent in my opinion.

  60. Norman says:

    Kristian

    I read through your post above. If you have a sphere within a sphere the view factor is 1, the radiation in this case is bidirectional. All the radiation given off by one surface is absorbed by the other and visa versa.

    http://www.kostic.niu.edu/352/_352-posted/Heat_4e_Chap13-Radiation_HT_lecture-PDF.pdf

    Photons are not like gas molecules. They only move away from the source in straight lines (proven by shadows). If you only have one heated surface all photons will be moving away from the source, none toward it, they are quite directional.

    I found this for IR cameras.

    http://archives.njit.edu/vol01/etd/1990s/1997/njit-etd1997-027/njit-etd1997-027.pdf

    Your point: “If you had a radiometric instrument and you pointed its cryogenically cooled detector, not UP, not DOWN, but in a horizontal direction, do you think it would detect a photon flux coming in from there as well? Of course it would. The air temperature is higher than the detector temperature in that direction also. Does that mean we should account for a lateral-welling long wave IR flux as well”

    The point is the lateral photon flux does not hit the surface so it would not have any impact on the energy exchange.

    If you take a super cooled detector and point it at the Earth’s surface it will give you the actual upward flux (not a net of up and down, it does not know what the downwelling flux is). All you will have is an upwelling flux into the instrument and it will warm the array and give an actual upwelling watts (energy needed to raise the internal temperature). This will be around 390 W/m^2. The photons from the surface will only be moving in one direction, up. If you take the same device and point it upward it will get a downwelling flux of 345 W/m^2. All this energy is coming from the heated GHG molecules in the air. Real flow of energy, real bidirectional.

    • “Photons … only move away from the source in straight lines (proven by shadows).”
      Wrong.
      The shadows analogy is wrong since the sun is like a point source on Earth.

      “If you only have one heated surface all photons will be moving away from the source, none toward it, they are quite directional.”
      Wrong.
      Both spheres emit photons in all directions. You cannot simply assume that, because one sphere is hotter, that all the photons only originate from it.
      What happens if both spheres are exactly the same temperature? Are there no photons?
      What happens if one sphere is slightly cooler than the other, but slowly warms to become warmer. Do all the photons from one sphere decide to stop while all the photons from the other sphere decide to wake up?
      These questions expose the contradictions in your assertions.

      • Norman says:

        Chu En Ginsberg

        You did not read my post correctly. I stated if you only had one heated surface and no other then the photons only move away from that surface, none toward it. If you have multiple surfaces with temperature you need to use view factors to determine the amount of IR each surface will “see”. Hope that clears it up for you.

    • Mike Flynn says:

      Norman,

      And at night, with temperatures dropping, you will get radiation from the cooling atmosphere. That’s why it cools. Otherwise, it would heat up, wouldn’t it?

      Ice just below freezing radiates over 300 W/m2. 10 square metres, 3000 W. Now try to boil some water with it, for a refreshing cuppa. Maybe you could try concentrating the heat – how about a large Fresnel lens? Maybe a parabolic mirror?

      This is simplistic and nonsensical GHE thinking. It even appears logical to those of limited intellect, but requires the use of magic at some point or another.

      The surface heats during the day, and cools at night. After four and a half billion billion years of continuous sunlight, it’s cooled some thousands of Kelvins. It’s still cooling at between one and three millionths of a degree per annum. At least according to real, rather than RealClimate, scientists.

      So off you go. Deny, divert, and confuse. You can’t argue with anything I say, but you can’t accept the facts. So sad. Too bad. Maybe you could have a tantrum! Or talk about something totally irrelevant.

      Cheers.

      • Norman says:

        Mike Flynn

        What is the basis of your claim “Its still cooling at between one and three millionths of a degree per annum. At least according to real, rather than RealClimate, scientists.”

        If you think climate scientists come up with fake data that would have to be the fakest. How would one get such precise measurements for the globe?

        Mike Flynn, IR is diffuse radiation like visible light in a fog. It is radiated from all parts of the atmosphere and has no point source. How would you think to concentrate such energy? Can you concentrate sunlight in a fog with a lens? Didn’t think so?

        You also should understand that the ice emitting 300 W/m^2 will warm an object that is colder and emitting much less energy than this.

        You really should spend some time learning radiation physics it will help you a lot. A cooler object will not warm a warmer object, but a cooler object will keep a warmer object warmer than if it was not there. You really do not grasp this do you.

        Here is a link to a free physics book on heat transfer. A whole chapter devoted to radiation physics.

        http://web.mit.edu/lienhard/www/ahtt.html

        • Mike Flynn says:

          Norman,

          Over 100 years ago –

          “Based on the geothermal gradient (about 1/foot in deep mines) and an assumption that at molten rocks existed at depth, he determined from the geothermal gradient that the cooling rate of the Earth would be somewhere between 0.00006/yr and 0.0002/yr.”

          Of course, Lord Kelvin was quite wrong. He was unaware of radioactivity. Modern geophysicists have access to far more accurate measurements. The Earth is not cooling anywhere near as fast as Kelvin or Fourier calculated. I’ll let you find the geophysical peer reviewed papers yourself. You’ll deny the truth of anything I say.

          Your attempt to mislead by talking about “warmer than if it was not there”, is irrelevant. GHE acolytes claim actual increases in temperature, as in Gavin Schmidt (a mathematician, not a scientist, by the way), breathlessly claiming “Hottest year EVAH!”. No GHE. No heating from CO2.

          You may notice that the surface cools at night. You may even experience a low level inversion, where the surface is actually colder than the atmosphere above it, and continuing to cool. The warmer atmosphere cannot prevent the surface from cooling. Interesting, isn’t it?

          Any basic physics text should be able to explain why this happens. Maybe you could actually correct me where I have been factually incorrect, but it’s unlikely. Feel free to try. You haven’t managed to do it so far!

          Cheers.

          • Norman says:

            Mike Flynn

            I think you lack the ability to understand the meaning of words. The Lord Kelvin gradient and your geophysical numbers (which I have already posted to you no a previous thread) are for the Earth as a whole and not its surface. I guess you do not know what the word surface means. Here I can help:

            http://www.dictionary.com/browse/surface?o=10..

            I have linked to you nights that do not cool and in some cases the temperature rises a bit. Thick cloudy nights. Why waste time posting to you since you are immune to reality and facts and live in some sort of cult bubble where you mindlessly chant your beliefs hoping to convert a follower to your brand of belief. It does not have to be based upon reality or facts, just saying it makes it true. You are a “True Believer” in your own reality.

            If you are not too lazy click this link and scroll down to look at hourly temperatures. It is cloudy during the night and you tell me what the night time temperatures are doing. Winds are calm.

            https://www.wunderground.com/history/airport/KAVP/2015/1/4/DailyHistory.html?req_city=Penn+State+Geisinger+Wyoming+Valley&req_state=PA&req_statename=Pennsylvania&reqdb.zip=18705&reqdb.magic=15&reqdb.wmo=99999

          • Norman says:

            Mike Flynn

            If you increase the amount of insulation of a house with the same furnace input energy what will happen to the temperature? Will it stay the same?

            You really do not grasp that the Earth is continuously receiving energy. It boggles your circuits and you can’t see it (like in Westworld).

            Take a light bulb in an open environment and measure the surface temperature of the glass casing (while it has power to it). Under the same conditions wrap insulation around it and see what happens to the surface temperature of the glass.

            More GHG (to a point) in the atmosphere can potentially increase the emissivity of the atmosphere so that more energy returns to the surface (the heated gases are now emitting IR towards the surface).

            Evidence from CERES indicates the additional carbon dioxide is not doing much. I could argue (with evidence) against AGW that the addition of carbon dioxide is enhancing warming but that would not mean I reject the GHE as you choose to do.

          • David Appell says:

            Norman, are you using raw CERES data?

            It’s a satellite. Its raw data will need adjustments.

          • Norman says:

            David Appell

            Here is a good study matching CERES with ground based instruments.

            http://digitalcommons.unl.edu/cgi/viewcontent.cgi?article=1100&context=nasapub

            I would hope that the data they present is not raw but what they believe is the correct surface radiation (that is coming from the graphs of the data).

            Also if they did not change how they are determining surface radiation then the long term trend should be a valid interpretation of what is going on.

            The Global CERES Net radiation (SW down and SW up, LW down and LW up) does not show an upward trend from 2000 to 2015.

          • David Appell says:

            Norman, what about that study? It’s at a single location, not globally.

            I’m sorry, I’m simply not going to accept an amateur’s calculation of raw satellite data. Not mine, and not yours. Those data are very difficult to deal with — UAH still doesn’t have it right, after almost 40 years and many changes now.

          • Norman says:

            David Appell

            Your point may be correct. The fact remains that the CERES global data does not show any increase in the average net energy hitting the Earth’s surface. Their data may be wrong but each time they calculate a year they would have to removing energy that should show up. If the calculations are done the same each time then no biasing agent in time should exist.

            At least with the current CERES data there is no evidence of AGW since 2000.

            If the globe has actually warmed since that time (Arctic ice melt does not show a trend of increasing melting are wise in that time frame)

            It appears to have reached a lower point in 2007 from the earlier years of 2000-2016 then it stopped declining and basically meanders around a lower point.

          • Norman says:

            David Appell

            https://ceres-tool.larc.nasa.gov/ord-tool/srbavg

            On this link click the “Visualize Data” button at bottom left of page. It will bring up all types of CERES surface radiation graphs.

            You can even look at the Net Longwave data and it shows the Earth is losing more IR energy today than it was in 2000. This is only part of the picture, however. I like to look at the Net total flux.

            If the Earth is warming and the CERES data is valid, you would have to conclude the warming is not do to AGW but to something dampening the cooling mechanisms like evaporation or thermals.

            So you get some logical choices:

            1) CERES data is flawed and not showing increase energy to the surface which is actually taking place.
            2) CERES data is valid and the globe is warming anyway without increase in energy. The surface cooling processes have changed.
            3) CERES data is valid and the satellite data shows no warming but GISS shows warming. It would indicate UAH is better data than GISS.

            I can’t say which is the correct choice. But with this data I think a good scientist could not be in the 97% group that says AGW is settled science. The science itself is contradictory and until the contradiction can be resolved their can be no settled science.

          • Norman says:

            David Appell

            The CERES link in my previous post does not work. It was a link to the graphs and it generates and error message.

            This link should work if you are interested in looking at the data.

            https://ceres-tool.larc.nasa.gov/ord-tool/jsp/EBAFSFCSelection.jsp

          • David Appell says:

            Norman, I’m sorry, I’m just not going to take my science from comments on blogs.

          • Norman says:

            David Appell

            You would not have to take “science” off my blog posts but you could look at the data from the CERES link yourself. Science is a product of the available data and theories proposed to explain the data, the theories that are able to best explain the data are the ones retained until a better theory comes up that can explain the data better.

            If you look at the CERES graphs what do you see?

        • Mike Flynn says:

          Norman,

          Would it be asking too much for you to possibly concentrate on reality? If you could even point to a falsifiable GHE hypothesis, it would be a start.

          All you seem to be able to do is attempt to deny, divert, and confuse.

          Light bulbs, clouds, fog, an average Sun shining continuously on the entire surface of an average Earth (according to foolish Gavin Schmidt and his deluded followers) – the GHE believers believe that CO2 has mysterious heating (as in “Hottest year EVAH!”) properties!

          And yet, no falsifiable hypothesis, no experimental support – nothing. Just endless claims that CO2 possesses miraculous heating properties. Uri Geller claimed magical spoon bending properties for his mind.

          I haven’t seen any scientific support for that claim, either.

          Cheers.

      • David Appell says:

        Mike Flynn wrote:
        “Its still cooling at between one and three millionths of a degree per annum”

        False — it’s warming about about 0.2 C per decade.

        You avoid any and all evidence you don’t like, and even (as here) lie about it. That’s exactly why you’re a “denier.” The best example yet.

        • Mike Flynn says:

          Norman,

          Try lying in the desert on a clear night.

          Take all your clothes off, and try to avoid freezing to death, when temperatures drop below freezing.

          Explain your GHE in terms of a positive energy balance, or back radiation.

          It might also appear that winter is colder than summer. GHE supporters scratch their heads trying to explain reality.

          This might explain why they keep changing the subject to searchlights, overcoats – or anything that avoids addressing the lack of say, a falsifiable GHE hypothesis. A key step in the scientific process.

          Sorry, no GHE. Thermometers react to heat. Lots more people burning lots more fossil fuel create lots more heat. Do you expect thermometers to drop?

          Before you wander off into comparisons of proportions, I’ll specify cooling nighttime conditions, so you won’t get confused by the influence of the Sun.

          Cheers.

          • David Appell says:

            Mike Flynn says:
            “Take all your clothes off, and try to avoid freezing to death, when temperatures drop below freezing.”

            If the temperature drops below zero, of course you will freeze. That doens’t contradict greenhouse theory in any way.

            Every scientist on the planet knows there is a greenhouse effect.

            How is it you have never once look at their evidence for it?

            You seem completely disinterested in evidence — the surest sign of a pure denier.

        • Norman says:

          Mike Flynn

          Your Statement: “Try lying in the desert on a clear night.

          Take all your clothes off, and try to avoid freezing to death, when temperatures drop below freezing.

          Explain your GHE in terms of a positive energy balance, or back radiation.”

          I really do not know why you are stuck on the wrong track here. You repeat these things that no one understanding the GHE is stating. I think PSI group believes that is what scientists are saying about the GHE but no one really is.

          Do you remember this post from Roy Spencer?
          http://www.drroyspencer.com/2015/04/why-summer-nighttime-temperatures-dont-fall-below-freezing/

          You will freeze either way just faster without any GHE.

          I have linked you to measured values before but I think you like to ignore evidence. It shows the GHE does not add heat to the surface. It will add energy but the amount of energy it is adding is less than what the surface is losing.

          http://www.esrl.noaa.gov/gmd/webdata/tmp/surfrad_582bc8b4e37f5.png

          Just a snapshot of radiant energy from Nevada Desert current conditions. Please try to understand the graph. It is not so difficult to do. The Downwelling IR (back-radiation) is less than the Upwelling IR. About 100 W/m^2 difference at night and greater during the day (since the ground warms must faster than the air above). The GHE does not stop the ground for cooling at night nor does it add energy to the surface. It will slow down the cooling rate and with an input of new energy the overall average temperature (between both day and night) will be higher than if there was no GHE (like on the Moon).

          The problem is not with the GHE it is completely with your inability to understand it. No matter how many times it is explained to you you still restate it totally wrong and then claim it is impossible. What you claim IS impossible (colder air heating surface), it is not what the GHE scientists are claiming.

          • David Appell says:

            Norman, Flynn has no desire at all to understand the greenhouse effect. He sticks his head in the sand when confronted with any and all evidence.

            As someone said above, he is simply a troll. And not a very smart one.

          • Norman says:

            David Appell

            I agree with your observation about Mike Flynn. With a surface he only wants to use the Sun facing side and completely ignore the other half.

            The Moon’s sunlit surface gets warmer than the Earth’s so it proves to him GHE is a hoax. Yet he thinks it is okay to only talk about 1/2 a surface. At the same time the Earth and Moon surface face the Sun the other half is in the dark.

            If one had the money and time temperature sensors could be placed on every square meter of Earth and Moon. You could take all the readings of each sensor and get an average temperature of the whole surface. The Moon would average much colder than Earth.

            It is beyond poor reasoning to not be able to understand the concept of an average.

          • Toneb says:

            “As someone said above, he is simply a troll. And not a very smart one.”

            And I’ll say it again, whether here or at CE.
            A Troll with zero desire to learn and 100% desire to annoy.
            Just don’t feed.
            That is why he does what he does.

          • Mike Flynn says:

            Norman,

            You say the GHE does not add heat to the surface, but does add energy.

            This seems to be at odds with the breathless announcements of “Hottest year EVAH!’ from mathematicians such as Gavin Schmidt. So the GHE does not add heat, but energy, which results in additional heat which you claim is not added by the GHE.

            This sort of nonsense explains why no GHE supporters can actually frame a falsifiable GHE hypothesis, but keep claiming that one exists. Non-science at its finest!

            No GHE. Just wild unsubstantiated assertions. You cannot heat anything with a GHG. The mild insulating effect of the atmosphere stops the surface heating as fast during the day, and cooling as fast at night.

            The fastest daytime heating and nighttime cooling locations on Earth are arid tropical deserts, characterised by the most GHG free atmospheres on the planet. Maybe you forgot that the most important GHG is supposedly H2O.

            Keep believing in the GHE if you wish. It won’t make any difference.

            Cheers.

          • Norman says:

            Mike Flynn

            Your inability to understand even simple ideas is truly astonishing. I think it actually takes considerable effort.

            Here you state: “So the GHE does not add heat, but energy, which results in additional heat which you claim is not added by the GHE.”

            It is the way posters on this blog have been defining the terms over the years. I know you understand these as you have posted many many times. Energy and Heat are not synonymous. Heat is a flow of energy from Hot to cold.

            Here you can look at it yourself unless you are too lazy to click on a link.
            http://hyperphysics.phy-astr.gsu.edu/hbase/thermo/heat.html

            If the energy added to the surface is LESS THAN (I am hoping you took some basic math in High School and can comprehend the concept of Less than or greater than) the energy lost to the surface, the surface will cool.

            I have posted links to show you this. You must be of the younger generation as you seem too lazy to click on links provided. The Downwelling (GHE) IR is almost always LESS THAN the Upwelling IR emitted by the surface.

            Since you are so incredibly lazy and unmotivated it is not reasonable to discuss ideas with you. If you ever find a bit of motivation it might be a good experience to communicate thoughtful science ideas with you. As long as you remain a lazy and unmotivated person though it just grinds to a slow unproductive process.

          • Norman says:

            Mike Flynn

            I have discussed this point several times with different posters: “The fastest daytime heating and nighttime cooling locations on Earth are arid tropical deserts, characterised by the most GHG free atmospheres on the planet. Maybe you forgot that the most important GHG is supposedly H2O.”

            Water is a complex player in the climate system. It will add energy (not Heat) to the surface via backradiation so that is a positive, but it will also form thick clouds that cut off solar insolation from reaching the surface which is a negative. Also evaporation will remove a large amount of heat from the surface acting as a negative. All these processes are at play and all have various effects on an individual region.

            The GHE is still quite strong in the Desert but less than in a humid area.

            Here are some graphic links to show you.
            Nevada desert this summer.

            Downwelling IR between 375 down to around 325 Watts/m^2
            http://www.esrl.noaa.gov/gmd/webdata/tmp/surfrad_582d34ae3bb84.png

            Now of a much wetter Mississippi location
            Downwelling IR peaks at 450 Watts/m^2 and goes down to 400 Watts/m^2
            http://www.esrl.noaa.gov/gmd/webdata/tmp/surfrad_582d34eb62012.png

            The desert GHE is about 75 Watts/m^2 less than the wet area, but the wet area gets cooled by evaporation and cloud cover so overall can be cooler than the desert for peak temperatures. This does not mean the GHE is not working on both locations.

          • Mike Flynn says:

            Norman,

            As you are unable to provide a falsifiable GHE hypothesis, comments such as ”
            The GHE is still quite strong in the Desert but less than in a humid area.”, might indicate that you’re grasping at straws.

            Somebody noticing that arid desert regions exposed to exactly the same insolation get hotter than adjacent humid areas might conclude that your fabled GHE actually works to keep areas with more GHGs cooler, rather than hotter.

            Your attempts to deny easily observable facts, and then try to divert and confuse, show your level of understanding.

            Most GHE fanatics have trouble understanding the relationship between energy, heat, and temperature. Using capital letters won’t make any difference. Belief doesn’t overcome fact.

            GHGs heat nothing. No “Hottest year EVAH!” due to CO2. Gavin Schmidt and his fellow believers are merely deluded. Inept players of toy computer games which have provided precisely no benefit to humanity at all.

            Billions of dollars diverted from real science. Pity.

            Cheers.

          • Norman says:

            MIke Flynn

            Not only are you too lazy to click on links but far too lazy to read a post but then have the need to comment on it without reading it.

            Without reading my post you continued on to post this (which I had just explained): “Somebody noticing that arid desert regions exposed to exactly the same insolation get hotter than adjacent humid areas might conclude that your fabled GHE actually works to keep areas with more GHGs cooler, rather than hotter.”

            I will post this again my explanation: “Water is a complex player in the climate system. It will add energy (not Heat) to the surface via backradiation so that is a positive, but it will also form thick clouds that cut off solar insolation from reaching the surface which is a negative. Also evaporation will remove a large amount of heat from the surface acting as a negative. All these processes are at play and all have various effects on an individual region.”

            The GHE is not keeping the wetter areas cooling, evaporation and clouds are doing this. The GHE is keeping the surface at a higher temperature than without the GHE, other processes are causing a cooling effect. Just for you: EVAPORATION AND CLOUDS!

          • Kristian says:

            Norman says, November 17, 2016 at 6:06 AM:

            “Water is a complex player in the climate system. It will add energy (not Heat) to the surface via backradiation so that is a positive, but it will also form thick clouds that cut off solar insolation from reaching the surface which is a negative. Also evaporation will remove a large amount of heat from the surface acting as a negative. All these processes are at play and all have various effects on an individual region.”

            The GHE is not keeping the wetter areas cooling, evaporation and clouds are doing this. The GHE is keeping the surface at a higher temperature than without the GHE, other processes are causing a cooling effect. Just for you: EVAPORATION AND CLOUDS!

            You just don’t want to understand this, do you, Norman!?

            As you move from the semi-arid Sahara-Sahel belt at 14-20 degrees N of the equator to the highly humid Congo basin straddling the equator itself (5N-6S), you move from an atmosphere containing relatively limited amounts of relevant IR-active constituents like water vapour and clouds, to an atmosphere containing several times as much. This should mean, as per the idea of “radiative forcing”, that much less of the radiation escaping the surface manages to leave the system as a whole, through the ToA to space, in the Congo than in the Sahara-Sahel. And it does (CERES). Another way of describing essentially the same phenomenon is to say that there should be much more atmospheric “back radiation” down to the surface in the Congo than in the Sahara-Sahel, leading to a much smaller raditive HEAT loss (net LW) in the former than in the latter. Again true (CERES). What’s more, we find, through CERES EBAF surface estimates, based on direct measurements, that on average, the surface in the Congo absorbs a little bit MORE solar heat (ASR_sfc) than the surface in the Sahara-Sahel does.

            And yet, the average surface temperature in the Congo is several degrees LOWER than in the Sahara-Sahel. Much more “back radiation” from the atmosphere, much smaller radiant heat loss as a result, and just as much heat in from the Sun. And STILL the surface is much COOLER on average!

            This isn’t evidence against the GHE, Norman. It is evidence against the notion that you can enhance a “radiative GHE” by simply making the atmospheric column more IR active. By simply making the atmosphere more opaque to outgoing surface IR. There is no such direct connection.

            It doesn’t matter WHAT makes the surface in the Congo cooler than the Sahara-Sahel. What matters is that the atmospheric column above the surface in the Congo is MUCH, MUCH more opaque to outgoing surface IR than in the Sahara-Sahel, and so the surface radiant heat loss is only half as intense, half as effective at ridding the surface of excess energy, and STILL this cannot make the surface any warmer at all. The surface is still COOLER.

            Yes, there are other processes besides radiative ones at work. THAT’S EXACTLY THE POINT, Norman!

            All Else Is NEVER (!!!) Equal. You cannot – in the real world – change one variable and expect everything else to remain unchanged …

          • Norman says:

            Kristian

            It is not I who have the problem comprehending what is going on. I had a long discussion with you about the Sahara and Congo and that evaporation is what cools the surface. If you look at the globe of CERES you will see that the NET radiation to the surface averages positive of over 100 watt/m^2 yet the surface is not heating up. That is because evaporation and thermals remove this amount from the surface and it remains in an equilibrium condition.

            Why is this hard for you to grasp? Yes the Congo does have more backradiation than the Sahara.

            Use CERES and you can see more NET radiation hits the Southern hemisphere than the Northern, about 10 W/m^2 more. The Southern hemisphere is colder than the Northern even though more energy is reaching its surface. What is a big difference. The Southern has much more water than land.

            http://www.physicalgeography.net/fundamentals/8o.html

            The water evaporates and takes away more energy in the Southern hemisphere relative to the Northern so the overall surface remains cooler. I went through this with you step by step, energy exchange by energy exchange.

    • Kristian says:

      As always, we’re getting nowhere with this, Norman. I can’t believe you still manage to misconstrue this. As long as you continue to refuse to even make an attempt at grasping my perspective, there is no way for me to get through to you and no way for you to understand where I’m coming from.

      You write:
      “I read through your post above. If you have a sphere within a sphere the view factor is 1, the radiation in this case is bidirectional. All the radiation given off by one surface is absorbed by the other and visa versa.”

      See, this is it. You’re talking about “radiation” as if it were just “streams of individual photons collected into single arrows on a piece of paper”, as if they were all perfectly collimated, coherent and polarised, like laser beams. But this is nothing but a purely conceptual, simplified, mathematical model of radiation. It is not what radiation is actually about. And especially it is not what thermal radiation of participating media like our radiatively active atmosphere is all about.

      Thermal radiation as a physical phenomenon is better described as a “photon gas” or “cloud”, and as you move through a thermal radiation field, from hotter to colder, you will pass down a gradient of “radiative intensity”. There is no way, in the real, physical world in which we live, that we can ever single out, “see” and track individual photons sort of on their way through the “photon gas”. No, they ARE the “photon gas”. The “photon gas/cloud” just IS. The energy is just THERE. A result of, and an expression of, temperatures.

      Planck described it like this:
      http://www.gutenberg.org/files/40030/40030-pdf.pdf?session_id=e3d0a269335695eff7149c13b1683f3f3ad6b4df (s.2-3)

      (…) the state of the radiation at a given instant and at a given point of the medium cannot be represented, as can the flow of heat by conduction, by a single vector (that is, a single directed quantity). All heat rays [photons] which at a given instant pass through the same point of the medium are perfectly independent of one another, and in order to specify completely the state of the radiation the intensity of radiation must be known in all the directions, infinite in number, which pass through the point in question (…)

      The only thing we experience is the gradient of radiative intensity as we move through the radiation field. The gradient will change, and we will feel it, whenever there’s a temperature change on either side of the field. We can’t and we don’t feel individual photons. We also cannot and do not feel groups of individual photons, like rays striking us here and there. We only feel the photon gas/cloud as a whole. As ONE macroscopic phenomenon.

      And so this is what radiation is in the real world – something to be DETECTED. Either with a radiometric instrument or with our senses. And what we detect, always and without exception, is radiant HEAT. Coming in or moving out.

      This is what I’ve been talking about all along: the “radiant flux” (W/m^2) as in the macroscopic, probabilistically averaged (net) movement of radiant energy through a radiation field (a photon gas/cloud).

      “Radiative transfer.”

      When two objects or regions are brought into some kind of thermal/thermodynamic contact, their individual photon clouds are brought together as well. The individual clouds will not change per se, even as they merge into one, now occupying the same space, raising the overall energy density. However, the net MOVEMENT of energy through the clouds will change. It will change according to the temperature/emissivity difference between the two objects/regions.

      You can read more about these things here:
      http://www.rpi.edu/dept/phys/Courses/PHYS4420/BlackBodyThermo.pdf

      The system to which the thermodynamics is being applied is certainly a strange one when compared to typical problems encountered in say, engineering thermodynamics. This system consists of electromagnetic radiation in thermodynamic equilibrium inside a closed, completely evacuated cavity of arbitrary shape with volume V and temperature T. Volume and temperature represent the two independent and measureable parameters in terms of which all thermodynamic variables may be expressed. Since equilibrium is assumed, one may define the radiation temperature as that of the walls. The system is an isothermal enclosure, and every point has the property that the intensity is independent of position. Furthermore, the radiation is isotropic and unpolarized.

      A typical approach taken by most modern physics texts is to treat the radiation as a series of standing waves. The normal-mode density and energy per mode are calculated, and this leads to the Planck law. An alternative viewpoint is taken in most statistical mechanics texts where one considers the system to consist of a photon gas that obeys Einstein-Bose statistics.

      (…)

      There are two somewhat different historical approaches to blackbody radiation. The first, due to Planck in 1900, considered the system as an assembly of harmonic oscillators with quantized energies of (n+1/2)hw (although Plack did not include the zero-point energy). The second viewpoint originated in Bose in 1924 and then Einstein in 1925, which considered the photon distribution over the energy levels. The two interpretations are actually the same; for example, in Planck’s method, an oscillator of energy (n+1/2)hw in the eigenstate n is equivalent to n photons in the energy level hw.

      A microscopic observer would find experiments to be rather dull at any point immersed in the blackbody radiation field. Since the field is isotropic and homogeneous, the luminosity would be independent of direction and he would be unaware of the cavity size in any direction. Furthermore, no polarization effects would be detected. If the temperature were varied, then he would measure changes in intensity and energy distribution (corresponding to a color change).

      (My emphasis.)

    • Kristian says:

      And here:

      1.16 OUTLINE OF RADIATIVE TRANSPORT THEORY

      When considering heat transfer by conduction and/or convection within a medium, we require knowledge of a number of material properties, such as thermal conductivity k, thermal diffusivity a, kinematic viscosity v, and so on. This knowledge, together with the law of conservation of energy, allows us to calculate the energy field within the medium in the form of the basic variable, temperature T. Once the temperature field is determined, the local heat flux vector may be found from Fourier’s law.

      The evaluation of radiative energy transport follows a similar pattern: Knowledge of radiative properties is required (emittance e, absorp tance a, and reflectance p, in the case of surfaces, as well as absorp tion coefficient k and scattering coefficient o_s for semitransparent media), and the law of conservation of energy is applied to determine the energy field. Two major differences exist between conduction/convection and thermal radiation that make the analysis of radiative transport somewhat more complex: (i) Unlike their thermophysical counterparts, radiative properties may be functions of direction as well as of wavelength, and (ii) the basic variable appearing in the law of conservation of radiative energy, the ‘radiative transfer equation’ introduced in the previous section, is not temperature but radiative intensity, which is a function not only of location in space (as is temperature), but also of direction. Only after the intensity field has been determined can the local temperatures (as well as the radiative heat flux vector) be calculated.

      There’s a clear distinction to be made between “radiation” (your focus) and “radiative energy transport” (my focus). And only the latter is relevant to thermodynamic problems.

      Further, you say:
      “The point is the lateral photon flux does not hit the surface so it would not have any impact on the energy exchange.”

      So you didn’t get my point at all. Why am I not surprised?

      “If you take a super cooled detector and point it at the Earth’s surface it will give you the actual upward flux (not a net of up and down, it does not know what the downwelling flux is).”

      Again, you are not getting at all what I’m saying, Norman! You’re just tightening your bubble, it seems …

      No, the super-cooled detector will detect the radiant HEAT (the net movement of radiant energy) from the surface to itself. There is no “downwelling flux”. Because a “flux” as you portray it (W/m^2) is inherently a MACROscopic phenomenon. And the only macroscopic flux through a radiation field is the NET, the UNIdirectional radiant heat. The net is NOT of up and down. In that sense, the net could just as well be of left and right. The real net is of ALL PHOTON MOVEMENTS in ALL POSSIBLE DIRECTIONS – not just the two of your choice – within the radiation field.

      How hard is this!!?

      “All you will have is an upwelling flux into the instrument and it will warm the array and give an actual upwelling watts (energy needed to raise the internal temperature). This will be around 390 W/m^2. The photons from the surface will only be moving in one direction, up. If you take the same device and point it upward it will get a downwelling flux of 345 W/m^2. All this energy is coming from the heated GHG molecules in the air. Real flow of energy, real bidirectional.”

      No. Can you please just read up on these instruments, Norman!? On their operating principle. The 390 and 345 W/m^2 values are derived from pyrgeometers. They specifically COMPUTE these numbers. They only ever DETECT the net, the radiant heat.

      If you don’t have a super-cooled detector, this is the way it’s done. You will not be able to detect a clean signal, and so you will have to calculate your “partial fluxes”. If you DO have a super-cooled detector, then there will be a close to pure heat flux moving into the detector from anywhere, simply because the detector is so bloody cold. The detected HEAT will be close to your calculated “partial flux”.

      Norman,
      You fool yourself into thinking there’s a bidirectional transfer simply because you yourself choose to point your instrument first down and then up. But the instrument will make a reading wherever you point it, Norman. It’s how it’s programmed to work. So you INVENT your bidirectional transfer. Simply by choosing up and down as your only directions of choice.

      Finally, do you think there’s a perfect vacuum between the surface and your downward-looking instrument sensor? Or that the intervening air is completely non-participating?

      • Kristian says:

        I’m sorry, but the link to the source of the quote above simply couldn’t get through the filter, for some inexplicable reason. But it’s from the book “Radiative Heat Transfer” by Michael F. Modest (Third Edition), pp. 27-28.

      • David Appell says:

        “There is no downwelling flux. Because a flux as you portray it (W/m^2) is inherently a MACROscopic phenomenon. And the only macroscopic flux through a radiation field is the NET, the UNIdirectional radiant heat. The net is NOT of up and down”

        Absolutely ridiculous.

        There is a flux in both directions. It can be measured. Those fluxes carry energy. Some of that energy strikes the surface. That is global warming.

      • Norman says:

        Kristian

        Most the articles you link to concern a black-body cavity where photons are given off by entire surface and moving in all directions.

        With thoughtful consideration I would agree that the atmosphere photon exchange would mimic a “photon gas” as the IR is coming from all directions. It is the same as visible light in a thick fog. It is diffuse and comes from all directions.

        Granted your point, the photons that are not moving up or down are not relevant to surface energy budget. The only photons that will effect the surface are the ones moving up (taking energy permanently away from the surface, or those moving down which add energy to the surface). The rest of the sideways photons will act only to maintain an equilibrium temperature, absorbed and emitted with no net effect on temperature.

        • Norman says:

          Kristian

          I have a good way to describe my view and will use visible light rather than IR (though they both act the same). Hope you “see” it.

          On a very clear night you are lying next to a large spotlight pointed up. All the photons from the searchlight are moving upward and you see no light, your eyes are the detectors.

          If another night happens to have a dense fog with your searchlight on your eyes will now be able to detect the light from the searchlight as some of it returns to your detectors (eyes). If you are in the middle of the fog you can’t determine the direction of the light, it comes from all places and your detectors will see a “photon gas”.

          The only light of interest is what hits your eyes while you lie on the ground. This is the energy that is returning to the surface from the searchlight.

          Does this make sense to you on what the detectors are doing and why a bidirectional flow is all that really matters for an energy balance since the sideways energy flows do not change anything?

          • Norman says:

            Kristian

            One of your final points: “Finally, do you think theres a perfect vacuum between the surface and your downward-looking instrument sensor? Or that the intervening air is completely non-participating?”

            I do not think this at all but in science you have significant values and the amount of energy from the small gap of participating gases would not be anything in comparison to the total upward flux.

            Look at this link for reference. Path length makes a huge difference and a few inches of air will not produce much IR.

            http://fchart.com/ees/gas%20emittance.pdf

        • David Appell says:

          Norman wrote:
          “Granted your point, the photons that are not moving up or down are not relevant to surface energy budget.”

          That’s wrong.

          A photon emitted at a suitable at an angle of 1 degree off the vertical will still strike the ground somewhere.

          That angle is a function of height. But some photons not emitted directly downward will certainly strike the surface.

          • Norman says:

            David Appell

            By Definition the photon is still moving up or down. I did not make the claim of directly up or down just in that general direction. Thanks for the thought though. Maybe I was not real clear in my presentation to Kristian.

          • David Appell says:

            Norman says:
            “By Definition the photon is still moving up or down.”

            No it isn’t. An atmospheric CO2 molecule is at a random orientation, so its emitted photon is at a random angle and hence in a random direction.

          • Norman says:

            David Appell

            I am not exactly sure of what claim you are attempting to make here.

            If an emitted photon has a component in its direction other that perfect horizontal (and with a large group of Carbon Dioxide molecules you will have photons going in every possible direction) it will be moving up or down.

            It is no different than a car on a road. If it is veering slightly to the left or right it is still moving right or left, the only variation you bring up is the amount of “up” or “down” not the general concept of up and down.

          • Gordon Robertson says:

            David Appell…”No it isnt. An atmospheric CO2 molecule is at a random orientation, so its emitted photon is at a random angle and hence in a random direction”.

            This is an example of the scientific nonsense with which your head is filled.

            A photon is a concept…a definition. It is defined as a particle of EM with momentum and no mass. That’s pretty rich considering mass is an integral part of momentum based on definition.

            You have no idea whatsoever how a CO2 molecule is oriented. No one has ever seen one. The only way you can speak of CO2 molecules is by averaging bazillions of them.

            Besides all that, the problem with CO2 molecules in the atmosphere is many faceted and extremely complex. Claiming that a photon interacts with a CO2 molecule in such and such a manner is sheer nonsense.

        • Kristian says:

          Norman,

          I don’t think there’s much more I can say about this matter for you to understand. Your mental block is seemingly complete and impossible to break through.

          It is all so elementary. I showed you this simple figure: https://okulaer.files.wordpress.com/2016/11/radiation-sfc-atm.png

          It’s in 2D. Imagine it’s really in 3D. A cryogenically cooled radiometric detector. Hovering somewhere in our radiatively active atmosphere, let’s say about 2m above the surface. Down below somewhere is the solid ground, plus 2m of relatively warm air, above is the progressively cooler layers of air towards the tropopause.

          Since the detector is so extremely cold, its surroundings will always be much, much warmer than it in ALL possible directions, no matter where you look. So much warmer in fact, that its surroundings in every single direction can easily be considered a “pure radiator” into the detector. This is how the hyperphysics website decribes such a situation, only the other way around:
          http://hyperphysics.phy-astr.gsu.edu/hbase/thermo/cootime.html

          For very hot objects, the role of the ambient temperature can be neglected. If the hot temperature is more than 3.16 times the ambient, then the contribution of ambient terms is less than 1%. For example, for 300K ambient on the earth, an object of temperature higher than 1000K can be treated like a pure radiator into space.

          (My emphasis.)

          What does this mean?

          It means, the greater the temperature difference between the two objects in a radiative heat transfer, the closer the “net LW”, the radiant heat flux from the warmer to the cooler object will be to the pure, hypothetical blackbody emission flux from the warmer object if it were to radiate directly into space (at ~ absolute zero).

          Regarding our particular situation, the colder the detector (or the hotter the surroundings, or a target somewhere in those surroundings), the closer the actual flux (radiative transfer) detected by the detector (the “net LW”, the radiant heat flux, on the lefthand side) in (1) below would be to the pure power flux emitted by the surroundings/target to absolute zero in (2), meaning, as if the detector weren’t even there:

          P/A, net LW = σ(T_target^4 – T_detector^4) (1)

          P/A, net LW = σT_target^4 (2)

          What, then, does this simple circumstance entail, Norman?

          In whatever direction you choose to make the detector “see”, it will detect an incoming radiant flux. A near-perfect radiant HEAT flux. Simply because it’s so bloody cold! ALL regions will heat it.

          If you choose for it to “see” in the directions of UP and DOWN only, well, then you will naturally have “discovered” a BIdirectional transfer.

          But, Norman, as you should well realise from the above, this is nothing but a chimaera. A mental contruct, an arbitrarily geometrically constrained definition of the radiation field. You’re fooling yourself. As I already told you, and I want you to really think this through:

          You would only find what appears to be a “bidirectional transfer” across an imaginary (temperatureless), twodimensional plane dividing the radiation field between two warm objects or regions. Simply because that plane has two sides. IOW, it is purely an artefact of the geometric constraints that YOU have decided to impose on the system. If you placed an imaginary (temperatureless) CUBE inside the radiation field instead, that cube would tell you that there is in fact a HEXAdirectional transfer of energy going on. And so on, and so forth …

          This is the entire reasoning behind the idea of a “bidirectional transfer”. The hypothetical, twodimensional (temperatureless) plane dividing the threedimensional radiation field in two. Thing is, you could tilt this imaginary plane in any direction and at any angle and you would still get what seems to be a bidirectional transfer, because there are photons flying about in ALL directions, not just the two. And so in order to get the ACTUAL average of all these directions (and intensities), you would have to include ALL those potential planes, at ALL angles, giving a UNIdirectional net movement of energy as a result (once again, refer to the figure above).

          In reality, nothing here is BIdirectional. Either the transfer of radiative energy is SUPER-MULTIdirectional, meaning every photon has its own direction (and frequency/energy level) (MICRO level), or it’s UNIdirectional, all individual photon movements averaged into ONE net movement (MACRO level).

          There is nothing in between. Only in your head. YOU invent in your head the bidirectional transfer, Norman. Because YOU CHOOSE to focus on those two particular directions, thereby mentally projecting upon the seething photon cloud one single (ironically, averaged) arrow from the first object to the second, and likewise one single opposing arrow (equally averaged) from the second to the first. Or rather, this is how the simple mathematical model of radiation portrays it.

          Which is fine. As a simplified mathematical model of reality. But it’s NOT macroscopic REALITY. (Nor is it MICROscopic reality.) The warmer object will never distinctly experience a positive energy transfer from the cooler one, just like the cooler object will never distinctly experience a negative energy transfer to the warmer. The warmer cools and the cooler warms. Period. There’s not a little bit of both. And so there is only one actual macroscopic energy transfer through the radiation field between the two, one real net movement (expressed as a power density flux, W/m^2) of radiant energy – the HEAT passing from warmer to cooler.

          On a MICROscopic level, of course there are photons flying everywhere. If you plunged into the photon cloud to try and see the transfer on a quantum level, you couldn’t. You would discern no consistent directional pattern of movement whatsoever, only random chaos. However, as you zoom out from this and finally cross the thermodynamic limit, into the macroscopic realm, such a pattern will eventually emerge. You no longer see any individual photons. Only a net movement. A probabilistic average of ALL the individual, random quantum movements. Do you think what you would see at this point is a BIdirectional flow, Norman? TWO opposing motional patterns inside the ONE photon cloud? Of course not. Such a notion is just as fundamentally silly as the notion that two opposing winds make up one “net wind” between them, or that two opposing electric currents makes one “net current”.

          From one of the links I already gave you:
          https://www.science.mcmaster.ca/medphys/images/files/courses/775/ch3.pdf

          The radiation field consists of a large number of particles or quanta distributed in space and time moving in various directions with differing energies. A description of such a system is necessarily statistical in nature and rests on the introduction of a six-dimensional phase space, the direct product of configuration space and momentum space constructed from the position and momentum co-ordinates

          (My emphasis.)

          Planck:

          (…) in order to specify completely the state of the radiation the intensity of radiation must be known in all the directions, infinite in number, which pass through the point in question (…)

          http://www.gutenberg.org/files/40030/40030-pdf.pdf?session_id=e3d0a269335695eff7149c13b1683f3f3ad6b4df (p.2-3)

          Imagine performing this operation for each and every single point of the threedimensional radiation field. Integrating your radiative parameter of choice over all angles. That’s when you get the actual radiative transfer of energy through the field.

          Like I said, I don’t know what more I can tell you …

          • Kristian says:

            Sorry, I botched it up. Here’s one more try:

            – – –

            Norman,

            I don’t think there’s much more I can say about this matter for you to understand. Your mental block is seemingly complete and impossible to break through.

            It is all so elementary. I showed you this simple figure: https://okulaer.files.wordpress.com/2016/11/radiation-sfc-atm.png

            It’s in 2D. Imagine it’s really in 3D. A cryogenically cooled radiometric detector. Hovering somewhere in our radiatively active atmosphere, let’s say about 2m above the surface. Down below somewhere is the solid ground, plus 2m of relatively warm air, above are the progressively cooler layers of air towards the tropopause.

            Since the detector is so extremely cold, its surroundings will always be much, much warmer than it in ALL possible directions, no matter where you look. So much warmer in fact, that its surroundings in every single direction can easily be considered a “pure radiator” into the detector. This is how the hyperphysics website decribes such a situation, only the other way around:
            http://hyperphysics.phy-astr.gsu.edu/hbase/thermo/cootime.html

            For very hot objects, the role of the ambient temperature can be neglected. If the hot temperature is more than 3.16 times the ambient, then the contribution of ambient terms is less than 1%. For example, for 300K ambient on the earth, an object of temperature higher than 1000K can be treated like a pure radiator into space.

            (My emphasis.)

            What does this mean?

            It means, the greater the temperature difference between the two objects in a radiative heat transfer, the closer the “net LW”, the radiant heat flux from the warmer to the cooler object, will be to the pure, hypothetical blackbody emission flux from the warmer object if it were to radiate directly into space (at ~ absolute zero).

            Regarding our particular situation, the colder the detector (or the hotter the surroundings, or a target somewhere in those surroundings), the closer the actual flux (radiative transfer) detected by the detector (the “net LW”, the radiant heat flux, on the lefthand side) in (1) below would be to the pure power flux emitted by the surroundings/target to absolute zero in (2), meaning, as if the detector weren’t even there:

            P/A, net LW = σ(T_target^4 – T_detector^4) (1)

            P/A, net LW = σT_target^4 (2)

            What, then, does this simple circumstance entail, Norman?

            In whatever direction you choose to make the detector “see”, it will detect an incoming radiant flux. A near-perfect radiant HEAT flux. Simply because it’s so bloody cold! ALL regions will heat it.

            If you choose for it to “see” in the directions of UP and DOWN only, well, then you will naturally have “discovered” a BIdirectional transfer.

            But, Norman, as you should well realise from the above, this is nothing but a chimaera. A mental contruct, an arbitrarily geometrically constrained definition of the radiation field. You’re fooling yourself. As I already told you, and I want you to really think this through:

            You would only find what appears to be a “bidirectional transfer” across an imaginary (temperatureless), twodimensional plane dividing the radiation field between two warm objects or regions. Simply because that plane has two sides. IOW, it is purely an artefact of the geometric constraints that YOU have decided to impose on the system. If you placed an imaginary (temperatureless) CUBE inside the radiation field instead, that cube would tell you that there is in fact a HEXAdirectional transfer of energy going on. And so on, and so forth …

            This is the entire reasoning behind the idea of a “bidirectional transfer”. The hypothetical, twodimensional (temperatureless) plane dividing the threedimensional radiation field in two. Thing is, you could tilt this imaginary plane in any direction and at any angle and you would still get what seems to be a bidirectional transfer, because there are photons flying about in ALL directions, not just the two. And so in order to get the ACTUAL average of all these directions (and intensities), you would have to include ALL those potential planes, at ALL angles, giving a UNIdirectional net movement of energy as a result (once again, refer to the figure above).

            In reality, nothing here is BIdirectional. Either the transfer of radiative energy is SUPER-MULTIdirectional, meaning every photon has its own direction (and frequency/energy level) (MICRO level), or it’s UNIdirectional, all individual photon movements averaged into ONE net movement (MACRO level).

            There is nothing in between. Only in your head. YOU invent in your head the bidirectional transfer, Norman. Because YOU CHOOSE to focus on those two particular directions, thereby mentally projecting upon the seething photon cloud one single (ironically, averaged) arrow from the first object to the second, and likewise one single opposing arrow (equally averaged) from the second to the first. Or rather, this is how the simple mathematical model of radiation portrays it.

            Which is fine. As a simplified mathematical model of reality. But it’s NOT macroscopic REALITY. (Nor is it MICROscopic reality.) The warmer object will never distinctly experience a positive energy transfer from the cooler one, just like the cooler object will never distinctly experience a negative energy transfer to the warmer. The warmer cools and the cooler warms. Period. There’s not a little bit of both. And so there is only one actual macroscopic energy transfer through the radiation field between the two, one real net movement (expressed as a power density flux, W/m^2) of radiant energy – the HEAT passing from warmer to cooler.

            On a MICROscopic level, of course there are photons flying everywhere. If you plunged into the photon cloud to try and see the transfer on a quantum level, you couldn’t. You would discern no consistent directional pattern of movement whatsoever, only random chaos. However, as you zoom out from this and finally cross the thermodynamic limit, into the macroscopic realm, such a pattern will eventually emerge. You no longer see any individual photons. Only a net movement. A probabilistic average of ALL the individual, random quantum movements. Do you think what you would see at this point is a BIdirectional flow, Norman? TWO opposing motional patterns inside the ONE photon cloud? Of course not. Such a notion is just as fundamentally silly as the notion that two opposing winds make up one “net wind” between them, or that two opposing electric currents makes one “net current”.

            From one of the links I already gave you:
            https://www.science.mcmaster.ca/medphys/images/files/courses/775/ch3.pdf

            The radiation field consists of a large number of particles or quanta distributed in space and time moving in various directions with differing energies. A description of such a system is necessarily statistical in nature and rests on the introduction of a six-dimensional phase space, the direct product of configuration space and momentum space constructed from the position and momentum co-ordinates

            (My emphasis.)

            Planck:

            (…) in order to specify completely the state of the radiation the intensity of radiation must be known in all the directions, infinite in number, which pass through the point in question (…)

            http://www.gutenberg.org/files/40030/40030-pdf.pdf?session_id=e3d0a269335695eff7149c13b1683f3f3ad6b4df (p.2-3)

            Imagine performing this operation for each and every single point of the threedimensional radiation field. Integrating your radiative parameter of choice over all angles. That’s when you get the actual radiative transfer of energy through the field.

            Like I said, I don’t know what more I can tell you …

      • Ed Bo says:

        Good grief, Kristian!

        Your own references say that it is perfectly correct to talk about EMR in ways you have been righteously claiming for years here are wrong and the people who have been using those ways are idiots!

        Do you even really understand what is going on at all at the most basic level?

  61. Bindidon says:

    Ken Gregory on November 10 2016 at 7:25 PM

    Does anyone know why there was the LARGE revision?

    Are you serious? What a strange attitude! Did you even have a look on the scale in the graph produced by these nice ‘friends’ of science?

    I have all that data on disk and can tell you that the largest difference between the two revisions is located on september 2015, and is 0.038 C high, i.e. giant four hundreths of a degree.

    Below is a chart with plots of RSS old (blue), RSS new (red), and the difference between the two (yellow), for the 1999-2016 period.

    What about a look, for comparison purposes, of these large RSS modifications with the transition from UAH5.6 to 6.0beta5 in May 2015?

    No, Ken Gregory: you dont need to tell me that Roy Spencer published these minor changes, while Carl Mears spitefully kept silent about these huge modifications applied by the RSS team.

  62. Gordon Robertson says:

    We’ve had unusual November warming over the west coast of Canada. When a government meteorologist was asking if the warming was due to global warming he said it was not. He claimed the jet stream had become stalled allowing warming effects from the west known as the Pineapple Express to take effect.

    I am wondering if a transition from El Nino to La Nina could be in effect as well since the PDO tends to govern both.

  63. angech says:

    Zeke Hausfather, energy systems analyst and environmental economist at Berkeley Earth:
    I certainly expect to be talking a lot more about geoengineering and overshoot scenarios now than I did a few days ago.
    Is an overshoot scenario alternative lingo for “GCM’s are wrong by 10%”?
    Were there any signs in the temperature record of a likely Trump victory?
    Seems climate does not affect humans.

  64. ren says:

    Low, which tomorrow will develop in the central US states will bring to the prairies powerful blizzards which will move to the region of the Great Lakes and northeast.

  65. Dan Pangburn says:

    A travesty of the misguided assault on fossil fuels, with erroneous focus on CO2, is that it diverts attention away from an actual looming catastrophe for humanity. The looming catastrophe is the observed decline of water tables and what this means for pumped irrigation and future food production.

    Thermalization and the complete dominance of water vapor in reverse-thermalization explain why CO2 has no significant effect on climate.

    CO2 is not merely harmless, it is profoundly helpful. It is helpful in that it is plant food and, perhaps more importantly, it reduces plants need for water.

  66. Norman says:

    Kristain

    The thread above is too long to keep responding upon it.

    I linked Mike Flynn to this and will do as well for you. You will see the GHE is less for a Desert but still fairly strong as compared to a wetter area.

    http://www.esrl.noaa.gov/gmd/webdata/tmp/surfrad_5830d50064d07.png

    Wet Area GHE around 400 W/m^2 at night in Mississippi summer

    http://www.esrl.noaa.gov/gmd/webdata/tmp/surfrad_5830d53504995.png

    Dry area GHE around 325 W/m^2 at night in Nevada desert in summer

    That means the desert GHE is still about 80% of the wetter area.

  67. Norman says:

    Kristian

    I am commenting on your point about bi-directional radiant energy.

    I believe you are under the incorrect assumption that I strongly believe EMR only moves in an Up or Down direction when I use the term bidirectional.

    The use of the term direction in connection with EMR is that the energy of the EMR moves away from the source that generated it.

    If you do not accept my word for it here is a link.
    http://physics.bu.edu/~duffy/PY106/EMWaves.html

    From the link: “An electromagnetic wave (such as a radio wave) propagates outwards from the source (an antenna, perhaps) at the speed of light. What this means in practice is that the source has created oscillating electric and magnetic fields, perpendicular to each other, that travel away from the source.”

    This fact creates a direction. It does not have to be straight up, but it is away from the source. It does not go back to the source once emitted unless somehting in its path redirects the motion.

    Light and IR do have wave properties and diffraction but it is samll because of the very small wavelength, hence you will have shadows with these type of EMR.

    By bidirectional it means energy moving away from the source that emitted it (which would be the Earth’s surface in my posts with you on the matter), the other direction is energy moving toward the surface. It does not mean a rigid Up and Down direction. With no GHG present in the atmopshere the surface radiates IR only unidirectional (away from surface) but the radiation will be emitted in all possible directions away from the surface. None will return to the surface. If you have GHG present some of this radiation will be absorbed by these gases. It can be reemitted in any direction (including back to the surface) or go to heat up surrounding nonparticipating gases. As the nonparticipating gases gain energy they will cause the participating gases to warm and radiate more energy and some of this will return to the surface.

    So rather than use terms that confuse you and cause long and many posts from you it would work much better to use the terms Away from Surface and Toward the Surface and they are free to move away in any direction or toward the surface from any direction. Does that clear it up?

    • Kristian says:

      Does that clear it up?

      Norman,

      There’s no need for you to try and make this into ME not understanding YOUR position. You don’t need to “clear up” anything. I understand perfectly well how you want this to work. You simply go by the classic simplified mathematical model of radiative transfer. And that’s exactly WHY I’m trying so hard to set you straight. Because you just seem incapable of distinguishing between your simplified model reality and reality itself when it comes to radiation. You’re trapped inside your bubble.

      When you have two opposing objects at equal temps, then there’s an integrated photon cloud filling the space between them. But there is NO MACROSCOPIC (NET) MOVEMENT OF RADIANT ENERGY in any direction, only energy present. There is no gradient in energy density, only energy density, no gradient in radiative intensity, only radiative intensity, and so no detectable movement. No gain or loss of energy at either end. Because there is no difference in radiative potential to be found. Exactly equivalent to a difference in air pressure producing a wind and a difference in voltage producing an electric current.

      For the nth time: YOU NEED TO SEPARATE BETWEEN THE MICRO AND MACRO REALMS, Norman!

      • Norman says:

        Kristain

        You still do not comprehend. As in this song by Orbital
        https://www.youtube.com/watch?v=Z7y7_xghLWM

        “Try again, try again, try again.”

        Start with your two plates with equal temperature (this is an experiment you could actually perform).

        In-between you have two thermal guns
        Maybe something like these
        http://www.flir.com/instruments/tg130/?pi_ad_id=%7Bcreative%7D&gclid=COiq8p28u9ACFdgSgQodzP8KZw

        One is pointed at one plate and the other is pointed at the other plate.

        The guns would both read the same temperature.

        Here will be the proof that your idea is an incorrect one and in need of update and it can be proven to be an incorrect thought process taking place in your mind and not mine (as you believe it to be).

        Keep one plate the same temperature and alter the temperature of the other one. You will see the no change in the thermal gun pointed at the unchanging plate. But by altering the temperature of the other plate (which you will clearly see on the other thermal gun) it will have no effect on what the first thermal gun is reading. It is only reading what is emitted by the plate it is pointed at and not reading some NET radiant energy between the two plates. The Net radiation between the plates will have clearly changed from the initial condition but the change will have not impact on the reading of the thermal gun. It does not matter if you make the plate hotter or colder (as long as you keep the first plate at a constant temperature) the first plate will emit the same amount of IR as before. I think this experiment will cause you to reject your current view and adopt the more accepted view by most scientists working in the field of thermodynamics. It will prove to you it is not a mathematical construct or “thought bubble” but real world physics.

  68. Mike Roberts says:

    Do you really think the UAH data are not modified from the raw satellite data. Even Roy Spencer would correct you on that. The RSS data series uses the same raw data but is quite different. Carl Mears of RSS also acknowledges that surface data are far more reliable. In any case, we live on the surface. You should be taking far more notice of the surface data sets and, by all means, use the raw data, if you don’t like adjusting then.

  69. Dan Pangburn says:

    CO2 in the atmosphere only matters to plants.

    Thermalization and the complete dominance of water vapor in reverse-thermalization explain why CO2 has no significant effect on climate. Terrestrial EMR absorbed by CO2 is effectively rerouted to space via water vapor.

    CO2 is not merely harmless, it is profoundly helpful. It is helpful in that it is plant food and, perhaps more importantly, it reduces plants need for water.

  70. Scarface says:

    Can’t wait for the november update! My guess would be: +0.21 C

    Faites votre jeux!

Leave a Reply