NASA AIRS: 80% of U.S. Warming has been at Night

April 30th, 2019 by Roy W. Spencer, Ph. D.

I have previously addressed the NASA study that concluded the AIRS satellite temperatures “verified global warming trends“. The AIRS is an infrared temperature sounding instrument on the NASA Aqua satellite, providing data since late 2002 (over 16 years). All results in that study, and presented here, are based upon infrared measurements alone, with no microwave temperature sounder data being used in these products.

That reported study addressed only the surface “skin” temperature measurements, but the AIRS is also used to retrieve temperature profiles throughout the troposphere and stratosphere — that’s 99.9% of the total mass of the atmosphere.

Since AIRS data are also used to retrieve a 2 meter temperature (the traditional surface air temperature measurement height), I was curious why that wasn’t used instead of the surface skin temperature. Also, AIRS allows me to compare to our UAH tropospheric deep-layer temperature products.

So, I downloaded the entire archive of monthly average AIRS temperature retrievals on a 1 deg. lat/lon grid (85 GB of data). I’ve been analyzing those data over various regions (global, tropical, land, ocean). While there are a lot of interesting results I could show, today I’m going to focus just on the United States.

Because the Aqua satellite observes at nominal local times of 1:30 a.m. and 1:30 p.m., this allows separation of data into “day” and “night”. It is well known that recent warming of surface air temperatures (both in the U.S. and globally) has been stronger at night than during the day, but the AIRS data shows just how dramatic the day-night difference is… keeping in mind this is only the most recent 16.6 years (since September 2002):

AIRS temperature trend profiles averaged over the contiguous United States, Sept. 2002 through March 2019. Gray represents an average of day and night. Trends are based upon monthly departures from the average seasonal cycle during 2003-2018. The UAH LT temperature trend (and it’s approximate vertical extent) is in violet, and NOAA surface air temperature trends (Tmax, Tmin, Tavg) are indicated by triangles. The open circles are the T2m retrievals, which appear to be less trustworthy than the Tskin retrievals.

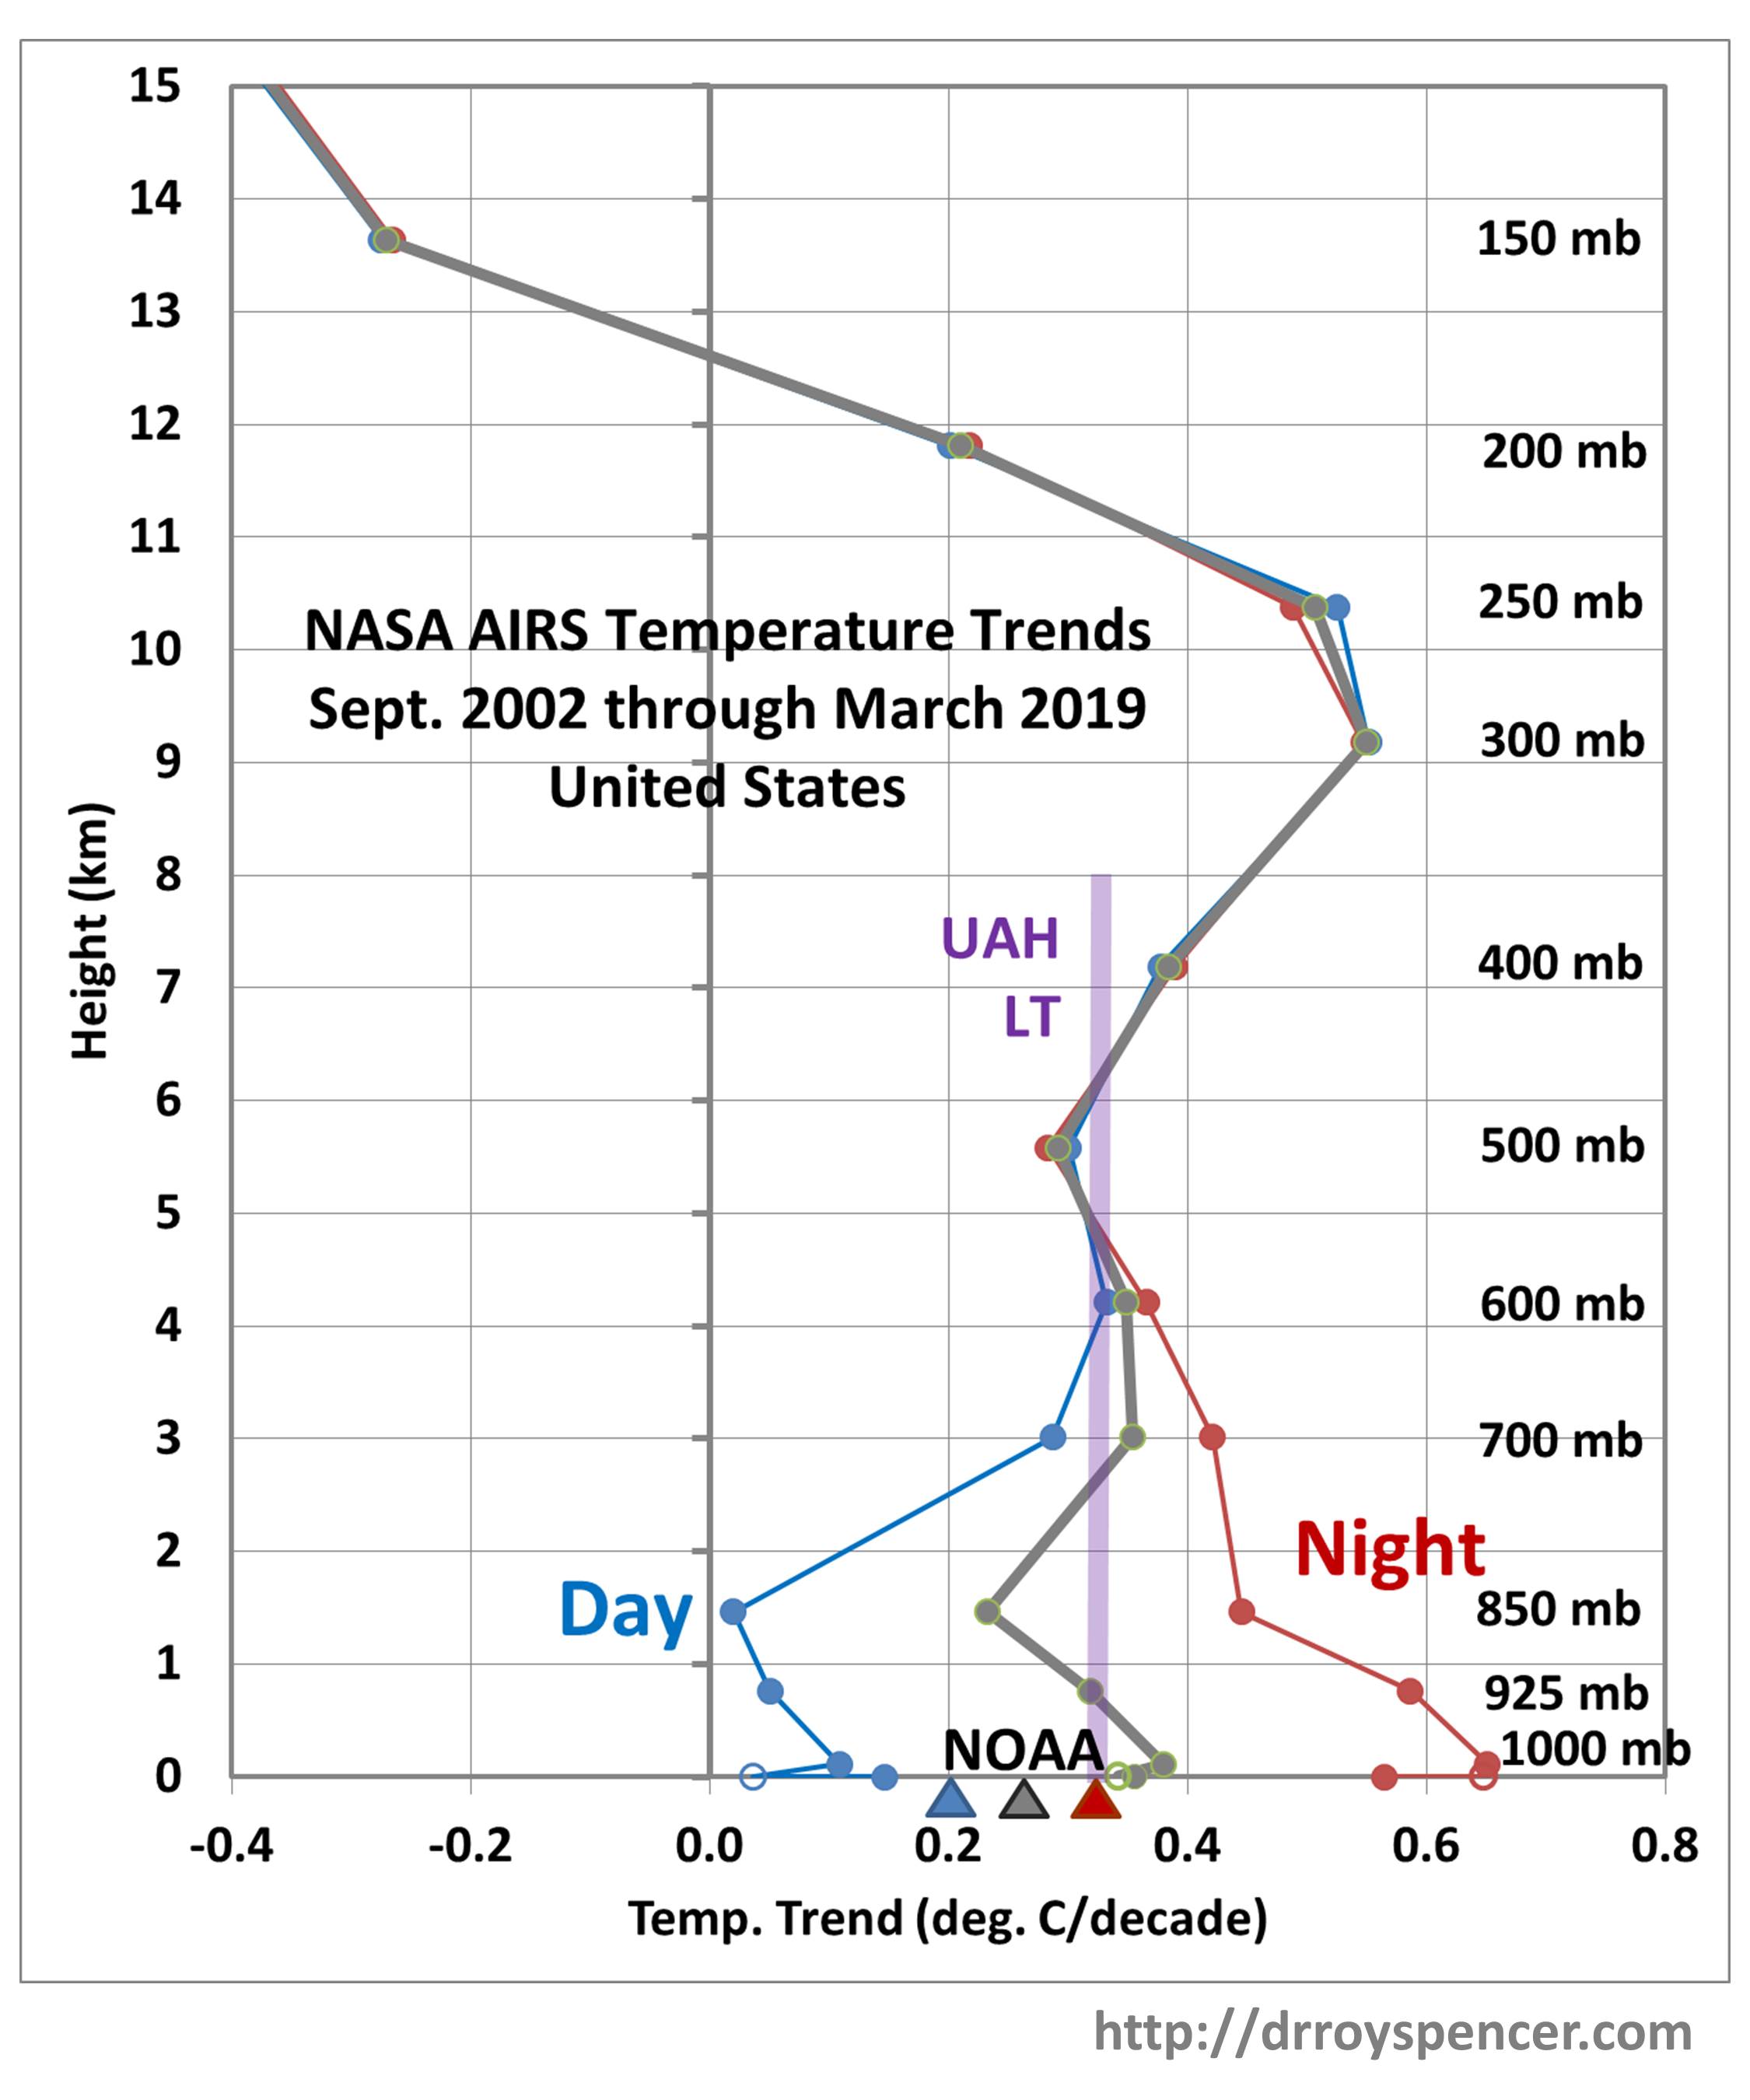
The AIRS surface skin temperature trend at night (1:30 a.m.) is a whopping +0.57 C/decade, while the daytime (1:30 p.m.) trend is only +0.15 C/decade. This is a bigger diurnal difference than indicated by the NOAA Tmax and Tmin trends (triangles in the above plot). Admittedly, 1:30 a.m. and 1:30 pm are not when the lowest and highest temperatures of the day occur, but I wouldn’t expect as large a difference in trends as is seen here, at least at night.

Furthermore, these day-night differences extend up through the lower troposphere, to higher than 850 mb (about 5,000 ft altitude), even showing up at 700 mb (about 12,000 ft. altitude).

This behavior also shows up in globally-averaged land areas, and reverses over the ocean (but with a much weaker day-night difference). I will report on this at some point in the future.

If real, these large day-night differences in temperature trends is fascinating behavior. My first suspicion is that it has something to do with a change in moist convection and cloud activity during warming. For instance more clouds would reduce daytime warming but increase nighttime warming. But I looked at the seasonal variations in these signatures and (unexpectedly) the day-night difference is greatest in winter (DJF) when there is the least convective activity and weakest in summer (JJA) when there is the most convective activity.

One possibility is that there is a problem with the AIRS temperature retrievals (now at Version 6). But it seems unlikely that this problem would extend through such a large depth of the lower troposphere. I can’t think of any reason why there would be such a large bias between day and night retrievals when it can be seen in the above figure that there is essentially no difference from the 500 mb level upward.

It should be kept in mind that the lower tropospheric and surface temperatures can only be measured by AIRS in the absence of clouds (or in between clouds). I have no idea how much of an effect this sampling bias would have on the results.

Finally, note how well the AIRS low- to mid-troposphere temperature trends match the bulk trend in our UAH LT product. I will be examining this further for larger areas as well.


88 Responses to “NASA AIRS: 80% of U.S. Warming has been at Night”

Toggle Trackbacks

  1. MikeR says:

    Roy, you show on the graph that the trend for UAH TLT is about 0.35 C per decade. The figure since 1979 for USA48 is 0.17 C per decade. Has the acceleration in the increase in temperature for the USA48 been that great or is this figure of 0.35 wrong?

  2. Nate says:

    AIRS seems to have a hot spot.

    Wonder if that appears over tropics as well?

  3. Jan Goffa says:

    Nights are warming up, days are cooling down. Diurnal temps are averaging to their statistical medium. Due to CO2 as an insulating cover. The trend of this medium depends exclusively to what happens in the sun and in space (cosmic rays, magnetism, Milankovitch, galactic spiral arms …). “Climate” is exclusively conditionned by outer-earth parameters.

    • ftop_t says:

      “Due to CO2 as an insulating cover”

      That inference is quite a reach. As Roy alludes to in his comments, “This behavior also shows up in globally-averaged land areas, and reverses over the ocean (but with a much weaker day-night difference)”

      More likely, it is the latent heat from H20 that is tightening the diurnal range. CO2 increases have resulted in more plant life in the biosphere that create a more moist landscape. If Roy conducts similar analysis on a desert region, I suspect he will see less of this behavior. Measuring Global Average Temperature without measuring humidity is folly.

      A greening planet with more moderated temperature creates greater sustainability for life. Of course, the “green” movement is too obtuse to recognize this.

      • m d mill says:

        Yes, it seems we are getting the warming at all the times and places it is needed the most…at night (little during the heat of the day), in the winter and at the higher latitudes.
        Hurrah for CO2??

        • Blaz says:

          I love this…we have gone from “move along, nothing is happening here” to ” Not as much happening here as you think” to “Hooray for the warming effects of CO2!!”

          • xenomoly says:

            To be fair – the world was supposed to have been dramatically different by now going on the predicted behavior of the climate in 1988.

  4. pochas94 says:

    At night convection is suppressed (and the Greenhouse Effect appears). In daytime convection is active (and the Greenhouse Effect disappears).

    • Svend Ferdinandsen says:

      Good point, but it could be moderated by haze and clouds during night time.
      Anyway it is quite common i Denmark that the temperature drops 0,5 to 1 Kelvin just around the sun rise. If the wind blows it is less, because we have the sea not far away.
      If it at all gives any meaning to talk about a Global Temperature, then it depends a lot of clouds (and when they appear), the water vapor contend and haze, they all can change temperature much more than CO2.

  5. ftop_t says:

    Had to chuckle at the timing of this post. I have been wondering a lot recently about the validity of an average temperature, let alone a Global Average Temperature.

    Willis Eschenbach had a post awhile back about the “coldness” of the moon.
    https://wattsupwiththat.com/2012/01/08/the-moon-is-a-cold-mistress/

    Yet, the moon is both much hotter and much colder than earth. It is only by deriving a meaningless value (average temperature) that one can declare the moon “colder”. The inference becomes that celestial bodies that develop a narrow diurnal range due to an atmosphere are not warmer, per se,,than adjacent bodies, just more temperate.

    Thus, the alarmism is not about increased temperatures, but temperature moderation. What we are seeing is increased Global Average Temperance.

    Without calculation the % increase or decrease in diurnal range along with the % change in average high and average low, the value of an average temperature is meaningless.

    If the analysis above holds true, one could easily argue that since 1979, the earth has become 0.5% more hospitable for human life.

    It also lays bear how every paper, article and UN IPCC report referencing Global Average Temperature as an isolated metric rather moot…

  6. CO2isLife says:

    This should be a smoking gun that CO2 isn’t the cause. CO2 is 400 ppm at 12:00 A.M and P.M, and its radiative properties are constant. What isn’t constant is the amount of asphalt and concrete near the temperature units/Stevenson Screens. Warming at night relative to day would be evidence of the urban heat island effect as roads hold heat longer than grass.

    How can this hypothesis be tested?

    1) Compare nighttime temperatures in a desert to that of NYC
    2) Compare nighttime temperatures over the ocean to that of NYC
    3) The US is much greener, so compare forest nighttime to the desert nighttime, the increased humidity should cause a change in temperature

    • ftop_t says:

      Agreed. See my comment above…

    • CoRev says:

      I too first thought of UHI. Those tests should clarify.

    • Craig T says:

      Agreed?

      ftop_t:
      “CO2 increases have resulted in more plant life in the biosphere that create a more moist landscape. ”

      CO2isLife:
      “Warming at night relative to day would be evidence of the urban heat island effect as roads hold heat longer than grass.”

  7. pochas94 says:

    Roy, I must add that although you may not agree, your analysis here plus the absence of the “Hot Spot” shows unequivocally that the Greenhouse Effect is totally negated by convection. I congratulate you. It’s dead, Jim.

  8. I was thinking more about this. Pielke Sr. says moist enthalpy is a driver, and irrigation is the initiator. Christy found significant issues with irrigation and warming in CA.

    Much larger areas of the Earth are irrigated than urbanized, so with such poor 1 deg. resolution, maybe look for broad areas that are not agricultural and urbanized, mask them against urban/ag and see what the signal is there?

    • CO2isLife says:

      “I was thinking more about this. Pielke Sr. says moist enthalpy is a driver, and irrigation is the initiator.”

      That is only 100% common sense that seems to evade 100% of the consensus climate scientists. H2O is by far the most important and potent GHG. If you add more H2O to the air you get warming. Duh!!! Why can’t the people that call themselves climate “scientists” figure that one out?

      • Craig T says:

        “Why cant the people that call themselves climate ‘scientists’ figure that one out?”

        The climate scientists are fully aware of water vapor as a greenhouse gas. The question is how much warming will happen as CO2 adds to the total greenhouse effect. Water vapor increases as temperature goes up, so increased water vapor is a feedback of increased CO2.

        Measuring the effect CO2 has on downward longwave radiation is complicated by water vapor increasing as CO2 increases. Berkeley Lab’s 2015 paper measuring CO2’s impact on IR had to measure atmospheric H2O and subtract out IR from that source.

        “The result is two time-series from two very different locations. Each series spans from 2000 to the end of 2010, and includes 3300 measurements from Alaska and 8300 measurements from Oklahoma obtained on a near-daily basis.

        Both series showed the same trend: atmospheric CO2 emitted an increasing amount of infrared energy, to the tune of 0.2 Watts per square meter per decade. This increase is about ten percent of the trend from all sources of infrared energy such as clouds and water vapor.”
        https://newscenter.lbl.gov/2015/02/25/co2-greenhouse-effect-increase/

    • Irrigation, land use changes, the urban heat island effect, far too much “infilling”, far too many “adjustments” that (just happen to) cause more warming (out of thin air), far too many “re-adjustments”, and “re-re-adjustments”, instrument changes, weather station location changes, huge reductions in the number of land weather stations, hardly any Souther Hemisphere measurements before 1900, and too few between 1900 and 1940 … and all of this is led by government bureaucrat so called “scientists”, whose hacked eMails show a greater interest in presenting a strong pro-warming narrative, rather than honest, unbiased science … and that adds up to a HUGE number of reasons to NEVER TRUST surface temperature data, when the alternative of UAH satellite data are available, from people whose integrity remains strong, and they are interested in accuracy, not a climate narrative !

      Only a fool would trust surface temperature compilations, and the bureaucrats who compile them !

  9. steve case says:

    80% of U.S. Warming has been at Night

    And probably in the winter. There hadn’t been a cold snap* like the one this past January since 1996. Prior to that they’d been more common.

    * Minus -20F or below

    • steve case
      I think you’ll find the warming after 1975 was mainly in the northern half of the Northern Hemisphere, mainly during the six coldest months of the year, and mainly at night.

      If that adds up to warmer, winter nights in Alaska, do you think many people in Alaska would consider that to be bad news “global warming” ?

      I think if you look at the NAAO rural thermometer network, the USCRN network, which avoids the potential temperature effects of economic growth and land use changes, you won’t see any US warming in the past 10 years.

      • steve case says:

        Richard Greene at 11:58
        Thanks for the reply.
        Or as the IPCC tells us that the warming will be and night, in winter and in the higher latitudes. Daytime, summertime and in the tropics not so much. And you know what? That seems to be so. But that isn’t what we are led to believe by our friends in the so-called news media. Dry cracked river bottoms and cattle skulls is the common image.

  10. I suggest looking for correlation with land use changes that change the heat conductivity and heat capacity of the top few cm or half a meter or so of the surface, and of objects on the surface.

    Another thing I suggest is looking for trends in daytime and nighttime 2m dewpoints, and seeing if they correlate with trends in land use change and trends in day/night lower tropospheric AIRS temperatures.

  11. CO2isLife says:

    Dr Spencer, your site is blocking everything but the shortest of my posts. I just got this message:

    unused
    The server encountered an internal error or misconfiguration and was unable to complete your request.

    Please contact the server administrator, [email protected] and inform them of the time the error occurred, and anything you might have done that may have caused the error.

    More information about this error may be available in the server error log.

  12. Brent Auvermann says:

    Fascinating. I’m wondering how much of this diel variation is attributable to the increasing influence of the urban heat-island effect…during the day, there is a limit to how hot the earth’s surface can get because it radiates more as it warms, which means there is likely at least a seasonal limit to the stored enthalpy (not using the term excruciatingly precisely) in the earth’s surface. But with no incoming solar radiation at night, there is no obvious limit to the earth’s surface’s ability to radiate extra stored enthalpy. Thus, as we develop more urban areas, the earth’s surface’s heat capacity increases, increasing the stored enthalpy (all of which increment ends up being re-radiated at night) over the long term. Might this have anything to do with it? Thanks for all you do. Brent

    • Brent Auvermann says:

      Yikes, in my comment above I said “…seasonal limit to the stored enthalpy” where I should have said “…seasonal limit to the surface temperature.” I hope the argument seems at least modestly coherent, but feel free to slap me down.

  13. m d mill says:

    Does this make sense?
    At night “visible” clouds add only as a little additional water vapor green house warming, but only during the day visible clouds reflect large amounts of solar forcing. If cloud coverage generally INCREASES with temperature or is neutral (which is the OPPOSITE result of all IPCC Models) then we would see a much reduced warming trend during the day,n’est-ce pas?

  14. With nighttime temperatures increasing more than daytime temperatures on/over land, I expect that “root mean 4th temperature” (4th root of mean T^4) on/over land. Root-mean-4th temperature and not average temperature determines radiation outgo (assuming constant emissivity). Can root-mean-4th temperature be extrapolated, using typical curves of temperature variation throughout a day? I expect that would shed some interesting light on how the radiation budget has changed.

    Another item in the change of the radiation budget: How much of that is from increased energy consumption? I expect a change from increased energy consumption would show up mostly when convection is absent or confined to close to the surface, show up more at times of the year when more energy is consumed and in regions of the US where more energy is consumed. I would also expect this to cause measurable warming mostly in the lowest few hundred meters, when convection past that altitude is not dispersing heat from energy consumption into a larger volume of the atmosphere and resulting in a smaller, probably negligible temperature increase. The fact that the 925 mb level has had almost as much excessive nighttime warming and the 850 millibar level has had a majority as much excessive nighttime warming as the surface has indicates that warming from heat resulting from increased energy consumption is not significant, at least nationwide on a year-round average.

    Then again, how similar are 925 mb trends to surface trends where the surface is close to the 925 mb level, and how similar are they where the surface is more than a few hundred meters below the 925 mb level? Similarly with the 850 mb level – doesn’t the US have a significant amount of surface close to the 850 mb level?

  15. I’m beginning to suspect this day-night difference over land is a problem with AIRS retrievals. Seems really large. But who knows?

    • Craig T says:

      So does it hold true for all land data?

    • Another Joe says:

      Dr. Roy Spencer.

      You might not know it, but what you are saying is that the measurements do not follow your understanding, so the measurements must be wrong!

      It is always good to know what has been measured to make sure that the conclusions drawn from the data are correct. The only way to know for sure is to understand the method of measurement and its error modes.

      As an engineer working with temperature measurements this proves important knowledge, if you have not set up the experiment of installed the sensor yourself.

      Be vary, but never let a theory guide your understanding of the measurements. The measurements are there to prove or disprove your theory.

  16. DHR says:

    And how does the AIRS info compare with USCRN? Isn’t USCRN supposed to be the truth, the whole truth and nothing but the truth for CONUS 2 meter temperature?

  17. Craig T says:

    The paper is behind a paywall, but someone reported the opposite trend:

    “The diurnal cycle (day‐night difference) of the Earth surface temperature is investigated using the daily range of the satellite skin temperature data (DTR) provided by measurements of Atmospheric Infrared Sounder (AIRS) instrument in 2002–2015. … It is found that the DTR of the surface temperature over the global Earth has a small positive trend in the decade of the AIRS measurements indicating that the day temperatures grew slightly more rapidly than the night temperatures. A possible cause of the observed DTR increase is a decrease of the low cloud fraction at nighttime found for the same time period from the AIRS retrievals.”
    Diurnal Cycle Variability of Surface Temperature Inferred From AIRS Data
    https://agupubs.onlinelibrary.wiley.com/doi/abs/10.1002/2016JD026265

  18. Ftop_t says:

    These are not inconsistent.

    The only place to eliminate land use changes and increased biomass is dry desert environments.

  19. Roy W. Spencer says:

    Interesting… I will look into that tomorrow.

  20. jeff says:

    So the nights have more warming than the days.
    The arctic regions have much more warming than the tropics.
    Plant life is growing faster.
    This is ideal for life on earth really.

    • Gordon Robertson says:

      jeff…”So the nights have more warming than the days”.

      That’s one of those statements you have to mull over for a bit. For one, the alarmist lot is talking about anthropogenic warming for which there is no proof.

      For another, as compared to your statement that the Arctic shows more warming than the Tropics, which is true, it’s somewhat of a misleading statement. It sounds like they are claiming the night temperatures are warmer than the day temperatures which we know is false. So what is the point being made?

  21. Glenn says:

    Roy: we know the GLG effect must cause a greater delta T at altitude than near surface. So incremental night warming must be caused by another effect, not gases. Also daytime warming should be higher than night if just gvg effect. We see the opposite. So whatever is causing this warms the night and cools the day…….. wonder what that could be? Oh! Increase in low cloud cover? Negative feedback during the day. Positive feedback at night. Maybe this is proof Svensmark is a genius.

  22. Glenn says:

    Roy:
    Wrote prior two comments before reading all of you post. Apologies. But isnt your comment regarding less convection in winter missing the point? Cloud cover is higher in winter.

  23. Olof R says:

    Dr Spencer,
    Have you considered the percentage of CONUS land below 850 mbar, 925 mbar,1000 mbar?
    They are certainly not 100 %, which may introduce error if you compare with spatially complete surface skin or 2 m data.
    There must be some coverage apples-to-oranges problem..

    • Roy W. Spencer says:

      yes, this is a potential issue…I used 925 mb screening, too (only areas with elevation below about 2,800 ft) and the results looked about the same. I should try 850 mb screening, too.

  24. Gordon Robertson says:

    From the article at the 2nd link in Roy’s article:

    “Commenting on the study, lead author Dr Joel Susskind, from NASA’s Goddard Space Flight Center, said: “AIRS data complement GISTEMP because they are at a higher spatial resolution than GISTEMP, and have more complete global coverage.

    Both data sets demonstrate the earth’s surface has been warming globally over this period, and that 2016, 2017, and 2015 have been the warmest years in the instrumental record, in that order”.

    ***********

    So let me get this straight, NASA GISS wrote a paper which they compared to their surface station data and found a favourable comparison.

    Duh!!!!

    This is the same GISS who claimed 2014 as the hottest year ever based on a 38% confidence level they were telling the truth. UAH shows it as a distant 4th place also-ran, well behind 1998 and 2016, and behind at least 2010.

    In the 2nd paragraph above, they claim 2015, 2016, and 2017, as the warmest years in the instrumental record.

    I’ll bet everyone involved at NASA GISS have extremely long noses that are getting longer with the lies they tell or infer.

    Early 2016 was a record El Nino year from which the atmosphere has been cooling the past few years. 2015 was the terminal year of an 18 years flat trend, 15 of those years confirmed by the IPCC.

    • Craig T says:

      “UAH shows it as a distant 4th place also-ran, well behind 1998 and 2016, and behind at least 2010.”

      One clear difference between TLT and ground instruments is that a strong El Nino creates a large spike in troposphere temperature. 2014 was not an El Nino year. I think it was the 10th highest yearly anomaly for UAH.

      But arguing about what year was the hottest is besides the point. 1997 to 2015 may have had a flat trend but those were also the hottest years in UAH data. With the exception of 1998 the 10 highest yearly TLT were this century. Six of the ten highest years were this decade.

  25. Rune Valaker says:

    Did the IPCC confirm that?

    “Owing to natural variability, trends based on short records are very sensitive to the beginning and end dates and do not in general reflect long-term climate trends. As one example, the rate of warming over the past 15 years (1998–2012; 0.05 [–0.05 to +0.15] °C per decade), which begins with a strong El Niño, is smaller than the rate calculated since 1951 (1951–2012; 0.12 [0.08 to 0.14] °C per decade)Trends for 15-year periods starting in 1995, 1996, and 1997 are 0.13 [0.02 to 0.24], 0.14 [0.03 to 0.24] and 0.07 [–0.02 to 0.18], respectively” p. 194, AR5.

    So then I guess We can agree that the UAH TLT v6 trend for the last 15 years is 0,212 C/decade.

    http://www.ysbl.york.ac.uk/~cowtan/applets/trend/trend.html

  26. martinitony says:

    Test the hypotheses that it is heat island effect by running same comparisons where heat island effect cannot exist. Perhaps desert and jungle. If the effect is substantially less in these areas, the voila. This would also lead to conclusion that heat island effect has not been properly adjusted out of the numbers.

    • Roy W. Spencer says:

      As I mentioned before, urbanization accounts for only 3% of U.S. land area. That cannot be to blame for this effect.

      • martinitony says:

        Test it anyway. What would you find out if there were significant differences? You probably already have the data.

      • Scott says:

        Roy,

        I don’t think the effect of the heat island is limited to urban areas. Homes are being built everywhere… land that had trees is being cut down. Trees cool. That said, I’ve studied the NOAA data for Michigan, and there is a strong relationship here. Detroit, Grand Rapids, Lansing, all have clear uptrends since 1980. Places like Gaylord, Cheboygan, Kalamazoo you don’t see it. Just choppy sideways data. Assuming my local data holds as proxy data for the planet… the impact could be substantial from heat islands.

        • Mike Flynn says:

          S,

          You might find this interesting as a starter –

          “From urban to national heat island: The effect of anthropogenic heat output on climate change in high population industrial countries”

          It seems to be backed up by other research.

          Cheers.

    • bdgwx says:

      The ocean might be a candidate for this test as well. This could be done with SST and/or OHC.

  27. Scott says:

    Interesting day / night split. I also noticed in the global UAH data that April – AUG peaked during the 1998 El nino while the Sep – Mar data peaked during the most recent strong 2016 El Nino. Of other personal note, Detroit MI near where I live has had the opposite happen. Winters have been getting colder since 2002, while summers have been getting warmer still. Could the changes in the magnetic field be causing the splits / divergences? I personally think El Nino is a sign of cooling, not warming as trade wind speeds INCREASE when the sun is closest to the sun. If the sun calms down, trade wind speed will decrease leading to more El Ninos, which will be a short term gain, and a long term loss as warm water is not buried and has a better opportunity to cool at night… especially the jet streams bringing more cool air south. This warm air at night getting blown around by the jet stream could explain the split we are seeing.

  28. Lawrence Miller says:

    Weather does not affect global temperatures? I have noticed reports of unusually cold April weather in Australia, Tasmania, Russia and the US, yet your temperature anomaly for April is unexpectedly high… I suspect that your satellite is mal-functioning, please double check this.

  29. Duncanbelem says:

    It is irrigation and H20 Vaporization. Burning of ALL fossil fuels to generate power creates way more Water Vapor than CO2. Today thermoelectric power is the #1 use of water in the USA. https://www.usgs.gov/special-topic/water-science-school/science/total-water-use-united-states?qt-science_center_objects=0#qt-science_center_objects
    From Nuclear to some Solar to Coal they all generate water vapor, and LOTS of it. Farming is 40% of all land in the world, and the second use of water in the United States https://news.nationalgeographic.com/news/2005/12/agriculture-food-crops-land/

  30. CoRev says:

    Now NOAA agrees that UHI is a significant impact to night time warming https://journals.ametsoc.org/doi/pdf/10.1175/JAMC-D-19-0002.1

    It also confirms Watts findings on site problems.

  31. Alan F says:

    As others have noted, this effect could well be due to increased humidity near the surface which increases the dewpoint, thus warming nights, and moderating daytime highs.
    The dewpoint could be affected by land uses involving irrigation, increases in vegetation, or even human causes like burning fuels to heat their homes.

  32. Eben says:

    lets hope this keeps going so we will save money for not having to buy warm bed blankets

    • Svante says:

      Heat waves, not abating at night, more humidity, nice.

      Yeah, save up for air conditioning and electricity bills if you want any sleep at all.

  33. Ken Meyercord says:

    This guy, Alan Savory, in addition to offering a new (to me) way to mitigate climate change, points out that heat loss from barren ground at night is greater than from vegetation-covered land: https://youtu.be/vpTHi7O66pI. Could desertification in the US account for the growing disparity between day and night temperatures?

  34. Thanks for posting this awesome article. I’m a
    long time reader but I’ve never been compelled to leave a comment.

    I subscribed to your blog and shared this on my Twitter. Thanks again for
    a great post! https://www.ecoleesthetiquenf.ca/formations/kobido/

  35. Thank you for posting this awesome article. I’m a long time reader but I’ve never been compelled to leave a comment.
    I subscribed to your blog and shared this on my Facebook.
    Thanks again for a great article! https://www.entretienmenager-gtp.com/travaux-de-nettoyage-de-qualite-a-montreal

  36. I am not sure where you?re getting your information,
    but good topic. I needs to spend some time learning more
    or understanding more.
    Thanks for excellent info I was looking for this information for my
    mission. https://lascootershop.ca

  37. Its such as you read my mind!
    You appear to know so much about this, like you wrote the e
    book in it or something. I feel that you just can do with some % to drive
    the message home
    a bit, but instead of that, that is
    magnificent
    blog. A great read.
    I will definitely be back.|
    I visited several sites but the audio feature for audio songs existing at this site is truly fabulous.|
    Hi, i read your blog occasionally and i own a similar one and i was just wondering if you
    get a lot of spam feedback? If so how do you stop it, any plugin or
    anything you can advise? I get so much lately it?s driving
    me crazy so any assistance is
    very much appreciated.|
    Greetings! Very useful advice within this post!
    It is the little changes which will make the greatest changes.
    Thanks a lot for sharing!|
    I really love your website.. Very nice colors & theme. Did you create this web
    site yourself? Please reply back as I?m wanting to create
    my very own site and would like
    to find out where you got this from or what the theme
    is called. Thanks! https://www.entreprisesjosemelo.ca

  38. Chng ti chuyn thi cng mi sn b tng, lo lng t_i _ N_ng, tuy l hi_n nay c
    r_t nhi_u cng ty thi cng mi sn b tng ___c ra __i nh_ng
    chng ti v_n ___c cc khch hng t_i _ N_ng v cc t_nh thnh ln c_n tin t__ng v s_ d_ng lu di
    V_i __i ng_ cng nhn vin _ng __o, lnh ngh_, _ qua tr__ng
    l_p _o t_o chuyn su v s_ h_u nh_ng thi_t b_ tin ti_n b_c
    nh_t th_ gi_i hi_n nay, gip hi_u qu_ cng vi_c cao, gi_m t_i _a chi ph, ch_t l__ng s_n ph_m
    khng h_ thua km
    __ _p l_i nh_ng tin t__ng m khch hng dnh cho cng ty th chng ti
    _ ph_n __u h_t mnh __ mang __n cho qu khch
    nh_ng d_ch v_ t_t v_i m_c bo gi h_p l nh_t

  39. mi sn b tng says:

    Chng ti __n v_ thi cng c uy tn hng __u trong l_nh v_c mi sn b tng, thi cng hng tr_m cng trnh t_i _ N_ng, tuy l hi_n nay c r_t nhi_u __i nhm thi cng _nh bng
    n_n b tng ___c hnh thnh nh_ng chng ti
    v_n ___c cc khch hng t_i _ N_ng v cc
    t_nh thnh ln c_n tin t__ng v s_ d_ng lu di
    V_i __i ng_ cng nhn vin _ng __o, chuyn nghi_p, _ qua tr__ng l_p _o
    t_o nng cao v s_ h_u nh_ng thi_t b_ tin ti_n b_c nh_t th_ gi_i hi_n nay,
    gip hi_u qu_ thi cng v cng cao, ti_t kim chi
    ph, ch_t l__ng s_n ph_m t_t
    __ _p l_i nh_ng tin t__ng m khch hng dnh cho cng ty th chng ti
    _ ph_n __u h_t mnh __ mang __n cho khch hng nh_ng d_ch v_ t_t v_i m_c gi thnh ph h_p nh_t

  40. Chng ti chuyn thi cng mi sn b tng, lo lng t_i _ N_ng, hi_n nay nhu c_u s_ d_ng sn b tng _nh
    bng c_ng nh_ l nhu c_u s_ d_ng d_ch v_ _nh bng _ _ N_ng l r_t l_n do _ m _ c cc doanh nghi_p kinh doanh d_ch v_
    mi sn b tng ___c hnh thnh _ _ N_ng
    V_i __i ng_ cng nhn vin _ng __o, lm vi_c
    khoa h_c , _ qua tr__ng l_p _o t_o nng cao v
    s_ h_u nh_ng thi_t b_ tin ti_n b_c nh_t th_
    gi_i hi_n nay, gip th_i gian thi cng _ng
    h_n, gi_m t_i _a chi ph, ch_t l__ng s_n ph_m t_t
    D_ch v_ _nh bng sn b tng _ t_i _ N_ng c_a chng ti s_ mang l_i nh_ng b_ m_t sn b tng
    ___c hon thi_n nh_t cho cng trnh thi cng

  41. Marko says:

    Bossku Malaysia

    On the off possibility which you experience trouble handling your individual issue or need to demand a preliminary history for club video games, you are able to make
    contact with Bosskuclub now. day in and day trip The most effective assist and staff member in the
    realm of membership programs and betting.

    Our toys and games have their own personal situation documents to indicate 918Kiss
    Now’s capacity to shell out and maintain in the safety of clientele on our website.

    Sign-up with bossku to get the best wagering group stuffed
    toy engagement with Malaysia. Get to us for almost any additional inquiries.
    Our players are our require. Perform now!

  42. Fevbvoith says:

    viagra 100mg tablets wowviaprice.com how safe is viagra

  43. Fnrdvoith says:

    viagra for sale buy viagra online mastercard toronto viagra head office

  44. Traircurl says:

    I read this article fully regarding the resemblance of most recent and previous technologies, it’s amazing article. http://www.webclap.com/php/jump.php?url=https://youtu.be/Lm-GN94SEZY

  45. affefly says:

    Helpful information. Lucky me I discovered your website unintentionally, and I am shocked why this accident didn’t came about in advance! I bookmarked it.
    http://secretcinema.no/skytech/showthread.php?tid=190844

  46. __ says:

    Hello to every body, it’s my first pay a visit of this website; this website includes amazing and really excellent stuff for readers.

  47. mom help son viagra problem jody west free cialis trial samples australia is generic cialis available in australia

  48. 20_ __ ___ says:

    Hmm it seems like your site ate my first comment (it was super long) so I guess I’ll just sum it up what
    I submitted and say, I’m thoroughly enjoying your blog.
    I as well am an aspiring blog writer but I’m still new to everything.
    Do you have any recommendations for inexperienced blog writers?
    I’d genuinely appreciate it.

  49. I had fun reading this article, thanks for sharing this! It is really informative and I gained more knowledge because of this. I will surely re-read this!
    https://cronullaelectrical.net.au/residential-electrician-woolooware/

  50. Удаленный десктоп Chrome дает обеспечение доступ к устройствам, основанный на использовании передовых интернет -технологий. Вы сможете подключиться к рабочему или личному компьютеру даже в дороге, чтоб посмотреть хранящиеся на нем файлы, либо удаленно показать экран приятелям и коллегам. Удаленный доступ к компу позволяет запустить на нем программки или посмотреть файлы в любое время, где бы вы ни находились.
    удалённый рабочий стол аренда

  51. Good post. I learn something new and challenging on sites
    I stumbleupon everyday. It’s always useful to read through articles from other
    authors and use something from other web sites.

  52. It is in reality a great and helpful piece of info.

    I am glad that you simply shared this useful information with us.
    Please keep us up to date like this. Thank you for sharing.

Leave a Reply