UAH, RSS, NOAA, UW: Which Satellite Dataset Should We Believe?

April 23rd, 2019 by Roy W. Spencer, Ph. D.

NOTE: See the update from John Christy below, addressing the use of RATPAC radiosonde data.

This post has two related parts. The first has to do with the recently published study of AIRS satellite-based surface skin temperature trends. The second is our response to a rather nasty Twitter comment maligning our UAH global temperature dataset that was a response to that study.

The AIRS Study

NASA’s Atmospheric InfraRed Sounder (AIRS) has thousands of infrared channels and has provided a large quantity of new remote sensing information since the launch of the Aqua satellite in early 2002. AIRS has even demonstrated how increasing CO2 in the last 15+ years has reduced the infrared cooling to outer space at the wavelengths impacted by CO2 emission and absorption, the first observational evidence I am aware of that increasing CO2 can alter — however minimally — the global energy budget.

The challenge for AIRS as a global warming monitoring instrument is that it is cloud-limited, a problem that worsens as one gets closer to the surface of the Earth. It can only measure surface skin temperatures when there are essentially no clouds present. The skin temperature is still “retrieved” in partly- (and even mostly-) cloudy conditions from other channels higher up in the atmosphere, and with “cloud clearing” algorithms, but these exotic numerical exercises can never get around the fact that the surface skin temperature can only be observed with satellite infrared measurements when no clouds are present.

Then there is the additional problem of comparing surface skin temperatures to traditional 2 meter air temperatures, especially over land. There will be large biases at the 1:30 a.m./p.m. observation times of AIRS. But I would think that climate trends in skin temperature should be reasonably close to trends in air temperature, so this is not a serious concern with me (although Roger Pielke, Sr. disagrees with me on this).

The new paper by Susskind et al. describes a 15-year dataset of global surface skin temperatures from the AIRS instrument on NASA’s Aqua satellite. ScienceDaily proclaimed that the study “verified global warming trends“, even though the period addressed (15 years) is too short to say much of anything much of value about global warming trends, especially since there was a record-setting warm El Nino near the end of that period.

Furthermore, that period (January 2003 through December 2017) shows significant warming even in our UAH lower tropospheric temperature (LT) data, with a trend 0.01 warmer than the “gold standard” HadCRUT4 surface temperature dataset (all deg. C/decade):

AIRS: +0.24
GISTEMP: +0.22
ECMWF: +0.20
Cowtan & Way: +0.19
UAH LT: +0.18
HadCRUT4: +0.17

I’m pretty sure the Susskind et al. paper was meant to prop up Gavin Schmidt’s GISTEMP dataset, which generally shows greater warming trends than the HadCRUT4 dataset that the IPCC tends to favor more. It remains to be seen whether the AIRS skin temperature dataset, with its “clear sky bias”, will be accepted as a way to monitor global temperature trends into the future.

What Satellite Dataset Should We Believe?

Of course, the short period of record of the AIRS dataset means that it really can’t address the pre-2003 adjustments made to the various global temperature datasets which significantly impact temperature trends computed with 40+ years of data.

What I want to specifically address here is a public comment made by Dr. Scott Denning on Twitter, maligning our (UAH) satellite dataset. He was responding to someone who objected to the new study, claiming our UAH satellite data shows minimal warming. While the person posting this objection didn’t have his numbers right (and as seen above, our trend even agrees with HadCRUT4 over the 2003-2017 period), Denning took it upon himself to take a swipe at us (see his large-font response, below):


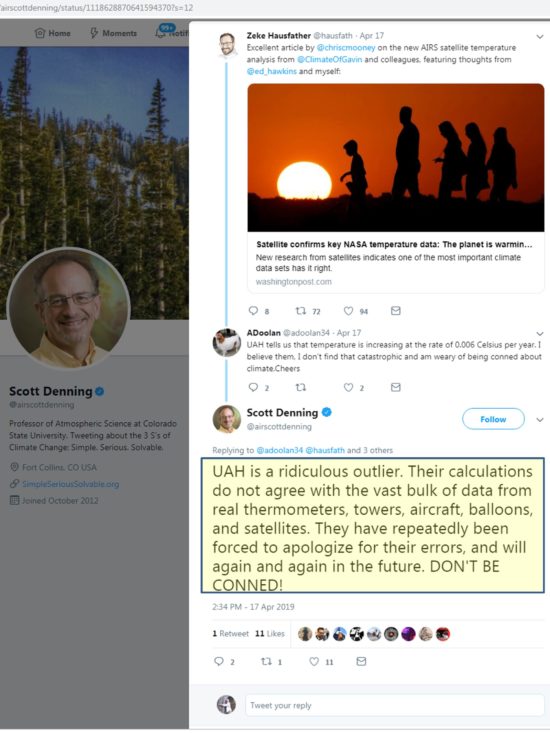
First of all, I have no idea what Scott is talking about when he lists “towers” and “aircraft”…there has been no comprehensive comparisons of such data sources to global satellite data, mainly because there isn’t nearly enough geographic coverage by towers and aircraft.

Secondly, in the 25+ years that John Christy and I have pioneered the methods that others now use, we made only one “error” (found by RSS, and which we promptly fixed, having to do with an early diurnal drift adjustment). The additional finding by RSS of the orbit decay effect was not an “error” on our part any more than our finding of the “instrument body temperature effect” was an error on their part. All satellite datasets now include adjustments for both of these effects.

Nevertheless, as many of you know, our UAH dataset is now considered the “outlier” among the satellite datasets (which also include RSS, NOAA, and U. of Washington), with the least amount of global-average warming since 1979 (although we agree better in the tropics, where little warming has occurred). So let’s address the remaining claim of Scott Denning’s: that we disagree with independent data.

The only direct comparisons to satellite-based deep-layer temperatures are from radiosondes and global reanalysis datasets (which include all meteorological observations in a physically consistent fashion). What we will find is that RSS, NOAA, and UW have remaining errors in their datasets which they refuse to make adjustments for.

From late 1998 through 2004, there were two satellites operating: NOAA-14 with the last of the old MSU series of instruments on it, and NOAA-15 with the first new AMSU instrument on it. In the latter half of this overlap period there was considerable disagreement that developed between the two satellites. Since the older MSU was known to have a substantial measurement dependence on the physical temperature of the instrument (a problem fixed on the AMSU), and the NOAA-14 satellite carrying that MSU had drifted much farther in local observation time than any of the previous satellites, we chose to cut off the NOAA-14 processing when it started disagreeing substantially with AMSU. (Engineer James Shiue at NASA/Goddard once described the new AMSU as the “Cadillac” of well-calibrated microwave temperature sounders).

Despite the most obvious explanation that the NOAA-14 MSU was no longer usable, RSS, NOAA, and UW continue to use all of the NOAA-14 data through its entire lifetime and treat it as just as accurate as NOAA-15 AMSU data. Since NOAA-14 was warming significantly relative to NOAA-15, this puts a stronger warming trend into their satellite datasets, raising the temperature of all subsequent satellites’ measurements after about 2000.

But rather than just asserting the new AMSU should be believed over the old (drifting) MSU, let’s look at some data. Since Scott Denning mentions weather balloon (radiosonde) data, let’s look at our published comparisons between the 4 satellite datasets and radiosondes (as well as global reanalysis datasets) and see who agrees with independent data the best:

Trend differences 1979-2005 between 4 satellite datasets and either radiosondes (blue) or reanalyses (red) for the MSU2/AMSU5 tropospheric channel in the tropics. The balloon trends are calculated from the subset of gripoints where the radiosonde stations are located, whereas the reanalyses contain complete coverage of the tropics. For direct comparisons of full versus station-only grids see the paper.

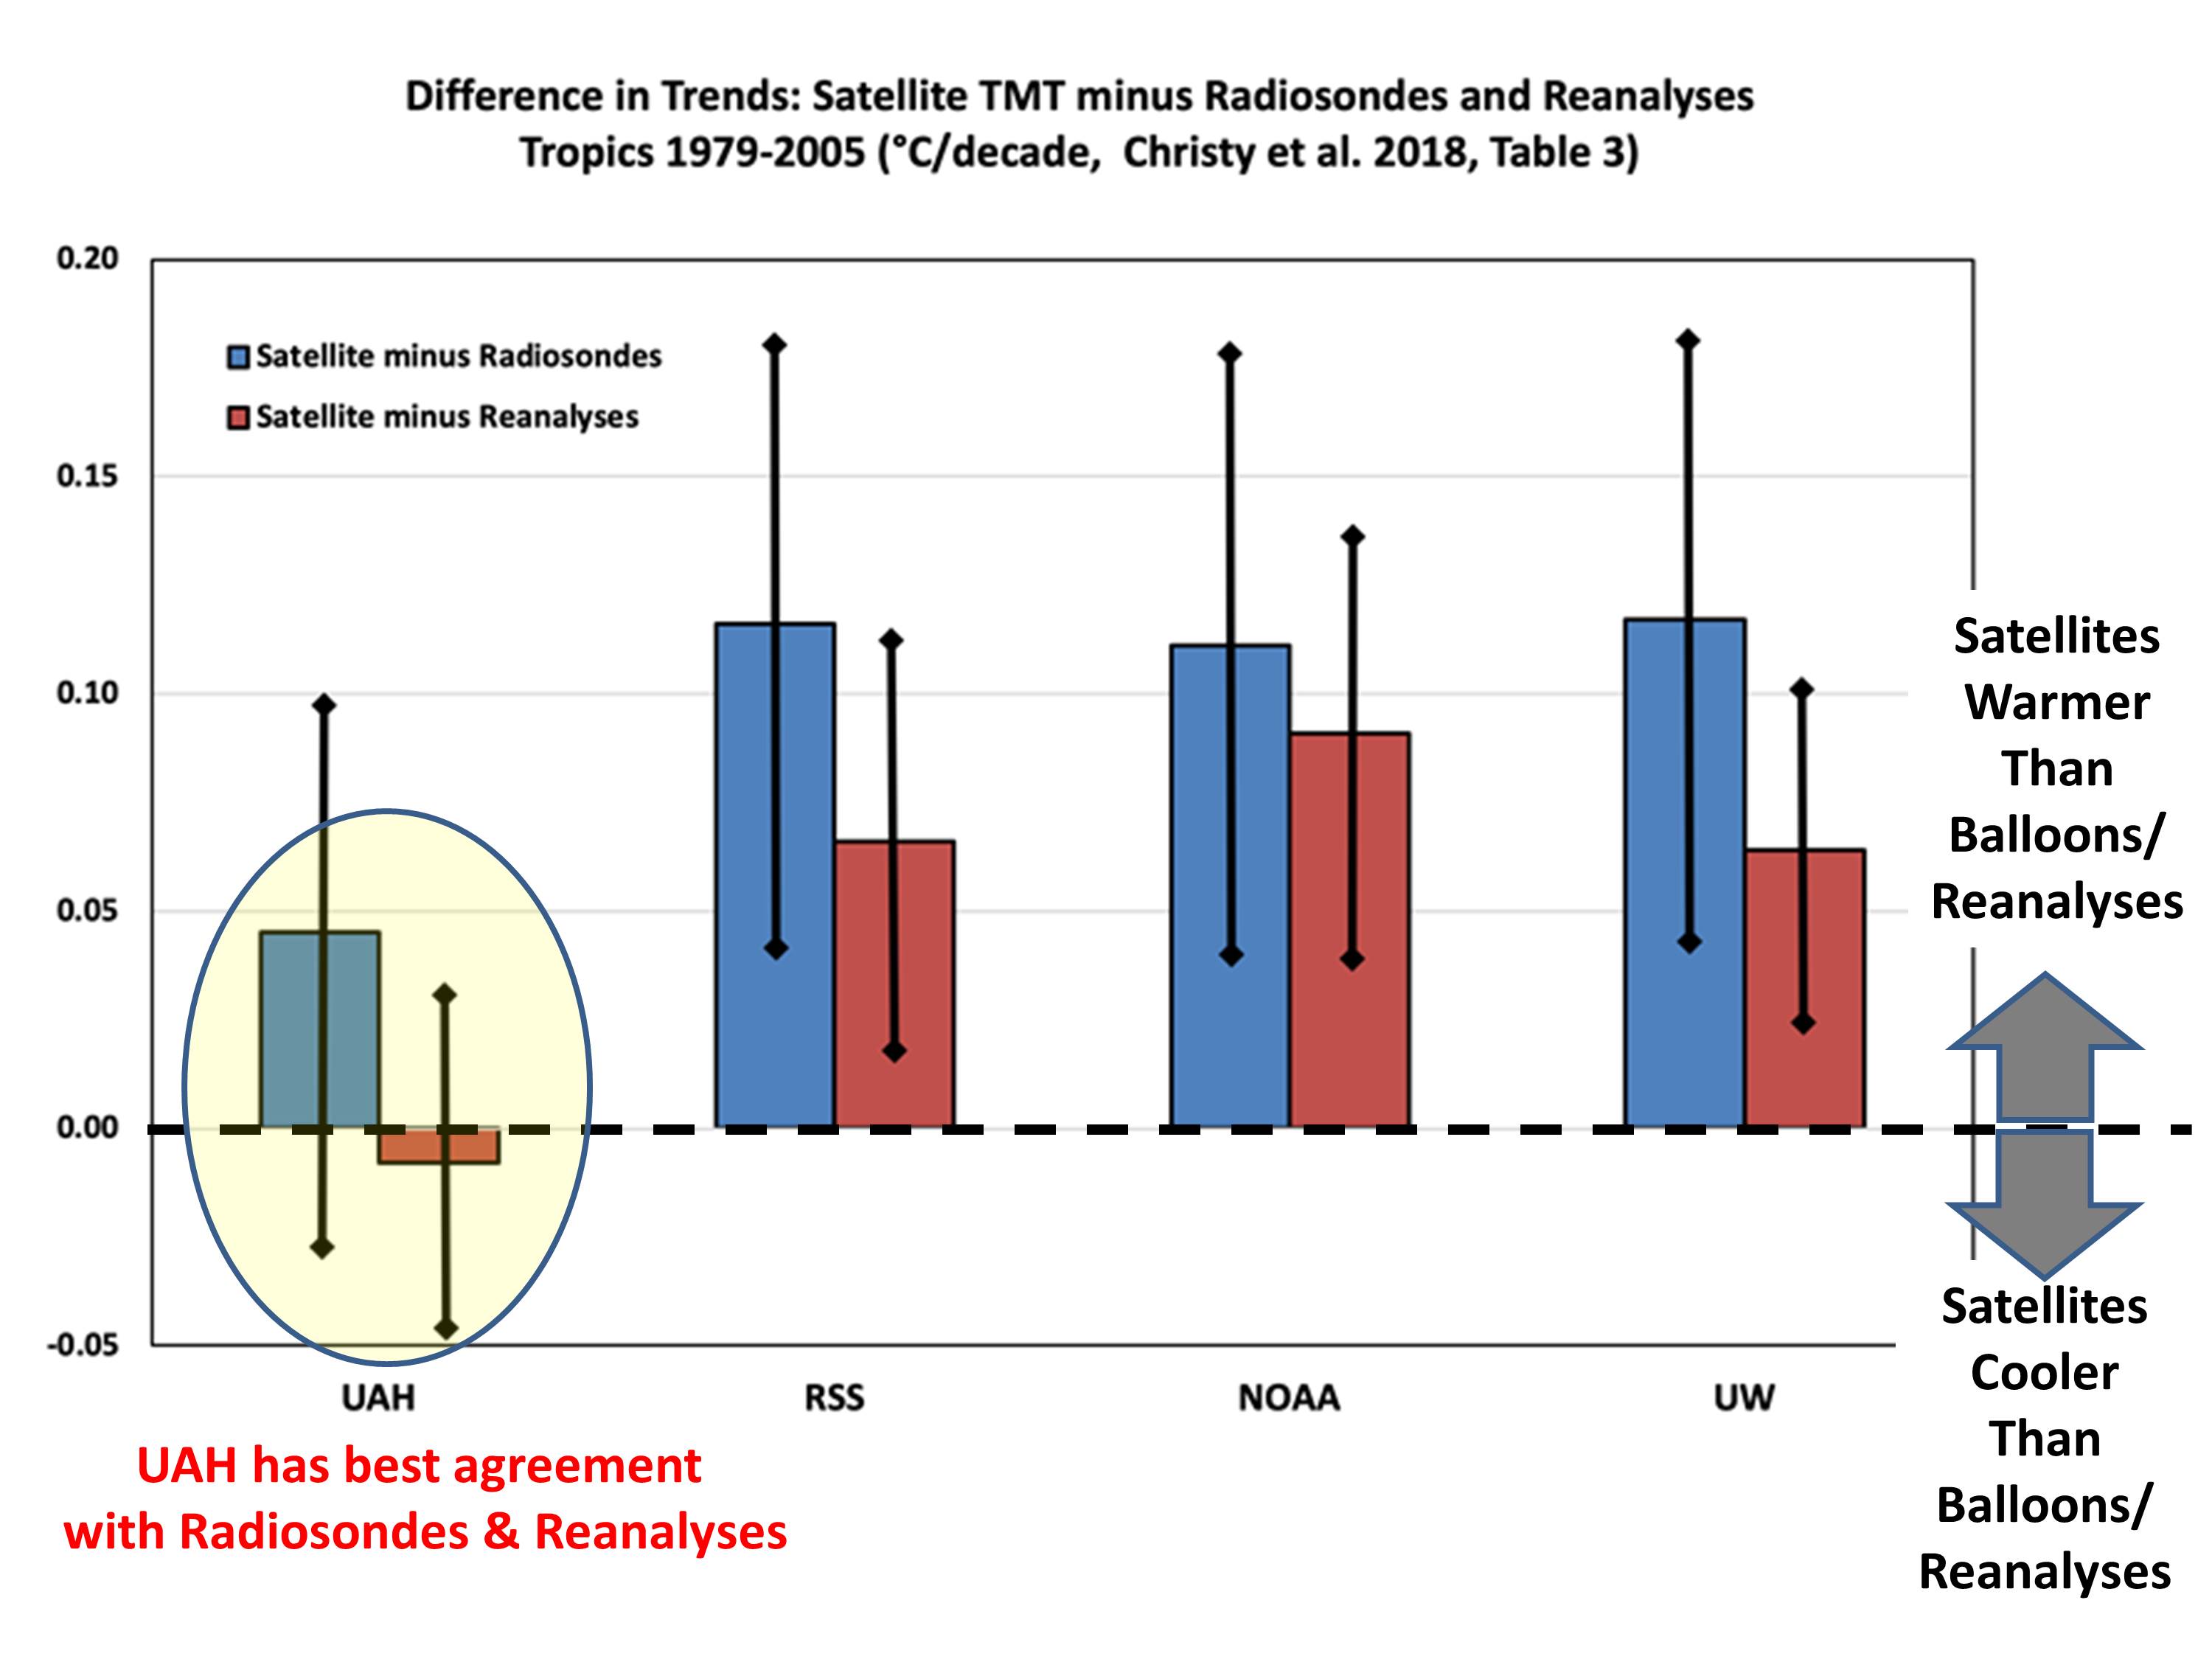
Clearly, the RSS, NOAA, and UW satellite datasets are the outliers when it comes to comparisons to radiosondes and reanalyses, having too much warming compared to independent data.

But you might ask, why do those 3 satellite datasets agree so well with each other? Mainly because UW and NOAA have largely followed the RSS lead… using NOAA-14 data even when its calibration was drifting, and using similar strategies for diurnal drift adjustments. Thus, NOAA and UW are, to a first approximation, slightly altered versions of the RSS dataset.

Maybe Scott Denning was just having a bad day. In the past, he has been reasonable, being the only climate “alarmist” willing to speak at a Heartland climate conference. Or maybe he has since been pressured into toeing the alarmist line, and not being allowed to wander off the reservation.

In any event, I felt compelled to defend our work in response to what I consider (and the evidence shows) to be an unfair and inaccurate attack in social media of our UAH dataset.

UPDATE from John Christy (11:10 CDT April 26, 2019):

In response to comments about the RATPAC radiosonde data having more warming, John Christy provides the following:

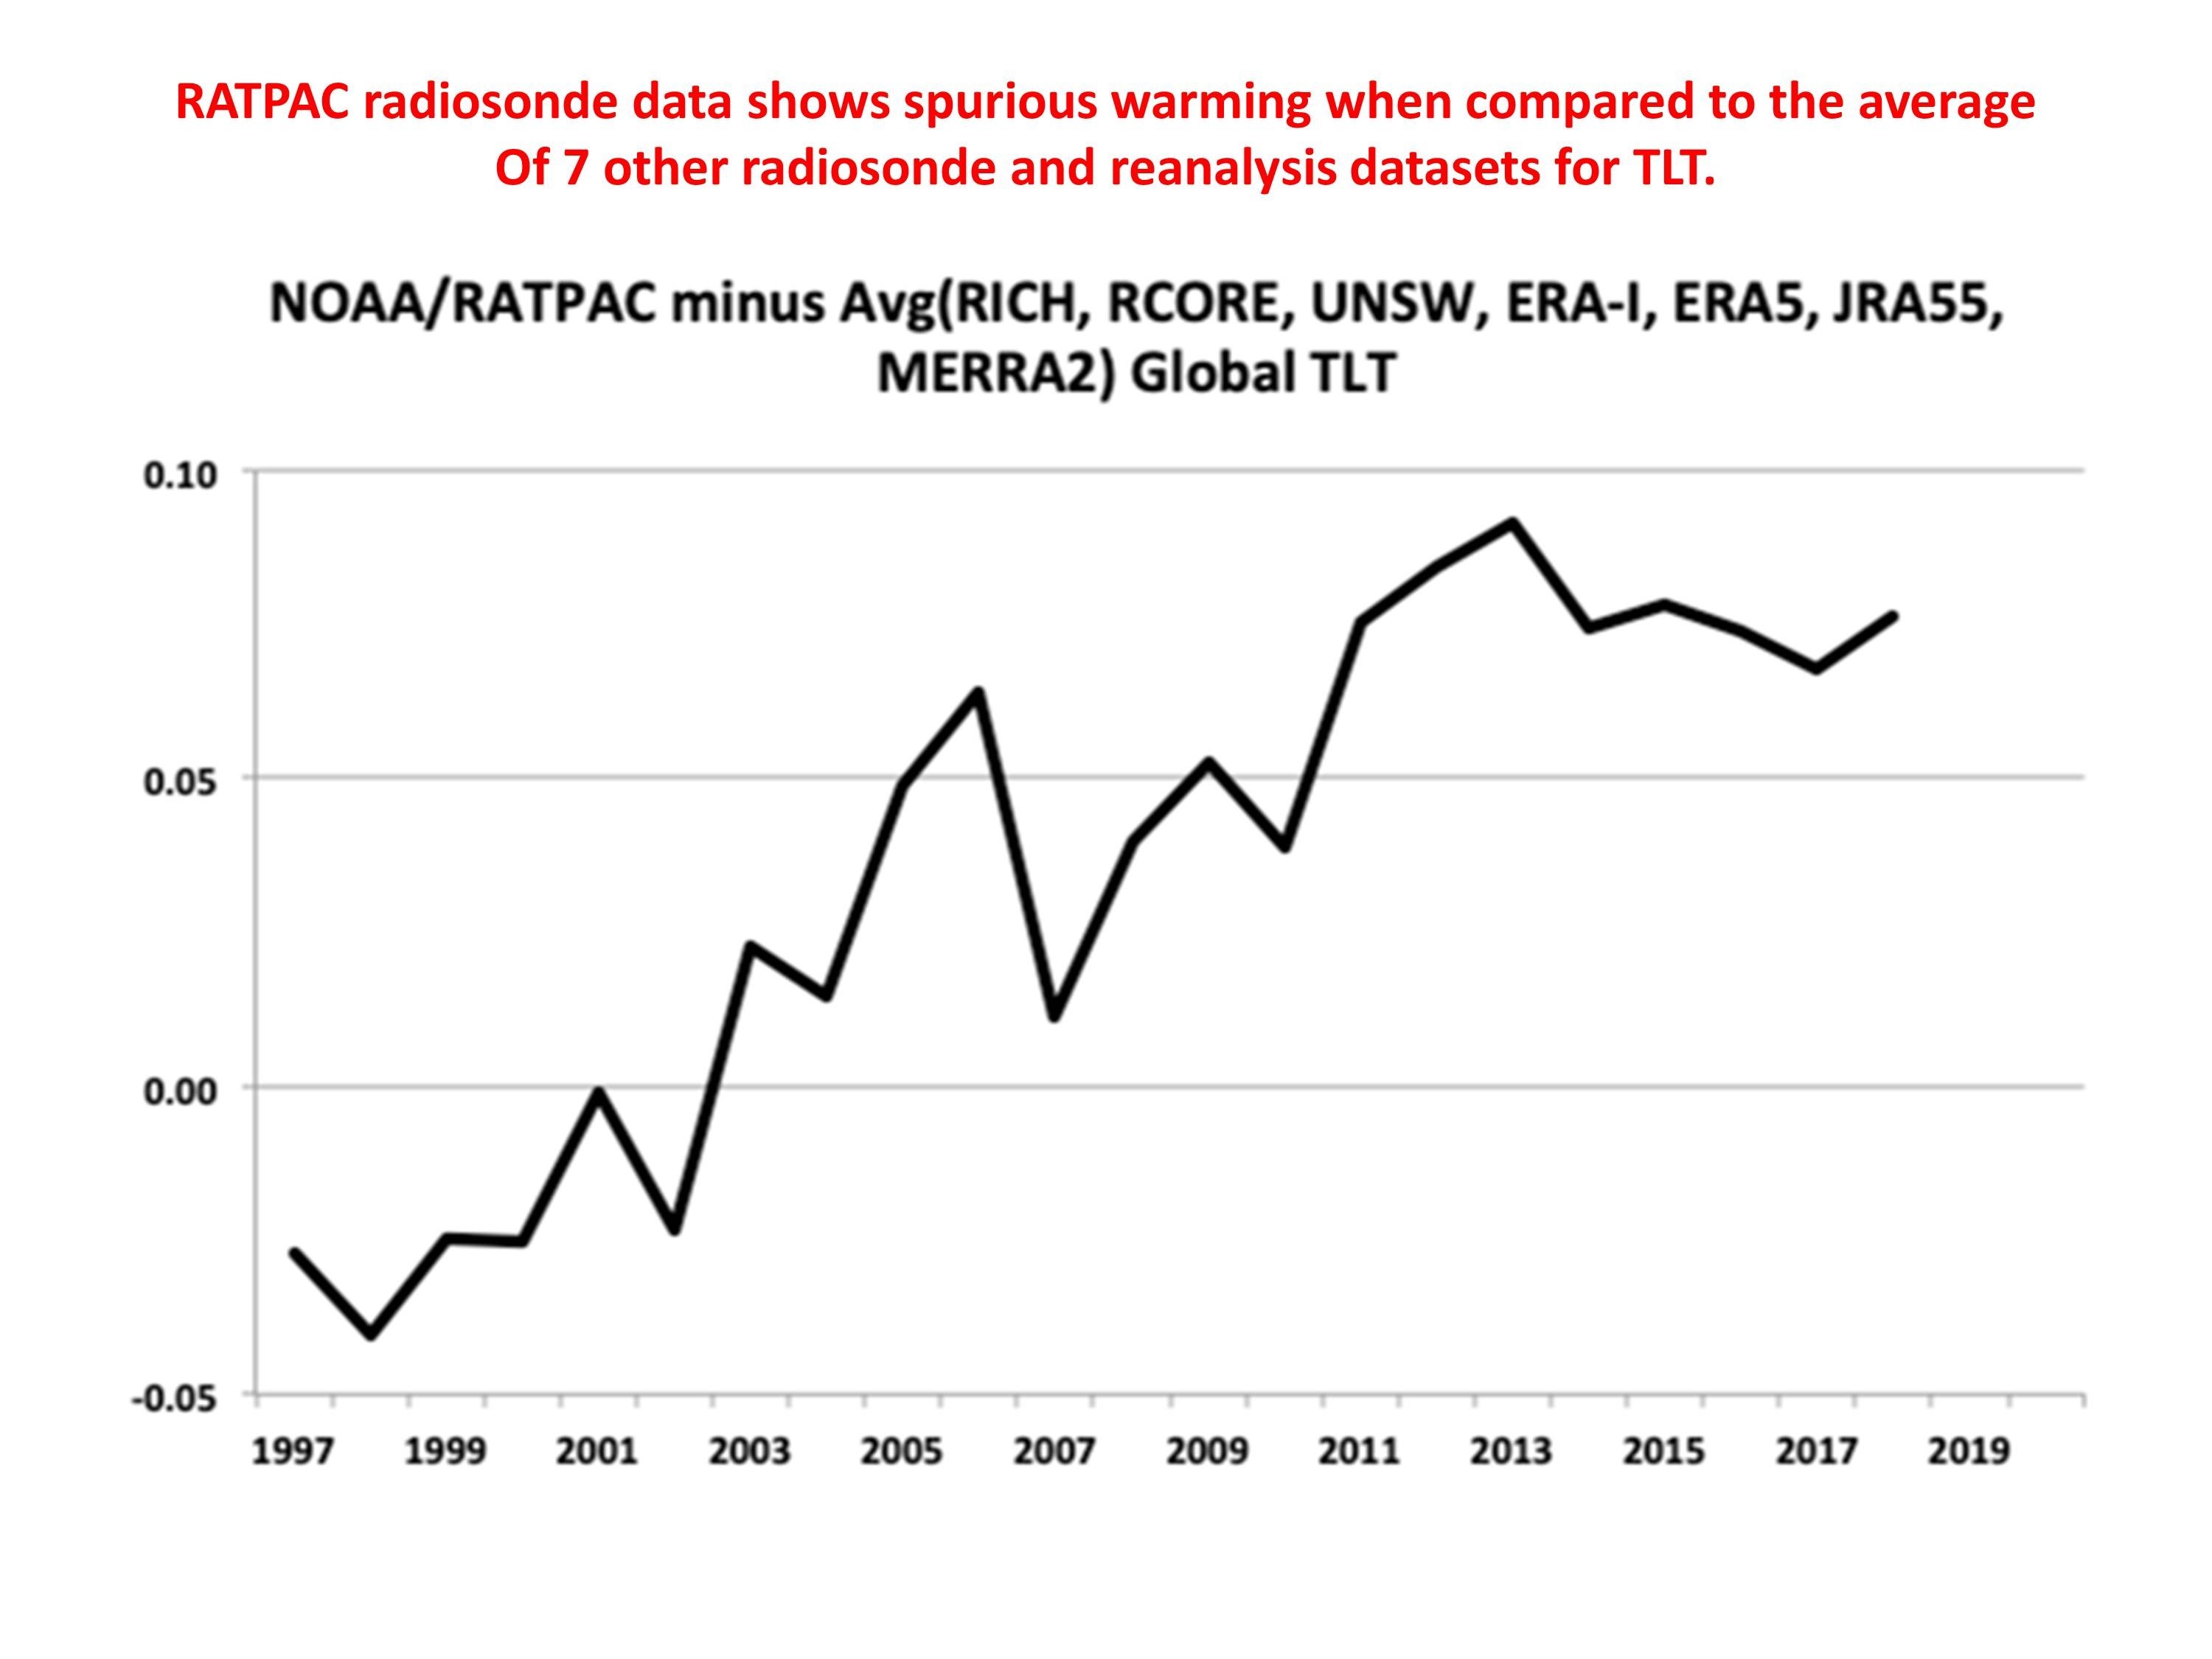
The comparison with RATPAC-A referred to in the comments below is unclear (no area mentioned, no time frame).  But be that as it may, if you read our paper, RATPAC-A2 was one of the radiosonde datasets we used.  RATPAC-A2 has virtually no adjustments after 1998, so contains warming shifts known to have occurred in the Australian and U.S. VIZ sondes for example.  The IGRA dataset used in Christy et al. 2018 utilized 564 stations, whereas RATPAC uses about 85 globally, and far fewer just in the tropics where this comparison shown in the post was made.  RATPAC-A warms relative to the other radiosonde/reanalyses datasets since 1998 (which use over 500 sondes), but was included anyway in the comparisons in our paper. The warming bias relative to 7 other radiosonde and reanalysis datasets can be seen in the following plot:


516 Responses to “UAH, RSS, NOAA, UW: Which Satellite Dataset Should We Believe?”

Toggle Trackbacks

  1. Michael F Blair says:

    Your work is of great value. The alarmist rhetoric must give way to actual hard data, unaltered and properly recorded and reported. Science loses value when it becomes political and subject to bias. I have trouble with AGW for two reasons: (1) Total fossil fuel emissions of CO2 since 1750 would amount to about 285 ppm of atmospheric CO2. Without those emissions, atmospheric CO2 would be below the level needed for plant life. (2) Combustion of all known fossil fuel reserves on earth would add only 147 ppm to atmospheric CO2 (e.g. 1.7 trillion barrels of oil at 433 Kg C02 per barrel is 148 ppm if atmosphere is 5.148e18 Kg). Natural gas would add 28 ppm maximum and coal just over 600 ppm maximum. This total over at least 50 years would fall far short of the IPCC published forecasts. Finally, CO2 impact on warming decays exponentially. As I see it, fossil fuels are just not capable of adding enough CO2 to the atmosphere to come close to the IPCC alarm levels. The actual impact would be much less since not all oil & gas is burned (petrochemicals, asphalt, etc.) and natural sequestration (forests, oceans, etc. consumes CO2). In other words, it is just not possible. In my version of science, things that are not possible don’t happen.

    • bobdroege says:

      You have a cite for this

      “Without those emissions, atmospheric CO2 would be below the level needed for plant life. ”

      I would just wonder how the CO2 would be removed to the level below which plant life can survive when the amount in the oceans would certainly maintain the atmospheric level suitable for plant life as they have for millions of years.

      But I see you have your own version of science, that says it all.

      • Scott says:

        “I would just wonder how the CO2 would be removed to the level below which plant life can survive when the amount in the oceans would certainly maintain the atmospheric level suitable for plant life as they have for millions of years.”
        One word answer: Limestone.

        • bobdroege says:

          And it didn’t happen for millions of years, because the CO2 is outgassed at volcanic vents maintaining the level of CO2 in the atmosphere.

    • jimbo says:

      “Total fossil fuel emissions of CO2 since 1750 would amount to about 285 ppm of atmospheric CO2. Without those emissions, atmospheric CO2 would be below the level needed for plant life.”

      hahahahahahahahahahahahahahahahahahahaahahahahahahaahahhahahahahahahahahahahahahahahahhahahahahahahahahahahahahahahahahahahahahahahahahahahahahahahahahahahahahahahahahahahahahahahahahahaahahahahahahaahahhahahahahahahahahahahahahahahahhahahahahahahahahahahahahahahahahahahahahahahahahahahahahahahahahahahahahahahahahahahahahahahahahahaahahahahahahaahahhahahahahahahahahahahahahahahahhahahahahahahahahahahahahahahahahahahahahahahahahahahahahahaha

      Oh man, good one. Plants would die without our gracious burning of fossil fuels. So I guess we’ll have to redate creationism from 3000-4000 BC to about 200 years ago at the beginning of the industrial revolution since plants and animals couldn’t have survived before that. Brilliant. This website is no end of comedy. Keep at it fellas!!

    • Scott says:

      Michael,

      Perhaps you were looking at the struggle C3 plants went thru in the last ice age? That said, the C4 plants would survive, so you can’t really say all plant life would die. Interestingly, most of our food is C3, so I agree that adding Co2 actually did increase our ability to grow food. If that wasn’t true, you wouldn’t see green houses adding extra co2. A simple search online and you can find the various products to increase co2 for growing plants. Follow the money.

  2. Roger A Pielke Sr says:

    Hi Roy – An excellent post! I encourage you to also submit the accuracy discussion to be published perhaps in BAMS.

    On the surface temperature compared to 2 meter temperatures, my concern on land is on the quantitative values of trends since with superadiabatic lapse rates in unstable stratified surface layers the temperature will be warmer at the surface, while in stably stratified surface layers the surface temperatures will be cooler. Thus, while warming and cooling trends are expected to closely correlate, one has to assume the surface layer lapse rate trend invariant over time.

    We have a paper that looks at the lapses rate issue, albeit for two layers in the surface layer above the surface. For light winds at night the lapse rate is not invariant. It would be useful for this question to be explored for the level between 2m and the actual ground surface.

    Best Regards

    Roger Sr

  3. Roger A Pielke Sr says:

    Here is the paper I was referring to.

    Lin, X., R.A. Pielke Sr., R. Mahmood, C.A. Fiebrich, and R. Aiken, 2015: Observational evidence of temperature trends at two levels in the surface layer. Atmos. Chem. Phys. Discuss., 15, 2469524726,

  4. ossqss says:

    Where could one find a tower or aircraft temperature dataset? First I have heard of that….. Please tell me aircraft engine intakes are not used like ships for data!

    My guess is Mr. Scott D needs another research grant and this may be part of his lobbying effort.

  5. RW says:

    Well defended, Roy. That being said I don’t have a clue which satellite data set is the most accurate and frankly, I can’t muster the mental energy to try to figure out differences on the order of couple tenths of a degree. Sorry!

  6. Insults Are Tiresome says:

    Make that VERY tiresome, Bobdroege.

    • bobdroege says:

      Very true, I was trying to point that out to the trolls that started with the insults.

      Seems they have started to whine about the insults, so that’s progress, let’s see if they stop.

      If not I will continue in spades.

  7. Milton says:

    Dr. Roy,
    Is there any reason that the satellite long term trends should match the surface temperature trends? They are measuring something different, so I don’t see any reason they should match exactly.

    M

    • Richard M says:

      I think the simple answer is …. physics. The physics of the atmosphere is always trying to achieve equilibrium. Of course, this is never achieved which is why we continue to have weather. So, the question becomes … how far from equilibrium can the two areas of the atmosphere get and for how long?

      I think ENSO provides some help. We see the satellite data usually reacts a few months later to the changes on the surface and at a larger magnitude. This would appear to put a limit on the differences between surface and satellite measurements.

      They aren’t perfectly aligned but over the course of a couple of years they probably are equivalent and therefore should have trends that are equivalent.

      • Christopher Game says:

        Richard M writes “I think ENSO provides some help. We see the satellite data usually reacts a few months later to the changes on the surface and at a larger magnitude.” This is very interesting and important, it seems to me. Will Richard M kindly provide more detail for his claim? Which satellite quantities? How to assess “reacts a few months later”?

      • Christopher Game says:

        Asking again, please will Richard M Will kindly provide more detail for his interesting and valuable claim? Which satellite quantities? How to assess reacts a few months later?

    • Scott says:

      Milton,

      The SAT data is without a doubt better than combining thermometer data and creating a global average using adjustments. The locations of the thermometers is biased to locations where people live, where cement is being poured, and where trees are being cut down. This creates a “heat island” effect in the data. I do not think the IPCC is properly adjusting data. I trust the local NOAA data and the global SAT data for my research. The SAT data obviously does capture the heat island effect too, but it is averaged out. Interestingly, the best control group where no human activity is Antarctica, where there is no warming at all… and even ocean cooling for the last 40 years (HADSST3). That said, the arctic got much warmer from 1993-2016, but to my eye it looks like a cycle looking at the local NOAA data for 1940-1980 which showed strong cooling. Note on the NASA chart that everyone looks at, there is no sign of that 1940-1980 cooling even though at that time we were worried about an ice age. To be honest I’m worried about the grand solar min right now and cold crop losses / flooding.

  8. Bruce of Newcastle says:

    Seriously, I think even UAH has a warming bias which isn’t there in the real world.

    If you put a trend line on the Rutgers snow extent anomaly data it is dead flat for over two decades. But the comparable UAH NH LT dataset is warming over that period.

    The snow extent anomaly is a geographic isotherm of 0 degrees Celcius, pretty much. If the area at or below 0 C isn’t changing relative to the average then the temperature isn’t actually changing.

    Snow extent is relatively easy to measure photographically by contrast to AMSU derived temperature series. No orbital decay issues for example.

    There might be an explanation for the UAH NH LT warming compared to no such apparent warming in the SCE data. That is land use changes in the temperate regions of the NH. The paired-site UHIE study that Dr Spencer did some time ago shows just how large land use based warming actually is. So I wouldn’t be surprised if that is affected the UAH NH temperature data, since there is more to the northern hemisphere than the bit at or above the snow line.

    But it is clear from the SCE data that there is effectively no real world global warming caused by CO2 this century so far.

    (The original Rutgers SCE data is here.)

    • Snow extent anomaly is not a very good indicator of global temperature, for a few reasons. One is that there can be lack of snow on land that is below freezing, and percentage of below-freezing land that is covered by snow is affected by storm track changes and the comings and goings of droughts. Also, as one example, the Arctic ocean and other northern waters losing ice cover can cause snow to fall where it otherwise wouldn’t fall, or increase presence of snow coverage, especially in the fall in and near Siberia.

      Another reason is that snow coverage extent is very noisy, and is affected by things such as storm tracks going into ruts that last a couple months to a few years, sometimes as much as about a decade.

      Yet another factor for snow coverage is changes in farm practices, such as ones that are done to preserve snow cover or that have a side effect of preserving snow cover, such as for conservation of soil moisture or as a result of decreasing presence of weeds or decreasing need to till the soil.

      • Bruce of Newcastle says:

        The Rutgers data is a 12 month moving average to smooth such variations. If you look at the UAH NH LT data you’ll see the annual variations in temperature (which do have a clear ENSO signal) also are matched by variations in snow cover (an anticorrelation of course). Yet the long term UAH NH LT trend is up whereas the Rutgers SCE anomaly is flat over the same time span.

        We know UAH has to do a lot of processing of the data. The SCE data is just read off the sat pics at the right wavelengths as far as I gather. Isn’t affected by the issues microwave temperature measurement is, which makes snow cover a primary proxy and AMSU temperature actually a secondary proxy. On that basis the upward trend of UAH needs to be defended against the solid SCE data.

        You missed my point about land use affecting UAH. Dr Spencer’s paired datapoint study shows only about 60 people per sq km is a sufficient number to raise local temperature by 1 degree Celsius. Massive effect! But that will tend to be greatest at lower latitudes where population growth mostly is. Besides which the effect should reduce snow cover due to albedo changes more than farmers fostering snow cover for agricultural reasons. Population density effects are much more extensive than just agricultural.

      • Bruce of Newcastle says:

        Oops, I meant also to mention that the balloon datasets cross-validate the UAH dataset, which is why I raised the land use changes vs population density at lower latitudes. Something must explain why the snow line has been static in trend terms while the northern hemisphere temperature has risen. It’s not as if the melting point of water can change after all.

        But the point about the snow line being static (trendwise) is that the rapidly rising pCO2 cannot then be the cause of the warming in the UAH dataset over the last quarter century, since the models consistently say that warming should be accentuated at high latitude. That is totally falsified by the SCE data.

        Obviously this is all NH related as there isn’t enough land surface in the SH to give meaningful SCE data.

      • An Inquirer says:

        Don,
        “Snow extent anomaly is not a very good indicator of global temperature” IF snow extent is increasing or is stable. It is a good indicator if snow extent is decreasing.

    • Richard M says:

      Most of the bias you mentioned is due to noise (ENSO). Over the last two decades, when you eliminate the periods of time most affected by ENSO (both warming and cooling), the trend falls well within error measurement.

    • barry says:

      Bruce of Newcastle.

      Two assumptions lie behind your connecting warming temperatures with snow cover that you might want to investigate.

      1) A warmer globe means less snow falling.

      But more precipitation is expected in a warming world – in those places where precipitation is a regular feature (more drought where the region is more arid). This mitigates expectations of less snow cover – which is consonant with the literature on the subject, which has varying conclusions. So the absolute tie between global temps and NH snow cover is of your own making (and perhaps some ill-informed bloggers?).

      2) Thee long-term annual trend is slightly down (but statistically significant). Because the variability is quite high, it could lead one to assume that shorter terms trends are statistically meaningful.

      But that is not the case (to 95% confidence interval) with NH annual snow cover from the mid 90s.

      We have different results from different seasons. Winter time snow cover is probably increasing over time, suggesting more snow fall. But summer time cover is decreasing (at a slightly faster rate), and that indicates warmer temperatures reducing snow cover.

      The wintertime increase is not dissonant with increasing temperatures = more precipitation.

      So: though you tie increased temps to less snow cover, that does not gel with the rather more varied literature, particularly when considering greater precipitation. And we actually do have decreased snow cover over the long term (1979 to present) as a measure of annual figures.

      One has to cherry-pick to get flatline or increasing snow cover (whether a cherry pick of the season, month, or time frame). However, there is enough uncertainty in projections and observations both that any narrative could be weaved, with sufficient lack of rigour… That may be why the peer-reviewed literature is more variable on the issue than, say, the mainstream media sometimes is, or some blog sites. On this topic, there is no consensus.

      https://agwobserver.wordpress.com/2013/02/19/papers-on-snow-cover-changes/ (Hasn’t been updated since 2013)

  9. Roy W. Spencer says:

    They should be not very different because they are convectively and radiatively coupled. The theory as encapsulated in the climate models suggest the tropospheric trends should be somewhat larger than the surface trends, due to moist convection.

    • MikeR says:

      Hi Roy,

      I note that you refer to the TMT data versus radiosonde data for Christy et al. 2018 in the above.

      Why not use the TLT data? The following are trends, for varying altitudes for annual data from 1979 until 2018 inclusive, for the radiosonde RATPAC A, UAH TLT and RSS TLT.

      https://i.postimg.cc/50D3yP8n/Rat-Pac-A-Trends-Pressure.jpg
      https://i.postimg.cc/4yt19z5Z/Rat-Pac-A-Trends-Height.jpg

      Very different picture to the one you paint.

      • m d mill says:

        .02/decade ??

      • m d mill says:

        I hope Dr. Spencer will respond to this challenge.

      • m d mill says:

        The UAH TMT trend is .09C/decade.
        Dr. Christy’s radiosonde data is virtually identical with this value. Your graph shows RATPAC-A radiosonde TMT trend
        of ~.2C(.02?)/decade.
        Clearly the difference is NOT about TMT versus TLT.
        There is clearly a huge difference between your selected radiosonde data and Christy’s radiosonde data …it is probably about the RATPAC-A “homoginized” data versus the direct data used by Christy.

      • MikeR says:

        Oops , the trends were all given in degrees C per year.

        Same conclusion though.

      • MikeR says:

        The other elephant in the room that should be addressed is the influence of ENSO upon UAH TLT versus RSS TLT. The data suggests that UAH TLT is sampling data from higher up in the troposphere than does RSS.

        I have commented hare regarding this starting here,

        http://www.drroyspencer.com/2019/04/uah-global-temperature-update-for-march-2019-0-34-deg-c/#comment-348328 .

        It would be interesting to get Roy’s take on all of this.

        • m d mill says:

          But this would not effect trends much (altitude of TLT).

          I believe the UAH results are the most reliable because it relies on climate models the least (and observed direct satellite measurements the most), and the radiosonde data correlates best. Data should be fundamentally independent of presumed theories (ie models) unless they are independently proven; therefore the RSS approach uses a fundamentally inferior scientific method.
          I repeat “There is clearly a huge difference between your selected radiosonde data and Christy’s radiosonde data”. I don’t prefer data that is “homogenized” and “re-analysed” (such as the RATPAC-A data)until it yields a result the researchers believe or want to believe…it is very bad scientific method. Just use the measured data.
          But I would like Dr. Spencer to comment on this…it is an essential argument in the evaluation of UAH versus RSS.

          • MikeR says:

            Yes likewise regarding Dr Spencer. A comment or two from him would be useful.

            I also note that in his paper he uses homogenized IGRA radiosonde data. Could he perhaps comment on how different this data is compared to RATPAC A?

        • Scott says:

          I would actually prefer that we do not filter out El nino and leave the temp data raw. I agree with others that it is nice to have unaltered temperature data so that we can make our own conclusions. El Nino is the most important variable. Almost all the peak in the temp data align with El Nino other then the Mt. Pinatubo eruption which dropped temps like a rock while El nino continued to rise a bit longer. It seems like El Nino has the same 11 year period as the sun offset. It becomes clear when you add a 5 year ma. So what happens when the sun goes to sleep? It seems the trade winds should die down as the jet streams get crazy, leaving more warm surface water, and actually create MORE El Nino conditions, but that will ultimately rob us of our future heat sending us into a “mini” ice age. How long does this process take? Who knows. A while. This is why I have not given up on the sun based model. When the next solar cycle starts and the cold water comes up, we will see the La Nina strength which should help with the forecasts.

      • Randy Bork says:

        I’m probably confused on some point with this question; “Why not use the TLT data?” but my impression is that TMT[sat] data would be the most closely analogous data to the weather balloon data [for purpose of the question about the use of NOAA-14 MSU]. I sense a useful opportunity to correct my apparent mis-impression.

        • m d mill says:

          I assume balloons collect data at all different altitudes, and can be compared to TLT AND TMT. TLT would be closest to surface temperature one would assume.

        • bdgwx says:

          Balloons produce a full vertical profile. Reanalysis does as well. I happen to be partial to reanalysis because it constructs full 3 dimensional snapshots of the atmosphere that must match all available observations which can as many as tens of millions of observations per day. One fair criticism of them is that they typically use many of the same modules to create the snapshots as they do forecasts. I believe reanalysis produces slightly more accurate 2m T anomalies than does the conventional datasets. I’m not sure how accurate the TLT or TMT levels are though. I’ve not seen stats on that.

      • Roy W. Spencer says:

        TLT wasn’t addressed because UW and NOAA don’t produce that product. The intent was to compare all 4 of the satellite datasets.

        • I see also, the matter of RATPAC-A vs RATPAC-B, and radiosonde datasets other than RATPAC vs. one of the RATPAC ones. I remember past commentary on the A and B RATPAC radiosonde datasets. Such as that one is preferred for climate change science purposes (perhaps because it is “better processed” or “relies more evenly among its radiosondes (from weighting to where more radiosondes are used)” or “better agrees with models (or RSS)”, my words for what I remember. And that the other has better agreement with satellites when considering a minority of radiosondes that represent a majority of the area measured by both radiosondes and satellites, or something like this. Does anyone have comments on this?

          • m d mill says:

            Thanks to RS and DLK for clarifying comments.

            I continue to prefer the UAH methodology as it is based more on independant satellite(data) based diurnal drift corrections, than on models based corrections, which are the subject in question in the first place (it is a circular argument).

            See Dr Spencers previous discussion here:

            http://www.drroyspencer.com/2017/07/comments-on-the-new-rss-lower-tropospheric-temperature-dataset/

            Specifically:

            “Because climate models are known to not represent the diurnal cycle to the accuracy needed for satellite adjustments, we decided long ago to measure the drift empirically, by comparing drifting satellites with concurrently operating non-drifting (or nearly non-drifting) satellites. Our Version 6 paper discusses the details.”

            and

            “I suspect the next chapter in this saga is that the remaining radiosonde datasets that still do not show substantial warming will be the next to be “adjusted” upward.” !!!

      • MikeR, sorry for the late response…see the update I added to the article (by John Christy) showing clear evidence of spurious warming in RATPAC trends compared to 7 other radiosonde and reanalysis datasets.

        • m d mill says:

          Many Thanks again to Drs Spencer and Christy. That seems to answer it! Where else can an amateur “investigator” pick the brains of the best in the field.

        • MikeR says:

          Many thanks to you Roy for providing this information.

          I have had a look at the correction graph provided by John Christy. The corrections are significant but not huge in comparison the raw RATPAC A data.

          I have averaged the 850-300 mbar data and used the corrections read from this graph (as best as I could to perhaps 0.005 C accuracy) .

          Applying the correction brings the trend for 1979 from 0.19 C /decade down to 0.17 C/ decade. It is slightly closer to RSS TLT (0.20 C/decade) than to UAH TLT (0.13 C/decade).

          It matches exactly the RSS TTT data (0.17 C /decade).

          I think this is in line with my comments , based on the influence of ENSO, that RSS TLT matches more closely to the surface temperature trends than UAH TLT. It seems that the RSS TTT product which was developed to reduce stratospheric contamination is perhaps the best match to the radiosonde data.

          The other point to note is that the two RSS data sets (TLT and TTT) correlate significantly better than UAH TLT to the radiosonde data for almost every pressure.

          The data plus correlations between the different data sets are shown here in an Excel table.

          https://i.postimg.cc/FsDdtdTT/RATPAC-A-corrected.jpg .

          This image can be downloaded for clarity.

          The original Excel file can be found here

          https://drive.google.com/file/d/1jOmFycbYWliQlSiM4JjrYsY2e9L_536v/view?usp=sharing .

        • MikeR says:

          By the way, the trends in the Excel spreadsheet in my comment above are given in degrees C per annum. I hope this doesn’t cause any undue consternation.

          • m d mill says:

            But isn’t the most important point here that the TLT RATPAC-A trends are ~.07C/decade higher than the 7 other TLT radiosonde and reanalysis datasets, which is a significant amount in this context, not that RATPAC-A trend happens to be closer to the RSS trend value?

          • MikeR says:

            No m d mill, I don’t believe so. The argument has always revolved around trends. For example, Spencer and Christy in their paper above have adjusted their radiosonde data to confirm the trend for UAH TMT.

            I am instead questioning the UAH TLT data which, using their corrections to RATPAC A, appear to be less representative of the surface temperatures than does RSS TLT. Additionally using the same data, RSS TTT seems to be the best with regards to the lower troposphere.

            This is also in line with the sensitivities of UAH TLT and RSS TLT to the ENSO signal .

            Lagged correlations with ENSO suggests that UAH is measuring data from higher up in the atmosphere than RSS and accordingly may have a larger stratospheric component.

            The lagged correlations are shown here,

            https://postimg.cc/0MXs1qNC .

            So UAH TLT being an outlier compared to surface and RSS TLT temperature trends may not be that important as it could be just be a case of comparing numerous apples to one orange.

    • Milton says:

      Of course they are coupled, but still, they are different. Clearly temperature decreases with altitude, so a trend of surface temperatures is essentially a trend in the maximum of a function of height. The satellite data is a trend in some weighted integral of temperature over height (I think, but am not sure exactly how you do it).

      I think my earlier point got lost. Suppose you had a global network of accurate thermometers at exactly 10km altitude. Would you expect the warming trend for these to be exactly the same as 1m? I think not since higher up it is actually cooling from AGH. Extending the logic, the warming trend is height dependent, so the sat trend should not be expected to match the surface trend.

      M

    • Craig T says:

      Dr. Spencer, can you elaborate on this? TMT anomalies are climbing slower than TLT which (I assume) are also coupled. It’s clear that a strong El Nino shoots up the lower troposphere temperature, adding noise to the trend.

      [truly asking and not fishing for a “gotcha”]

  10. steve case says:

    After reading a few paragraphs of the above, I thought about the old saw about several wolves and a sheep voting on what to have for lunch.

  11. Ric Werme says:

    Very odd. I was at the ICCC that featured your “debate” with Scott Denning, the one where you guys spent more time agreeing with each other rather than duking it out. Scott seemed like a pretty reasonable (and skeptical!) fellow.

    The video is still linked to directly from the main ICCC page,
    http://climateconferences.heartland.org/

    or directly at

    http://climateconferences.heartland.org/roy-spencer-vs-scott-denning-iccc6/

  12. steve case says:

    On a Google news search of “Global Warming Data” this Scientific American item from a few days ago comes up:

    It’s A Match: Satellite and Ground Measurements Agree on Warming
    LINK

    Follow the link, and you will find that it compares the AIRS and GISSTEMP data sets.

    So it would be appropriate, at least in my view to see what GISSTEMP is all about. Here’s what they’ve done to the data over the last two decades:
    https://i.postimg.cc/sD1ZKVF3/image.png

    Scientific American says, “The close agreement between the two data setsone collected from the ground and the other from the skyprovides yet another confirmation that scientists are getting an accurate read on the progress of global warming.”

    • Bindidon says:

      steve case

      As you perfectly know, the differences between UAH5.6 LT and UAH6.0 LT are way higher than the sum of all differences between the consecutive GISSTEMP revisions.

      But I know: it is one of your preferred hobbies to keep blind on the right eye, isn’t it?

      • steve case says:

        Here’s an apples to apples side by side comparison of GISS and UAH from 2012 and 2018
        https://i.postimg.cc/fbQz70st/image.png

        • bdgwx says:

          How was that graphic created?

          • steve case says:

            bdgwx

            This is my 4th attempt to answer your question. Maybe it’s the links that are the problem. I compared files found on the Internet Archives WayBack Machine with the current versions. The differences between the current monthly entries and those from 2012 were plotted out. Data since 1979 at GISS has been adjusted upwards.

        • MikeR says:

          Hi Steve,

          I downloaded the same data as you have from https://data.giss.nasa.gov/gistemp/history/.

          It shows the same increase in temperatures over the 1979-2012 period by an an average 0.058 C for the 2018 version. However the trend has been reduced from 0.154 to 0.151 C per decade with the newer version!

          If GISS has been manipulated to suit a global warming narrative then the it has been a very poor attempt.

          • steve case says:

            Thanks for providing that link, I know I had seen it before but I didn’t save the link. Duh! Well anyway it’s at odds with what you find they’ve done since 1997. Here’s what that looks like:
            https://i.postimg.cc/sD1ZKVF3/image.png
            Here’s the link to the 1997 data:
            https://web.archive.org/web/19970301013001/http://www.giss.nasa.gov/Data/GISTEMP/GLB.Ts+dSST.txt
            You can find the link to the current data here:
            https://data.giss.nasa.gov/gistemp/tabledata_v3/GLB.Ts+dSST.txt

          • barry says:

            Hey Steve,

            In 1987, GISS published their data methods paper, and advised they had 2200 stations. In the next major methods paper, 1999, GISS now had 7200 stations (including a big addition from the Southern Hemisphere), based on GHCN v2.

            Dunno if added stations would have much impact on the trend you’re interested in, but I thought you might find that information useful. I believe (but could not re-verify), that a lot of SH stations were added, and the SH trend for the period of interest is higher than the NH (less of a flatline from 1940s to 1970s in the SH). This could be one of the reasons the trend is different in later data sets.

            The papers can be found easily enough at the bottom of the GISS history page linked for us just above. You should also check out the nifty graph there, where you can click on a year of major data revision and it shows you the difference to the data. Seems pretty open to me.

          • steve case says:

            barry says: April 29, 2019 at 3:19 AM
            Hey Steve,

            In 1987, GISS published their data methods paper, and advised they had 2200 stations. In the next major methods paper, 1999 …

            You have a point. The one graph I put up uses GISSTEMP’s 1997 data. So a large addition of stations after that date could be a factor. I’ll check it out (-:

          • steve case says:

            barry says:
            April 29, 2019 at 3:19 AM
            Hey Steve

            So I checked it out. Here’s GISS LOTI from June 2002:

            https://web.archive.org/web/20020803090908/http://www.giss.nasa.gov:80/data/update/gistemp/GLB.Ts+dSST.txt

            Comparing the slope for the 1950-1997 time frame as this graph shows:

            https://i.postimg.cc/sD1ZKVF3/image.png

            There’s no change in the 1950-1997 trend (0.75C per century) in the LOTI from June 2002 which should be after the addition of the 5000 stations with those from the Southern Hemisphere.

            My opinion? It looks like over the time since 2002 those hundreds of changes every month have slowly increased that trend (It’s now 1.0C per century). All those increases to the monthly entries since 1976 probably are the cause.

          • barry says:

            Is there any reason why that particular time period is interesting?

            Why did you choose 1950 as your start date? Why not 1900, 1940, or 1960?

          • steve case says:

            …Barry says: April 29, 2019 at 7:52 AM
            Is there any reason why that particular time period is interesting?

            Why did you choose 1950 as your start date? Why not 1900, 1940, or 1960?

            Because the the 1997 edition of GISSTEMP’s Land Ocean Temperature Index (LOTI) starts at 1950. Here’s that graph again:

            https://i.postimg.cc/sD1ZKVF3/image.png

            I can’t compare apples to apples when one of them doesn’t exist.

            https://web.archive.org/web/19970301013001/http://www.giss.nasa.gov/Data/GISTEMP/GLB.Ts+dSST.txt

          • barry says:

            Ah, I didn’t see that the 1997 data set started in 1950. So you compared as far as the data allowed.

        • barry says:

          Looks like the GISS difference has been flat (no trend difference), and UAH has a declining trend, which means that their adjustments lowered the overall trend.

          So GISS adjustments made little difference to trend, while UAH adjustments made a strong lowering of the long term trend.

          Gee, if I was someone who went by the personalities involved, I’d call the UAH changes biased by the 2 guys who reject the IPCC.

          But I don’t. I think that Spencer and Christy try to be as rigorous as the rest.

          I certainly have nowhere near the information (and skill to analyse it) to hold any other opinion.

          Unfortunately, plenty of self-deluded people dare to impugn work they have zero idea how to analyse.

          • steve case says:

            Barry says: April 28, 2019 at 10:15 AM
            Looks like the GISS difference has been flat (no trend difference), and UAH has a declining trend, which means that their adjustments lowered the overall trend.

            You just wanted to make me smile didn’t you (-:

            Yes, the GISS changes to their Land Ocean Temperature Index (LOTI) from 1976 to 2012 was a bump up except for one. Produced a nice flat trend. Well it’s been a few months since I did that chart, and if I use the latest LOTI data a few more negatives sneak in (out of 408 months from (1979 through 2018) 17 were corrected downward. The average annual change shows 100% upward adjustments 1976 to 2018. I find that just amazing. If you plot the whole thing out back to 1880 it looks like this:
            https://i.postimg.cc/3xFppC9t/GISSTEMP-Changes-2018-05.gif
            These changes go on every month. Without considering sign here’s a listing of changes since January of 2018:

            Number of Changes to GISSTEMP’s LOTI for 2018:
            Jan Feb Mar Apr May Jun Jul Aug Sep Oct Nov Dec
            467 426 458 953 879 429 595 281 439 405 755 789

            Number of Changes to GISSTEMP’s LOTI for 2019:
            Jan Feb Mar Apr May Jun Jul Aug Sep Oct Nov Dec
            843 370 480

            So out of the 1671 months since January 1880, 480 were changed last month. Sort of makes a person want to giggle.

          • Nate says:

            GISS:

            “Q. Do the raw data ever change, and why do monthly updates impact earlier global mean data?
            A. The raw data always stays the same, except for occasional reported corrections or replacements of preliminary data from one source by reports obtained later from a more trusted source.

            These occasional corrections are one reason why monthly updates not only add e.g. global mean estimates for the new month, but may slightly change estimates for earlier months. Another reason for such changes are late reports for earlier months; finally, as more data become available, they impact the results of NOAA/NCEI’s homogenization scheme and of NASA/GISS’s combination scheme, particularly in the presence of data gaps.”

          • steve case says:

            Nate says: April 28, 2019 at 5:24 PM
            GISS:

            “…finally, as more data become available, they impact the results of NOAA/NCEI’s homogenization scheme and of NASA/GISS’s combination scheme, particularly in the presence of data gaps.”

            Uhm yeah uh so why does it form such an obvious pattern? Well really, every single year since 1976 has been bumped up and most of the years for the previous century were adjusted downward. Please don’t tell me, “You were just told why.”

          • barry says:

            Steve, UAH also regularly change the values in the data set. I have copies of the data gong back a few years now. Do you think skeptics Spencer and Christy are fudging the data?

            I don’t, nor do I think anyone else is. They’re just continually doing quality control, and in the case of the land surface records, they are getting information for a given months data dribbling in over many months. It doesn’t all come at once, so there are bound to be changes when new data comes in.

            As for always upwards – no it’s not. The biggest revision of all (NOAA SSTs) raised past temperatures and significantly lowered the long term trend. Also, the latest revision to SSTs, (ERSST v5), lowered the most recent values.

            So it’s not always in the same direction.

          • steve case says:

            Barry says: April 29, 2019 at 3:24 AM

            So NOAA’s “Extended Reconstructed Sea Surface Temperature (ERSST) v4”
            (Link removed so maybe my post will actually show up)
            lowered the most recent values.

            And it snowed in my back yard a few days ago. Maybe I should post a link to the “Escalator” from Skeptical Science. It’s difficult to be objective when faced with what looks like a systematic altering of data.

            I’ve focused on GISSTEMP since it seems to be the one that is quoted in the media the most.

          • barry says:

            No, version 5 lowered the most recent values, as I said in my post.

          • steve case says:

            Barry says: April 30, 2019 at 8:33 AM
            No, version 5 lowered the most recent values, as I said in my post.

            I accept that there are some timelines of data from government sources NOAA, NASA etc. that show the reverse of what I’ve posted concerning GISSTEMP’s LOTI. What I’m pointing out is that I see NASA data in the news. Does (ERSST v5) get media coverage. And for some honesty, it’s easy for me to find the GISSTEMP data i.e., it’s an easy target.

            Of the 1600+ data points published in the LOTI, several hundred are changed every month and those since 1980 are almost exclusively adjusted up. Really, they are.

          • barry says:

            You may be right. I don’t know. But let’s say you are. Have you enquired as to the reasons for the adjustments.

            UAH, as far as I’ve seen, change their historical values nearly every month, when they do an update for the current month’s data. I haven’t checked to see which direction it’s in. But then, i’m no more suspicious of the scientific integrity of Spencer and Christy, who have made their contribution political by testifying at congress, than I am of the other data compilers, many of whom have not.

            But if I were to do so, noting changes is just not enough. I’d have to find out WHY the changes were made. Repeatedly fanning smoke, to me, is too close to being a political operative.

            And, as I’ve said before, ‘skeptics’ have done the hard yards and come up with results that are the same as or even warmer than the ‘official’ results from the institutes. I’m not sure what there is to worry about when the adjustments haven’t made the results warmer, or much warmer, than the sekptic results.

  13. Roy Landberg says:

    Dear Dr Roy Spencer.

    Phd Ned Nikolov and Phd Karl Zeller came up with a theory that the earth gravity force is what runs the temperatur together with the Sun ‘s radiation.

    Can you tell me if you have any opinion on this theory?
    Brg Roy 😊

    • Entropic man says:

      The idea is that as the atmosphere shrinks towards the surface, gravitational potential energy is converted to heat and warms the atmosphere.

      This works for Jupiter, which has a large mass, a thick atmosphere and strong graviy. It shrinks by about 1 metre/year and generates 50 W/m^2.

      It does not work for Earth. The mass is too small, the atmosphere is too thin and the gravity is too weak. To produce the observed temperature increase, a 50km thick atmosphere would have to shrink by several kilometres/year.

      There are two other problems.

      The heat generated by the shrinkage radiates away to space. As soon as the shrinkage stops the temperature cools back to where it started.

      You can only do it once. Once the atmosphere has shrunk there is no way to expand it again.

      • Gordon Lehman says:

        So you think the lapse rate is entirely the result of solar surface warming? Do you believe there is no adiabatic heating of foehn winds?

        As Mr. entropy you should understand that the atmosphere is far from the high entropy heat death you would have from your one and done shrinkage.

    • bdgwx says:

      I call this the Tony Heller theory. He believes that the atmosphere is warming because of PV=nRT. He assumes that T is increasing because PV is increasing. The problem is that the Ideal Gas Law is a diagnostic or state equation. It is not a prognostic equation nor does it say anything about how a system evolves. It just declares how all of the variables in a system have to relate to each other. By saying T is changing in response PV changing he is assuming the atmosphere is undergoing a polytropic process. But it is equally valid to claim that PV is changing because T is changing due to an isochoric process. Entropic Man eluded to the obvious problem already. A polytropic process requires gravitational compression of the atmosphere. Not only would this require an obvious and detectable compression, but you would need to explain how gravity spontaneously increases/decreases for a cyclic process.

      • Stephen P Anderson says:

        BGDWX,
        It is obvious there is a strong correlation between atmospheric pressure and temperature. It just doesn’t appear to account for all the warmth. Thank goodness for molecules with a molecular weight of 18.

        • bobdroege says:

          It’s 48 below in Antarctica and 99 in Death Valley, essentially the same pressure, so no correlation there.

      • Robert Austin says:

        You may call it “the Tony Heller” theory but I am sure that Tony would not agree with you. As I understand it, Tony holds that the earth’s (and Venus’s) atmospheric temperature regimes are largely a function of atmospheric mass, the atmospheric mass dictating the altitude of the characteristic emission layer of greenhouse gases. I have never seen him advance the static “compression heating” idea.

    • Bindidon says:

      Roy Landberg

      Oh Noes! That reminds me the good old ‘Do-ug Cot-ton’ times.

    • Svante says:

      Roy Landberg says:

      “Can you tell me if you have any opinion on this theory?”

      Dr Roy Spencer’s opinion:

      https://tinyurl.com/y4ulyqq5

  14. CO2isLife says:

    Dr. Spencer, once you decide on the proper dataset to use, would you please update this chart showing the IPCC models vs actual observations? It would be great if you updated this periodically.
    https://youtu.be/K_j1NoBRQ6U

  15. Hugo says:

    Dear Dr Spencer,

    Thanks for your great work. I have requested this before, but it would be very valuable with a 95% confidence interval around the point estimates of the trends. Fitting a line using OLS, almost by definition is associated with a confidence interval. Then we can address if these trends really differ. To me they are all in the order of 0.2 degrees/per decade. I wonder if there really is an outlier to discuss.

    Best wishes,
    Hugo

  16. JDHuffman says:

    Denning is attempting to “shoot the messenger”.

    The messenger being the UAH dataset, and the message being “AGW is a hoax”.

    After 40 years, the only thing propping up the hoax is the lingering effects from the last El Niño. When the next La Niña appears, pushing 40+ year anomalies below average, people like Denning will be recognized as the clowns they are.

    • Entropic man says:

      The UAH dataset is showing warming at 0.13C/decade since 1979.

      If AGW is a hoax, where is the warming observed by Dr Spencer coming from?

    • bdgwx says:

      And what is causing the cooling in the stratosphere? The TLT – TLS trend via UAH has increased (as of the March update) to +0.43C/decade.

      • JDHuffman says:

        Natural variation.

        • Entropic man says:

          “Natural variation” is just vague handwaving.

          You know as well as I do that the net effect of all the natural, non-anthropogenic variables is a slow cooling of 0.01C/decade.

          If you want to ascribe Spencer’s 0.13C/decade warmng to natural variation, show me measurements, numbers and an energy budget.

          • A Viterito says:

            There is a high, statistically significant correlation between mid-ocean seismic activity and global temperatures. Here we see high geothermal flux in mid-ocean ridges during seismically active periods and this, in turn, strengthens the thermohaline circulation. A strengthened thermohaline circulation transports more heat into the Arctic, and drives the “Arctic Amplification” that has characterized the post-1998 warming. See the following:

            https://www.omicsonline.org/open-access/have-global-temperatures-reached-a-tipping-point-2573-458X-1000149.pdf

          • bdgwx says:

            A Viterito, kudos to this author for laying his cards on the table.

            “It is reasonable to conclude that this recent gapping down may be a tipping point towards cooler global temperatures. Using HGFA seismic frequencies as the sole predictor of global temperatures going forward, there is a 95% probability that global temperatures in 2019 will decline by 0.47C 0.21 from their 2016 peak. In other words, there is a 95% probability that 2019 temperatures will drop to levels not seen since the mid-1990s.”

            Wow!

            Keep in mind that 2019 is on track to be the 4th warmest year for the instrumental record and it could even be the 3rd or 2nd warmest year. We still have 9 months to go but I don’t even think a Pinatubo like eruption occurring tomorrow would be enough to send the temperature plummeting to mid-1990’s levels. Also peculiar is that oceanic heat content has experienced a dramatic increase in the first 3 months of this year putting 2019 on pace to smash the OHC record set all the way back in 2018.

        • bdgwx says:

          “Natural variation” is not a cause. It is just a classification in which you can categorize a cause. Causes would be things like changes in solar radiation, changes in geothermal activity, volcanic activity, ENSO cycles, etc. The question is which set of physical processes can explain the TLT-TLS trend of +0.43C/decade?

      • An Inquirer says:

        Stratospheric temperatures have been mostly flat over the last 24 years. Before then, there were three noteworthy drops in stratospheric temperatures all directly correlated to low-latitude tremendous volcanic eruptions which sent emissions into the stratosphere. The severity and location of those volcanic eruptions have seldom been experienced in the modern scientific era with capabilities of stratospheric measurements. We have not had one in over 25 years.

  17. Eben says:

    The last non-maladjusted data set standing

    • barry says:

      What does that even mean? Do you think that UAH has not been adjusted? Or do you think the adjustments are more sound than others?

      If the latter, I doubt you could explain why purely on the strengths and weaknesses of the differences in methods. And that is all that matters in an evidence-based discussion. The rest is politics.

      I’ve read a lot on the decisions made on methods for many data sets, and see no reason why Spencer and Christy’s methods are superior (or inferior) to the others. And the only argument I’ve seen otherwise is purely political – in other words: useless.

      • Bill Hunter says:

        I largely agree with you. However, one cannot take the mean of all the equal data sets and claim that’s the most likely value. The fact is we don’t know. More means of judging global mean temperature might create an even wider range of temperatures.

        We also don’t know how much of what we have seen in warming is connected to human emissions.

        Fact is that while there is science about greenhouse gases and there is science about the greenhouse effect, there is no science on greenhouse gas forcing variability all we can say is forcing exists. Variability might be zero, except that if you removed all greenhouse gases then you would remove the forcing. Multiple or more possibilities exist beyond 1) what the modeling club would like us to believe. 2) greenhouse gases may be a necessary condition but not a sufficient condition. and 3) greenhouse gas warming of the surface may be caused by an entirely different greenhouse gas mechanism than advertised. and 4 and up) greenhouse gas forcing might be a combination various mechanisms or something not described above. Energy is an interesting phenomena and we know so little about it. Fact is when you lift the lid off Pandora’s box into theories not tested in science, especially with something so enigmatic as energy, as all you can imagine as possible. . . .all bets are off. . . .there are near zero probabilities of being right. . . .the IPCC is completely full of BS in offering up any numeric probabilities.

        • barry says:

          However, one cannot take the mean of all the equal data sets and claim thats the most likely value

          I did not argue for that, and am surprised you brought it up.

          Variability might be zero

          In temperature data, variability very clearly is not zero.

          greenhouse gas warming of the surface may be caused by an entirely different greenhouse gas mechanism than advertised

          ?

          Fact is when you lift the lid off Pandoras box into theories not tested in science, especially with something so enigmatic as energy, as all you can imagine as possible… all bets are off… there are near zero probabilities of being right

          You and I are communicating through devices which depend upon energy for their construction and operation. Energy which has been estimated for the devices to operate successfully.

          Our success with using energy is extraordinary. Go turn on a light, have a hot shower, drive your car. I have no idea what you are talking about.

          We send probes to orbit different planets. We split atoms and send them racing around Hadron colliders. Don’t confuse not knowing everything with knowing nothing. That’s a common fallacy in the world of (debating) science.

          • Bill Hunter says:

            Barry said: “You and I are communicating through devices which depend upon energy for their construction and operation. Energy which has been estimated for the devices to operate successfully.

            Our success with using energy is extraordinary. Go turn on a light, have a hot shower, drive your car. I have no idea what you are talking about.

            We send probes to orbit different planets. We split atoms and send them racing around Hadron colliders. Don’t confuse not knowing everything with knowing nothing. That’s a common fallacy in the world of (debating) science.”

            Barry you know or should know that all the things you list above are initiated and done by man on a repetitive basis for years and years and developed after careful experimentation that was repeated over and over again. Don’t equate that to something that has never once been shown to occur on demand.

            And on variability being possibly zero that is in direct reference to forcing by greenhouse gases not the planets mean temperature which has fluctuated far greater over its history much of which remains unexplained than it has over the past 150 years of the industrial age not to speak of the fluctations that have occurred in the past 150 years that models fail to duplicate.

          • barry says:

            Bill, the whole space program is full of one-shot wonders that worked first time because our science and understanding of energy was good enough. The AGW investigation has been going on twice as long as the space program. There are – literally – hundreds of thousands of peer-reviewed papers on AGW and related topics stretching back over 170 years. You can’t sweep that under the carpet with some ill-considered rhetoric.

          • Bill Hunter says:

            Barry – “Bill, the whole space program is full of one-shot wonders that worked first time because our science and understanding of energy was good enough.”

            My dad spent his entire career in high performance jet aircraft and the space program. When it comes to use of energy these were not even close to being one shot wonders. They were one shot wonders to those entirely not involved in the programs. In the programs many years transpired from jet to rocket power. I remember my Dad not coming home at night as he searched for the remains of a plane and pilot who didn’t come home. He worked on that for over two decades before man reached the moon. They were experimenting the whole time over and over again in experiments that took minutes to conduct and months to design. Now we have computer models that take months to design and decades to test and after the test we aren’t sure if the model is correct.

        • Nate says:

          “all the things you list above are initiated and done by man on a repetitive basis for years and years and developed after careful experimentation that was repeated over and over again. Don’t equate that to something that has never once been shown to occur on demand.”

          Bill,

          Since the IGY of 1957, there has been a huge international effort to understand Earth, space, oceans, atmosphere, meteorology, climate, oceanography. The development of atmospheric and Earth science and PARTICULARLY how energy is transferred and transformed, could be well described as ‘initiated and done by man on a repetitive basis for years and years and developed after careful experimentation that was repeated over and over again.’

          Theory is constantly tested, proven, or refined with remote sensing, Argo, numerical weather models, space weather prediction, hurricane prediction, Tsunami warnings, ENSO prediction, etc

          “Energy is an interesting phenomena and we know so little about it. Fact is when you lift the lid off Pandora’s box into theories not tested in science, especially with something so enigmatic as energy, as all you can imagine as possible. . . .all bets are off. . . .there are near zero probabilities of being right. ”

          The idea that Energy science and Earth Science are somehow at a junior varsity level of understanding is preposterous.

          • Bill Hunter says:

            Nate: what we have done in the past doesn’t mean we can forego the scientific method for the future. We know an infintessimally small portion of all possible knowledge. We know really nothing about how greenhouse gas forcing comes to be a force that pushes temperature above the mean established by the amount of insolation from the sun. If anybody actually thinks they know that they should publish a paper on it and provide all the evidence necessary to be convincing.

            Its easy to dream up a theory of how things work that are working and if you are a good scientist you can do it without violating a single existing science law simply by making up something unknown to science. Like the the assumption that TOA emissions will reduce with more CO2, that nothing will intervene we don’t know about, and that the forcing gets back to the surface without any documented and tested means of doing so. I realize the theory is plausible because its not an explicit violator of any law of physics but thats could be because any part of the theory that could potentially violate a law simply isn’t stated.

          • Nate says:

            Bill,

            ‘what we have done in the past doesnt mean we can forego the scientific method for the future.’

            There is no evidence in the many papers I see that the scientific method isn’t still alive and well.

            ‘We know really nothing about how greenhouse gas forcing comes to be a force that pushes temperature above the mean established by the amount of insolation from the sun. If anybody actually thinks they know that they should publish a paper ‘

            Replace ‘We’ with ‘I’ and your statement will be accurate.

            The published, direct observational evidence of GHG forcing has been discussed here many times, Bill, you might have missed it. Google it.

            “Like the the assumption that TOA emissions will reduce with more CO2”

            Been directly observed. Google it.

            I wish skeptics would be more skeptical, and investigate their own opinions, before blasting them out as if they are facts.

          • Bill Hunter says:

            Nate: – “The published, direct observational evidence of GHG forcing has been discussed here many times, Bill, you might have missed it. Google it.”

            That sounds like an excuse from somebody who can’t provide the link to the paper.

          • Svante says:

            At the top of this page it says:

            “AIRS has even demonstrated how increasing CO2 in the last 15+ years has reduced the infrared cooling to outer space at the wavelengths impacted by CO2”.

          • Nate says:

            Bill,

            As I said its ‘been discussed here many times’. Its easy to find.

            I see no incentive to do busy work to find science papers for someone who shows so little desire to get informed about science.

          • Bill Hunter says:

            Svante: Yes I saw that and referred to it in one of my comments. The investigation I am engaged in is understanding what kind of elements could affect surface temperatures and in what way.

            very interesting stuff has been coming out with more and more data sources. When validating a surface forcing theory from a non-surface effect one needs a good deal of consistent replication.

          • Bill Hunter says:

            Nate says:
            May 1, 2019 at 7:19 AM
            Bill,

            “As I said its been discussed here many times. Its easy to find.

            I see no incentive to do busy work to find science papers for someone who shows so little desire to get informed about science.”

            Nate, the fact I am here asking questions puts to the lie that I have little desire to be informed.

            Additionally, you are not paying attention to my request. I was not asking for “discussion”. There is plenty of discussion here even and lots of other blogs too. I was asking for a source that establishes as “settled science” the matter of the measured pre-feedback sensitivity of CO2 for surface forcing. Thats a quantification that is “assumed” to be correct. That quantification is “controlling” of feedbacks so its the most crucial number of all. I get that there is an intuitive theory that it exists, but intuitive theories give zero information about the quantity of the actual forcing.

            I have to assume you don’t know. So feel free to ignore my request and kindly shove the insults.

          • Bill Hunter says:

            Nate – Thanks for coming up with some links supportive of what you believe.

            However, while providing a piece of evidence, neither study goes anywhere near what my greatest concerns are. I listed that as greenhouse gases may well be necessary for a greenhouse effect but not sufficient.

            I have also expressed concern over climate models and observations being an efficient way to answer the physics questions about greenhouse gas forcing. Anecdotal observations don’t amount to much and I don’t buy the idea that anecdotal does not include an observation by a scientist. In my work evidence becomes convincing based upon a great number of consistent anecdotal observations that go by without exception.

            But thanks again for the links. I will study these papers more as time allows.

          • Nate says:

            Bill, “We know really nothing about how greenhouse gas forcing comes to be a force that pushes temperature above the mean established by the amount of insolation from the sun.”

            “Like the the assumption that TOA emissions will reduce with more CO2”

            I was responding to these assertions.

            I think you ought to agree, before moving the goal posts, that the papers I posted address these points with direct evidence.

          • bill hunter says:

            Nate: – “I was responding to these assertions”

            And I said it was a piece of evidence. But we don’t know if it was the CO2 that caused it. It could be something like clouds that just did it randomly. Its not like an “on demand” experiment. Climate model predictions are like Nostradamus predictions. When an event occurs somebody points to a Nostradamus prediction.

            Its possible, in fact probable, outgoing OLR fluctuates naturally. How much evidence is needed? Obviously to you not much as the observations in the studies I have now seen are either not robust or not global.

            If you slow emissions at TOA, TOA should move up because of the old TOA not cooling as rapidly by moving emitters from the troposphere into the stratosphere or something like that. We see large naturally expansion of the layers of the atmosphere all caused by a variety of variations including no doubt radiation.

          • Nate says:

            “But we dont know if it was the CO2 that caused it”

            Of course we do, because it was in the CO2 spectral bands.

            ” It could be something like clouds that just did it randomly. Its not like an on demand experiment.”

            Meteorology, Astronomy, Geology, are not ‘on demand’, yet we undeniably understand them very well, because phenomena repeat.

          • Bill Hunter says:

            Nate – Apology for using an unreferenced pronoun. We know that TOA emissions change all the time. The stratosphere takes on sudden cooling and then rewarms. What we don’t know is what affect that changes in the upper atmosphere have on either the lower atmosphere or the surface. It is reasonable to assume some effect. The idea that reduced OLR emissions will cause warming of the surface is a reasonable concept. However, everything we measure like clouds and albedo are not all that accurate and the potential errors there still far exceed anything we have seen that could be attributed to CO2. The signal will remain very weak and uncertain as the surface is supposed to warm and keep it that way. However, continued warming could be occurring from a recovery for the LIA from heat rising out of the oceans as they continue to warm as a response to the end of the LIA. A recent paper even showed that while oceans were generally warming as a LIA recovery, areas of the Pacific warming were still cooling, presumably from thermohaline currents continuing to move wider LIA ocean cooling into zones of the Pacific still warm from the Medieval Warming Period. Ocean currents are believe to take millennia to bring full change to ocean bottoms from natural climate change. If warming is occurring from CO2 we should be seeing an acceleration in warming as emissions have accelerated over the past century by more than an order of magnitude. An acceleration we haven’t seen except in short bursts that gets everybody excited when a major El Nino occurs. I believe that CO2 can raise the mean temperature of the surface, but beyond raising nighttime minimum temperatures a very modest amount that has very little effect on daytime temperatures. Thus I believe that most of the warming we have seen in daytime temperatures are likely natural responses to variations in the ocean and longterm effects that cause such events as the LIA and MWP. From day one climate science has been very much aware of both a correlation to solar activity in long term warming and cooling with the LIA being potentially a natural result to the Maunder Minimum along with probably the Wolf and Sporer Minimums. Add in huge delaying effects from oceans and glacial ice and continued fluctuations in longterm solar activity. |There clearly are multiple players in long term climate and CO2 has not set itself apart from the crowd.

  18. m d mill says:

    I am not an expert in this field,
    but several comments by Dr. Spencer SEEM to indicate that satellite measurements of temperature at the present time rely on the measurements made at previous times;ie, that a kind of historical integration must be performed to determine the present temperature value. Is this true?

    Answer??: satellites using these methods do not provide very reliable absolute temperature values. They can only provide the absolute CHANGE that occurs over their lifetimes with any accuracy. Therefore the end points of these records must be stitched together to provide a long historical record.

    So if RSS (or UAH) makes a correction mistake over a given time period, that will effect all future values calculated. This differs from a good thermometer which will yield an absolute value every time, any time, at a given location. Unfortunately the location and accuracy of these surface thermometers also continually change over time so you get the same problem for absolute averaged global accuracy with thermometers.

    Therefore, best solution, TLT satellite values should be matched(adjusted) to known precise absolute TLT radiosonde values at specific known global locations to provide an averaged GLOBAL satellite record that is absolute and precise.

    • Bindidon says:

      m d mill

      1. “Answer??: satellites using these methods do not provide very reliable absolute temperature values.”

      *
      If they don’t: why then are absolute values available to anybody able to process their climatology data?

      For example, UAH6.0 LT:
      https://www.nsstc.uah.edu/data/msu/v6.0/tlt/tltmonacg_6.0

      The same data of course is available for the other atmospheric layers watched by UAH (MT, TP, LS).

      2. “So if RSS (or UAH) makes a correction mistake over a given time period, that will effect all future values calculated.”

      *
      This has nothing to do with the accuracy let alone with the availability of absolute values.

      It has to do with the anomaly principle, where departures are computed out of absolute data and the mean over a given period.

      If the period’s absolute values must be reobserved then of course the entire anomaly set must be recomputed because the period’s mean has been changed.

      3. “Therefore, best solution, TLT satellite values should be matched(adjusted) to known precise absolute TLT radiosonde values at specific known global locations to provide an averaged GLOBAL satellite record that is absolute and precise.”

      *
      Answer: why do people repeatedly feel the need to reinvent the wheel?

      https://journals.ametsoc.org/doi/full/10.1175/JTECH1937.1

      • m d mill says:

        I am just an amateur thinking aloud here, and not trying to be clever (reinventing the wheel)…I assume the “best solution” is, in fact, the way it is actually done. However in the paper you reference the satellite results are used to correct the radiosonde discontinuities (the opposite of what I was saying), so your comment makes no sense anyway. [Incidentally the error cased by these radiosonde discontinuities is only .02C/decade anyway, per Christy]

        Further I think you are simply wrong. By “absolute data” I mean absolutely correct values of temperature, NOT anomalies.
        Most global climate data are anomalies exactly because absolute vales are so hard to determine with great accuracy.

        The process of deriving temperature data from microwave measurements from a satellite is quite an indirect method, requiring much post processing of data, if i understand correctly (I am NOT saying it is a bad method). As Christy says in the above paper:
        ” These spacecraft have been launched roughly every two or three years and usually have a multi-year overlap with previously-launched, on-orbit spacecraft so that intersatellite biases may be calculated and removed, producing a single time series.” …ie this is the “stitching” required. But radiosondes use a much more direct thermometering instrument, which should be much easier to calibrate “absolutely”.

        Therefore the satellite data provides very accurate GLOBAL relative variations of temperature (anomalies), which must be calibrated by radiosondes to yield absolutely correct temperature values; which is why the radiosonde data interpretation is so important ultimately. In short, I stand by my statements and your 3 rebuttals seem insensible.

  19. Chris Hanley says:

    “UAH is a ridiculous outlier. Their calculations do not agree with the vast bulk of data from real thermometers, towers, aircraft, balloons, and satellites. They have repeatedly been forced to apologize for their errors, and will again and again in the future. DON’T BE CONNED!”.
    Another alarmist claiming psychic powers, it apparently goes with the territory.
    To a lay observer the real outlier is the model average troposphere trend over the tropics, the supposed ‘fingerprint’ of enhanced greenhouse warming.
    http://www.drroyspencer.com/wp-content/uploads/TLT_Trpcs_Model_trends.png
    It’s the Russian model INM-CM4 that closest approximates the observations because it does not assume the theoretic water vapour enhancement, as I understand it.

    • Bindidon says:

      Why do you rely on a five years old chart, above all restricted to the Tropics?

      Go to the KMNM Climate explorer, Chris Hanley, and do the comparison using today’s data by your own!

      • Chris Hanley says:

        I’m not ‘relying’ on a five-year-old chart, it simply illustrates the over-estimation of assumed feedbacks in the system, a failure that persists today.
        As I said and is well known, according to the models it is at the 12 – 9 km levels over the tropics where the supposed enhanced greenhouse warming is supposed to be most apparent.
        http://climate4you.com/images/TempChangeWithAltitudeForCO2doubling.jpg

      • barry says:

        “To a lay observer the real outlier is the model average troposphere trend over the tropics, the supposed ‘fingerprint’ of enhanced greenhouse warming.”

        You’ve been misinformed. Enhanced warming in the tropical troposhpere is not a ‘fingerprint’ of greenhouse warming. It’s a result (supposedly) of surface warming regardless of cause, whether solar, volcanic or whatever.

        The ‘fingerprints’ that differentiate greenhouse warming from, say, solar are:

        * Cooling lower stratosphere over long term
        * Winters warming more than Summers over long term
        * Night warming more than days over long term

        As for the enhanced tropical warming, results vary depending on methodology and source data, but even if it hasn’t happened, that suggests that understanding of how heat is transported through the atmosphere is incorrect – it’s not specifically a greenhouse issue.

        • Chris Hanley says:

          Barry, you have misquoted what I wrote.
          I did not say it was a ‘fingerprint’ of greenhouse warming but enhanced greenhouse warming.
          The issue is the degree of positive water vapour feedback whatever the cause of the initial warming.
          The models, with the exception of the Russian INM-CM4 (as I understand it), apparently assume far too much positive feedback in the climate system.

        • barry says:

          You’re still mixing your terms up. You wrote:

          “To a lay observer the real outlier is the model average troposphere trend over the tropics, the supposed ‘fingerprint’ of enhanced greenhouse warming.”

          and

          “As I said and is well known, according to the models it is at the 12 – 9 km levels over the tropics where the supposed enhanced greenhouse warming is supposed to be most apparent.”

          The models show enhanced warming at the tropics from any source, solar. It is not a ‘fingerprint’ of greenhouse warming, and it is not a ‘fingerprint’ of enhanced greenhouse warming. It’s not a fingerprint (a clue as to cause) of anything.

          There is a long history of ‘skeptics’ trying to tie the modelled enhanced warming of the tropical mid-troposphere (the ‘hotspot’) to a purely greenhouse warming scenario, where the enhanced heating can only come about through greenhouse warming.

          So let’s see if we can clear this up.

          Are you saying that you agree the majority of recent warming is from greenhouse gases? And that is why you call the predicted tropical mid-tropospheric warming ‘enhanced greenhouse warming’?

          In the same way that if the recent warming at the surface was definitely due to solar, you would instead call the enhanced warming of the tropical mid-troposphere ‘enhanced solar warming’?

          Because that’s the only way I can see that you are using these terms even semi correctly.

          But the correct way to say it is that we are not seeing enhanced warming in the tropical mid troposphere, which calls into question models of heat transport within the atmosphere.

          It has much less impact on climate sensitivity estimates, because the water vapour feedback is not dependent on the tropical mid troposphere, but on the global concentration of water vapour.

          To go further (and repeat) whether enhanced warming is seen in the tropical mid troposphere is still an open question, as observation of this region is not well constrained, and results are varied.

          But my issue is with you tying enhanced warming in the tropical mid troposphere to greenhouse warming IN ANY WAY. It is in no way specific to greenhouse warming, and it is not a ‘fingerprint’ of that, or of enhanced greenhouse warming.

          Curious if you agree that the majority of recent warming (since 1950) is greenhouse based. If you don’t agree, your original comments are seriously wrong.

          • Chris Hanley says:

            My original point was that compared to observation series differences the models are the ridiculous outliers and the CMIP5 models are all about enhanced greenhouse warming and only enhanced greenhouse warming.
            You have ignored that point but determined to find fault you gratuitously, anonymously and at length have decided to criticise ‘a straw man’ something you imagined I wrote, but didn’t. Well done.

          • barry says:

            The tropical troposphere ‘hotspot’ that is supposedly missing is not a product of greenhouse warming. Stop misinforming with that verbiage and we can check out your point.

            The same hotspot should be there if the factor driving the change in surface temps is increasing solar intensity, or reduce volcanic activity. The hotspot has nothing to do with ‘greenhouse’ warming, it is about where the moist adibiat transports surface warmth aloft when the surface warms.

            Your terminology muddies the issue. It suggests to me that your view is unclear. Obviously you wish to impugn models – that’s fine. But you’re doing it incoherently.

          • Chris Hanley says:

            Let me clear up some apparent misunderstanding: The models predict enhanced warming in the upper atmosphere at 12 -9 km over the tropics where the temperature is supposed to increase at a rate of two to three times faster than at the surface, that is what I meant by “enhanced greenhouse warming” (not enhanced greenhouse effect), and after years of radiosonde and satellite observations there is no direct evidence of increasing water vapor enhancing the small warming effect from increasing CO2. The End.

          • barry says:

            “there is no direct evidence of increasing water vapor enhancing the small warming effect from increasing CO2.”

            Tacit in this statement is that the ‘small’ observed warming is a result of CO2, according to you. Good. I asked you about that, but you did not answer directly, so I’m left inferring from what you write.

            There is no direct evidence of water vapour enhancing the warming occurring at the surface, which is caused by, as you state, CO2 increase in the atmos.

            There is also no direct evidence that this is not happening. The data sources and processing methods produce uncertain and contradictory results. This part of the biosphere is difficult to monitor.

            I recommend acquainting yourself on the literature, so as to avoid having a myopic view of the subject.

            https://agwobserver.wordpress.com/2009/09/06/papers-on-tropical-troposphere-hotspot/

            Would you kindly answer a question?

            Why did you not promptly agree that enhanced tropical troposphere warming is not only a greenhouse signature?

            It was the point I originally made, and you could have cleared that up in a sentence.

            Did you not promptly agree because you actually disagree? I’m still unclear on your view on my very specific point. Please address it directly.

  20. Hugo says:

    I calculated the 95% confidence interval for the trend in UAH LT (jan 2003 to dec 2017) and it is 0.116-0.236, i.e. in agreement with the other data sets. There is no outlier.

    • m d mill says:

      I disagree…
      The “most likely value” is NOT in agreement with all the other data sets. It is not correct to argue the data sets are “in agreement”. There is perhaps a small chance they are “in agreement” (using your 95% interval).

    • barry says:

      The best fit to data is not the “most likely” correct trend. That’s overinterpreting the results. If the confidence intervals between any two linear trends overlap, then one cannot say that there is a statistically significant difference in trend. If the CIs do NOT overlap, then we can say that there is a statistically distinct difference.

      Linear regression are useful tools, but it is important to acknowledge their limits. They don’t tell us the most likely trend, but they can give an idea of the likely trend range for the data to hand.

      “There is perhaps a small chance they are “in agreement” (using your 95% interval).”

      The Confidence Intervals overlap for any time frame with these data. Depending on the time frame, they overlap more or less, but this means that the linear regression estimates are statistically indistinct.

      I’ll go with the choice of the first comment in this subthread, though it doesn’t matter which time frame you use, as long as you use the same time frame for your data sets.

      Jan 2003 – Dec 2017

      RSS: 0.204 (+/- 0.248) C/decade
      UAH: 0.177 (+/- 0.244) C/decade

      These results are pretty close, and are definitely statistically indistinct. There is huge overlap, and both CI results overlap with the mean estimate of the other data set as well. Note also how similar the CIs are. The data sets have very similar variance.

      Let’s do the longest annual result:

      Jan 1979 – Dec 2018

      RSS: 0.199 (+/- 0.058) C/decade
      UAH: 0.127 (+/- 0.057) C/decade

      There is a greater difference in the mean estimates, and the CIs don’t overlap the mean estimates, but these results are still statistically indistinct – to 95% CIs. Note again how similar the variance is. The difference between the two depends little on the scale of the ups and the downs, and much more on choices in how to stitch together different sources (different satellites), and how to handle the different biases for each of the sources and calibration between them. This – and not the personalities of the compilers – is the nub of the issue of differences. And this is where critics of each need to go and explain clearly to demonstrate anything useful about the subject.

      • Nate says:

        Barry,

        I subtracted UAH from RSS data. Because they vary in sync.

        I get a curve with slope 0.074 C/decade, with, if I did it right, a very small error of 0.0023.

        Curious what you get?

        Seems to suggest their difference is significant.

      • barry says:

        Let’s see if I have this…. You’ve subtracted the anomalies and the resulting slope from a linear regression of that result is statistically significant.

        Are you arguing that this indicates that the linear regression of each data set is statistically distinct from the other?

        I’m not surprised you get a slope with a very low CI. Whatever you mean by ‘vary in sync’, the data are highly correlated month to month, and subtracting would remove a lot of that variability. Could you post a chart of the resulting slope? I’d expect to see a closer approximation of a straight line with the anomalies than the source data.

        I could probably replicate what you’ve done, but I’d have to figure some stuff out in Excel, and I’d have trouble interpreting the CI.

        • m d mill says:

          I meant(and should have said) the CI is an arbitrary choice and 95% is not particularly useful, as 99% or 99.9% would not be. In those cases you are “very sure” of a comparison that is not particularly useful in choosing a preferred method of satellite sensing.
          Use a CI of 70% or 66% over the 1979-2018 period, and there is a definite distinction.

        • barry says:

          95% is standard for this kind of variability and time frames. Do you have a better argument for why you should apply a completely non-standard CI?

          In what fields are 66% and 70% CIs used, by the way?

          • m d mill says:

            The fields utilizing common sense…95% is an arbitrary selection….why not 99%
            If your chance of getting cancer was 30%, but another persons was 70%, would you consider that a significant distinction?

            Therefore, given your numbers:

            Jan 1979 – Dec 2018

            RSS: 0.199 (+/- 0.058[95%]) C/decade
            UAH: 0.127 (+/- 0.057[95%]) C/decade

            The chance of the true value being less than 0.163 (half way between)would be much greater for the UAH case than the RSS case.
            I won’t work out the exact probabilities, maybe you will, but the 2 cases are certainly very distinct…which was my original objection.

          • barry says:

            I don’t trust that you know what you’re talking about.

            “The fields using common sense.” An incredibly obvious non answer. You’ve just pretended that you know something about this when you don’t.

            “I wont work out the exact probabilities”

            You CAN’T work out the ‘exact probabilities’.

            You’re just announcing that these CIs are better, and are stuck treading water when I ask you to explain why they are better. No, cancer risk is a piss-poor analogy: 30% risk is significant as is 70%. But we are assessing the chance that linear trends are random, and your CIs would exclude much of the data. 30% of the data would be outliers (instead of 5%) with your choice. Your constraint is less effective at accounting for the data when trying to disprove the null.

          • m d mill says:

            I am assuming a near gaussian prob. profile, which is certainly not unreasonable.

            Then repeat:
            Therefore, given your numbers:

            Jan 1979 – Dec 2018

            RSS: 0.199 (+/- 0.058[95%]) C/decade
            UAH: 0.127 (+/- 0.057[95%]) C/decade

            The chance of the true value being less than 0.163 (half way between)would be much greater for the UAH case than the RSS case.
            I wont work out the exact probabilities[its not worth my time], maybe you will, but the 2 cases are certainly very distinctwhich was my original objection.

          • barry says:

            “I am assuming a near gaussian prob. profile”

            Gaussian distribution typically applies the 95% confidence interval.

            https://en.wikipedia.org/wiki/Normal_distribution

            Specifically:

            https://en.wikipedia.org/wiki/Normal_distribution#Confidence_intervals

            You have picked up some words from the internet and are trying to pass yourself off as some kind of aficionado of statics.

            Just stop. You are embarrassing yourself.

            For the interested, here’s a brief recap of m d mill (empty mill?).

            You have restated your original objection but not expanded on it. Still an assertion with no foundation – no scientific field regularly uses confidence intervals that you describe. I checked.

            “Common sense” is not a scientific argument.

            Probabilities of getting cancer is not a statistical argument for confidence intervals regarding linear trend analysis. Chalk/cheese.

            “I am assuming a near gaussian prob. profile” is meaningless without further elucidation, which has become quite clear is beyond you.

            That you have asked me twice to do your work for you is ample corroboration.

            You are bullshitting. And you are embarrassing yourself.

            You are essentially arguing that if you ignore 30% of the data, then the linear trends under discussion a statistically distinct.

            I’m happy to say goodbye here and let lurkers make up their own minds.

          • m d mill says:

            I have shown how the two different cases are distinct, and robustly so. You have not shown the error or inappropriateness of this determination, except that you do not accept it by some other formal definition. [You HAVE shown yourself to be arrogantly snotty in you responses, but that’s just you, and is accepted as such.]

            To repeat (because it is valid)
            I am assuming a near gaussian prob. profile, which is certainly not unreasonable.

            Therefore, given your numbers:

            Jan 1979 Dec 2018

            RSS: 0.199 (+/- 0.058[95%]) C/decade
            UAH: 0.127 (+/- 0.057[95%]) C/decade

            The chance of the true value being less than 0.163 (half way between)would be MUCH greater for the UAH case than the RSS case.
            I won’t work out the exact probabilities[its not worth my time], but the 2 cases are certainly quite distinct, which was my original objection.

            These are all correct and valid statements.
            You cannot disprove them, and so obfuscate with other formal definitions to hide that fact.

        • Nate says:

          Barry,

          I did it in excel, and dont know how to post it.

          It looks like an S shape, with most difference appearing in second half.

          Yes, the data are highly correlated, so the result has less variability.

          • barry says:

            My computer has a ‘snipping tool’. I use it to capture an image, then upload that image to this website, where I get a link to post here:

            https://imgur.com/

            If you can capture the image on your screen, that link is a good website to post the resulting image and link it for others.

      • Nate says:

        “Are you arguing that this indicates that the linear regression of each data set is statistically distinct from the other?”

        Not sure.

        They seem to have stat sig difference.

        • barry says:

          At the 95% confidence interval, the difference in trends is not statistically significant. As I explained above, the result you got is not determining whether the difference in linear trends is statistically significant. It only shows that the linear trend arising from the subtracted anomalies is itself statistically significant.

          I’m guessing that the S curve is very shallow. Otherwise the CI result would be much higher than you stated.

  21. Aaron S says:

    Anyone who doesnt see the political bias in climate research is biased themselves. Even RSS is at the very bottom of predicted warming from climate models and still no major adjustment to IPCC models or the climate sensitivity to GHG. What more empirical evidence does one need that the science is biased? If it was quantitative then the field would take the satellite and thermometer data and use the spread to calculate a p50 base case model with uncertainty. Then symetically calculate the p 10 and p90 predictions from the empirical p50. That would be a valid method and would likely include global cooling scenarios or a very minimal warming earth extreme scenario. Its math and not nearly as complex as the climate models or temperature data sets themselves. So why not do it? I can only answer because bias.

    • bdgwx says:

      The CMIP5 suite of models certainly aren’t perfect, but they aren’t that bad either. One thing you have to be careful about is looking closely at which subset of data the observation vs modeled plots are comparing. For example, Christy’s plots often compare TMT from 20S to 20N to RCP8.5. It is illustration of the well known mid troposphere tropical hotspot problem. I have no problem with this selectively of comparison. But in the interest of avoiding selection bias we should also equally consider the other 35 combination of low, mid, high latitude vs TLT, TMT, TTP, TLS vs RCP4.5, RCP6.0, RCP8.5. Comparisons of the modeled vs actual global 2m T mean are actually pretty decent IMHO. But, there are other problems. For example, Arctic sea ice decline projections have proven to be an even bigger problem than the mid troposphere tropical hotspot. It’s good to be open about these problems so that scientists can work together to make NWP modeling better.

      • Aaron S says:

        Bdgwx,

        Thanks for the thoughtful reply. Where I am coming from is that even the RSS V4.0 MSU/AMSU atmosperhic temperature dataset is at something like >85% cool range of output from CMIP-5 climate simulations and getting farther from the mean since the 1998 el nino ended. Except for peak warming associated with major El Nino events (that somehow seem to slip by peer review as evidence for viable models during these brief times), the data from satellites appears considerably less warm than the model predictions. I have a history researching and publishing paleoclimate and now work a job where quantitative modeling is a big part of the workflow,and I can not understand why the models are not totally redone with lower climate sensitivity. So when you say the CMIP-5 models “arent that bad either” I am curious what you mean? In my world if empirical data was >1 standard deviation from the predicted mean over long term trend, then you would really adjust the model. The RSS and UAH both appear more that 2 SD away from the mean over almost 20 years.

        Cheers, Aaron

        http://www.remss.com/research/climate/

        • bdgwx says:

          It’s a fair critique for sure. There’s still clearly a lot more opportunity for improvement especially for the tropospheric temperature response. I know one problem that has been identified was that volcanism increased and solar irradiance decreased in the last 2 decades. Incorrect inputs lead to incorrect outputs. But, when the inputs are fixed the picture gets much better. The uncertainty of inputs is clearly a significant component of the problem. But, I concede that parameterization schemes and modeling physics are likely to be an even bigger problem.

          http://www.realclimate.org/index.php/archives/2015/06/noaa-temperature-record-updates-and-the-hiatus/

          • Aaron S says:

            So the real climate link you provide calls thermometer global temperature a “product” and disscussses the Karl et all pause buster paper. So if science must keep updating the empirical data then I am sure we can agree that it is important to reduce bias in the process. This is the problem for me. I believe parts of society dont trust the people updating the data, then why would they accept the reality of GHG causing global warming? This is why credibility is so critical. Here is a thought experiment. Can you list 3 ways the data for global climate has been corrected to reduce man made forcing via green house gas (or increase natural climate change). It seems there should be a balance in an unbiased method to construct a global temperature product. Some points support adjusting climate sensitivity to mans ghg up and some down.

            Changes that increase man made global warming.
            1. Boat motor correction to old ocean measurements in motor room. Made warming last century more significant.
            2. Sunspot number correction in 2015 increased solar activity prior to 1950 to reduce the significance of the max 1950 to 2000 compared to entire data set. Reduced the role of the sun in climate change.
            https://skepticalscience.com/corrected-sunspote-history-cc-not-due-to-sun.html

            3. Karl et al. Paper adjust away the hiatus in commonly cited data set.
            4. Not reconsiling the models as Schmidt et al, 2014 suggested from the real climate arricle you provided. https://www.nature.com/articles/ngeo2105
            5. RSS diurnal correction using the models

            Adjustments down.
            1. UAH adjustment for diurnal changes.

            The Schmidt Nature paper you procvided is from 2014 and 5 years old and still not even those updates have been made. Yet the research body did update sunspot number in 2015 to reduce its ability to force climate.

            https://skepticalscience.com/corrected-sunspote-history-cc-not-due-to-sun.html

            In an unbiased sytem one could provide equivalent random decisions that favor reducing climate sensitivity. I know it is somewhat anecdotal as presented but I can name many adjustments through time to keep the climate alarm bells ringing, but sincerely struggle to list any other examples that reduce climate sensitivity to ghg. Perhaps you can help balance the scales with examples? Or explain what happened to the Schmidt nature paper in the real climate article you shared? I can not support a case against systemic bias and I have sincerely tried. Maybe you can help me.

          • Aaron S says:

            Let me keep it more simple. Why do you think the CIMP models have not adjusted like the Schmidt et al 2014 paper suggested?
            If I really give the benefit to climate science then I can say CIMP6 will drop climate sensitivity considerablely, but the reports I have scanned dont seem to be indicating that outcome.

            https://www.nature.com/articles/ngeo2105.

            There comentary at the end of the paper is interesting explanation, but I dont buy that 20 yrs is to short to judge a model.

          • bdgwx says:

            I happen to share your concern. I personally think there is compelling evidence to think that the 2xCO2 ECR will be < 3C.

            The chatter I've been hearing from CMIP6 is that the warming trends are even higher than CMIP5. We'll see how that pans out, but that's going to be a concern of mine as well.

            I will say the lower bound on the IPCC range of 1.5C ins't out of line, but it might be a bit too low. We've already warmed by about 1.0C and we are only ln(410/280) / ln(560/280) = 55% of the way there for the TCR. And we know ECR is a bit higher than TCR. From observational evidence you could argue for a TCR of 1.0C / (1 – 0.55) = 2.2C. And using a conservative ECR multiplier of 1.1x brings us to about 2.4C.

            In other words, if the IPCC's lower end of 1.5C is to be realized then that 0.6 W/m^2 imbalance on the energy budget (~10e21 joules/year going into the ocean) needs to start waning really fast otherwise we're likely to continue past 1.5C.

            What are you thoughts on the climate sensitivity?

    • bobdroege says:

      There is a site that has a trend calculator that will do that for you.

      So it has been done so you can rule out bias.

      It’s not one of the Skeptical Science sites.

      • Bindidon says:

        bobdroege

        Your arre right! There are even two of them.

        The one is the trend computer implemented by Dr Kevin Cowtan:
        http://www.ysbl.york.ac.uk/~cowtan/applets/trend/trend.html

        And the other one was implemented by Dr Nick Stokes:
        https://moyhu.blogspot.com/p/temperature-trend-viewer.html

        • JDHuffman says:

          Bindidon believes Cowtan and Stokes are not biased.

          THAT is funny!

          • Bindidon says:

            JDHuffman

            “Bindidon believes Cowtan and Stokes are not biased.
            THAT is funny!”

            As usual, Huffman: only weird polemics behind your fake name, instead of a proof.

            Why do you never give a scientific proof concerning your attacks against scientific people, Huffman?

            Simply because you are UNABLE to do.

          • JDHuffman says:

            Bindidon, why are you never able to understand?

            “So it has been done so you can rule out bias.”

            Maybe it is due to the language barrier.

        • barry says:

          These are standard linear regression packages, with standard autocorrelation models. There’s no bias possible because its pure, standard maths. And each site has multiple links to various data including UAH. No bias from the publishers, because you can pick your own data set, even the ‘skeptics’ favourite.

          Why are ‘AGW skeptics’ so irretrievably ignorant? Whatever the answer, they forever mislead because of it, if they’re not doing deliberately misleading. Which after years of observing them at it, is hard to conclude otherwise.

          • JDHuffman says:

            barry, just because someone does not agree with you does not make them ignorant.

            “Aware” might be a better description.

          • barry says:

            This isn’t a matter of opinion. You’re simply wrong. You can’t ‘bias’ the results at these linear regression web pages any more than you can bias a calculator. You shoot your mouth off in utter ignorance, simply contradicting because you feel some need to do it. And because you do so in ignorance, you muddy and mislead, whether that is your intent or not.

            And when you are called on a specific instance of wrongness, you often, as you do here, make a general retort, as if the discrepancy is a matter of personal opinion instead of you being demonstrably wrong, because you have no idea about the topic. You just contradict, whether or not you know what you are talking about. You are a form of intellectual pollution on this board. Or, more commonly, a troll.

          • JDHuffman says:

            barry, what you are missing is that that is just all your opinion. You despise all opinions except your own. You are closed minded, and un-scienctific. That’s why you and your ilk prefer censorship of opposing views.

            Nothing new.

          • barry says:

            You avoided the point of discussion again. No one is fooled by your distractions.

            Explain – precisely – how these linear regression packages at the web pages mentioned could possibly be biased.

            (Failure to do so is automatic capitulation because… then we know you have absolutely no idea what you are talking about, and are changing the subject because of that)

      • Aaron S says:

        Great links thanks for sharing Bindidon. But how about Had crut 1, 2,3,and all the ones before that when the big ocean boat motor adjustments were made. . Then there is Sunspot data, tide data, satellite sea level data all that get modified to support AGW. Indirectly isotope data, paleo CO2 estimates, remember when CO2 starvation in the late Miocene explained the global expansion of grasslands. Or when NASA had a big section on solar forcing of climate as an alternative hypothesis. Even the minority supporters that the dinosaurs went extinct gradually get a boost for their alignment that ghg caused the extinction. There are so many examples.. to be fair there are many counter papers, but they never get the impact factor of the agw machine that grew out of the funding of academics or the media coverage. So i dont see the links swinging the saying anything about bias I am talking about.

        • barry says:

          The single biggest adjustment – SST adjustment for the early 20th century – lowered the long term trend by a substantial amount.

          Raw global data would have a slightly higher long term trend than the adjusted.

          Care to explain that?

    • barry says:

      “Anyone who doesnt see the political bias in climate research is biased themselves. Even RSS is at the very bottom of predicted warming from climate models and still no major adjustment to IPCC models or the climate sensitivity to GHG. What more empirical evidence does one need that the science is biased?”

      The output of GCMs is based on modelling the whole climate system, and how the components interact with each other as the whole system changes. You would replace that with a prediction based on historical values of one very thin slice of that whole system, as if nothing else could possibly change the trajectory of that thin slice.

      (Honest) ‘skeptics’ and the mainstream would rightly deride that effort on a range of reasons. For one, the ‘skeptics’ would tell the modellers that they cannot possibly account for a sun that is about to go into minimum, so the results will be warmer than they should. The others would point out that one cannot predict the future from past behaviour if there are more factors influencing the outcome than covered by the factors being modelled. Essentially the same argument as the ‘skeptics’, but less agenda-driven.

      • Aaron S says:

        No a valid unbiased model would be corrected if it deviated from observations. Not vice versa.

      • barry says:

        Observations are changed with the deliberate intent of matching models? That is what you’re saying here.

        Prove this intent you mean. Prove it beyond any reasonable doubt.

        A fundamental requirement of your proof is to show that the peer-reviewed explanations for changes to data are invalid. You have to do dome science along with the conspiracy theories or all you have is conspiracy theories. Geddit?

      • barry says:

        GCM modellers do not, as a rule, use observed temperature in their models. The models are based on physics. If they changed the results to match observations, the skeptic community would (rightly) deride them for making the fit look better by putting the conclusion inside the model, instead of just basing the model on physics and letting it run.

        (Observed temp data is used in some models to run tests of components, but not in predictive GCMs)

        One would think that if the climate research community was corrupt they would simply airbrush away any potential or apparent discrepancies. If they are hell-bent on selling a narrative, why are they making it difficult for themselves? No, the various uncertainties and discrepancies rather demonstrate that some grand conspiracy is not happening.

  22. Bindidon says:

    I see one more time this nice sentence:

    “The last non-maladjusted data set standing”

    I don’t know what the ignorant guy would have written after Roy Spencer’s switch to UAH5.6 in July 2011…

    Ha ha ha ha.

  23. PhilJ says:

    bdgwx,

    “The question is which set of physical processes can explain the TLT-TLS trend of +0.43C/decade?”

    Here’s one hypothesis that would seem to explain that..

    http://ozonedepletiontheory.info/primary-cause-of-warming.html

    • Entropic man says:

      PhilJ

      Lots of information about frequencies, but nothing that would allow me to calculate the wattages involved. Since anything global warming related always comes downto an energy budget, I need energy informationto judge thevalidity of this idea. Any other links which might help?

      • PhilJ says:

        you want some numbers? ok try here:

        https://agupubs.onlinelibrary.wiley.com/doi/full/10.1029/2009JD012219

        “Zonal average ultraviolet irradiance (flux ultraviolet, FUV) reaching the Earth’s surface has significantly increased since 1979 at all latitudes except the equatorial zone. Changes are estimated in zonal average FUV caused by ozone and cloud plus aerosol reflectivity using an approach based on Beer’s law for monochromatic and action spectrum weighted irradiances….”

    • bdgwx says:

      Yep. It’s a sound hypothesis. And I believe the basic principal is well accepted. But the devil is in the details. It turns out that the magnitude of the net effect via all of the interactions in various shortwave and longwave channels is pretty small in terms of W/m^2 and the heating (surface) and cooling (stratosphere) capacity. The net effect of ozone changes (both tropospheric and stratospheric) is for about +0.3 W/m^2 radiative force.

      Here is one such attempt to quantify the magnitude in the ultraviolet bands

      https://agupubs.onlinelibrary.wiley.com/doi/full/10.1029/2009JD012219

      The IPCC actually uses a higher estimate of the net effect because they consider longwave radiation effects as well. O3 is also greenhouse gas afterall and it is increasing the troposphere.

  24. barry says:

    John Christy: “Both datasets are pretty good and I’ve advocated using the average of the two for a way to decrease the random error contained in both datasets and to reduce the effect of any unforeseen biases we each may have inflicted upon our datasets…”

    https://wattsupwiththat.com/2018/10/16/the-new-rss-tlt-data-is-unbelievable-or-would-that-be-better-said-not-believable-a-quick-introduction/#comment-2494185

  25. How about we trust NONE of the statistics.

    There is no such thing as a global temperature.

    It is not a temperature that can be measured.

    It is meaningless in physics, and makes no sense for a planet not in thermodynamic equilibrium.

    No one lives in the average temperature.

    Why would anyone care, if not brainwashed to believe that one number is very important ?

    The average temperature has no relationship to local weather,
    which depends on temperature differentials.

    The average temperature does not represent the climate of our planet with one number, that could be calculated in hundreds of different ways.

    There is no way to falsify any of the compilations.

    We might judge the integrity of the people compiling the statistic — Spencer and Christy win that by a landslide.

    There is no way to calculate, or estimate, a “normal” average temperature.

    But the average temperature is very good for one thing — climate change propaganda !

    • barry says:

      “There is no such thing as a global temperature.

      It is not a temperature that can be measured.

      It is meaningless in physics, and makes no sense for a planet not in thermodynamic equilibrium.”

      What a load of ripe tosh. Physics constantly works with averaged temperatures. Astrophysicists have no trouble determining the effective temperatures of other planets and stars. And physics certainly does assess non-equilibrium states, their thermal trajectories and rates of change. Much of our everyday machines have been constructed with tolerances estimated from just these sorts of analyses, and our success in space demonstrates our ability to anticipate a range of different, changing and exotic (non-terrestrial) thermal situations assessed and correctly predicted via….. physics.

      • JDHuffman says:

        What a load of ripe tosh.

        Physics constantly works with averaged temperatures.

        Red herring.

        Astrophysicists have no trouble determining the effective temperatures of other planets and stars.

        “Effective temperature” is a calculation. It may, or may not, have any connection to reality.

        And physics certainly does assess non-equilibrium states, their thermal trajectories and rates of change. Much of our everyday machines have been constructed with tolerances estimated from just these sorts of analyses, and our success in space demonstrates our ability to anticipate a range of different, changing and exotic (non-terrestrial) thermal situations assessed and correctly predicted via.. physics.

        Straw men. “Climate science” denies the relevant physics, as do you, barry.

      • Barry:
        Please take a class ion physics, and one on thermodynamics, and then come back here and try to refute anything I wrote in my comment.

        There is no science in your words: “What a load of ripe tosh”

        I don’t even know what a “tosh” is !

        I expanded my comment into a full article on my climate science blog today:
        https://elonionbloggle.blogspot.com/2019/04/is-there-really-global-average.html
        .
        .
        .
        In addition, I would like to thank the owner of this blog for not deleting my comment saying that the global average temperature is not a useful statistic, considering that he provides one of the compilations !

        I expected no censorship here, but was not sure.

        My comments on global warming alarmist blogs and websites get deleted within 24 hours,
        sometimes within one hour.

        • barry says:

          Perhaps because your comments are tosh.

          There is no macro scale entity that has a perfectly uniform temperature.

          When in thermodynamics a temperature for any macro scale entity is derived or given, it is always an average, or an idealised value.

          The temperature of our sun is an averaged result.

          The temperature of a car’s engine, and the calculations that go into designing a radiator for it, are based on averaged values.

          This is normal thermodynamics. The reality is that temperature fluctuates throughout a body constantly. But only in very specific branches of thermodynamics is this taken into account. for all else, the average kinetic energy of the particles in a system or one of its components is what is used.

          I have no idea where your strange views come from, but not from general physics. Looks like you are trying to generalise from some highly specific subtopic.

          • Barry Barry Barryyyyyyyyyyy
            If you feel that an average of local temperatures is an actual temperature itself, rather than a statistic, that could be calculated in hundreds of different ways, but would difficult, or impossible, to falsify, then we are NOT going to be able to have a discussion.

            I suggest you read the 28-pge paper, titled: “Does a Global temperature Exist”, from 2007, originally published in the Journal of Non-Equilibrium Thermodynamics, Volume 32, Issue 1, Pages 127, ISSN (Print) 0340-0204, and currently available online as a pdf, here:

            https://pdfs.semanticscholar.org/ffb0/72fc01d2f2ae906e4bb31c3b3a5361ca3e18.pdf

            or here:

            https://pdfs.semanticscholar.org/ffb0/72fc01d2f2ae906e4bb31c3b3a5361ca3e18.pdf?_ga=2.10374069.1862311576.1556482610-266146719.1556482610

            You may try to contact the authors and argue with them, Mr. Tosh !

          • barry says:

            You have no idea, do you? No, 28 pages of tosh is still tosh. Averaged temperatures are one of the building blocks of physics.

          • barry says:

            I couldn’t get through the paper. I admit it. Once I realized the implications of their argument there was no need. Engineers can give up. Because any time they design or build something with a certain heat tolerance, Essex et al have demonstrated that there is no such thing as an average temperature – not just for global temperature, but for any object you can think of. The internal heat of the human body is 37C, but the skin is around 32C and it is different in different parts of the body. So doctors have to give up, because this local difference means that the human body has no average temperature.

            Everything in the universe is ‘not in equilibrium’, so that means that we can know nothing about the temperature of things. Essex et al have put to rest any notion of doing anything at all in applied engineering, physics and medicine, because the average temperature is an illusion.

            And every time a doctor successfully diagnosed someone with the help of a thermometer, every time and engineer designed something that worked in all sorts of thermal conditions, every time an auto-thermostat was designed that turned an overheating machine off, and our entire adventure into the thermal exotica of space… was all done by accident, because there’s no such thing as an average temperature, and anything premised on that notion is flawed at the get-go.

            The light – it blinds.

          • Nate says:

            Richard,

            That paper has been debunked by a number of people. Eg here:

            http://rabett.blogspot.com/2005/11/temperature-rex-bites-essex-and.html

            For example, their figure 1 is supposed to illustrate their main point, but it has glaring errors.

            They use Celcius instead of Kelvin, and thus 3 of their 4 averaging methods give absolute nonsense.

            The T^4 and RMS averaging decrease with time in their plot, but done properly with Kelvin, they will increase with time, just as the arithmetic average does.

            These authors are not physical scientists, and it shows.

        • Nate says:

          Richard,

          That paper has been taken down by a number of people. Eg here:

          http://rabett.blogspot.com/2005/11/temperature-rex-bites-essex-and.html

          For example, their figure 1 is supposed to illustrate their main point, but it has some glaring errors.

          They use Celcius instead of Kelvin, and thus 3 of their 4 averaging methods give nonsense.

          The T^4 and RMS averaging decrease with time in their plot, but done properly with Kelvin, they will increase with time, just as the arithmetic average does.

          These authors are not physical scientists (clearly).

          • Nate says:

            whoops!

          • Richard Greene says:

            How can a paper published in a scientific journal in 2007 be debunked by a November 2005 article, at your link, on some harebrained blog named Rabett Run?

            Where the latest article is:
            “CO2 is garbage not plant food”
            “Is there a bunny so sheltered that he or she
            has not seen myriad repetitions of denial
            starting with CO2 is plant food?”

            Don’t people have to read a study BEFORE they try to debunk it ?

            That’s hard to do before the study is published !

          • Nate says:

            Ha! Right.

            The figures and the discussion surrounding them apparently were published in a book first.

            Essex and McKitrick’s ‘Taken by Storm’

            In any case, the criticism is apt.

    • barry says:

      “We might judge the integrity of the people compiling the statistic Spencer and Christy win that by a landslide.”

      Never mind that science is about evidence, not personality profiles (a particularly unscientific metric), you are here lauding two researchers who provide a statistic you think is physically meaningless and only a tool for propagandists. Could you be any more incoherent?

      • JDHuffman says:

        barry, are you competing for “Biggest Phony on this Blog”?

        You are a proponent of the “plates” nonsense, but you “never mind” the violation of the laws of thermodynamics.

        Could you be any more incoherent?

      • barry says:

        Typical Huffman. You have no actual response to what’s been said, so you huff and puff and change the subject.

        You’re a troll.

        • JDHuffman says:

          Sorry barry, but holding you accountable for your pseudoscience is NOT changing the subject. You are just trying to run from reality. That’s why you must resort to name-calling.

        • barry says:

          Huffing and puffing and avoiding the point. This game of yours is old.

      • Barry:
        I may be many things, but I’m not “incoherent”, as you claimed

        I do believe the global average temperature is not a useful statistic, and have written an entire article to explain why, in simple language.

        But it is still the PRIMARY statistic to promote what I see as climate science fraud.

        I explain in my article that there is no way, using science, to determine which global average compilation is accurate, assuming any of them are.

        However, it would be possible to eliminate any compilation if one perceived bias, or any other lack of integrity.

        If you can’t trust the scientists, then you can’t trust their numbers !

        In my view, that would eliminate all surface compilations, due to (the need for) excessive infilling, excessive repeated “adjustments, and the bad character exhibited in the hacked ClimateGate eMails, in 2009 and 2011, where supporting a desired narrative on global warming seemed much more important than honest science.

        Do you still think I’m “incoherent”, Barry ?

        • bdgwx says:

          I’m just curious…if I were to construct hypothesis along the lines of “Humans are getting taller” would you also believe that a mean height metric would not be a useful metric in testing that hypothesis?

          Or perhaps said another way…if you don’t believe a global mean temperature is a useful metric in testing the hypothesis that the Earth is warming then what alternate metric do you propose?

          • JDHuffman says:

            bdgwx, you are skewing the argument with your invalid analogy to human heights.

            A better analogy would be a hyoothesis that humans are getting taller due to CO2. So, a mean height metric would only idenitify any changes in height. It would not verify any causation due to CO2.

          • bdgwx

            What difference would it make to know the average height? People might care about their own height, compared with other people they come in contact with.

            The global average temperature is NOT useful for many reasons — the most important are:
            — No data for 99.999% of earth’s history,

            — No one lives in the average climate

            — No one knows what a “normal” average temperature is,
            (I suggest “normal” is not even possible for a planet not in thermodynamic equilibrium)

            — There is no clear understanding of what causes climate change, except for a list of suspects — assuming CO2 caused any past warming does not make it so.

            — There is no way to predict the future climate, as demonstrated by previous predictions of a coming climate catastrophe, starting in the late 1950s, with Roger Revelle, all of which have been 100% wrong, and

            — There is no agreement on whether warming is good news, or bad news — I say the mild warming has been very good news for over 300 years, since the very cold 1690’s, during the Little Ice Age — we’ve already had at least +2 degrees C. of warming since then (based on real time temperature data from England) and the warming was wonderful !
            .
            .
            .
            What should people care about, concerning the climate:
            — Whether where they live is getting warmer or colder, at least enough for people to complain about the cold, or the heat ( one or two degrees change does not matter),

            — Whether the growing season is increasing, or decreasing,

            — Whether farming productivity is improving at a healthy rate,

            — Whether ACTUAL sea level rise is reducing the values of ocean-side properties
            or causing REAL damage

            — In summary, what REALLY matter is if people are being hurt by climate change — and in my 21 years of reading climate science articles and studies, as a hobby, I have never been able to identify people hurt by climate change.

            As far as I can tell, our current climate is the best it has been, in at least 300 years, for the health and prosperity of humans and animals — C3 plants, however, would prefer a lot more CO2 in the air.

            My full article, on why I believe the global average temperature is NOT an important metric: http://elonionbloggle.blogspot.com/2019/04/is-there-really-global-average.html

          • bdgwx says:

            Richard,

            What testable hypothesis regarding the climate and what metrics do you feel are useful for making falsification attempts on them?

            I respect your feeling about the usefulness (or lack thereof) of a global mean temperature. That just means you aren’t interested in answering the question of whether the Earth is warming or cooling. That’s fine. But many of use are interested in answering that question. We are interested in it because we want to learn what causes the Earth to warm and cool, what causes the glacial cycles, what causes sudden events like the PETM, etc. And a global mean temperature is a useful metric in helping answer some of these questions.

          • bdgwx says:

            JD, there are two ways to falsify the hypothesis “Humans are getting taller due to CO2”. First, you can take a mean height measurement and trend over a period of time. If humans are not getting taller then you’ve falsified it. Second, if you can show there is a non-CO2 cause or set of causes that fully explains the height increase then you’ve falsified the hypothesis. The point…recording the mean height of humans over a period of time is essential in testing that hypothesis.

          • JDHuffman says:

            bdgwx, you would be correlating height to CO2. As with the AGW hoax, correlation is not causation.

          • bdgwx says:

            JD, that doesn’t make any sense. Sampling the human population to compute a mean height has nothing to do with CO2. And if you show that heights aren’t increasing then the CO2 argument is completely moot.

            It’s not any different with Earth’s temperature. Scientists sample the surface, ocean, and different levels of the atmosphere, etc. to compute a global mean temperature. This is done to answer the question of whether the Earth is warming or cooling. It has nothing to do with CO2.

            I believe the real issue here is that many people don’t like global mean temperature metrics because they are inconsistent with their woldview of how reality works.

          • bdgwx said on April 27, at 1:59,
            but there was no REPLY button there”

            “I respect your feeling about the usefulness (or lack thereof) of a global mean temperature. That just means you aren’t interested in answering the question of whether the Earth is warming or cooling. That’s fine. But many of use are interested in answering that question. We are interested in it because we want to learn what causes the Earth to warm and cool, what causes the glacial cycles, what causes sudden events like the PETM, etc. And a global mean temperature is a useful metric in helping answer some of these questions.”

            MY RESPONSE:
            First of all, whether there is global warming, or global cooling, depends on when you start the comparison, and when you end it, along with the accuracy of the temperature data.

            It’s now believed to be much colder than when dinosaurs roamed the Earth.

            It’s now believed to be much warmer than 20,000 years ago at peak glaciation.

            It’s now believed to be cooler than during the Holocene Optimum, about 10,000 years ago, after all the glaciers covering Canada melted.

            It’s believed to be warmer than in the cold 1690s, during the Maunder Minimum.

            It’s believed to be warmer than in 1880, although there were almost no Southern Hemisphere measurements before 1900, and too few until after 1940

            It;s actually a little cooler than at the late 2015, early 2016, EL Nino peak heat.

            Can you tell us which of these starting points represents a “normal” global average temperature?

            Somehow many people claim, with no scientific proof, that around 1750 had a “perfect” global average temperature, and was “normal”, and now the average temperature is “unprecedented”, which is complete nonsense.
            .
            .
            .
            What difference does it make to anyone if the global average temperature changes of 1 or 2 degrees C., over a century or two ?

            None. Especially if the change is warming, which people generally love, rather than cooling.

            Would it make any difference to your life if ten years from now your local weather averaged +0.1 or +0.2 degrees C. warmer than it is now ?

            Would that be an “existential threat” to humanity ?
            .
            .
            .

            What difference will it make when the current Holocene inter-glacial ends?

            Possibly a big difference, if the world got noticeably colder, which people generally don’t like.

            We already have a decent explanation for 100,000 year climate cycles, based on planetary geometry.

            The current inter-glacial could end tomorrow, or in a thousand years — no one knows for sure.

            The average temperature in a century may be a little warmer, or a little colder — no one knows for sure.

            There is no claims, that I know of, for long term global temperature changes much more than a degree C. in a century — there are some claims of large spikes in temperatures, but they all reversed fairy quickly — I’m assuming historical temperature reconstructions have some accuracy, which they may not have.

            So please tell me why it is so important to know what the climate will be like in 100 years, when it is obvious no one even knows what direction the global average will move, much less how far ?

            How many decades of wrong predictions are needed before people stop believing climate predictions ?

            I stopped “believing” long-term predictions in 1997, about one hour after I started a new hobby of reading climate science articles and studies !

        • barry says:

          Do you still think Im “incoherent”, Barry ?

          As you studiously avoided my point – yes, yes I do.

          You think a global average temperature is meaningless: false: non-existent: a propaganda tool.

          However,

          Of 2 researchers whose main body of work is around globally averaged temperatures, you say:

          “We might judge the integrity of the people compiling the statistic Spencer and Christy win that by a landslide”

          You are here giving high esteem to these 2 researchers who provide the statistic that you think is meaningless: false: non-existent: a propaganda tool.

          Yes, that’s wildly incoherent.

          This was my point, and your incoherence tricked you into making a bunch of other points. You’re not even able to respond to the thing that is said to you. Seems very fuzzy to me.

          So sure am I that your views are incoherent, I predict that, should you reply, you will once again fail to respond to the point I made in the first and now second place.

          • Your purpose at this website, Barry, is apparently to make false statements about science and to smear everyone you disagree with.

            Spencer and Christy provide a statistic that competes with other compilations, and that global average temperature statistic is treasured by warmunists like you, so it becomes important ONLY because so many people foolishly claim one number represents the “climate” of our planet.

            In fact, no one lives in the average temperature.

            The average obscures important details about past climate change too.

            The timing of climate change is important — night warming versus day warming.

            The location of climate change is important — high latitudes versus the tropics.

            The timing of climate changes are important — the coldest six months of the year versus the warmest six months of the year.

            These details are always kept from the public because they give a better picture of actual climate change since 1940 — more harmless than the overall average implies — and that’s completely harmless !

            If any people are hurt by ACTUAL climate change — none that I’ve identified so far — they will not be hurt by the average temperature.

            We measure local land surface temperatures — they make up the average — that’s what affects people, not tenth of a degree changes to the average temperature of our planet, or the average temperature of all the oceans.

            The coming global warming “catastrophe” is a fairy tale that has been told since the late 1950s — only fools believe it, and certainly you are in that category

            Have a nice day, Barry !

            You can’t ruin my day with your insults — my own science blog had over 2,200 page views in the past month, probably because I make sense — you certainly don’t !

          • Richard Greene says:

            I’ve gone through Barry’s comments, stripped away the junk science, and leave fellow commenters with THE BEST OF BARRY (better known as “Rude Boy Barry” by the other guys in his cellblock:
            barry says:
            April 27, 2019 at 4:47 PM
            … “Obviously you wish to impugn models thats fine. But youre doing it incoherently. ”
            .
            .
            barry says: 
May 2, 2019 at 5:08 AM 
”You are bullshitting. And you are embarrassing yourself.”
            .
            .
            barry says:
            April 26, 2019 at 2:58 AM
            “Why are AGW skeptics so irretrievably ignorant?”
            .
            .
            barry says:
            April 27, 2019 at 1:37 AM
            “You just contradict, whether or not you know what you are talking about. You are a form of intellectual pollution on this board. Or, more commonly, a troll.”
            .
            .
            barry says:
            April 30, 2019 at 8:47 AM
            ” You have to do dome science along with the conspiracy theories or all you have is conspiracy theories. Geddit?”
            .
            .
            barry says:
            April 25, 2019 at 5:30 PM
            “What a load of ripe tosh.”
            .
            .
            barry says:
            April 28, 2019 at 4:45 AM
            “Perhaps because your comments are tosh.”
            .
            .
            barry says:
            April 30, 2019 at 9:06 AM
            “You have no idea, do you? No, 28 pages of tosh is still tosh.”
            .
            .
            barry says:
            April 25, 2019 at 5:36 PM
            “Could you be any more incoherent?”
            .
            .
            barry says:
            April 27, 2019 at 1:39 AM
            “Typical Huffman. You have no actual response to whats been said, so you huff and puff and change the subject.
            Youre a troll.”
            .
            .
            barry says:
            April 28, 2019 at 4:33 AM
            “Huffing and puffing and avoiding the point. This game of yours is old.” (Note: this was the entire comment)
            .
            .
            barry says:
            May 1, 2019 at 12:52 AM
            ” thats wildly incoherent. This was my point, and your incoherence tricked you into making a bunch of other points. Youre not even able to respond to the thing that is said to you. Seems very fuzzy to me. So sure am I that your views are incoherent, I predict that, should you reply, you will once again fail to respond to the point I made …”
            .
            .
            barry says:
            April 27, 2019 at 1:43 AM
            “Stop behaving like a troll and reply to the topic at hand. If you cant do that, start a new thread on the topic you want to talk about.”
            .
            .
            barry says:
            April 28, 2019 at 9:29 AM
            “This huffing and puffing about average temperatures is intellectually depraved. But any talking point will do in a storm I suppose.”
            .
            .
            barry says:
            April 28, 2019 at 9:39 AM
            “Actually, sniping with no content is not something you often do, though you do often use pejoratives.”
            .
            .
            barry says:
            April 30, 2019 at 9:18 AM
            “Are you that dense?? This is not a shifting of the goalposts, it is a direct response to your assertion! Your idiocy is supreme.”

            “Are you senile? What is wrong with you?”

            “Whatever the case, the result is that you behave like a troll.”

            “After years of your intellectual depravity, Id rather call you a troll.”

            “The only other appropriate descriptor would be suffering from dementia.”
            .
            .
            barry says:
            May 1, 2019 at 1:00 AM
            “What a vile little troll Huffman is, linking to a comment I made about someone else and trying to play another person off about it.”

            “What a putrid excuse for a human being. One of the lowest examples Ive seen on the net.” ( This was entire comment)
            .
            .
            barry says:
            May 1, 2019 at 1:06 AM
            “Unless Heller is a complete morn (possible), he must know that RSS revised the methodology, and got the results that way. Either his BS is deliberate, or he has a serious mental deficiency. I go with the former.”
            .
            .
            barry says:
            May 2, 2019 at 5:24 AM
            “Thats the least you have to do before opining.
            Otherwise youre just blowing smoke.’

          • barry says:

            As predicted, you failed to answer the point. Quoting me replying to other people does not distract from that.

            Why can you not just respond to what I said? Is it a lack of comprehension? Is it too much for you to cope with? Does it get you off message? Did you think about it, figured you had no rebuttal, and went ahead and posted tons of irrelevant points?

            I respond to the point at hand. I don’t shift goalposts or change the subject. I do not understand how others can do this. It’s too dishonest a way of having a discussion for me to stomach.

            Let’s try again:

            How can you call the average global temperature meaningless and a propaganda tool, and then champion 2 researchers whose main body of work is producing that figure?

            It doesn’t make sense. And you haven’t even attempted to explain this dichotomy, 3 posts after and counting.

            Will you finally explain? Or will you avoid the point yet again?

          • Barry, Barry, Barry

            You are like a squawking leftist parrot asking the same question over and over and over again, until you hear the one WRONG answer that YOU believe in.

            I…will…type…slowly…now…so…that…even…you…can…understand !

            NO
            NE
            LIVES
            IN
            THE
            GLOBAL
            AVERAGE
            TEMPERATURE.

            IF
            THERE
            IS
            ANY
            PROBLEM
            CAUSED
            BY
            THE
            CLIMATE,
            THAT
            AFFECTS
            ACTUAL
            PEOPLE,
            IT
            WILL
            NOT
            BE
            “CAUSED”
            BY
            THE
            GLOBAL
            AVERAGE
            TEMPERATURE.

            IT
            WILL
            BE
            CAUSED
            BY
            A
            LOCAL
            TEMPERATURE !

            FOR EXAMPLE, and get someone to explain this to you, as it will be over your head: if the average temperature in Alaska got warmer. and nothing else changed, the global average temperature would go up, but the people living in Alaska would generally be happier !

            If the average temperature in Alaska went up, and the global average temperature went down, the people living in Alaska would generally be happier !

            So, for people living in Alaska, the global average temperature would have no relevance.

            And they wouldn’t care about the average temperature of the Atlantic Ocean.

            Using ONE global average temperature, which is a statistic, not an actual temperature, obscures real LOCAL temperatures that are meaningful for PEOPLE who live and work in those temperatures.

            And to try to teach you some basic statistics, barry, a mean, or average, of numerical data, is not new data, it is a basic statistical analysis of data.

            That’s why a mean temperature is not a real temperature that can be measured directly.

            There could be hundreds of ways to calculate a global mean temperature — none of which could be proven to be “the best”, or even proven to be accurate.

            All the temperature measurements are made once, by one instrument, and can never verified — the measurement instruments are not regularly checked for accuracy.

            The climate on our planet, where people live, could become horrible for many people, with no change in the global average temperature.

            The climate for people, where they live, could become more pleasant, in spite of changes to the global average temperature that other (foolish) people (like you) fret about.

            In fact, that is exactly what has happened since the cold decade of the 1690s, during the Little Ice Age’s Maunder Minimum.

            The global average temperature increased at least +3 degrees C. in Central England, and people were thrilled.

            I hope this was not over your head, Barry, as real science and logical comments usually are !

          • steve case says:

            Richard Greene says:May 4, 2019 at 9:19 AM
            Barry, Barry, Barry
            You are like a squawking leftist parrot …

            Your posts made me smile. Barry likes to pretend he’s taking the high road when in fact he’s in there biting kicking and eye-gouging along with everyone else.

            Yes averages lose a lot of information:
            Beware of averages. The average person has one breast and one testicle. Dixie Lee Ray

          • Nate says:

            “FOR EXAMPLE, and get someone to explain this to you, as it will be over your head: if the average temperature in Alaska got warmer. and nothing else changed, the global average temperature would go up, but the people living in Alaska would generally be happier !”

            We get it, Richard. Local temps matter to people. Never mind that you are cherry picking a cold place.

            But measuring global temperature rise is ALSO useful to know.

            Science is trying to figure out if AGW is happening, and what will be its possible consequences. Local temperature trends are very NOISY, thus much less useful for detecting AGW.

            If AGW will lead to:

            -melting of ice sheets, and significant sea level rise that will impact coastal cities, I would like to know.

            -permanent damage to ocean ecosystems (eg reefs) and fisheries, I would like to know.

            – melting of glaciers, impacting reliable water sources, I would like to know.

            -more extreme precipitation or tropical storm events, I would like to know.

            -more drought and wildfires in drought prone regions, I would like to know.

            -significant changes in reliable weather patterns-what happens in the Arctic may not stay in the Arctic, I would like to know!

            Wouldnt you?

    • Entropic man says:

      Physically energy content and its changes are much more informative than temperatures.

      If you know the average temperature of the ocean you can calculate its energy content. Measuring the increase in average ocean temperature over time tells you how the energy content is increasing.

      Since over 90% of the energy accumulating due to global warming is accumulating in the oceans, you get a good measure of how fast energy is accumulating.

      Global average temperature itself is fairly uninformative,but you can use it to calculate much more interesting data.

      • JDHuffman says:

        Babbling, rambling, and dreaming are not consistent with the scientific method, E-man.

        But obviously you didn’t know that.

  26. Entropic man says:

    For anyone wanting to invoke the Ideal Gas Law as the cause of global warming it should be easy to prove.

    PV=nRT

    P=nRT/V

    n and R are constant for Earth’s atmosphere. Assuming V remains constant we can calculate the change in pressure required to produce the observed change in temperature.

    Initial sea level pressure 1013millibars

    Initial global temperature 287K(14C) in 1880

    Current global temperature 288(15C)

    Current global pressure = 1013*288/287 = 1016.5mb

    If your hypothesis is correct the atmospheric pressure should have increased by 3.5mb between 1880 and now. Can you demonstrate that change?

    • RickWill says:

      The composition of the atmosphere varies significantly from one location to another as well as over time. So your statement that n and R are constant is incorrect. Also, what is the basis for assuming the volume is constant?

      The sea level pressure is a function of the atmospheric mass above the selected location and the gravitational field at that location. Both vary substantially over time as evidenced by tides and changes in air pressure.

      • Entropic man says:

        Rickwill, JDHuffman

        The test of a useful hypothesis is that it can be used to make predictions which can then be tested. As a retired scientist my instinct when I meet a new idea is to ask “How can I test it? What can I measure?

        I put forward a simple thought experiment to see what might be measurable if climate change was driven by the ideal gas law.

        Since you find it controversial, lets unpack it a little.

        n is the number of moles of gas, essentially the number of molecules of gas in the atmosphere. I doubt this has changed much since 1880. R is the gas constant, constant by definition.

        If you assume V is constant you can calculate the maximum pressure change, and judge whether it would be measurable. In this case a 3.5mb/C increase in pressure is easily measured by a mercury barometer or an aircraft altimeter.

        In practice, RickWill is right and it is PV which remains constant.

        To find the maximum variation in V we can assume that P is constant. The equivalent increase in V would lower the QNH, the pressure altitude of every airfield by 100ft. That is also testable. Airfields have been measuring QNH for a century.

        To sum up, If changes in P and V have warmed the climate we should see a pressure increase of up to 3.5mb/Cor QNH changes down to -100ft/C.

        The exact values would depend on the size of the relative changes in P and V.

    • coturnix says:

      Whilest the ‘skydragon’ ‘pressure effect’ of global warming is an obious bunch of boloney, your test is not the best way to disprove it. Global pressure does change due to change in the contents of that trace gas – water vapor, and in tropics, water vapor can add something on order of 1% to the air pressure – the mixing ration can often be as high as 2% or more in tropics near surface but integrated over the bulk of atmosphere it would be alot less than that, probably between 0.1-1% or 1 to 10 mb. The 3.5mb you request falls well within the range of pressure variability due to changes in humidity, and so the increase in water vapor which coincidentally also increases with warming may actually sort-of ‘support’ that ‘pressure=>ghge’ hypothesis, however wrong it is. Although it is almost certainly would quantitatively not support the hypothesis in more precise calculations (the humidity and hence temperature changes required would probably be much larger than the ones observed for a given change in pressure), at least the sign is correct, that is unlike in some other cases.

  27. Dave G says:

    That only works if you believe the contrived historical data from which we have very little data from much of the planet and almost nothing from the entire southern hemisphere.
    The 1940’s blip was not only erased, the whole scale was stretched with fake or at best minimal data.

    • barry says:

      This supposedly erased 1940s blip; what are you talking about? Global temps or something else?

    • Bindidon says:

      Dave G

      “The 1940s blip was not only erased,…”

      Do you mean this 1940’s blip?

      http://www.woodfortrees.org/graph/gistemp/mean:60/plot/gistemp/from:1940/to:1970/trend

      “… the whole scale was stretched with fake or at best minimal data.”

      Can you give a proof of your claim? Or are you one more of these many “commenters” who prefer to discredit and denigrate?

      • Gordon Robertson says:

        binny…”Can you give a proof of your claim? Or are you one more of these many commenters who prefer to discredit and denigrate?”

        Binny is still in denial about the data fudging of NOAA and GISS, not to mention Had-crut. Even Phil Jones, admitted in the Climategate email scandal that he had used Mike’s trick (hide the decline) to ‘fix’ some data in the 1940s.

        It is well established that the 1930’s era in North America was extremely hot with frequent heat waves that have never been surpassed. The only reason it cannot be applied to the whole planet is that data acquisition back then was not on a global scale or anywhere near it.

        Russia and China were in upheaval and no one takes time out amidst revolutions to collect weather data. The oceans were barely covered either.

        There is every likelihood that the 1930s heat records were global in nature and that it was never adequately recorded.

      • barry says:

        Do you know something about this allegedly erased ’40s blip’, Gordon, or did you again fail to respond to what was being said and bang your eternal drum apropos of zilch?

        Stop behaving like a troll and reply to the topic at hand. If you can’t do that, start a new thread on the topic you want to talk about.

    • Chris Hanley says:

      Dave G what you fail to realise is that the ‘science’ of Climate Change is more of an art form, here two practitioners discuss alterations to the shape of one of their pictures in order to make it look scarier:
      September 28, 2009: email 1254147614Tom Wigley writes to Phil Jones:
      Here are some speculations on correcting sea temperatures to partly explain the 1940s warming blip. If you look at the attached plot you will see that the land also shows the 1940s blip (as Im sure you know). So, if we could reduce the ocean blip by, say, 0.15 degrees Celsius, then this would be significant for the global average but wed still have to explain the land blip. Ive chosen 0.15 degrees Celsius here deliberately. This still leaves an ocean blip, and I think one needs to have some form of ocean blip to explain the land blip .
      It would be good to remove at least part of the 1940s blip, but we are still left with why the blip? .
      http://scienceandpublicpolicy.org/images/stories/papers/reprint/climategate_analysis.pdf
      And they are still at it:
      http://woodfortrees.org/plot/hadsst2gl/mean:12/plot/hadsst3gl/mean:12

      • Nate says:

        Problem with your conspiracy theory is that result of going from hadsst2 to 3 is less GW since 1940s. Their ‘fudging’ was rather ineffective.

      • bdgwx says:

        It’s the same with NOAA’s global surface temperature dataset. The net result of all Karl’s necessary and appropriate adjustments actually causes the warming trend to be less than what it is when compared with the raw data.

        His “fudging” was so ineffective that it went in entirely the wrong direction of the conspiratorial viewpoint.

        https://science.sciencemag.org/content/348/6242/1469

        • Kristian says:

          Another one of those braindead talking points of the CO2 cultists put to use, I see.

          No, bdgwx. It did not go “in entirely the wrong direction of the conspiratorial viewpoint”. It increased warming in the present, and decreased it in the past. Just like the theory and (hence) the models claim.

          There was hardly any atmospheric CO2 increase prior to or during that early warming, after all, so a much larger rise in temperature back then than in recent times, when the CO2 rise has allegedly occurred at a much higher rate, would be completely incompatible with the “AGW hypothesis”:

          https://okulaer.files.wordpress.com/2017/08/co2-vs-icoads-v2-5.png
          https://okulaer.files.wordpress.com/2017/08/co2-vs-ersstv4.png

          • bdgwx says:

            See figure 2B. The NOAA dataset quite clearly shows less warming as a result of the adjustment as compared to the raw data. This is also true of NASA, Berkeley Earth, etc. datasets as well. The point…if one doesn’t agree that certain adjustments are necessary then one must concede that the warming trend is even higher during the instrumental record than what is generally agreed upon. There is no conspiracy going on here.

            And this has nothing to do with CO2, CH4, CFCs, solar radiation, or any other climate forcing agent. It’s just a measurement of the global mean surface temperature.

        • barry says:

          You can spin this so many ways, as long as your view is that the adjustments are preferential rather than a result of rigour.

          For example, one can argue that climate sensitivity is lower, because long-term global temp trend is lower.

          But as usual critics argue based on the optics, and not at all on whether or not the methodology was sound, improved, or flawed in some way.

  28. ferd berple says:

    Has UAH become a climate scapegoat? Sir Roger Scruton discusses the wider question:

    https://www.roger-scruton.com/about/radio/559-bbc-radio-4-point-of-view-the-witch-hunt-culture-2-december-19

    • Gordon Robertson says:

      ferd…” Sir Roger Scruton discusses the wider question:”

      Good for Sir Roger, hit the nail right on the head.

      UAH has been a target for the climate loonies for years now. They have worked hard at trying to discredit UAH using every means but the one that counts, scientific observation and reasoning, which depends on real data.

      They have gone after Roy and John personally. When the climate looney, Phil Jones, of Had-crut, a Coordinating Lead Author on IPCC reviewes, claimed that he and Kevin would see to it that certain skeptic papers did not reach the IPCC review stage, he was talking about John Christy of UAH, and Roy indirectly.

      Kevin, himself, has interfered in a peer review process involving a paper from either Roy or John, causing the journal editor to resign.

      As for Sir Roger’s claims about homophobia, Islamophobia, and every other form of politically-correct implied phobia, he hit the nail right on the head. Our world is now run by loonies who suppress free thought by relegating anyone who tries into a category of phobia.

  29. Gordon Robertson says:

    bdg…”I call this the Tony Heller theory. He believes that the atmosphere is warming because of PV=nRT. He assumes that T is increasing because PV is increasing. The problem is that the Ideal Gas Law is a diagnostic or state equation”.

    You have a misunderstanding of basic physics and chemistry. The IGL is based on observation of the reality by at least 4 different scientists: Dalton, Charles, Gay-Lussac, and Avogadro. Their laws are well established under the umbrella of the IGL and they apply equally to gases in the atmosphere.

    Here’s the reality. If you have a gas in a container, the pressure comes from the forces of all atoms exerted on the walls of the container. The volume in that case is the space contained by the walls of the container. The n in PV = nRT is the number of molecules of gas in the container.

    T is the average kinetic energy of the molecules of gas while R is a constant of proportionality that varies with the type of gas.

    Within that container, the IGL tells us that if n, R, and V are constants, then P is proportional to T. We don’t need the IGL to tell us that, it is plain, common sense based on how atoms/molecules behave in a volume.

    In the atmosphere, n is relatively constant as is V, which is held to the Earth’s surface by a gravitational force. The force causes a stratified volume with altitude, that is relatively constant. Therefore, in the atmosphere as in the lab container, P is always proportional to T.

    I don’t care what you call the IGL, it is nothing more than an observation of reality. On the other hand, the notion of adiabatic processes in which a volume of heated gas in certain parts of a gas is not exchanged with the gas surrounding it is sheer lunacy.

    A true adiabatic process requires the process to be in a container that is insulated to minimize heat loss. There’s no way that can happen in the atmosphere since gases are free to mingle with the surrounding air and to a large degree.

    IMHO, they are describing dynamic air flows within a static process in which a heated gas parcel at a higher pressure is rising through a mass of gas at a lower pressure. The higher density gas pushes the lower density gas out of the way but at the same transfers heat to it. That is not a true adiabatic process.

    The pressure and temperature of the static process, through which the heated parcel is rising, is determined statically by gravitational force and the movement of gas molecules within the process provided by the force. A rising heated air parcel within that static processes is not steady-state, it is an impulse that temporarily affects the static process.

    In other words, climate scientists are only looking at local processes and trying to extrapolate the locality to the generality. It doesn’t work, you cannot explain the pressure at 30,000 feet being 1/3 that of sea level, using such theory.

    When pressure decreases in a gas, and the volume and number of moles of gas remain relatively constant, the temperature MUST decrease. To do that in a lab container, you’d have to reduce P by releasing gas molecules, n, from the container.

    You cannot change n in the atmosphere, therefore the only way to change P is through a thinning of n as gravitational force reduces with altitude. There is no pther possible explanation for why the density of n would reduce with altitude.

    The gas pressure at the peak of Everest, at nearly 30,000 feet is 1/3 what it is at sea level. The temperature drops in proportion to the drop in pressure and gravity is the only explanation for that reduction in pressure.

    It has nothing to do with lapse rate, which has more to do with thermals than the overall atmosphere. Lapse rate cannot explain the gas pressure at 30,000 feet being 1/3 of the pressure at sea level. Some people try to explain the lower temperature at 30,000 feet without relating it to the pressure and they are wrong to exclude the effect of gravity on the pressure.

    • Bobdesbond says:

      Here is a scatter plot of atmospheric pressure vs air temperature for this month in Sydney:
      https://tinyurl.com/Gordon-Wrong-Again

      Same station for each reading, same time of day (9 am & 3 pm).

      There seems to be a problem with your theory.

    • bdgwx says:

      I’m pretty familiar with the IGL. And I stand by what I said. It is a state equation. It declares how P,V,n, and T must related to each other. But it does not say anything about how a system evolves. How can it? There are no terms that describe the work being performed on the system nor is there a time term. Yes, T can be driven higher if you drive PV higher, but it’s also possible to drive PV higher if you drive T higher. That’s the way it is. And I’m all in on the IGL already. What I’m saying is that if if the hypothesis is that the warming (delta-T) is occurring due to a polytropic process then a force needs to be identified that is compressing the atmosphere. What is that force? Why is it cyclic? What is modulating its timing? I, on the other hand, believe the work being performed on the atmosphere to cause it to warm at the bottom and cool at the top is more isochoric than polytropic (i.e. a thermal barrier).

      • Gordon Robertson says:

        bdg…”What Im saying is that if if the hypothesis is that the warming (delta-T) is occurring due to a polytropic process then a force needs to be identified that is compressing the atmosphere. What is that force? ”

        What is the force? It’s the same force that roots you to the surface. Without it the atmosphere would go flying off into space.

        The acceleration of a mass due to gravity is given roughly as 9.8 m/s^2. That applies only at the surface, it changes with altitude, albeit slightly. However, the change is enough to affect something as light as air molecules by stratifying them into layers with compressions that get lower with altitude.

        It’s true that masses of appreciable size are accelerated by gravity at a uniform rate. However, molecules of a gas are in a different situation, since they are so light and always in motion, up, down, and sideways.

        Try to answer the question I posed. Why is the gas pressure of the atmosphere at 30,000 feet only 1/3rd the pressure it is at sea level. And why is the temperature correspondingly lower?

        Do you think that is a mere coincidence?

        What else could possibly cause gas pressure to reduce with altitude other than a slight reduction in gravitational force?

        Everything related to the atmospheric vis a vis weather and climate is related to solar energy and gravity. There are no other natural forces operating. The drivers are solar energy and gravity.

      • Gordon Robertson says:

        bdg…another point. It it was not for gravity holding the atmosphere against the surface, as the planet turned at the equator at roughly 1000 mph, humans there would be facing winds up to 1000 mph.

        It’s like holding your hand out the window of your car on the highway and feeling the force of the wind against it. If the atmosphere was not glued to the surface by gravity, you would experience the same as in your car only traveling at 1000 mph near the equator.

        The winds we experience as weather are air masses operating within that static framework created by gravity.

      • bdgwx says:

        GR,

        To answer your question…the reason why P and T is generally higher at the surface is because Earth’s gravity causes it to be that way. This is common knowledge. We both agree on that.

        Where we part ways is that I and scientists accept that Earth’s gravity is not changing and thus there is no polytropic process (like gravitational compression) being performed on the atmosphere right now. The atmosphere is in equilibrium with the gravitation force precisely because the gravitational force is not changing.

        If you disagree then present evidence that Earth’s gravity is changing. Present evidence that Earth’s gravity can increase/decrease resulting in an increase/decrease in temperature via gravitation compression. Present a convincing narrative that explains how Earth can change it’s gravitational force to form cyclic temperature cycles like the glacial/interglacial periods and their timing. Present a convincing narrative that explains sudden warming events like the PETM in terms of sudden gravitational increases.

        By the way, how would an increase in gravity explain the warming troposphere and hydrosphere simultaneous with the cooling stratosphere anyway?

    • Tim Folkerts says:

      “[The ideal gas law] is nothing more than an observation of reality. “

      Yes. The Ideal Gas Law is an excellent approximation for the observed behavior of gases (especially at low densities and high temperatures). You just choose:
      * a well-defined volume
      * filled with a well-defined amount of gas
      * at a well-defined pressure, and
      * at a well-defined temperature.
      You measure the various properties of that gas and you find that (to a very good approximation over a wide variety of circumstances)
      PV = nRT.

      Applying this to the gas of the atmosphere as a whole is silly. There is not a single temperature nor is there a well-defined volume. (Of course, you can apply it to any given small part of the atmosphere quite effectively).

      ” “High” pressure is not relevant to the stratosphere. It is the low density that prevents the application of the gas law.”
      The IGL applies quite well to gas in the stratosphere. At any given moment, you can select a well-defined volume (say a cubic meter somewhere) with a well-defined temperature, pressure, and amount of gas inside. For that cubic meter, PV = nRT will hold. And PV = nRT will hold for any other cubic meter, even though the pressure and temperature and number of moles may be different.

  30. Eben says:

    Can’t sleep waiting for the next datapoint ? check this New level of climate nonsense

    AN Oxford University professor has claimed aliens are already breeding with humans to create a new hybrid species that will save the planet.

    Dr Young-hae Chi, an instructor in Korean at Oxford’s Oriental Institute, part of the prestigious university, thinks this new species will save Earth from annihilation from climate change.

    https://bit.ly/2GBGMfv

  31. Roy Landberg says:

    Dear Svante. Thank you for an enlightning lesson as given in his (drroyspencer) link from 2011. ☺

  32. Bobdesbond says:

    Mr Spencer
    You “promptly fixed” it?? Funny – that is not my recollection. People implored you to fix the problem for many years before you finally made the fix.

  33. Aaron S says:

    Bob share link please?

  34. Carbon500 says:

    As an aside, and to give an insight into the warmist doomsday mentality, here’s what happened in a local (UK) newspaper encounter with an individual who shall remain nameless.
    I wrote a letter (via email) citing satellite temperature data from the UAH.
    The response was:
    ‘He tries to justify his nonsense using information from an obscure university in the US bible belt where there are laws about not teaching evolution.’
    Needless to say, the person concerned has never sent a letter in which he has ever presented any figures or shown any evidence that he’s done any research for himself.
    Is there any hope that reason will prevail one day? The media is infested with such people, the politicians have fallen for it all, and we’re all going to die in a CO2 induced hell.
    I can’t imagine how all this will end.

    • Bobdesbond says:

      Was there anything incorrect in the response?

    • Gordon Robertson says:

      carbon…” from the reply to you…He tries to justify his nonsense using information from an obscure university in the US bible belt where there are laws about not teaching evolution.

      I am not religious but I am all for banning the teaching of evolution is schools. It’s utter pseudo-science.

      The underlying premise of evolution is that 5 basic elements, carbon, oxygen, nitrogen, hydrogen, and phosphorous. managed through sheer fluke to form into all the complex life forms we see today.

      The only science we know related to the bonding of such elements, and the shapes they can form as molecules, covalent bonding theory, says nothing about the vague notion of natural selection. The latter is a reference to a mysterious process, based on no evidence, that forces basic elements to convert from inanimate objects to animate objects.

      The science of genetics has unearthed impressive information as to how intelligent processes can be handed down from generation to generation and modified, but genetics is the study of species that are all of one type. No one in the field of genetics has noticed intermediate forms of life that represent a hybrid between a sea-faring creature and a land-based animal.

      Or a frog and an insect. Their DNAs don’t match and each lifeform has a unique DNA that contains information on how to replicate itself. That is intelligence and there is no explanation for how such an intelligence got there, never mind the chemical bonding impossibility.

      There is simply no evidence to support the theory of evolution yet it is taught with impunity in schools and universities as if it is fact. In fact, a few studies have been done which examine the probability of those 5 basic elements forming life by sheer chance, and the likelihood based on the entropies of the processes, and the results are in the billions and billions to one against evolution.

      • ren says:

        Probably the DNA has been repeatedly modified by strong gamma radiation.

      • bobdroege says:

        Gordon, stay away from genetics and biology.

        Frogs and insects share a considerable amount of DNA sequences.

        • Craig T says:

          “We focused further on very early embryonic development, when the main features of the body are being mapped out and important Hox functions must be executed. The gene and animals chosen were: Antennapedia (in Drosophila) and its orthologue Hoxc6 (in Xenopus). We first established that these two genes are functionally homologous as well as orthologous and then examined the classes of common targets.”
          https://onlinelibrary.wiley.com/doi/full/10.1111/j.1440-169X.2011.01307.x

      • Craig T says:

        “…but genetics is the study of species that are all of one type.”

        Type is a wonderfully vague word. Genetics is also the study of genes as they are passed down as species evolve. DNA within genus, family, order, class and even kingdom is not as unique as you make it sound. Last time I checked DNA didn’t violate the 2nd law of thermodynamics.

        Evolution aside, trashing whatever Carbon500 wrote for using data from Alabama is pointlessly ad hominem. I’m sure he didn’t commit the same sin while showing the errors of the “warmist doomsday mentality.”

  35. Aaron S says:

    Okay SO THIS IS WEIRD. I got a new phone today and still my comments go to bottom. Now I am really confused why.

  36. Aaron S says:

    Carbon 500, I think the UAH is a valid data set. However, the association with young earth creationism is a shot to credibility and Roy has stated some personal beliefs that were piblisized. I personally dont agree that it should be a problem because a belief can either boas a researcher or not it can go either way and I dont see bias here. In context it seems unfair that people on the left dont loose credibility for biology denialism about topics like gender identity, differences in male and females, genetic control for violence etc when their beliefs are not aligned with peer reviewed bodies of literature. I personally dont see the difference between beliefs from scientists on eother side and believe the left alarmist crowd is just as misaligned with evolutionary theory as the right. Just the left has near total power in academia at big name universities outside the bible belt.

    • Bobdesbond says:

      “the left alarmist crowd is just as misaligned with evolutionary theory as the right”

      Please explain this assertion.

      • Aaron S says:

        To be fair I wrote a long reply but am not comfortable sharing because people at google and presidents at Harvard get fired for saying the similar things. So freedom of speach does not extend to this topic bc of irrational consequences.

    • Nate says:

      ‘In context it seems unfair that people on the left dont loose credibility for biology denialism about topics like gender identity’

      Apples and oranges.

      Evolution is not ‘leftist’, anymore than the Big Bang Model is not ‘anti feminist’ (something I heard once!).

      It is just a science fact, established by hard sciences like Chemistry, Physics, Biology, Geology, Paleontology.

      Its not a ‘leftist’ notion of what societal norms ought to be, eg what pronouns people should use, coming out of social ‘sciences’ departments.

  37. Carbon500 says:

    To all who responded to my earlier post, thank you. I doubt that the individual who made the comment I posted is even aware that satellite data exists. As I stated earlier, I’ve never seen him use data of any kind in support of his views. His tactics always include attempts to belittle those with whom he doesn’t agree.
    In the same letter, much to my amusement, he said of me that ‘He would destroy the world for his false beliefs.’

  38. Entropic man says:

    Coming back to the Ideal Gas Law and lapse rate, I found this calculator for the dry adiabatic lapse rate.

    https://www.shodor.org/os411/courses/_master/tools/calculators/lapserate/

    Note how simple the formula is.

    ∆T/∆z = – (g/Cp)

    ∆T is the change in temperature in K

    ∆z is the change in altitude in metres

    g is the acceleration due to gravity

    Cp is the specific heat of the atmosphere.

    For dry air on Earth g and Cp are constant.

    This means that the troposphere temperature profile on Earth is determined entirely by two variable, the height and temperature of the tropopause.
    Knowing the tropopause height and temperature you can calculate the atmospheric temperature profile right down to the surface.

    All the rest is bullshit.

    • Gordon Robertson says:

      entropic…”This means that the troposphere temperature profile on Earth is determined entirely by two variable, the height and temperature of the tropopause”.

      Once again, for those who will not see, we’d have no atmosphere were it not for gravity.

      Your equation has no reference to air pressure and you have not answered the main question. How does the air pressure at 30,000 feet get as low as 1/3 the air pressure at sea level? What is there in your lapse rate equation that explains such a phenomenon?

      Your equation considers only the relationship between altitude and temperatures based on the amount of heat in the atmosphere.

      What is heat in relation to a gas? It is the average kinetic energy of its molecules which is measured relatively by temperature. Heat is a real property of matter, temperature is a human invention aimed at measuring relative levels of heat.

      What is kinetic energy wrt gas molecules? It is the energy of each molecule. How does it rise and fall? By introducing more molecules into a certain volume, or adding more heat to the gas.

      Here’s the relationship…PV = nRT. That is the exact relationship between pressure, temperature, mass, and volume in the atmosphere. The lapse rate is a derivation of the observed effect of P,T, V, and n focused on the effect of PV = nRT with altitude. That’s why you have g in the equation.

      The lapse rate equation implicitly contains the Ideal Gas Law. However, T would not apply to altitude alone were it not for the effect of gravity on atmospheric pressure.

      You have put the cart before the horse.

      • Entropic man says:

        Gordon Robertson,JDHuffman

        If you want to calculate the pressure profile for an atmosphere you use the barometric formula.

        https://en.m.wikipedia.org/wiki/Barometric_formula

        Note that it uses the Ideal gas law variables among others, seven variables in total.

        Once you have the pressure profile calculated, most of those variables cancel out or are constant, so you can calculate dry adiabatic temperatures for any altitude just knowing the temperature at one altitude.

        If you know surface temperature you can calculate the next 10km upwards. If you know tropopause temperature and altitude you can calculate downwards to get surface temperatures.

        Once you the temperature profile you can see the effect of CO2. Without greenhouse gases Outward Infrared radiation (OLR) would radiate direct to space from the surface.

        With GHGs energy is carried upwards through the atmosphere by a combination of convection and short path length radiation hopping from one GHG molecule to another. Once you reach the tropopause the pressure is low enough for upward radiation from GHG molecules to escape to space. The altitude of the tropopause determines the black body temperature of the outgoing radiation and the lapse rate then sets the surface temperature. There is a certain amount of back-and-forth until the system reaches a temperature equilibrium at which incoming radiation and OLR carry equal energy.

        Increase GHG concentrations and you upset the equilibrium. The extra CO2 increases the decreases the pressure, and increases the height at which OLR occurs. The lower temperature reduces the OLR so there is a net uptake of energy. The greater ∆z between tropopause and surface increases the surface temperature.

        • Kristian says:

          No, Entropic. This is what SHOULD happen, according to the “AGW hypothesis”. It is, however, NOT what we actually observe.

          Why? Because, within the real Earth system, there are OTHER factors than the purely radiative ones at play. And they easily overwhelm any potential radiative perturbations to the surface heat budget.

          Yours is but a THEORETICAL effect and can only be speculated to occur in isolation, that is, disregarding the parallel (and much larger) effects of all OTHER processes operating within the Earth system.

          • gbaikie says:

            –Why? Because, within the real Earth system, there are OTHER factors than the purely radiative ones at play. And they easily overwhelm any potential radiative perturbations to the surface heat budget.–

            And what are the other factors.
            I think one has to start with what is known.
            The most relative factor which is known, is we are in an Ice Age.
            We are in an ice age, because we have two polar ice caps.
            Now, most imagine an Ice Age is related to glacier periods and perhaps because we spend a long time in glacier periods, this is why we say we are currently living in an Ice Age.
            But anything Earth has any polar ice cap, it is an ice age. And during our glacial period, we can be said to be in severe part of the Ice Age.
            We living in a cold time in Earth history, and during during glacial periods it is the coldest times in Earth history.
            And snowball earth is a myth as is the idea that Venus was once like Earth- there is very little evidence of either. And the myths “survival” requires it be in time periods in which little is known.
            1] Venus surface is considered be very young, or that surface did not exist in the imagined time that Venus was suppose to be like Earth [it supposed to have an ocean, had plate tectonic, etc]
            2] Earth ocean basin surface is very young, oldest is about 200 million years old- snowball earth was imagined to occur before this]
            And it should noted that theory of plate tectonic is fairly new theory which has accepted. As a guess, I would say snowball myth is older than science of plate tectonics. And easy guess, is that we gain far more information related to plate tectonic evolution in the not too distant future.
            Science takes some time, and stupid myths seem to live forever.
            Anyhow speaking of things known for long time.
            It’s been long known that the tropical ocean is the heat engine of the world.
            And that oceans warm land [and land doesn’t warm oceans].

          • gbaikie says:

            So, I got distracted.

            The more important aspect related to Ice Age is having a cold ocean.
            The average temperature of the entire ocean determines global average air temperature.

            A cold ocean has average temperature of 1 to 5 C.
            We are at 3.5 C
            When ocean is not cold, there is not ice age.
            If average temperature of ocean was 10 C, then you are not in an Ice Age.
            If ocean is 15 C or warmer, Earth is in a Hothouse climate.
            Btw, greenhouse is another word for a hothouse. Or hothouse is not a sauna, though some might say a sauna is a hothouse.
            Or a hothouse is where you could grow tropical plants if living in the temperate zone in our time of being in an Ice Age.
            A hothouse climate has more tropical climate [places tropical plants will grow, not where desert plants grow].

            Life as we know it, doesn’t end in a hothouse climate, and we not going to be living in hothouse climate. Not in thousand or even a million years.
            Nor are we going to exit, our Ice age within a thousand years- as ocean can not warm from 3.5 C to +5 C within a thousand years.
            So we aren’t going to live in a non ice age or “normal climate” within a thousand years.

            Now, I know people are going to worry about what going to happen in +1000 years. I would just say, don’t.

          • Gordon Robertson says:

            gbaikie…”The most relative factor which is known, is we are in an Ice Age.
            We are in an ice age, because we have two polar ice caps.”

            I can’t see that changing unless we find a way to tilt the Earth to get more solar radiation year round in the polar regions. As long as there is no solar radiation in the polar regions for a good part of the year, and a minimal amount for another good part of the year, we will continue to have ice at either polar region.

            Of course, we could move the planet closer to the Sun. ☺

            No amount of GHGs can do anything about that.

    • JDHuffman says:

      E-man, that formula for the lapse rate is derived from the 1LoT and the Ideal Gas Law. And, it is fairly accurate, even in a turbulent, ever-changing atmosphere.

      And more importantly, the formula has no reference to CO2 concentration. So adding more CO2 to the atmosphere would not cause any temperature increase.

      But, people that understand the relevant physics already know that.

      So, as you stated: “All the rest is bullshit.”

  39. Gordon Robertson says:

    barry….”What a load of ripe tosh. Physics constantly works with averaged temperatures. Astrophysicists have no trouble determining the effective temperatures of other planets and stars”.

    Physics works with averages in data that make sense, like the average temperature of a body based on the assessed average kinetic energy of its particles, that can be measured relatively based on the expansion of mercury compared to the set points of the temperature of freezing and boiling for water.

    It’s unlikely that such a body would have poles that have average temperatures well below 0c, an equatorial region with temperatures well above freezing (even 30C), and oceans covering 70% of the body which are capable of re-distributing heat throughout the body.

    Claiming the planet has an average temperature of +15C does nothing for people in the polar regions who would welcome 0C much of the year. Here in Vancouver, where our temperatures are moderated by ocean currents, we never experience extreme weather. Even our extreme blows (of wind) are mild compared to tormadoes or hurricanes which we never see.

    Speaking of global temperatures is an exercise in futility. Speaking of global climates is lunacy.

    • barry says:

      Ah, you’re arguing that physics can only deal with bodies that have near uniform temperature. That’s some wacko universe you live in. The entirety of thermodynamics deals with solid state temperatures when in reality every body in existence has within it fluctuating temperatures. Temperature is no more than the AVERAGE of the kinetic energy of its particles – and there is much variety among the particles. Virtually every heat susceptible machine made on Earth is designed to work under the physics of average temperatures. No macro scale machinery is designed around micro scale fluctuations in temperature (which all machinery has). Your quibble is false at the outset. It denies pretty much the entire field of thermodynamics. Not that this is a surprise, Gordon.

      This huffing and puffing about average temperatures is intellectually depraved. But any talking point will do in a storm I suppose.

      • JDHuffman says:

        barry, you are rambling more and more incoherently. It’s as if you are miffed that your “plates” nonsense got busted.

        I’m not sure how to help you, other than to say “learn some physics”.

        Hope that helps.

  40. .
    ❶①❶①❶①❶①❶①❶①❶①❶①❶①❶①❶
    ❶①❶①
    ❶①❶① . . . Do Alarmists believe in evolution? . . .
    ❶①❶①
    ❶①❶①❶①❶①❶①❶①❶①❶①❶①❶①❶
    .

    Everybody who is worried about global warming, should answer these 2 simple yes/no questions.

    1) Did humans evolve near Kenya, Africa?

    2) Should humans be able to tolerate temperatures similar to Kenyas?

    The obvious answers to both of these 2 simple questions, are Yes, and Yes.

    But no Alarmist can manage to say the answers. Can you see why?

    I have even asked a climate scientist to answer these 2 questions. I received no answer.

    For people who are interested, here are the real absolute temperatures for Kenya (in degrees Celsius) are:

    winter = 14.7

    average = 21.5

    summer = 29.1

    Nice and warm !!!

    The temperature in Kenya is not below 14.7 very often, and the average is 21.5

    In summer, the temperature in Kenya is often around 29.1 degrees Celsius.

    Humans evolved in a hot country. Later, many humans migrated to colder countries. But we didnt evolve in a cold country.

    That is why humans can tolerate heat, better than they can tolerate cold.

    For more global warming / real absolute temperature facts, read this article:

    https://agree-to-disagree.com/rats-north-summer-south-winter

  41. Gordon Robertson says:

    barry…”Stop behaving like a troll and reply to the topic at hand. If you cant do that, start a new thread on the topic you want to talk about”.

    I was not aware that Roy had appointed you as moderator. This is a blog in which people are free to comment within certain parameters, not a meeting place for individual conversations. If a commenter is posting bs, as does Binny, I reserve the right to offer my contrary views.

    A troll is someone who has no intention of participating in a blog, he/she shows up only to create dissent. For example, on one blog in which I participated an ingrate troll took exception to people posting material he did not like. When he was told to p/o, he retaliated by posting all forms of vile pornography, flooding the site till it was barely operational.

    That’s trolling. Intentionally disrupting a blog to be an ***hole. I offer my input to people like binny only because I want third parties to get the other side of the argument.

    Besides, you are objecting only because I berated NOAA and GISS. You are still blinded by their chicanery, which is not my fault.

    • barry says:

      That everyone is free to put forth an opinion in this website is a given so obvious it does not need stating. So when someone asserts this right as if it has somehow been curtailed, you know that this someone is retreating to rhetoric and concern trolling.

      A troll:

      Continually changes the subject in a sub thread
      Repeats the same message over and over
      Consistently distracts from the ongoing conversation with red herrings

      Consistently derails the conversation by:

      shifting the goalposts
      getting personal
      sniping with no content
      ignoring the point under discussion

      These are typical of your behaviours.

      • barry says:

        Actually, sniping with no content is not something you often do, though you do often use pejoratives. The other behaviours are consistent with you.

      • JDHuffman says:

        barry, you conveniently forgot “false accusations” and “misrepresentations”.

        Nothing new, huh?

      • Gordon Robertson says:

        barry…”Consistently derails the conversation by:

        shifting the goalposts
        getting personal
        sniping with no content
        ignoring the point under discussion

        These are typical of your behaviours.”

        Enjoy your delusions. None of those are the definition of a troll. A troll’s basic initiative is to disrupt out of sheer spite. That is not me.

        1)When I pointed out to you that the IPCC had claimed no warming from 1998 to 2012, you inferred I was a liar. When I gave you the link to the quote you moved the goalposts by claiming a short term flat trend was not significant.

        When I pointed out a link to NOAA in which they claimed to have slashed 75% of their reporting surface stations you moved the goalposts again, claiming they had actually increased their database.

        2)When I pointed out to you that the UAH trend is in fact a combination of a rewarming trend and a true warming trend with a 15 year flat trend you claimed I had no idea what I was talking about.

        3)The reason you think I snipe with no content is that you have no idea what I’m talking about most of the time since your understanding of basic physics is not there.

        4)I seldom if ever ignore the point under discussion, If it seems that way it’s because I am seeing the bigger picture which you are missing entirely.

        Yes…I repeat myself often because you and your fellow alarmists continue to spread your pseudo-scientific propaganda regularly. You offer no scientific evidence, just propaganda based on consensus.

        • barry says:

          When I pointed out a link to NOAA in which they claimed to have slashed 75% of their reporting surface stations you moved the goalposts again, claiming they had actually increased their database.

          Are you that dense?? This is not a shifting of the goalposts, it is a direct response to your assertion! Your idiocy is supreme.

          It was a rebuttal to what you said (which is, and remains, a filthy lie). The source material was given. The web page you provided, I then quoted in full, STATING THAT THE NUMBER OF STATIONS HAD INCREASED. But you are blind to all of that, or lie to yourself or others about it.

          No, the goalposts were not shifted – the assertion you made was rebutted directly and fulsomely. Are you senile? What is wrong with you?

          Whatever the case, the result is that you behave like a troll. You repeat stuff that has been thoroughly – and I mean THOROUGHLY – debunked. You repeat it ad nauseum. You change the subject on a whim (this is even more clumsy distraction than ‘shifting the goalposts’) and you lack the self-awareness to acknowledge that you do this.

          After years of your intellectual depravity, I’d rather call you a troll. The only other appropriate descriptor would be ‘suffering from dementia’. I’d prefer to believe you are doing this deliberately than because you can’t help it.

    • David Appell says:

      Gordon thinks an ***hole is anyone who disagrees with him.

      Ideas that can’t stand the heat — and Gordon’s never can — deserve to be skewered.

  42. Bobdesbond says:

    As you avoided my reply above to your claims about atmospheric temperature and pressure, here it is again:

    Here is a scatter plot of atmospheric pressure vs air temperature for this month in Sydney:

    https://tinyurl.com/Gordon-Wrong-Again

    Same station for each reading, same time of day (9 am & 3 pm).

    There seems to be a problem with your theory.

    • Bobdesbond says:

      For Gordon

    • Gordon Robertson says:

      bobdes…”Here is a scatter plot of atmospheric pressure vs air temperature for this month in Sydney:”

      You are surely not that obtuse. You are comparing the pressure and temperature at a constant altitude.

      Tell you what. Take a hike up Everest in clothes you’d wear on a nice sunny day on Observatory Hill and see how long you’d survive. Before you choked to death from lack of oxygen you likely freeze to death.

  43. Bill Hunter says:

    Entropic man says:”Increase GHG concentrations and you upset the equilibrium. The extra CO2 increases the decreases the pressure, and increases the height at which OLR occurs.”

    Where do you get this from?

    • Stephen P Anderson says:

      It’s called “The Contorted Model”-the planet is balanced on a precipice. They need to perpetuate this hoax. They are truly a bunch of hallucinating lunatics.

    • Entropic man says:

      Bill Hunter

      Sorry, that got a bit garbled.

      Should have been:-

      Increase GHG concentrations and you upset the equilibrium. The extra CO2 decreases the pressure and increases the height at which OLR occurs.

      Essentially the extra GHGs have increased the pressure altitude at which the OLR radiates to space by about 100 metres.

      Where do you get the information?

      Any decent atmospheric physics textbook. Try “Physics and Chemistry of the Atmosphere” by Murray Salby.

      • Kristian says:

        Yes, Entropic. It’s what the THEORY says. It’s not observed REALITY.

        • gbaikie says:

          Yes, agree it is theory.
          And I would say it’s ass backward.
          Elevation where sunlight is absorbed, makes the difference in regard to Venus.
          And with planet Earth, where sunlight in absorbed is a minor aspect.
          It why the ocean basin of dried out Mediterranean sea had highest air surface temperature that ever known to have occurred on Earth.

          It also possible it related to one warming effect related to Earth clouds- though again, a minor effect.

          As far as greenhouse gases, I think they have effect in terms reducing heat loss [it acts as insulation] and water vapor would have largest effect- Co2 is minor effect and it does not make the earth surface hotter.

          • David Appell says:

            gbaikie says:
            Elevation where sunlight is absorbed, makes the difference in regard to Venus.

            Proof?

            Solar light rays are parallel to an extreme degree when they reach Venus. Any “elevation effect” is inconsequential.

          • gbaikie says:

            –David Appell says:
            April 28, 2019 at 5:55 PM
            gbaikie says:
            Elevation where sunlight is absorbed, makes the difference in regard to Venus.

            Proof?–

            Let’s play, do you disagree?

            “Nonetheless, one can study the forces at play in the atmosphere to arrive at a good speculation of the climate. As winds blew across the “Mediterranean Sink”, they would heat or cool adiabatically with altitude. In the empty Mediterranean Basin, the summertime temperatures would probably have been extremely high even during the coldest phase of any glacial era. Using the dry adiabatic lapse rate of around 10 C (18 F) per kilometer, a theoretical temperature of an area 4 km (2.5 mi) below sea level would be about 40 C (72 F) warmer than the temperature at sea level. Under this simplistic assumption, theoretical temperature maxima would have been around 80 C (176 F) at the lowest depths of the dry abyssal plain permitting little life other than extremophiles.”
            https://en.wikipedia.org/wiki/Messinian_salinity_crisis

            Do you disagree with the above.

            Bonus question, when and where has sunlight ever warmed Earth surface to 80 C?

          • David Appell says:

            Lets play, do you disagree?

            Yes.

            Calculate the angle by which solar light rays differ from parallel when they arrive at Venus.

          • gbaikie says:

            **David Appell says:
            April 28, 2019 at 6:12 PM
            Lets play, do you disagree?

            Yes.**

            Can you explain why they are incorrect?

            Regarding, Appell’s :
            “Solar light rays are parallel to an extreme degree when they reach Venus. Any “elevation effect” is inconsequential.”
            And:
            “Calculate the angle by which solar light rays differ from parallel when they arrive at Venus.”

            The Sun’s apparent diameter is larger as seen at Venus distance as compared to apparent diameter at Earth distance.
            According to wiki, sunlight
            Venus
            Perihelion is 0.7184 AU and has 2,647 watts per square meter.
            Aphelion is 0.7282 AU and has 2,576 watts per square meter.

            Obviously if one were at .75 AU, one would be 3/4 of distance from the sun as compared Earth’s average of 1 AU. Or Venus is less than 3/4th of distance as compared to Earth distance.
            A basketball at distance of 28.7 feet vs
            40 feet distance from basketball at Earth distance.

            And Appell is asking about parallel to extreme degree and solar rays differing from parallel.

            Does such difference equally apply to basketball at distance of 28.7 feet as compared to 40 feet?
            And if it does, what effect is going to have?

      • David Appell says:

        “The extra CO2 decreases the pressure….”

        Huh??

      • Bill Hunter says:

        Entropic – “Increase GHG concentrations and you upset the equilibrium. The extra CO2 decreases the pressure and increases the height at which OLR occurs.”

        thanks for fixing the confusing language.

        I get that the idea of increasing the OLR height is a concept necessary to the current concept of how forcing might be increased.

        Roy above notes they are the only observation platform to have possibly noted that as having actually occurred (if not because of erroneous observation or from a cause different than increasing CO2, like reduced clouds) so it hardly seems I would find that its a proven theory if that’s the case.

        I also haven’t ever heard that the addition of CO2 reduces atmospheric pressure.

        Mean atmospheric pressure I thought was due to gravity and the weight of the atmosphere. warming a gas doesn’t change its mean weight it merely changes its volume because the atmosphere isn’t confined in a closed container. So what is the cause of this pressure change? and a more explicit reference to the name of the science theory that mandates it would be helpful.

        Perhaps you are confounding effects here saying raising the average height in the atmosphere of the TOA “skin” layer would locate it in a lower pressure zone of the atmosphere. Its my (crude) view that if currently the skin layer averages at 500mb (getting that the “skin” isn’t a layer of uniform height and instead is a virtual skin) and you double the density of CO2 that zone would be something on the order of 250mb instead. I could be wrong about that but desire to be educated, not by proclamation but instead by fact. Can you help with this?

        • Gordon Robertson says:

          bill hunter…aimed at this from entropic…
          “Entropic Increase GHG concentrations and you upset the equilibrium. The extra CO2 decreases the pressure and increases the height at which OLR occurs.”

          Entropic…have you ever heard of Dalton’s law of partial pressures? The total pressure of a gas is the sum of the partial pressures. The partial pressure is related to the percent mass of a gas in a mix.

          CO2, at 0.04% percent mass of the atmosphere could not affect the total pressure by more than a factor of a few hundredths of 1 percent.

          Far too much is made of this totally trivial gas.

        • Entropic man says:

          Bill Hunter, Gordon Robertson

          I’m still garbled,it seems.

          This is what I said.

          Increase GHG concentrations and you upset the equilibrium. The extra CO2 decreases the pressure and increases the height at which OLR occurs.”

          This is what I meant.

          Increase GHG concentrations and you upset the equilibrium.

          The extra CO2 decreases the pressure at which OLR occurs.

          The extra CO2 increases the height at which OLR occurs.

          The extra CO2 has had no effect on pressure, It has only affected the pressure at which the atmosphere becomes transparant to 15 micrometre infra-red radiation.

          If the average height at which outward longwave radiation escaped to space was 10.5km in 1880, it would now be 10.6km.

          Let me run through the basic logic.

          The surface, or CO2 molecules, emit 15 micrometre photons in all directions. Simplifying somewhat, each photon can do one of three things.

          1) It hits the surface and is absorbed.

          2) It hits a CO2 molecule and is reemitted.

          3) It escapes to space.

          We are currently interested in the upper atmosphere, so forget 1).

          The probably of an upward moving photon escaping to space depend on how close together the CO2 molecules are. When the molecules are closely packed, an emitted photon will only travel a short distance before hitting another molecule. As the pressure decreases, the molecules are spaced further apart and a photon will be able to travel further before hitting another molecule. When the pressure is low enough,some photons find a gap and escape to space without hitting anything. This is the pressure,and the spacing between molecules, at the tropopause.

          Now increase the % of CO2 in the atmosphere. The spacing of the molecules decreases and photons which might have escaped now hit CO2 instead. The spacing at which photons can escape now occurs at a lower pressure and a greater height.

          • JDHuffman says:

            E-man, just a couple of mistakes in your “basic logic”.

            * You omitted 4) It hits the surface and is NOT absorbed.

            * If you increase the amount of CO2 in the atmosphere, you increase the amount of photon emitters, which increases the amount of energy radiated to space.

            * Increasing the height of emission also decreases the flux necessary to radiate the same as a lower elevation. (Area matters.)

          • Entropic man says:

            JDHuffman

            I did say “simplifying somewhat. I was explaining why increasing CO2 content increases tropopause height. I left out irrelevant detail, or we’d be here all night!

            I did a quick calculation.

            Firstly, increasing the number of emitters does not increase the rate of emission. This depends on the amount of energy coming up from below.

            Raising the emission altitude by 100m reduces the emission temperature by 1C. That reduces the emission by 4.2W/M^2.

            The increase in emission area increases total emission for a given temperature by the equivalent of 0.04W/m^2.

            The increase in emission height has produced a net decrease in emission of -4.2+0.04 =-4.16W/M^2

          • JDHuffman says:

            Two more mistakes, E-mans.

            * “Firstly, increasing the number of emitters does not increase the rate of emission.”

            I especially like that one because that translates to adding more CO2 to the atmosphere does not increase DWIR. Just the opposite claimed by the bogus GHE.

            * “The increase in emission area increases total emission for a given temperature by the equivalent of 0.04W/m^2.”

            Increasing the emitting area DECREASES the flux, for a given energy balance. You had better check your calculation. Hint: About 8 W/m^2 decrease.

          • Tim Folkerts says:

            “* Increasing the height of emission also decreases the flux necessary to radiate the same as a lower elevation. (Area matters.)”

            Increasing the height of emission by 1 km results in about a 0.03% increase in area.

            Increasing the height of emission by 1 km would be about a 6 K decrease in temperature, or about a 10% decrease in BB radiation. CO2 is not a BB, so that would be closer to a 1% decrease in emissions.

            CONCLUSION: temperature changes due to elevation have a MUCH bigger effect than surface area changes due to elevation. Area doesn’t actually matter much.

          • Bill Hunter says:

            Entropic – Thanks for the clarification. It now sounds like the theory I have heard about. I am not an atmospheric scientist and just trying to understand more.

            Since you have offered up the following also:

            “Raising the emission altitude by 100m reduces the emission temperature by 1C. That reduces the emission by 4.2W/M^2.”

            How do we know that current TOA for emissions in the CO2 spectrum are still in the troposphere? Obviously if thats above the troposphere lapse rate you are using in your equations your results are wrong.

            If you have a source on that I would love to see it.

            Also if you are producing 4.2W/m^2 thats a lot more than a doubling of CO2. If you double the CO2 density a 100m seems to be a very small rise in height to get back to essentially the same density as before (albiet with that minor area adjustment). What am I missing here?

          • Tim Folkerts says:

            How do we know that current TOA for emissions in the CO2 spectrum are still in the troposphere?

            One great resource for understanding GHGs is
            http://climatemodels.uchicago.edu/modtran/

            You can choose from many standard atmospheres (various clouds and temperatures) and it calculates the spectrum as measured from various altitudes (looking either up or down).

            If you adjust the CO2 , you will be able to deduce that the emissions currently come (primarily) from at or below the tropopause. [There is a thin spike in the middle of the CO2 band that is from the stratosphere.] But increasing the CO2 levels cuts back on escaping IR; any extra radiation from the warm stratosphere is more than compensated by the reduced emissions from the tropsphere.

            “What am I missing here?”
            I can’t speak for Entropic, but here is my take on some of the ‘gaps’.

            1) I am not sure where 4.2 W/m^2 came from. That would correspond to a black body cooling by 1 C from ~ 265 K to ~ 264 K. 265 K seems like an odd starting point, but maybe there is a good reason. In any case, choosing other nearby temperatures will not make a huge difference in the results.

            2) CO2 is definitely not a BB, so it would produce a much smaller change than 4.2 W/m^2 if it cooled by 1 C (100 m). Like an order of magnitude smaller cooling. This would mean you would need close to an order of mangitude larger change in temperature (ie on the order of 1000 m, not 100 m) to produce that magnitude of impact of the power radiated. That seems to fit with your intuition better.

          • Bill Hunter says:

            Tim Folkerts says:”If you adjust the CO2 , you will be able to deduce that the emissions currently come (primarily) from at or below the tropopause.”

            Thanks for responding. I have played around with and read a bit on the UofC Modtran model though I had not noted you could deduce that.
            But I wasn’t looking for it.

            I would note that it is a model. What I am looking for is source of the information encoded in the model. Since I don’t have access to a library nor any specialized research tools (nor a textbook since its been more than 50 years since I took a physics class) I am just looking for a little help regarding how this theory is considered settle science. CO2 is a well distributed gas and the same temperatures occur in at least 4 places in the atmosphere split evenly between warming or cooling with elevation along with some pauses. Seems like a relevant question. Also interested in the doubling the density question where you get less than a 100meter rise with density proportional to temperature.

      • Gordon Robertson says:

        entropic…”Essentially the extra GHGs have increased the pressure altitude at which the OLR radiates to space by about 100 metres”.

        Natural CO2 makes up 95% of the 0.04% of atmospheric CO2. How much have we added, less that 0.01%????

        How much of a difference to the overall pressure of the atmosphere could 0.01% make?

        • Craig T says:

          “Natural CO2 makes up 95% of the 0.04% of atmospheric CO2. How much have we added, less that 0.01%????”

          How did you come to that number and how are you defining “natural”?

      • Stephen P Anderson says:

        Any decent atmospheric physics textbook. Try “Physics and Chemistry of the Atmosphere” by Murray Salby.

        Oh, so you get to pick and choose what Salby’s text is correct about? Chapter and page please?

        • Entropic man says:

          According to you I’m a “hallucinating lunatic”. Yet you have sufficient respect for my position that you demand references.

          Do you see the paradox?

  44. Andrew stout says:

    I used to think fake science would have to give way to real science at some point, but the field has been too corrupted, the forces of fake news in the Media are too unblushing in their amplification of misinformation. I find myself hoping for another ice age, if only to laugh myself to death when I read the headlines that Banning SUVs and taxing breathing had a more potent effect in thwartung global warming ‘than scientists expected’.

  45. Eben says:

    The rules to debate score on this board (as in any climate debate) is very simple –
    – The one typing the word “science” most times wins.

    • Craig T says:

      Does that include typing pseudo- in front of science?

      • Eben says:

        No , but, For those really slow who don’t grasp the concept of what I wrote above the phrases like “Science says so and so” , “science does this and that” , and “according to science” are completely idiotic arguments ,

        if you ever used it you are ” it “

  46. gallopingcamel says:

    Scott Denning is the most rational of the “Climate Scientists” I have come across. He is not afraid to debate issues with amateurs such as this camel. That Twitter comment does not seem to correspond with his style….especially the generous use of CAPS.

    He might have been having a bad day or perhaps someone hacked his Twitter account. I will ask him to comment right here. Maybe a useful debate will ensue.

    • David Appell says:

      Scott Denning has repeatedly said your science is wrong. Don’t pretend he’s somehow agrees with your bad physics.

      PS: Did you find that missing 150 W/m2 yet?

      • gallopingcamel says:

        As usual you are deluded.

        While Scott Denning and I disagree he is totally rational. He said that the GHE (Greenhouse Effect) was 33 Kevin and I said it was 91 Kelvin.

        We debated off-line for 18 months. While we still don’t agree we are getting closer:

        https://tallbloke.wordpress.com/2017/06/06/extending-a-new-lunar-thermal-model-part-iii-modelling-the-moon-at-various-rotation-rates/

        • Bobdesbond says:

          When will you be publishing your paper on this 91K greenhouse effect?

        • Norman says:

          gallopingcamel

          I generally like your posts. You seem intelligent and thoughtful.

          I would disagree with you n the 91 Kelvin GHE. Even if you have calculations for them I would object on the logical basis of your conclusion.

          The Surface temperature will reach the temperature that will be at the point the atmosphere is able to radiate away the same amount of energy the Earth system receives (I guess it is calculated out to be around 240 W/m^2 averaged out over the entire sphere of the Earth surface).

          Even if you got rid of the other surface cooling mechanisms (convection and evaporation) the surface would not continue to warm. It would reach the temperature that allows 240 Watts/m^2 to leave the TOA. With the current emissivity and nature of the atmosphere, the surface could not warm above what it averages now. If you change the dynamics of the atmosphere you can alter the surface temperature but I don not think the GHE would have ever (current structure of atmosphere) have reached 91 K.

          I am open to logic an reason and valid physics if you can explain it well. I can look at your link.

          • JDHuffman says:

            Norman states: “I am open to logic an [sic] reason and valid physics…”

            Norman, if you were truly open to logic and reason, and understood the relevant physics, you would know that the 33K is as bogus as the 91K, along with DA’s missing 150 W/m^2.

            But, you’re not there….

          • Norman says:

            JDHuffman

            You are a blog troll. Please do not respond to my posts. Thanks. Troll the others, I do not wish to hear anything from you. Again thanks. If you can disengage from trolling a moment you will honor my request.

          • JDHuffman says:

            Norman, you never could defend your pseudoscience. But, you used to try, with long rambling dissertations and links to things you didn’t understand. I see you have changed your tactics.

            But, you kept the insults. That’s nothing new.

          • Norman says:

            JDHuffman

            It seems you can’t stop the trolling even when asked to.

            If you waste your time replying to this post, don’t expect me to jump into your troll game. I just really do not care about what you have to say at all. Maybe you will understand that. Maybe you won’t. I don’t really care.

          • JDHuffman says:

            Norman, if you were able to think rationally, you would realize that it is YOU that is the troll. You have nothing to offer except insults, false accusations, and misrepresentations. You avoid learning, because you’re addicted to pounding on your keyboard.

            Nothing new.

          • Norman says:

            JDHuffman

            If you believe I am a troll and have nothing to offer then do not respond to my posts. It really is not that hard to do.

          • JDHuffman says:

            Norman, stop spouting pseudoscience and nonsense, and I will not respond to your comments.

    • David Appell says:

      Scott Denning has repeatedly said your science is wrong. Don’t pretend he somehow agrees with your bad physics.

      PS: Did you find that missing 150 W/m2 yet?

      • gallopingcamel says:

        @David Appell,
        I sent you my model files but you could not open them. I am converting them to Excel spreadsheets in the hope of making it easier for you.

        One set of files calculates the temperature of our Moon as shown here:
        https://tallbloke.wordpress.com/2014/04/18/a-new-lunar-thermal-model-based-on-finite-element-analysis-of-regolith-physical-properties/

        The other set of files reproduces the Robinsion and Catling 2012 and 2014 papers.

        • gbaikie says:

          “”It has been claimed that the GHE (Greenhouse Effect) is 33 Kelvin because the Earth’s average temperature is 288 K compared to a temperature of 255 K assumed for an “Airless Earth”.””

          Airless world which is an ideally thermally conductive.
          And of course no world which is airless, can have surface getting anywhere close to being ideally thermally conductive.

          “”The Diviner LRO showed that the Moon’s average temperature is 197.3 K which makes one wonder how an estimate based on impeccable mathematics could be so wrong?””

          If the Moon had faster rotation it would be more thermally conductive. But even if had 24 hour day, it would not vaguely be close to an ideal thermally conductive body.

          A ideal thermally conductive body has a uniform temperature.

          One meter below the surface of the Moon is fairly close to a uniform temperature.
          1 meter below the surface of Earth’s land area is likewise somewhat fairly close to an uniform temperature.

          And most of the Earth ocean is even closer to having uniform temperature.
          I think it’s said that 90% of the world’s ocean is below 3 C.
          And it’s said the average temperature of entire ocean is about 3.5 C.
          So, if +/- 3 C is fairly uniform, Earth ocean is, mostly, a fairly uniform temperature.
          But of course the ocean is not vaguely like a ideal thermally conductive body or it’s almost the opposite.
          [It is well insulated and has this uniformity due to low conductivity.]

  47. David Appell says:

    Roy wrote:
    Secondly, in the 25+ years that John Christy and I have pioneered the methods that others now use, we made only one “error” (found by RSS, and which we promptly fixed, having to do with an early diurnal drift adjustment)

    Roy, this isn’t what I’ve heard.

    I’ve heard that you resisted all discussions, and would not consider your sign error until people literally stood at your blackboard and showed your sign error explicitly.

    Only then did you (your team) finally acquiesce. It took years longer than it should have — I’ve been told.

    • Bobdesbond says:

      He did respond pretty promptly to this particular paper, but he is conveniently “forgetting” the countless earlier attempts over the years to convince him he was wrong, where he adamantly declared the correctness of his data.

      • Gordon Robertson says:

        bobdes…”He did respond pretty promptly to this particular paper, but he is conveniently forgetting…”

        You’re another idiot.

    • Gordon Robertson says:

      DA…”Roy, this isnt what Ive heard.

      Ive heard that you resisted all discussions, and would not consider your sign error until people literally stood at your blackboard and showed your sign error explicitly.”

      You’re an idiot Appell, you’d believe any alarmist crap that came your way. There was no sign error, there was an issue with an orbital variation that affected temperatures only near the Tropics. The error was well within the declared error margin.

    • An Inquirer says:

      David Appell, your post reveals far more about yourself than anything about Dr. Spencer. I have been scientifically engaged in the CO2 issue for almost 40 years. Neither Dr. Spencer nor Dr. Christy resisted discussions; they were both very responsive to my inquires. They were open with their models and had a collegiate relationship with RSS back when RSS wanted it. Their behavior was in sharp contract to Dr. Mann and others who brushed off questions, hid data and essential model features for years, resorted to “appeal to authority” arguments, and dismissed valid concerns.

      What you say in your post suggests that you are immersed in propaganda and do not engage in critical thinking skills.

      • Bobdesbond says:

        Right, we are expected to believe that someone who is afraid to post his name when he says he has connections to Mr Spencer. You are an imposter.

      • Gordon Robertson says:

        inquirer…”What you [David Appell] say in your post suggests that you are immersed in propaganda and do not engage in critical thinking skills”.

        Right on. The only thing you left out if that he’s also a troll.

  48. Gordon Robertson says:

    entropic…” If you assume V is constant you can calculate the maximum pressure change, and judge whether it would be measurable. In this case a 3.5mb/C increase in pressure is easily measured by a mercury barometer or an aircraft altimeter.

    In practice, RickWill is right and it is PV which remains constant”.

    *********

    I am assuming the volume of the entire atmosphere is relatively constant. Obviously, if solar energy heats the atmosphere either directly, or due to conduction from the surface (CO2 and WV are trivial over the entire atmosphere) then the atmosphere should expand and contract during the day as the Earth rotates, expanding more in the equatorial regions and less as one moves toward the poles.

    However, there is a fly in the ointment…gravitational force. It creates the volume, holding it in place, while it stratifies the atmosphere into regions defined by pressure and temperature.

    I don’t see how PV could possibly be a constant. If P drops to 1/3 the P at sea level, that would suggest V expands by 1/3, which is nonsense in the context of the atmosphere. Furthermore a constant PV implies the temperature is constant, if n remains constant.

    Either you treat the atmosphere as a whole, which could expand/contract as a whole, or you break it into pressure band of volumes based on altitude.

    Either way, the volume will change very little compared to the overall atmospheric volume or band of atmosphere, which ever you select.

    We are not concerned about that change in V so much as we are in the drop in pressure to 1/3 as we reach 30,000 feet of altitude. To achieve that in a lab with a piston and cylinder, we’d have to compress the gas with the piston to atmospheric pressure, then let off the piston till P dropped to 1/3. I don’t know how you’d do that at 1 atm. without lowering n or changing T.

    In the atmosphere, that piston is replicated by a variation in gravitation force, albeit a tiny change. It would not have a perceptible effect on a larger mass, but for individual molecules of air, it serves to stratify them into pressure bands that are continuous in nature.

    There is no other explanation for why P drops to 1/3 its value at sea level by 30,000 feet and that’s why the related drop in temperature occurs. As molecules spread apart, the pressure drops and the temperature drops. There’s the IGL right there.

    Climate scientists have described dynamic processes that operate on top of that natural pressure temperature gradient.

    • Bobdesbond says:

      Now explain how your simple model explains the RISE in temperature as you move upwards in the stratosphere.

      • JDHuffman says:

        The simple explanation is that there is not enough “gas” in the stratosphere for the “ideal gas” law to apply.

        The more complex explanation involves the fact that the Sun warms the stratosphere (UV/ozone) while Earth’s surface warms the troposphere.

        • Bobdesbond says:

          The ideal gas law breaks down at HIGH pressures, not low.

          Your second paragraph is correct – thanks for contradicting Gordon for me.

          • JDHuffman says:

            “High” pressure is not relevant to the stratosphere. It is the low density that prevents the application of the gas law. (“…not enough “gas” in the stratosphere for the “ideal gas” law to apply.”)

            And, I’m not contracting Gordon. Thanks for misrepresenting me.

          • Bobdesbond says:

            You do understand that, if all other variables are fixed, pressure is proportional to density, right?

            The only assumption of the ideal gas law that can break down is that gas molecules are dimensionless points. This assumption works well at low pressure but the size of the molecules becomes significant at high pressure. If you want to claim that the law breaks down in a certain domain, you have to state which assumption that was used to derive the law does not apply in that domain.

          • Bobdesbond says:

            And as Gordon states that temperatures depends ONLY on pressure, you are most definitely contradicting him.

          • JDHuffman says:

            des, you’re still not getting it.

            The “ideal gas law” is for IDEAL conditions. The more you move away from ideal conditions, the more the law breaks down. It is fairly accurate in the troposphere, if averaged over large enough volumes. It is not accurate in some localized weather event, such as a thunderstorm. And it is certainly not reliable in the stratosphere.

            Again, nothing I have said contradicts Gordon. Your desire to avoid reality only indicates your desperation.

          • Bobdesbond says:

            No, the ideal gas law is applicable when the assumptions made in deriving the law are met. The lower the closer to “ideal” you get. Apparently your idea of “ideal” is surface pressure, as though that is somehow assumed in the derivation. You HAVE seen the derivation, right?

          • JDHuffman says:

            des, you’re assuming, instead of understanding. Read my comments, without trying to spin my words.

          • Bobdesbond says:

            No, YOU are assuming. You are making a false assumption about “ideal conditions”. The only domain over which the ideal gas law does not apply is very high pressure. It applies at pressures (or densities if you like) that exist in the stratosphere.

          • JDHuffman says:

            One more time: Read my comments, without trying to spin my words.

          • Gordon Robertson says:

            bobdes…”Your second paragraph is correct thanks for contradicting Gordon for me”.

            I did not receive JD’s input as a contradiction. He’s right in that it would be difficult to measure a P-T relationship in the thin air of the stratosphere, even though the P-T curve goes straight through it. I think it’s more of an inference at the higher altitudes based on a very slightly higher than expected temperature observed due to UV warming.

          • Bobdesbond says:

            “even though the P-T curve goes straight through it”

            What the hell does that even mean?? The P-T curve goes straight through the stratosphere?? I can’t find ANY noun used earlier that would be a suitable substitute for “it”.

          • Gordon Robertson says:

            bobdes…”What the hell does that even mean?? The P-T curve goes straight through the stratosphere??”

            You are setting a record for obtuseness.

            The curve starts at sea level and goes straight through the altitude at which the stratosphere is located.

            Comprenez???

          • bobdroege says:

            JD,

            Apparently you are unaware of what the ideal in the ideal gas law refers to.

            It means all collisions between atoms or molecules are assumed to be elastic, and all atoms or molecules have zero volume, and there are no attractive forces between atoms or molecules.

            And I left one out.

            It does not mean conditions are ideal.

            Hope that helps.

            It is obvious you have not studied any college chemistry.

          • JDHuffman says:

            bobdroege says: “It does not mean conditions are ideal.”

            bob, if you were to go back to my first comment, you would see that I was explaining to des why the stratosphere behaves differently than the troposphere. When he digressed into definitions, I lost interest.

            If you both want to believe the ideal gas law applies everywhere, all the time, that’s okay with me. Such false beliefs form what is know as “pseudoscience”.

          • bobdroege says:

            Look dude, you missed by a mile and again you are not getting off easy.

            Your words

            “The “ideal gas law” is for IDEAL conditions. The more you move away from ideal conditions, the more the law breaks down. It is fairly accurate in the troposphere, if averaged over large enough volumes. It is not accurate in some localized weather event, such as a thunderstorm. And it is certainly not reliable in the stratosphere.”

            The Ideal gas law is most accurate with conditions of low pressure and high temperature, like where, clowns ask?

            Like the stratosphere

            And maybe I wasn’t specific in my criticism, you also said

            “The more you move away from ideal conditions, the more the law breaks down.”

            You don’t move away from Ideal Conditions, the conditions of the Ideal Gas law are the same every where they can be applied.

            Atoms and molecules are considered points, all collisions are elastic, and no attractive forces between atoms and molecules, ie no van der waals corrections applied.

            you screwed it up

            Oh yeah for the rest of the posters who apply the Ideal Gas Law to the atmosphere, remember the atmosphere has no walls.

            That was the one I left out.

          • JDHuffman says:

            If you both want to believe the ideal gas law applies everywhere, all the time, that’s okay with me. Such false beliefs form what is know as “pseudoscience”.

          • bobdroege says:

            You are wrong and dense as well,

            I never said the Ideal Gas Law applies everywhere, in fact I listed the necessary conditions for it’s application which actually apply no-where.

            Do you get it now?

      • Gordon Robertson says:

        bobdes…”Now explain how your simple model explains the RISE in temperature as you move upwards in the stratosphere.”

        That was explained in the past by ren, the poster you like to deride. The stratosphere is heated independently by solar UV, which is absorbed by oxygen.

        If you look at the pressure curve submitted by entropic, the P-T relation is very close to linear from the surface through the stratosphere. It is so close to linear up to 5 kilometres that you might as well call it a linear relationship.

        Climate scientists can obfuscate the issue all they like by introducing the concept of lapse rate. All they are doing is applying parts of the Ideal Gas Law with very slight variations due to stratospheric warming and the dynamic effects of rising warm air parcels.

        I think they are wrong to infer an adiabatic state in the atmosphere just as GHE proponents are wrong to infer a real greenhouse effect in the atmosphere. If warm air parcels 100 km across are rising through the steady state atmosphere, that hardly represents a condition in which mass and/or heat is not transferred between the mass and the surrounding air.

        What it comes down to is gravity being the driver of atmospheric pressure and temperature with slight variations in the linearity due to the effect of solar heating.

        Of course, the real situation will move away from the ideal but the ideal reference in the IGL refers to the difference between the ideal state and the real state of various gases. However, the reality never strays far from the ideal state, especially near STP.

        • Bobdesbond says:

          So is PV=nRT a universal law or is it not?

          • JDHuffman says:

            des, as with all physics, one must know how it applies. With the Ideal Gas Law, it is important to understand “residual property”.

            https://en.wikipedia.org/wiki/Residual_property_(physics)

          • Bobdesbond says:

            Yeah – nice googling, and pretending you already knew the term. As you are so knowledgable about this concept, I’m sure you will be able to quantify this residual for me as a function of pressure. I will wait expectantly for your answer.

          • Bobdesbond says:

            To assist you, please look at this graph and tell me whether real gases converge to or diverge from ideal gases at ultra-low pressures. (Make sure you pretend to be a scientist and actually look at the scales on the axes. I assume you understand what ‘atm’ refers to).

            https://tinyurl.com/Real-vs-Ideal-Gas

          • JDHuffman says:

            Well des, your desperate qualifier dis-qualified me.

            How does a scientist pretend to be a scientist?

            Enjoy your desperation.

          • Bobdesbond says:

            When the real science comes in, you abandon your little foray into science, as you must, and return to the ad hom.

            Let me repeat, real gases CONVERGE TOWARDS ideal gases as pressure decreases.

            And seriously, the pressure at 15000 metres is still more than 10% of 1 atmosphere. You seem to be under the impression air is almost non-existent at those altitudes.

          • Gordon Robertson says:

            bobdes…”please look at this graph and tell me whether real gases converge to or diverge from ideal gases at ultra-low pressures.”

            It’s not a matter with the curve whether gases diverge from the ideal state, it comes down to what other heat sources are affecting the curve.

            IGL = PV = nRT

            If you affect T with solar heating of the stratosphere or rising warm air from the surface, you are going to affect one of the variables in PV = nRT.

            T = nR/PV

            n is constant as is R and V, That means atmospheric pressure is being SLIGHTLY affected by outside temperature influences. Therein lies the SLIGHT curve in the graph with altitude.

          • Bobdesbond says:

            No, V is not constant. The average height of the tropopause is gradually rising as we warm. So the warmer troposphere has greater volume, and the cooler stratosphere has less volume.

          • JDHuffman says:

            des resorts to false accusations: “When the real science comes in, you abandon your little foray into science, as you must, and return to the ad hom.”

            Nothing new.

          • Bobdesbond says:

            You stopped talking science and started attacking the person instead. In what way is that false?

  49. Olof R says:

    UAH v6 TLT is clearly an outlier in the AMSU-era. It has the lowest trends of all troposphere datasets I’m aware of.

    Here is a chart of troposphere trends, 1998-2017, in currently updated datasets:

    https://drive.google.com/open?id=1AS7mxUSYUpEW7dOjyvT6BiRsYdkvMEJm

    Dr Spencer and Christy’s blind belief in NOAA-15 vs NOAA-14 is not supported by any other data.
    As shown in the following chart, the “choices” made by UAH has resulted in a significantly lower trend during the period of overlap between the both satellites:

    https://drive.google.com/open?id=181P3P7qKKGRLGJWENmEMgji4ulPEKEgp

    Here is another comparison, TMT/AMSU-5 versus the neighbour AMSU channels 4 and 6:

    https://drive.google.com/open?id=0B_dL1shkWewaSkpnOUxBVGNpWm8

    The figure suggests that UAH’s NOAA-15 choice is wrong, whereas RSS only is half wrong due to their “non-choice” of keeping both satellites and splitting the potential errors..

    The novel AMSU diurnal drift correction in UAH version 6 has not been properly validated. It is a disturbing fact that v6 significantly disagrees with 5.6, because the latter is using “reference” AMSU-satellites only, with no or little diurnal drift.

    RSS went the other way, their validated their new v4 drift correction using reference AMSU data similar to UAH 5.6

    Furthermore, the claim by Dr Christy that RATPAC A is unadjusted after 1998 is wrong. RATPAC A is adjusted by cutting the station data series at metadata breakpoints, and letting the neighbour stations carry the regional trend over the breakpoint..

    • bdgwx says:

      That is an interesting presentation of datasets. It is certainly consistent with the idea that UAH is the outlier. It actually looks like the satellite datasets in general are running lower compared to balloon and reanalysis.

    • Bindidon says:

      Olof R

      Thanks for the info.

      But something weird happened with the GoogleDrive chart the second link points to.

    • Gordon Robertson says:

      olof…”UAH v6 TLT is clearly an outlier in the AMSU-era. It has the lowest trends of all troposphere datasets Im aware of.”

      Excuse my French, or Norwegian, but you’re full of crap. Where do you get off presenting anonymous bar graphs to support your propaganda?

      Or are you Bindidon using another nym?

      • Olof R says:

        If you don’t have anything sensible to say, so please shut up..

        All data I use is freely available on the internet, and I can direct you to any source and explain every single calculation..

        My data is not more anonymous than that of Spencer & Christy. You know, UAH hasn’t even published or archived their weighting functions (RSS and STAR has of course). “TLT” is different for different suppliers. There isn’t even a common ground how e g TMT should be calculated from the radiative transfer theory, so the weighting functions differ between the suppliers.
        Luckily, this only causes minor differences as long as the underlying data mainly comes from the troposphere

        But again, I challenge You Gordon Robertson (or Dr Spencer, Christy, or anyone else) to find any data that supports the low trend of UAH v6 TLT or TMT during the AMSU-era, or data which supports that NOAA-15 is a better choice than NOAA-14.

        I still claim that such data doesn’t exist…

        • E. Swanson says:

          Olof, Gordo doesn’t do data, he(?) just endlessly repeats his denialist claims and ignores any efforts which prove that he’s wrong. HERE’s one of his long rants, one of several this month repeating his claim that the Greenhouse Effect violates the 2nd Law of Thermodynamics.

          Worse, he still can’t understand that the Moon rotates as it orbits the Earth, an fact which is obvious to any casual observer, as shown in this NASA animation.

          • JDHuffman says:

            Swanson, it’s amazing that you’re still clinging to such pseudoscience.

            For you to believe the Moon is rotating on its axis, you must also believe a racehorse is rotating on its axis, as it runs an oval track. So, stretch out the oval track into a straight track. Is the horse now also rotating on its axis? That would look rather funny, huh?

            Just as funny as all your pseudoscience.

          • bdgwx says:

            JD, the moon is rotating. If you make the racetrack straight you are taking out the turns and the need for the horse to turn or rotate its orientation. You can’t just change the shape of the track and pretend like the analogy works out the same. The horse is clearly rotating. Just because it is doing so very slowly doesn’t mean it doesn’t complete a full 360 degree rotation on each lap. I can’t believe we are having this conversation.

          • JDHuffman says:

            Wrong bdgwx. The horse only APPEARS to be rotating on its axis, from outside the track. Inside the track, you only see one side, as we only see one side of the Moon. The apparent rotation is due to the orbital motion.

            I can’t believe we are having this conversation.

          • bdgwx says:

            JD, you have it backwards. The Moon only appears to not be rotating from the perspective of an observer on Earth because it happens to be rotating about its axis at the same rate as its orbit around Earth. If the Moon were rotating at any other rate whether it be slower, faster, or even with no angular momentum at all then Earth observers would see different faces of the Moon at different times and thus perceive the rotation. Observers on the Moon do see the stars changing positions in the sky. The Moon does have angular momentum about a vertical axis through the center of mass. Therefore the Moon is rotating.

          • JDHuffman says:

            bdgwx, you display your ignorance of orbital motion. An orbiting body, not rotating on its axis, represents the same motion as the Moon, and a racehorse.

            But, you sink even lower by touting falsehoods: “The Moon does have angular momentum about a vertical axis through the center of mass.”

            As I’ve advised others, learn some physics, then clean up your act.

        • Gordon Robertson says:

          olof…” so please shut up..”

          Now we’re on the same wavelength. Binny would still be ranting if I told him to shut up.

          **********

          “All data I use is freely available on the internet, and I can direct you to any source and explain every single calculation..”

          Let me guess, the data came from NOAA or GISS, who specialize in fudging data retroactively, when they are not doing it in the present.

          ************

          “I challenge You Gordon Robertson (or Dr Spencer, Christy, or anyone else) to find any data that supports the low trend of UAH v6 TLT or TMT during the AMSU-era, or data which supports that NOAA-15 is a better choice than NOAA-14”.

          I believe Roy has already explained that, and quite well. Were you absent that day?

          • Olof says:

            No evidence?
            So sad, Loser..

          • Olof R says:

            PS
            I Have noticed that Dr Spencer refers to anecdotal evidence, a NASA engineer told him that NOAA-15 had “Cadillac Calibration”.
            That’s convincing….

  50. Entropic man says:

    Gordon Robertson

    “I dont see how PV could possibly be a constant. If P drops to 1/3 the P at sea level, that would suggest V expands by 1/3, which is nonsense in the context of the atmosphere. Furthermore a constant PV implies the temperature is constant, if n remains constant.”

    I don’t know if you remember my original post, but I did indeed assume constant n, R and T.

    Forgive a certain pedantry, but you made a mistake in calculation.

    Under constant nRT conditions, if you reduce P to 1/3 of its initial value you are reducing it by a factor of three and would need to increase V by a factor of three to keep PV constant.

    • Gordon Robertson says:

      entropic….”Under constant nRT conditions, if you reduce P to 1/3 of its initial value you are reducing it by a factor of three and would need to increase V by a factor of three to keep PV constant”.

      I did mention that. I said you’d need to adjust T or n to accommodate a constant PV. I also pointed out the folly of claiming that condition in the atmosphere. In a lab, in a piston/cylinder arrangement, you could adjust T or n to keep PV constant. There is no way in the atmosphere to bring that about.

      That is especially true with gravity creating the pressure differential.

  51. gbaikie says:

    As I mentioned above, the hottest surface air temperature which is caused by sunlight
    (not forest fire, volcanic heat, etc).
    Occured during a glacial period at basin floor of the dried up Mediterranean Sea.

    Or at one of the coldest periods in Earth’s history, one had a modestly large land area with the highest air surface temperature AND ground surface temperatures which have ever occurred on Earth- which is heated by sunlight.

    • Craig T says:

      Do you have a source for claiming the Messinian salinity crisis made it to 80° C? The Wikipedia page you gave says that temperature was a theoretical temperature maxima without linking to a source or claiming it made it that high.

      More important, what point are you making? LandSat has measured surface temperatures in the Lut Desert as high as 71° C. I think everyone here agrees the Earth is heated by sunlight.

    • gbaikie says:

      “”Craig T says:
      April 29, 2019 at 6:57 PM
      Do you have a source for claiming the Messinian salinity crisis made it to 80° C? The Wikipedia page you gave says that temperature was a theoretical temperature maxima without linking to a source or claiming it made it that high.”

      I agree with theoretical calculation that lower elevation would make as hot as 80 C. And it’s the lowest elevation I am aware of which has been discovered to have existed in any time in Earth history.

      Does anyone disagree that such a high temperature is likely when at such low elevation [and in a region of the world which gets enough sunlight- [or if such low elevation existed and was in or near the arctic regions, it wouldn’t get to such temperatures, because it lacks enough sunlight].

      To answer question, I don’t have a source reference to give to you.
      But do you agree that one would find the highest air surface temperature in low elevation areas [as general matter] and that one would expect a dried out Mediterranean Sea to have very high air temperatures?

      “More important, what point are you making? LandSat has measured surface temperatures in the Lut Desert as high as 71° C. I think everyone here agrees the Earth is heated by sunlight.”

      I believe that is ground temperature and having ground temperature near 70 C is fairly common, but Lut Desert commonly has high ground temperature and 71 C is quite warm compared to other natural terrain.

      I will note that it seems some articles about Lut Desert seem to suggest the 71 C is air temperature, and I don’t think that is true.
      As far as measuring in natural terrian – or proper siting for weather station, I believe the record for highest air temperature is Death Valley:

      “On 13 September 2012 the World Meteorological Organisation disqualified the record for the highest recorded temperature, exactly 90 years after it had been established at El Azizia, Libya, with a measurement of 58°C. The official highest recorded temperature is now 56.7°C (134°F), which was measured on 10 July 1913 at Greenland Ranch, Death Valley, California, USA.”
      http://www.guinnessworldrecords.com/world-records/highest-recorded-temperature/
      So, it’s 56.7 C in terms of air temperature in a properly sited weather station [in white box 5 feet above the ground, and etc]

  52. CO2isLife says:

    Dr. Spencer, Tony Heller made a video on this subject, and what he claims is that the RSS data being published is simply the upper end of the confidence interval. If that is in fact what is happening, there will only be 2.5% of data points that actually match or exceeds the graph. More importantly, the probability of reaching that outer band is 2.5%, but that is for a single data point. For every data point to be lined up on the outer band, it would be 0.025×0.025×0.025 or statistically 0.0000000000. If in fact they are simply using the outer confidence limit as the actual data set any 1st-year statistics student should be able to expose the fraud in a congressional hearing. Once again, basically none of the raw data will match the published data, almost all of the raw data will be below the published data, and there is absolutely no honest reason to use the upper band as a legitimate representation of reality.

    https://youtu.be/WNyQ7bHbVQQ

    • bill hunter says:

      Sounds like total BS. If adjustments were made that simply changed all the data points, and I don’t know if drift adjustments do that or not but any comprehensive adjustment should Tony Heller is probably looking at a result that merely coincidentally is near the error margins and his conspiratorial mind dreamt up the rest.

      • Gordon Robertson says:

        bill…”Sounds like total BS.”

        Heller is an expert in analyzing and working out problems in complex systems, far more complex systems than AGW bs models. He is eminently qualified to offer his insight.

        • Bill Hunter says:

          This isn’t an analytical issue Gordon. Its a coincidental number one could expect to find with any adjustment that was data wide. How could he rule out all the other possible reasons the numbers are coincidental using analysis? A crystal ball?

        • Bobdesbond says:

          Would you highlight SPECIFIC instances of where Heller has acquired and displayed this expertise. Please show that you have evidence that does not come from Heller’s mouth.

          • Mike Flynn says:

            B,

            You wrote –

            “Please show that you have evidence that does not come from Heller’s mouth.”

            A backhanded non-appeal to authority? How bizarre!

            I suppose you would be stupid enough to claim Gavin Schmidt or Michael Mann are “climate scientists”! Maybe you could provide some reason why anybody would take any notice of your demand that they provide anything in response to your stupid demands?

            You cannot even produce evidence that increasing the amount of CO2 between the Sun and a thermometer makes the thermometer hotter. That is because your pseudoscientific belief is based on the delusions of self appointed experts such as the aforementioned Schmidt and Mann.

            Carry on with the gotchas, ad-homs, and pointless irrelevancies. I suppose it’s better than having to admit that the Earth has actually cooled over the last four and a half billion years. So much for your undefinable and unquantifiable “greenhouse effect”, eh?

            Cheers.

        • Bobdesbond says:

          Whenever you’re ready Gordon.

    • Bobdesbond says:

      Hahaha …. tony Heller …. you’re a comedian!
      Remind me – what are Heller’s qualifications in the field of climate science or anything related?

      • Gordon Robertson says:

        bobdes…”Remind me what are Hellers qualifications in the field of climate science or anything related?”

        from Tony’d blog:

        “I have degrees in Geology and Electrical Engineering, and worked on the design team of many of the worlds most complex designs, including some which likely power your PC or Mac. I have worked as a contract software developer on climate and weather models for the US government”.

        One of your luminary climate alarmists, Mann, is a geologist. What are his credentials that allow him to spout off about climate science and insult accomplished female scientists like Judith Curry just because she disagrees with him?

        However, Heller also has a degree in electrical engineering, which puts him light years ahead of Mann in solving problems. That’s what Heller does, he solves problems.

        Heller has worked as a software developer for climate and weather models for the US government.

        I’d say the man is eminently qualified to do what he is doing, analyzing temperature and climate data and revealing the lies in it.

        • Bobdesbond says:

          Key words …. “from Tony Heller”. Has anyone ever verified his claims? I’ve never heard any employer try to own him.

    • Craig T says:

      Heller claims “It is clear what [Mears] did – he eliminated the blue error interval, and started using the high side of the interval as his temperature.” He offers no evidence other than RSS V4 lines up near the upper error bar of V3. Dr. Spencer has already posted his views of RSS V4 without accusing fraud.
      http://www.drroyspencer.com/2016/03/comments-on-new-rss-v4-pause-busting-global-temperature-dataset/

      • barry says:

        That video contains so many distortions and outright falsehoods that it makes your head spin.

        No, RSS didn’t simply tack the mean estimate onto the upper bound of the previous version’s upper limit. It was a full methodology change, not just some arbitrary number shift.

        Unless Heller is a complete morn (possible), he must know that RSS revised the methodology, and got the results that way. Either his BS is deliberate, or he has a serious mental deficiency. I go with the former.

        • steve case says:

          Barry said May 1, 2019 at 1:06 AM
          …No, RSS didn’t simply tack the mean estimate onto the upper bound of the previous version’s upper limit. It was a full methodology change, not just some arbitrary number shift.

          You’re right changes aren’t arbitrary they’re done for valid reasons. Dr. Josh Willis corrected the ocean cooling that the Argo floats originally found back in 2008, Dr. R. Steve Nerem corrected the sea level from Satellite data last year. GISSTEMP makes several hundred valid corrections to their Land Ocean Temperature Index every month and all these modifications seem to form a pattern, but that’s just the way it shakes out. So nothing to see here, move along right?

          http;//www.cagle.com/working/091125/allie.jpg

          This sort of thing has been noticed for a long time, that cartoon is coming up on ten years old.

        • barry says:

          Don’t avoid the point. What did you think about the method paper on the RSS revision, Steve? What did they do that was scientifically unjustified?

          That’s the least you have to do before opining. Otherwise you’re just blowing smoke.

          • steve case says:

            Barry says: May 2, 2019 at 5:24 AM
            Don’t avoid the point. What did you think about the method paper on the RSS revision, Steve? What did they do that was scientifically unjustified?

            I said: “You’re right changes aren’t arbitrary they’re done for valid reasons.” I’m in no position to claim the RSS revision was unjustified. What I’ve done is point out that the changes from various Climate Science organizations such as RSS form a pattern.

            I’m looking for you to acknowledge that there is a pattern or tell me that I’m wrong there isn’t a pattern.

            I’m not alone seeing this pattern:

            ____________

            Roy W. Spencer, Ph. D. says:
            July 6, 2017 at 9:22 AM
            well, it does seem unusual that virtually all temperature dataset updates lead to ever-more warming. Very curious. Must be some law of nature at work here.

            http://www.drroyspencer.com/2017/07/comments-on-the-new-rss-lower-tropospheric-temperature-dataset/

            ____________

            So Barry (I can be condescending too) do you see pattern or not? Is it analogous to those color blind charts where people with color blindness (deniers) see one number and those with normal vision (believers) see another or no number? (Those are some interesting charts) by the way.

          • barry says:

            Depending on the time period, I can agree that the majority of revisions increase trends.

            For the centennial record (from 1900 or earlier), this is not the case. The effect of all changes is still a lower long-term trend – because the lowering of the trend from the SST change was very large.

            Can you acknowledge that?

            I’ve also many times linked you to skeptics doing full on temp records, and these result either corroborate the official records, or produce higher trends.

            Can you acknowledge that?

            Your ‘case’ here is pretty simple: If you add up how many adjustments raised the trend rather than lower it (never mind time periods), you’ll find the majority produce warming. And because the majority of adjustments support the notion of a more warming world, this is almost certainly (if not absolutely certainly) a result of data fraud from researchers with AGW agendas.

            I have you right, yeah?

          • steve case says:

            Barry says: May 3, 2019 at 7:30 AM
            Depending on the time period, I can agree that the majority of revisions increase trends.

            Yes they do, thanks

            For the centennial record (from 1900 or earlier), this is not the case. The effect of all changes is still a lower long-term trend – because the lowering of the trend from the SST change was very large.
            Can you acknowledge that?

            Probably so, and when did this change occur?

            I’ve also many times linked you to skeptics doing full on temp records, and these result either corroborate the official records, or produce higher trends.
            Can you acknowledge that?

            I learned to diagram sentences in the 8th grade, and I’m having trouble trying to figure out what you said.

            Your ‘case’ here is pretty simple: If you add up how many adjustments raised the trend rather than lower it (never mind time periods), you’ll find the majority produce warming. And because the majority of adjustments support the notion of a more warming world, this is almost certainly (if not absolutely certainly) a result of data fraud from researchers with AGW agendas.

            Whereas you can guess what I think, what I post is objective. That GISSTEMP has made nearly 100,000 changes to their Land Ocean Temperature Index since 1997 and form a pattern is a matter of fact. Why those changes have been made and form a pattern is matter of opinion.

            I have you right, yeah?
            You do know what I think. And I know where you are coming from.

          • Bill Hunter says:

            Barry – “For the centennial record (from 1900 or earlier), this is not the case. The effect of all changes is still a lower long-term trend because the lowering of the trend from the SST change was very large.”

            Sure that works because there always has been too much warming in the past and not enough currently. Push down the middle you lower the long term trend but exaggerate the short term one which actually makes more sense considering the history of emissions. Unfortunately its being done by the same suspects too stupid or too bought in or both to have noticed the problem earlier. But hey they were excited and scared.

  53. Gordon Robertson says:

    entropic….”If you want to calculate the pressure profile for an atmosphere you use the barometric formula.

    https://en.m.wikipedia.org/wiki/Barometric_formula

    **********

    Look at the first equation, it is essential Gay Lussac’s contribution to the IGL that P1/T1 = P2/T2. However, that would produce a linear relationship whereas the actual P – T relationship has a slight exponential shape.

    If you look at the shape of the curve at your link, it is essentially linear over the first 5 kilometres altitude. If you drew a straight line from the 1500 hPa y-intercept to the 10 km intercept on the x-axis, it would be close to a straight line in the upper portion of the curve.

    From 5 km it begins to deviate somewhat and that can be explained by the action of solar UV in the stratosphere. UV warms O2 molecules in the stratosphere making it warmer than would be expected. That causes a curve in the natural relationship between P and T at higher altitudes.

    I have argued that the atmosphere has a gravity-induced static component that can be described by the IGL and a dynamic component which could be attributed to warmer air rising and affected the natural P-T linear relationship. The effect of the dynamic is minimal, however, as you can see from the shallow curve at your link.

    It is obviously gravitational force that is the controlling factor.

    • Gordon Robertson says:

      correction, that should be a 1000 hPa y-intercept, not a 1500 hPa intercept.

      • Entropic man says:

        Gordon Robertson

        So far we’ve mention d Guy Lussac’s law, the Ideal Gas Law, the barometric equation and the lapse rate calculation. All play a part in defining atmospheric conditions at Earth’s surface.

        None of the variables and constants involved can be described as THE controller, though if you change any of the variables, you see a change in the equilibrium state of the atmosphere.

        Actually we have both been oversimplifying. To fully describe the atmosphere you need to solve the Navier-Stokes equations, partial differential equations with 40 variables.

        https://en.m.wikipedia.org/wiki/Navier%E2%80%93Stokes_equations

  54. Gordon Robertson says:

    norman…”gallopingcamel

    I generally like your posts. You seem intelligent and thoughtful”.

    That’s an insult to a rugby player. ☺

    Cam would be drubbed for that in the rugby clubhouse. Rugby teams hold courts and if evidence was presented that he even ‘seemed’ intelligent and thoughtful, he’d be fined.

    I got fined as a social member on a tour for allowing myself to be billeted with a team rowdy.

    • Bill Hunter says:

      Hmmm, sounds like anybody who got fined and was actually on the rugby team got railroaded.

      • Gordon Robertson says:

        bill hunter…”Hmmm, sounds like anybody who got fined and was actually on the rugby team got railroaded”

        That’s the idea, and the fun in it. The judge finds different ways to fine everyone, and the proceeds go to a good cause…beer.

  55. ren says:

    The jet stream press in the Southwest US. Another wave of rain will fall in the central US. Circulation remains unchanged.

  56. PhilJ says:

    “Firstly, increasing the number of emitters does not increase the rate of emission”

    Think i’ll add that to my list of knee slappers…

    • Entropic man says:

      Odd sense of humour.

      As an analogy, consider a light bulb in an electric circuit. We’ll ignore other lossesto keep it simple. The power supply is designed to produce a constant 100W. The bulb emits 100W of light.

      I now wire a second bulb in parallel with the first. The total energy flow remains 100W and each bulb emits 50W.

      As long as I limit the input power to 100W, the amount of light emitted remains the same No matter how many extra bulbs I add, the total light output remains 100W.

      The atmosphere is similarly limited. When the rate of energy flow to the top of the atmosphere is the limiting factor, increasing the number of emitters will not increase the rate of emission.

      • bobdroege says:

        For CO2 the amount of emission is determined by the temperature and the concentration of the gas.

        So it does not depend on the amount of energy, but if there is not enough energy the gas will cool.

      • JDHuffman says:

        E-man, you have chosen an analogy that fits your belief system, but it does not fit reality.

        The molecules in the atmosphere are also exchanging energy with each other. If you add more CO2, there will be more molecules to receive energy from collisions with other molecules. And, they will radiate based on their energy. So even if the energy from the surface remains constant, more little radiators will mean more energy transfer to space, meaning a lowering of atmosphere temperatures, until a new equilibrium is reached.

        • bobdroege says:

          And more energy transfer back to the surface which gets absorbed and makes the surface more hotter which also does not violate the second law of thermodynamics although it’s true that it violates JD pseudoscience.

          • JDHuffman says:

            Sorry bob, but that’s not how radiative heat transfer works. You should have learned something from the long discussion about the plates.

            But, I guess not…

          • bobdroege says:

            Yeah, I try not to learn wrong things from guys who repeatedly demonstrate a lack of scientific chops.

            Like you.

          • Mike Flynn says:

            b,

            You’ve hit the nail on the head. That is no doubt why the Earth’s surface has cooled over the last four and a half billion years!

            Or do you think the cooling was due to a magic spell, which has been broken through the wizardry of the pseudoscientific likes of Hansen, Schmidt and Mann?

            What a fool you are – and a gullible one to boot.

            Cheers.

          • bobdroege says:

            Flynn,

            You are the gullible one if you think it would take 4 billion years and change for the earth to cool from a molten state.

            that is unless it was being heated from somewhere.

          • bobdroege says:

            So JD,

            I’ll take a trip down your rabbit hole.

            I guess you think that the down-welling infrared gets reflected from the surface.

            But then once reflected it can then get abzorbed by the CO2 which then collides with the nearby nitrogen and oxygen molecules warming the atmosphere, which then warms the surface by conduction or convection.

            Cause it doesn’t make it to space.

            eh?

  57. Entropic man says:

    JDHuffman

    “I especially like that one because that translates to adding more CO2 to the atmosphere does not increase DWIR. Just the opposite claimed by the bogus GHE.”

    “Increasing the emitting area DECREASES the flux, for a given energy balance. You had better check your calculation. Hint: About 8 W/m^2 decrease.”

    As I said, the OLR emission decreases as the emitting altitude increases. Since the energy flow from the surface does not decrease, energy which would otherwise escape to space has to go elsewhere, ie into increased DWLR. As long as the CO2 is not saturated the number of CO2 molecules does not affect the amount of DWLR.

    Again, read what I said. “Given temperature”.

    A pulse of CO2 immediately raises the emission altitude, but the rise in surface temperature wlii not immediately increase. That requires energy,which takes a while to accumulate.

    • JDHuffman says:

      E-man, you are still confused by your pseudoscience.

      This is what you are claiming: “The surface can warm the atmosphere, but the atmosphere cannot emit to space.”

      You’ve got the pseudoscience correct, but the physics is WRONG.

      • Entropic man says:

        “This is what you are claiming: The surface can warm the atmosphere, but the atmosphere cannot emit to space.

        Where did that come from?”

        This whole discussion has been about the mechanism by which increasing the amount of CO2 in the atmosphere decreases the amount of OLR radiated to space by the atmosphere. I’m not going to suddenly claim that the atmosphere cannot emit to space.

        • JDHuffman says:

          “…energy which would otherwise escape to space has to go elsewhere, ie into increased DWLR.”

        • Mike Flynn says:

          Em,

          You wrote –

          “This whole discussion has been about the mechanism by which increasing the amount of CO2 in the atmosphere decreases the amount of OLR radiated to space by the atmosphere. ”

          Fine. The temperature does not drop as rapidly where the atmosphere contains more CO2 and H2O. It doesn’t heat heat up as rapidly either.

          At night, temperatures still fall – rapidly, slowly – they still fall.

          Surely you are not trying to imply that increasing the amount of CO2 and H2O between the Sun and a thermometer makes the thermometer hotter? Arid tropical deserts have the hottest temperatures on Earth – due to a severe lack of H2O in the atmosphere!

          As a GHE worshipper, you are not helping the cult objectives much. Maybe you could find a useful description of the GHE. That might help things along. You don’t need to thank me, I’m here to help.

          Cheers

    • Mike Flynn says:

      Em,

      You wrote –

      “A pulse of CO2 immediately raises the emission altitude, but the rise in surface temperature wlii not immediately increase. That requires energy, which takes a while to accumulate.”

      A nice piece of meaningless pseudoscientific nonsense.

      Pulse of CO2? Raises the emission altitude? A rise in surface temperature that does not immediately increase? Energy which takes a while to accumulate?

      Stupidity piled upon delusion!

      Try using the language of science, rather than that produced by your pseudoscientific gibberish generator. You will see quickly why real scientists deride the pretentious nonsense uttered by “climate scientists”.

      Carry on regardless.

      Cheers.

      • JDHuffman says:

        Yeah Mike, I also laughed at the “pulse of CO2”.

        • Bobdesbond says:

          What exactly do you find amusing about that terminology? Should he really use such contorted phrases such as “injection of CO2 into the atmosphere of short duration” instead of simple conceptual words just to avoid your unscientific scorn?

          • Mike Flynn says:

            B,

            More stupid than amusing, but laughable anyway. Your “simple conceptual words” are just more pseudoscientific gibberish. I guess (and of course, I have to guess, because pseudoscientists persist in using the jargon of gibberish), that the “simple concept” that you and other foolish GHE enthusiasts are trying to communicate is belief in the impossible.

            You seem to believe that increasing the amount of CO2 between the Sun and a thermometer, makes the thermometer hotter! This is plainly nonsense, so you have to dream up spurious sciencey sounding nonsense – “injection of CO2 into the atmosphere of short duration”. Completely meaningless. Is the “injection of CO2 into the atmosphere” supposed to increase the amount of the Sun’s heat, making the thermometer hotter? Or are you going to claim that this only happens at night, resulting in temperatures falling anyway?

            You are a fool. You deserve all the derision and scorn that you rightfully attract. If you are are stupid enough to believe that the definitions of scorn and derision are different if applied to pseudoscientific GHE believers, or real scientists, then you are in good company. I’m sure that the average delusionally psychotic self appointed “climatologist” would welcome your support.

            Neither you nor the rest of the deluded GHE worshippers can even define this mysterious deity you worship so assiduously, and yet you still wonder why you are the object of scorn and derision on an ongoing basis!

            Maybe you need to pray harder.

            Cheers.

          • Entropic man says:

            Mike Flynn

            Allow me to adjust your own misuse of terminology.

            “increasing the amount of CO2 between the Sun and a thermometer, makes the thermometer hotter! ”

            This is insufficiently precice to be meaningful, but two small modifications make it a true statement.

            “increasing the amount of CO2 (in the Earth’s atmosphere) between the Sun and a thermometer (on the surface of the Earth), makes the thermometer hotter! “

          • E. Swanson says:

            MF, as usual, continues to incorrectly state the action of CO@ on climate when he writes:

            You seem to believe that increasing the amount of CO2 between the Sun and a thermometer, makes the thermometer hotter! This is plainly nonsense, so you have to dream up spurious sciencey sounding nonsense…

            A Correctly framing of the problem is that it’s not the incoming SW EM radiation from the Sun, but the outgoing IR EM radiation from the Earth to deep space where the Greenhouse Effect mostly occurs. To be sure, there is some CO2 absorp_tion of incoming SW, however, the main effect involves the IR portion of the EM emissions.

            One would think that Mikey would understand that by now, instead of repeatedly spewing out his wrong claim. Of course, his continued denialist activity means that Mikey is either hopelessly ignorant (which he surely isn’t), delusional, or is intent on spreading disinformation to interrupt and distort any attempt at discussion on this blog. Not unlike a typical racist who only sees the color of one’s skin or religion, instead of the entire person within.

          • Mike Flynn says:

            ES,

            You wrote –

            “A Correctly framing of the problem is that it’s not the incoming SW EM radiation from the Sun, but the outgoing IR EM radiation from the Earth to deep space where the Greenhouse Effect mostly occurs. To be sure, there is some CO2 absorp_tion of incoming SW, however, the main effect involves the IR portion of the EM emissions.”

            There is no problem to be framed. You are confused. All radiation longer than visible light is infrared by definition. Only stupid pseudoscientific GHE worshippers attempt to confuse the issue by using vague and ill-defined terms such as “SW EM” and “outgoing IR EM”, hoping that nobody will wake up to to their nonsensical gibberish.

            You cannot even adequately define this “Greenhouse Effect” can you? You seem to be claiming that it “mainly occurs” when “outgoing IR EM radiation from the Earth to deep space . . .” happens. When radiation of any wavelength leaves the Earth, and exceeds the amount being absorbed, the Earth cools. Only an idiot would believe that a body losing energy is experiencing a rise in temperature. Or a pseudoscientific GHE believer, of course.

            Good try playing the racism card. Why not mention the Holocaust, or follow the example of Hansen and his “trains of death”? I must be a typical racist, agreeing with forensic pathologists who can even determine racial characteristics from a few old bones on occasion. You could always acquaint yourself with a bit of real science in the form of taxonomy, but then you would have to abandon some of your politically correct propaganda, and accept that racial differences exist. Would you like me to list a few of the taxons involved, or do you think you could find out for yourself?

            Best stick with your CO2 heating pseudoscience, eh?

            Cheers.

          • Tim Folkerts says:

            “All radiation longer than visible light is infrared by definition.”

            Two lines into your reply and you are already making an error. This is doubly ironic since you are making a point about correct terminology! By most definitions, IR stops at 1 mm; any thing longer than that is “microwave” or “radio”.

            “attempt to confuse the issue by using vague and ill-defined terms”</i<
            Does "incoming SW EM radiation from the Sun" *really* confuse you??? There is radiation from the sun. It is electromagnetic radiation. Some comes in toward the earth. This radiation is concentrated at wavelengths that would generally be consider "short" — from ~ 100 nm to ~ 4000 nm.

            Calling this "incoming SW EM radiation" seems about as simple and concise and descriptive as you can get.

            Similarly there is outgoing radiation leaving the earth. This thermally generated electromagnetic radiation is concentrated at longer wavelengths — from ~ 4 um to ~ 100 um in a band know as "infrared".

            Calling this "outgoing IR EM radiation" seems about as simple and concise and descriptive as you can get.

            Yet you consider this "nonsensical gibberish". What specifically in those terms confused you?

          • E. Swanson says:

            MF wrote:

            You are confused. All radiation longer than visible light is infrared by definition.

            The visible portion of the solar spectrum is part of the Short Wave length energy arriving from the Sun. The Infrared EM radiation is that portion of the spectrum which leaves the Earth after the energy from the Sun has been absorbed at the surface or in the atmosphere, etc. The still longer wavelengths are are not considered to be infrared, as I understand it, such as the microwave emissions measured with the MSU/AMSU instruments used for Dr. Roy’s monthly brightness temperature analysis. The point is that the energy flowing in to the Earth’s climate system is that short wavelength spectrum, while that energy leaving after absorp_tion is mostly in the long wavelength portion. Of course, some of the SW energy is reflected by clouds, ice and snow as well as by some other bright surfaces.

            But then you write:

            When radiation of any wavelength leaves the Earth, and exceeds the amount being absorbed, the Earth cools. Only an idiot would believe that a body losing energy is experiencing a rise in temperature.

            Here’s a counter example for you. Place a pan on a stove and heat it on low. It’s temperature will increase until the heat loss matches the energy supplied. Now, turn up the setting on the stove a bit. You will find that the pan’s temperature will increase, even though it’s cooling rate has increased. That’s because at steady state, the energy lost (cooling) equals the energy supplied (heating). The equilibrium temperature is the result of that balance of energy in minus energy out.

            You are clearly missing the fact that the Earth is constantly being warmed by Sunlight while at the same time it’s loosing energy, i.e., “cooling”. However, these processes balance out over the annual cycle, such that year-to-year fluctuations on a global scale appear as small variations about a mean value. Mankind’s modification of the environment, including the addition of CO2, is interfering with that cooling process, which appears to be changing the temperature balance point and warming the surface, a fact now well established by many observations, including those of this blog’s host.

          • Mike Flynn says:

            TF,

            You waffle about “most definitions”, as though an appeal to unstated authority constitutes fact.

            Here’s at least one author who agrees with me –

            “Infrared radiation (IR), or infrared light, is a type of radiant energy that’s invisible to human eyes but that we can feel as heat. All objects in the universe emit some level of IR radiation, but two of the most obvious sources are the sun and fire.”

            If you don’t like my definition, by all means state your own before you use it. As I recollect, in real science, assumptions are generally stated explicitly, if room for misunderstanding is likely to occur.

            I understand why you are reluctant to avoid addressing the non-existence of a usefully described GHE. Spouting sciency sounding, yet undefined nonsensical gibberish avoids having to acknowledge that you have no clue, and can’t even define what you are talking about.

            The fact seems to be that the Earth has cooled for the past four and a half billion years or so, notwithstanding your attempts to avoid the observable fact. Carry on believing in a GHE which you cannot describe – as Thomas Jefferson said “But it does me no injury for my neighbor to say there are twenty gods or no God. It neither picks my pocket nor breaks my leg.”

            You seem to be confusing religion with science. You can’t define or describe your GHE, but you believe it has awesome powers, also not capable of being subjected to objective scrutiny. This is religion, or cultism. As long as it neither picks my pocket nor breaks my leg, why should I care?

            However, picking the citizenry’s collective pocket to the tune of billions of dollars, seems like the actions of a cult which benefits the few, at the expense of the many. I think you are a deluded and gullible follower of a group of collectively deluded individuals with a vested interest in keeping the cult going as long as possible, presumably hoping for underserved power and influence to accrue to them. Others can obviously draw their own conclusions.

            Fools or frauds all. Have fun following a ragtag mob of bumbling fumblers. I suppose it is cheaper than many other hobbies.

            Cheers.

          • Mike Flynn says:

            ES,

            You do not actually appear to be contradicting anything I said. Good. You acknowledge that I am correct – you just don’t like what I am saying.

            Waffling about pans and stoves is pointless, if you agree with what I said, which you appear to do. Your “counter example” doesn’t contradict anything I said. Try waffling about the Earth – it has cooled over the last four and a half billion years or so. How does that grab you?

            I don’t think I missed much. Only fools like Trenberth produce graphics which show the total surface of the Earth being warmed by the Sun at one time. Complete nonsense, but apparently widely accepted by the mentally challenged.

            The Earth (as a whole) is not being “warmed by sunlight” otherwise it would get hotter, wouldn’t it? In any case, Polar regions see no sun at all for about six months of the year – feel free to invoke the magic of the “average” at this point, if you wish. As Fourier pointed out, at night the surface loses all the heat of the day, plus a little of the earth’s internal heat. Hence cooling over four and a half billion years.

            If your sly appeal to Dr Spencer to ban me doesn’t have the desired result, maybe you could play the Holocaust or racism card. That might work, seeing as how you can’t seem to find any actual facts to show that my statements are not factual. That is pretty sad, given the length of my comments. Maybe you need to try harder.

            Cheers.

          • Tim Folkerts says:

            MF says: “Heres at least one author who agrees with me … “

            No. That author does NOT agree with your claim that “All radiation longer than visible light is infrared by definition.” Heck, he doesn’t even say IR is longer than visible light — just that it is invisible to human eyes. He only says that *at least some* invisible light is IR — not that *all* invisible light longer than 700 nm is IR. Brush up on critical thinking skills!

            Your attempted “appeal to authority of a random guy on the internet fails!

            You, however, have ‘defined away’ radio waves and microwaves!

            As for sources to support me … here are a few.
            The US FCC:
            https://www.ntia.doc.gov/files/ntia/publications/2003-allochrt.pdf
            NASA:
            https://science.nasa.gov/ems/07_infraredwaves
            DIN (Deutsches Institut fr Normung eV):
            Wikipedia:
            https://en.wikipedia.org/wiki/Infrared
            And a slew of university and business websites too numerous to link to …

            (Also, are you unconfused yet about elementary concepts like “IR” “incoming” “outgoing” and “EM”? You really should get a grip on basic terminology!)

          • Mike Flynn says:

            TF,

            I made no “appeal to the authority of a random guy on the internat. . .”. You just made that up, hoping that nobody would notice you were fabricating.

            Maybe you prefer NASA –

            “Since the primary source of infrared radiation is heat or thermal radiation, any object which has a temperature radiates in the infrared. Even objects that we think of as being very cold, such as an ice cube, emit infrared. When an object is not quite hot enough to radiate visible light, it will emit most of its energy in the infrared. For example, hot charcoal may not give off light but it does emit infrared radiation which we feel as heat. The warmer the object, the more infrared radiation it emits.”

            On the other hand, you could choose your NASA reference which says –

            “We know, from looking at an infrared image of a cat, that many things emit infrared light.”

            Pick one. Either all things with a temperature radiate in the infrared, or many things emit infrared light (implying some don’t). NASA says both, plus a few others.

            Anything beyond visible red in wavelength is infra – below, further on, red – visible light. This obviously includes wavelengths all the way to those of infinite length. You may subdivide for convenience to your heart’s content, but it still won’t create a GHE, will it?

            But all this is irrelevant isn’t it? You still cannot define your non-existent GHE in any useful way can you?

            Even less possible for you, is to come up with any explanation of why the Earth has cooled over the last four and a half billion years, or even why temperatures fall when thermometers are exposed to less radiation! Obvious to rational people – absolutely amazing and impossible to fanatical GHE cultists.

            Carry on Tim. I think you are stupid, ignorant, and deluded, but obviously others may differ in their opinions.

            Cheers.

          • Tim Folkerts says:

            Mike,

            You claimed “All radiation longer than visible light is infrared by definition.” This is what I have been addressing. IR is only the EM waves from ~ 700 nm to ~ 1 mm. Even longer wavelengths are NOT IR — they are microwaves and radio waves. EVERYONE AGREES WITH THIS! This is standard terminology. Radio waves are a thing.

            This is completely different from your current claim “Either all things with a temperature radiate in the infrared, or many things emit infrared light (implying some don’t).” [Even this claim is problematic — hot things radiate significant amounts of visible light along with the IR. And some things would radiate very little IR because they are so cold, like the cosmic *microwave” background radiation.]

            Man up and admit you were wrong in your first claim – admit that only SOME radiation longer than visible light is infrared by definition.

            Then we can address some of your other claims (many of which are actually just strawmen).

  58. Entropic man says:

    Bill Hunter

    You were asking about references for the effective radiating altitude. Try this one.

    https://scienceofdoom.com/2010/08/15/height-of-emission-of-olr-and-dlr/

    Tread carefully,because this is more detailed than most people care to go and the further you dig the more complex it gets.

    I tend to think of ERA and the tropopause together as the tropopause represents a temperature minimum, indicating that it is the region of the atmosphere which is losing most energy.

    • Mike Flynn says:

      Em,

      Your link is completely stupid. Here is a sample –

      “What is the effective height of outgoing longwave radiation? I.e., the radiation from the climate system that leaves the planet.
      What is the effective height of downward longwave radiation as measured at the surface?”

      “Effective height”? “Radiation from the climate system”? Does this fool not accept that climate is merely the average of past weather records? Just more sciencey sounding gibberish, by the look of it.

      Obviously written by a dimwitted GHE adherent.

      All matter above absolute zero radiates energy. It cannot be stopped. No energy “accumulation” or “trapping”.

      No amount of pseudoscientific gibberish will make inconvenient fact go away. CO2 possesses no heating properties, Gavin Schmidt is not even a scientist, and Michael Mann’s claim to be a Nobel Prize winner is is a figment of his delusional fantasy.

      Carry on regardless. Maybe you can apply your mental powers to trying to usefully describe the Greenhouse Effect (good luck), or explaining why the earth’s surface has cooled over the last four and a half billion years or so.

      Or just continue being a GHE nutter. Choices, choices!

      Cheers.

    • Bill Hunter says:

      Thanks for your efforts Entropic. I was looking for where CO2 emits from and the article and links focus either on water vapor or some proxy effective height of all emissions.

      However, its an interesting discussion with some good comments so its going to be enjoyable investigating it further.

  59. PhilJ says:

    Entropic,

    “increasing the number of emitters will not increase the rate of emission”

    If you increase the emissivity of the atmosphere ( by replacing o2 with h20 and co2 for example), you will increase the amount of IR emitted at any given temp.

    Your own anology demonstrates this.. The addition of bulbs reduces the output per bulb required to achieve the same total output.

    Just so, increasing the number of emmitters reduces the output per emmitter required (lower temp) to achieve the same total output.

    In short: increasing the emissivity of the atmosphere, increases the efficiency at which the atmosphere will cool….

    • Tim Folkerts says:

      “In short: increasing the emissivity of the atmosphere, increases the efficiency at which the atmosphere will cool….”

      The point you seem to be missing is that the atmosphere cools as altitude increases. Increasing the emissivity throughout the atmosphere means that the cooler at the top increases its emissivity and hence increased its efficiency at emitting IR to space. But cold air emitting efficiently radiates little energy!

      At the same time, the lower warmer air continues to emit efficiently, but much of this gets absorbed by the gas higher up! This leads to a decreases its efficiency at emitting IR to space.

      Cold air emitting efficiently emits less IR to space than warmer air emitting efficiently!

      In short: increasing the emissivity of the atmosphere, DECREASES the efficiency at which the atmosphere will cool!

      • Mike Flynn says:

        TF,

        In short, “you must be stupid, stupid, stupid” (from “The Rainmaker”).

        The point you seem to be missing is that a cooling atmosphere is experiencing a reduction in temperature. I know you don’t like it, or even want to accept it, but it is true by definition. If it cools quickly, it cools. If it cools slowly, it still cools.

        Trying to confuse the issue by blathering about efficiency of cooling is just the pointless obfuscation of the GHE true believer. Cooling is not heating. You really have no clue, have you? You cannot even cogently describe the GHE (because it cannot be done), but you are prepared to pretend to explain the way way in which the non-existent GHE operates!

        Are you really stupid enough to claim that reducing the amount of radiation reaching a thermometer makes it hotter? Or are you claiming that magical pseudoscientific climatological thermometers eventually get hot enough to melt, as the amount of energy they are exposed to is reduced to zero?

        Crackpottery at its finest. According to climatological crackpots, cooling means getting hotter, and reducing the amount of radiation reaching a thermometer makes it hotter! Next you’ll be claiming that Earth has heated up over the last four and a half billion years, rather than cooling – all due to the the operation of the invisible yet strangely powerful GHE!

        In short – stupid, stupid, stupid.

        Cheers.

        • Tim Folkerts says:

          Mike, in case you hadn’t realized, the top of the atmosphere is *already* cold! I didn’t claim the atmosphere is getting colder, just that the escaping radiation is coming from a colder region than before.

          Keep working on those critical thinking skills. You might figure it out yet!

          • Mike Flynn says:

            TF,

            This is what you wrote –

            “In short: increasing the emissivity of the atmosphere, DECREASES the efficiency at which the atmosphere will cool!”

            In case you missed it the first time, the word you used is “cool”. Not “heat” or “warm” – “cool”.

            Maybe you need another “amendment”. Have you thought of redefining “cooling” to mean “increasing in temperature”?

            All sorts of pseudoscientific climatological nutters claim that a reduction in the rate of cooling is really heating – resulting in increased temperatures! You hopefully agree with me that if temperature drops, that is cooling. Whether it happens rapidly or slowly – it is still cooling.

            Over the last four and half billion years, the Earth has cooled. Presently, the rate is around three millionths of a Kelvin or so per annum. You may redefine this as increasing temperature if you like, but that would be really stupid, wouldn’t it? Maybe you are confused by the fact that surface thermometers will record increased temperatures when exposed to elevated heat sources, such as those due to seven billion humans burning stuff as quickly as possible to produce electricity, power transportation, provide heat, make steel, cement and all sorts of other good stuff, and on.

            Keep on with your stupid and pathetic faith in the heat producing powers of CO2 and H2O. Feel free to consider me a non-believer in the tenets of the pseudoscientific climate cult. Feel free to rend your garments or grind your teeth if you wish. I really don’t care – why should I?

            Cheers.

          • Tim Folkerts says:

            Mike,

            I was using the terminology of the original poster to drive home the point that he was, indeed, exactly reversed in his conclusion. The earth emits thermal IR LESS efficiently to space when more CO2 is added. The ground will warm as a result. His wording is not optimal, but it is certainly understandable to anyone who has a modicum of physics knowledge and who was following the conversation.

          • Mike Flynn says:

            TF,

            You wrote –

            “The earth emits thermal IR LESS efficiently to space when more CO2 is added. The ground will warm as a result.”

            The ground seems to cool at night – this is confirmed by taking thermometer readings.

            I see you have redefined “warm” to mean a decrease in temperature. Typical pseudoscientific climatological cult jargon – warm means cool, reduced rate of cooling means heating, hot means whatever you want it to – boiling water or molten lead is apparently not hot, but an iron bar glowing red is the minimum temperature that can be considered hot. Or so you have written?

            No GHE. No rise in temperature caused by putting more GHGs between the Sun and a thermometer.

            The Earth’s crust has actually cooled from the molten state. Carry on believing otherwise, if it makes you feel better.

            Cheers.

  60. Mike Flynn says:

    TF,

    You wrote –

    “This is completely different from your current claim Either all things with a temperature radiate in the infrared, or many things emit infrared light (implying some don’t). [Even this claim is problematic hot things radiate significant amounts of visible light along with the IR. And some things would radiate very little IR because they are so cold, like the cosmic *microwave background radiation.]”

    I merely quoted NASA saying two different things. I don’t know whether you cannot comprehend written English, are deluded, or intentionally fabricating falsehoods.

    It still doesn’t help convince anybody that you can actually describe the non-existent GHE, or that increasing the amount of CO2 and H2O between the Sun and a thermometer makes the thermometer hotter!

    You are deluded. An iron bar heated to black heat (just below red) might make you rethink your bizarre and patently nonsensical assertion that “hot things radiate significant amounts of visible light . . .”. Any fool who plunges his hand into boiling water realises the water is also hot – and it emits no perceptible visible light whatsoever.

    Keep on making yourself appear stupid and ignorant – you need no help from me, obviously.

    Cheers.

  61. Tim Folkerts says:

    Mike — true or false:

    All radiation longer than visible light is infrared by definition.

    • Tim Folkerts says:

      I’ll amend: hot *enough* things radiate significant amounts of visible light — like light bulb filaments or the sun or molten iron. Perhaps that was not clear from the context that “hot” means, say, 700 C or higher, not things like 100 C water or 300 C iron. This is still at least as clear as your counter-claim “all things with a temperature radiate in the infrared” — which could easily be read to imply that objects ONLY radiate IR — and cannot radiate visible or microwaves or UV.

      And no amount of context will make “all radiation longer than visible light is infrared by definition” right.

      • Mike Flynn says:

        TF,

        I see you have now defined “hot” to mean 700 C or higher. Bad luck for all the pseudoscientific numbskulls talking about “hot climates”, then!

        According to your amendment, boiling water is no longer hot. Maybe another amendment is needed, and you can redefine hot depending on what it is that is hot! CO2 might be “hot” at one temperature, H2O might be “hot” at another, eh?

        This is the nature of pseudoscience – based on wordplay, and a stubborn refusal to be pinned down. Something like Uri Geller claiming that his mental spoon bending ability only functioned in the absence of non-believers!

        Moving right along, you wrote –

        “This is still at least as clear as your counter-claim “all things with a temperature radiate in the infrared” . . .”.

        No claim or counter-claim – just a statement of fact, as far as I know. If you believe otherwise, just say so. A few examples of matter above absolute zero which can be shown by experiment to have no radiation below visible red, (infra red, by definition), would support your case.

        Unfortunately, you are in the grip of a pseudoscientific delusional state. Unless you can at least adequately describe this amazing GHE which you claim exists, all your pseudoscientific blather is for nought.

        The Earth has cooled over the last four and a half billion years. The atmosphere cools at night. Winter is colder than summer . . . And so it goes.

        Maybe you can retreat into your fantasy world, if you find reality too stressful.

        Cheers.

        • Tim Folkerts says:

          Mike, since you seem to be focused on narrow definitions rather than understanding — true or false:

          All radiation longer than visible light is infrared by definition.

          Rather than going off on dozens of tangents, clear up this point first.

          • Mike Flynn says:

            TF,

            You have quoted me correctly. What part do you not understand? Or do you believe I did not mean what I wrote?

            If you cannot understand basic English, just tell me. I’d enjoy you asking for assistance. Demanding that I ” . . . clear up this point first . . .” is not going to achieve much. Why should I comply with any of your stupid demands? Should your opinions be important for some reason that I am unaware of?

            Unless you can show otherwise, I assume that you are not seeking knowledge, but rather making a feeble and pathetic attempt at a gotcha – no doubt trying to avoid admitting that you cannot even describe this pseudoscientific GHE you profess to understand!

            I wrote what I wrote. If you disagree with my definition, propose your own. It won’t make a blind bit of difference, will it? You can remain as petulant and stupid as you wish. The Earth’s surface is still no longer molten, and the atmosphere cools at night.

            No GHE. Neither CO2 nor H2O make thermometers hotter. Back to your fantasy – the one where Gavin Schmidt is a “climate scientist”, and Michael Mann is a Nobel Laureate. If you don’t like the way the universe is, go off and create your own – in your imagination, probably.

            Cheers.

          • Tim Folkerts says:

            Mike,
            As near as I can figure out, your logic is:

            All infrared radiation has longer wavelength than visible light.
            Therefore, all radiation with a wavelength longer than visible light is infrared.

            This is a classical logic blunder. “All A is B” does not imply “All B is A”. That would be as silly as saying “All $5 bills are more valuable than all $1 bills. Therefore all bills larger than $1 are $5’s.”

            If you have some OTHER logic for concluding “all radiation longer than visible light is infrared by definition”, I would love to hear it.

            Especially in light (pun intended) of common knowledge that there exist microwaves and radio waves that are indeed
            1) longer than visible light
            2) not infrared.

          • Mike Flynn says:

            TF,

            I wrote what I wrote – not what you think I should have written. If you wish to argue with yourself, feel free.

            If you believe what I wrote to be incorrect, just say so, and provide some facts to back up your belief.

            What you would love to hear is of little interest to me. Your love life is your concern.

            Nature doesn’t care what definitions you use. The Earth has managed to cool over the last four and half billion years, in spite of your belief in the miraculous heating properties of CO2 and H2O, apparently due to the the operation of the GHE, which nobody seems to be able to describe in any sensible way.

            What a pity! Carry on denying, diverting, and confusing – it might make you feel better.

            Cheers.

          • Gordon Robertson says:

            Tim…”Mike,
            As near as I can figure out, your logic is:

            All infrared radiation has longer wavelength than visible light.
            Therefore, all radiation with a wavelength longer than visible light is infrared. ”

            Technically speaking, Mike is right. Infrared means below red, a reference to the frequencies that stimulate the human eye to receive those frequencies as the colour red.

            There are not that many ranges below infrared in the EM spectrum but you did mention the microwave band and the radio band frequency band. All those wavelengths are longer than the wavelengths associated with the colour red.

            If you want to get more technical, the colour red is defined by a specific frequency and wavelength range that stimulates the eye to see a colour we have defined as red. It can range from a darker read to a lighter red but not a diluted red like pink.

            There are no colours in EM energy just as there is no heat.

            There are no discontinuities in the EM band related to colour since colour is completely a phenomenon of the human eye. So, there is no infrared in reality, just a continuum of EM frequencies.

            When you look at a flower with brilliant yellows and purples, like a pansy, the flower has no colour, it is simply reflecting frequencies that stimulate the human eye to see colour.

            If we humans arbitrarily define infrared at a certain frequency, it essentially means we are referring to all frequencies below that cut-off, not just those related to heat sources. Heat sources can also produce visible colours well beyond the infrared.

            I am well aware of how the word infrared is normally applied, but technically it does mean all frequencies below a certain frequency.

  62. PhilJ says:

    Tim,

    “In short: increasing the emissivity of the atmosphere, DECREASES the efficiency at which the atmosphere will cool!”

    Nonsense.
    Consider:

    Increasing the emissivity of the atmosphere increases the amount of IR emitted at any givem temp.

    If temp varys with altitude, then it follows that more IR is emitted at any given altitude.

    If there is more IR emitted at any given altitude then there is more IR emitted at all altitudes.

    If there is more IR emitted at all altitudes the morw IR must be exiting the TOA cooling the atmosphere.

    Observed reduced drag on satelites is evidence that the TOA is contracting.

    If the TOA is contracting then the volume of the atmosphere is decreasing.

    If the volume is decreasing then temp must be decreasing, or pressure be increasing or some combination of the two…

    • Tim Folkerts says:

      Phil, you say lots of correct things, but you also make a few fundamental errors.

      I am with you up until:
      “If there is more IR emitted at all altitudes the morw IR must be exiting the TOA cooling the atmosphere.”

      Increasing the emissivity also increases the ability of the atmosphere to absorb IR radiation. This means each layer is becoming better at absorbing radiation from below. Since the radiation from below comes from warmer areas, the upper layers are absorbing the stronger IR from below and emitting weaker IR in its place.

      Voil! Less radiation to space.

      [You could try playing around with MODTRAN models.
      http://climatemodels.uchicago.edu/modtran/
      This software – developed by industry and the military, not by climate scientist — calculates the outgoing IR. The calculations start with a standard temperature profile, then allow you to change the concentrations of GHGs. Boosting CO2 DECREASES the outgoing IR, exactly as I described above. ]

      “Observed reduced drag on satelites is evidence that the TOA is contracting.”
      Yes and no. The atmosphere 300+ km up determines the drag, since satellites are typically 300+ km above the ground. This has little or nothing to do with the troposphere warming and expanding from say 12 km to 12.1 km.

      • Mike Flynn says:

        TF,

        More models. MODTRAN is not reality. It is a model, based on assumptions which may or may not reflect reality at any given time. Try modelling the atmosphere for physical movement – now calculate the windspeed and direction 30 seconds hence – how did you go?

        Try describing the GHE. You can’t can you?

        Enough said.

        Cheers.

        • Tim Folkerts says:

          If I were trying to predict weather, your objections would be valid. But I was trying to explain radiation balance, so I used software specifically desigend to predict radiation. The sofware uses standard physics and experimentally determined constants, and has proven itself highly useful for the military. I don’t think the Air Force would use this if it produced unreliable results.

          Also, I have no trouble explaining the greenhouse effect, and have done it numerous times. The real problem is that you can’t understand.

          • Mike Flynn says:

            TF,

            You are making things up again. I just pointed out facts – I understand why you are reluctant to quote me directly. You prefer to put words in my mouth, so that you can argue with yourself. Typical stupid pseudoscientific evasion tactics – avoid facing facts at all costs!

            You wrote –

            “I dont think the Air Force would use this if it produced unreliable results.” Really? The USAF is noted for its use of unreliable software and hardware, which has directly cost the lives of many personnel. Maybe you prefer to believe that a company like Boeing would not use unreliable software, either?

            You also wrote –

            “Also, I have no trouble explaining the greenhouse effect, and have done it numerous times.”

            You just cannot describe this GHE at the moment, because you have mislaid the document containing the description, eh? That slight problem would make your “explanations” rather pointless and nonsensical wouldn’t it?

            Rather like some other pseudoscientific climate cultist waffling about the “theory of global warming”, which of course is non-existent, just like a testable GHE hypothesis. Bad luck, Tim. Faith based pseudoscience winds up looking ridiculous, as do its practitioners, as inconvenient facts make their presence felt.

            Ah well, I support absolute freedom of speech. Go your hardest.

            Cheers.

    • Gordon Robertson says:

      Phil…”Increasing the emissivity of the atmosphere increases the amount of IR emitted at any givem temp”.

      Don’t forget, the IR to which we refer is related to emissions at terrestrial temperatures. If a satellite is launched with telemetry preconceived to measure terrestrial radiation how will we ever know if the Earth is emitting EM emitted from nitrogen and oxygen?

      They know that N2/O2 emit EM at certain frequencies in lab conditions. How do we know how they will emit with a heat sink adjacent to them at roughly -273C?

      Another point, UAH data comes from satellites measuring EM emissions in the microwave bands. What if O2 is cooling by emitting in the microwave band and no one has thought to measure it at TOA?

    • Gordon Robertson says:

      Tim…”Since the radiation from below comes from warmer areas, the upper layers are absorbing the stronger IR from below and emitting weaker IR in its place.”

      And that’s exactly why that weaker IR cannot warm the hotter surface that warmed the CO2.

  63. Gordon Robertson says:

    Olof…”No evidence?
    So sad, Loser..”

    Is Olof Scandinavian for idiot? I have already asked you to supply the source of your graphs and you use the typical alarmist ploy of returning a red herring argument.

    We are not talking about my evidence we are talking abut your evidence. If you want my evidence, just go through this thread and you will find a lot of it. As for Roy’s evidence, he supplies it each month in terms of real data.

    You eco-loonies try every non-scientific approach imaginable, and although you have no real evidence, you have created a propaganda-based story around your lack of evidence.

  64. Mike Flynn says:

    bobdroege wrote –

    “You are the gullible one if you think it would take 4 billion years and change for the earth to cool from a molten state.

    that is unless it was being heated from somewhere”

    b,

    I understand why you are reluctant to address what I actually wrote, rather than your deceptive misrepresentation of same. But yes, the Earth has actually cooled to its present temperature over the last four and a half billion years or so.

    Maybe you could look up Lord Kelvin’s mistaken estimate of the age of the Earth, and learn from his mistake. Only a stupid and ignorant person would keep repeating incorrect nonsense in light of knowledge which has arisen since Kelvin’s time. Radiogenic heat sources and the logarithmic and asymptotic reduction of available unstable isotopes were unknown to Kelvin. You do not have this excuse. You are merely ignorant and stupid, unless you have another excuse – delusional psychosis might be an adequate explanation.

    Cheers.

  65. gallopingcamel says:

    Gordon Robertson, April 29, 2019 at 8:12 PM
    “normangallopingcamel

    I generally like your posts. You seem intelligent and thoughtful.

    Thats an insult to a rugby player. ☺

    Cam would be drubbed for that in the rugby clubhouse. Rugby teams hold courts and if evidence was presented that he even seemed intelligent and thoughtful, hed be fined.”

    LOL….hard to argue against that!

    I respect Roy Spencer and Scott Denning and have been trying to persuade them to engage in a TV debate. Will it happen? Who knows but let’s hope so.

    The only thing I can say for sure is that Scott Denning did write that snitty tweet shown in this post.

  66. gallopingcamel says:

    Norman said:
    “I am open to logic an reason and valid physics if you can explain it well. I can look at your link.”

    My analysis uses a Russian FEA (Finite Element Analysis) program that was a crucial resource for improving the design of bending magnets used in the Duke university HIGS (High Intensity Gamma Source, currently the world’s brightest in the 10-100 MeV spectrum.

    FEAs are useful for solving partial differential equations found in electro-magnetism and heat transfer. The first post below derives the Moon’s surface temperature for an entire lunar day and my model is in good agreement with NASA’s LRE (lunar Radiometer Experiment) as published by Ashwin Vasavada:

    https://tallbloke.wordpress.com/2014/04/18/a-new-lunar-thermal-model-based-on-finite-element-analysis-of-regolith-physical-properties/

    The second post attempts to estimate the effect of replacing the Moon’s regolith with ice as would likely be the found on an airless Earth:

    https://tallbloke.wordpress.com/2014/08/27/extending-a-new-lunar-thermal-model-part-ii-modelling-an-airless-earth/

    The third post models the effect of varying the rate of rotation. While Denning and I are in close agreement there are others who say that the rate of rotation is unimportant (e.g. Ned Nikolov)

    So who is right? You can be sure we are all wrong but some are more wrong than others (to paraphrase George Orwell).

    I sent my files to David Appell who could not open them and that gave me the idea of re-calculating using a spreadsheet as Dr. Roy did here. Dr. Roy’s model does not work well at dawn or dusk but does a good job everywhere else:
    http://www.drroyspencer.com/wp-content/uploads/simple-radiative-EBM-of-sfc-and-NOatm-with-diurnal-cycle.xlsx

    My Excel model is almost as good as my FEA model with an RMS error of 3 Kelvin relative to Vasavada. Sadly it has some instabilities that I don’t understand. The good news is that my Excel spreadsheet is about 500 times faster than my FEA program so you don’t have to wait thirty minutes every time you tweak a variable.

    I would be happy to send you the files if you are interested.

    The temperature of an airless Earth is nowhere near the 255 Kelvin claimed by so called “Climate Scientists”. That estimate is wrong by at least 50 Kelvin.

  67. Gerald Ratzer says:

    Law of Diminishing Returns applied to CO2 in the atmosphere.
    Most of the heating from CO2 has already happened and little heating remains as we approach the asymptote of a new approximation of CO2 in ppm and the corresponding heat in watts/metre2.

    Table and graph at this link.

    https://www.dropbox.com/s/zp99hxe8gal8ha9/CO2-Diminish%20Returns.pdf?dl=0

Leave a Reply to JDHuffman