New 80-Year Deep-Ocean Temperature Dataset Compared to a 1D Climate Model

January 15th, 2020 by Roy W. Spencer, Ph. D.

The increasing global ocean heat content (OHC) is often pointed to as the most quantitative way to monitor long-term changes in the global energy balance, which is believed to have been altered by anthropogenic greenhouse gas emissions. The challenge is that long-term temperature changes in the ocean below the top hundred meters or so become exceedingly small and difficult to measure. The newer network of Argo floats since the early 2000s has improved global coverage dramatically.

A new Cheng et al. (2020) paper describing record warm ocean temperatures in 2019 has been discussed by Willis Eschenbach who correctly reminds us that such “record setting” changes in the 0-2000 m ocean heat content (reported in Zettajoules, which is 10^^21 Joules) amount to exceedingly small temperature changes. I calculate from their data that 2019 was only 0.004 0.009 deg. C warmer than 2018.

Over the years I have frequently pointed out that the global energy imbalance (less than 1 W/m2) corresponding to such small rates of warming is much smaller than the accuracy with which we know the natural energy flows (1 part in 300 or so), which means Mother Nature could be responsible for the warming and we wouldn’t even know it.

The Cheng (2017) dataset of 0-2000m ocean heat content changes extends the OHC record back to 1940 (with little global coverage) and now up through 2019. The methodology of that dataset uses optimum interpolation techniques to intelligently extend the geographic coverage of limited data. I’m not going to critique that methodology here, and I agree with those who argue creating data where it does not exist is not the same as having real data. Instead I want to answer the question:

If we take the 1940-2019 global OHC data (as well as observed sea surface temperature data) at face value, and assume all of the warming trend was human-caused, what does it imply regarding equilibrium climate sensitivity (ECS)?

Let’s assume ALL of the warming of the deep oceans since 1940 has been human-caused, and that the Cheng dataset accurately captures that. Furthermore, let’s assume that the HadSST sea surface temperature dataset covering the same period of time is also accurate, and that the RCP radiative forcing scenario used by the CMIP5 climate models also represents reality.

I updated my 1D model of ocean temperature with the Cheng data so that I could match its warming trend over the 80-year period 1940-2019. That model also includes El Nino and La Nina (ENSO) variability to capture year-to-year temperature changes. The resulting fit I get with an assumed equilibrium climate sensitivity of 1.85 deg. C is shown in the following figure.

Fig. 1. Deep-ocean temperature variations 1940-2019 explained with a 2-layer energy budget model forced with RCP6 radiative forcing scenario and a model climate sensitivity of 1.85 deg. C. The model also matches the 1940-2019 and 1979-2019 observed sea surface temperature trends to about 0.01 C/decade. If ENSO effects are not included in the model, the ECS is reduced to 1.7 deg. C.

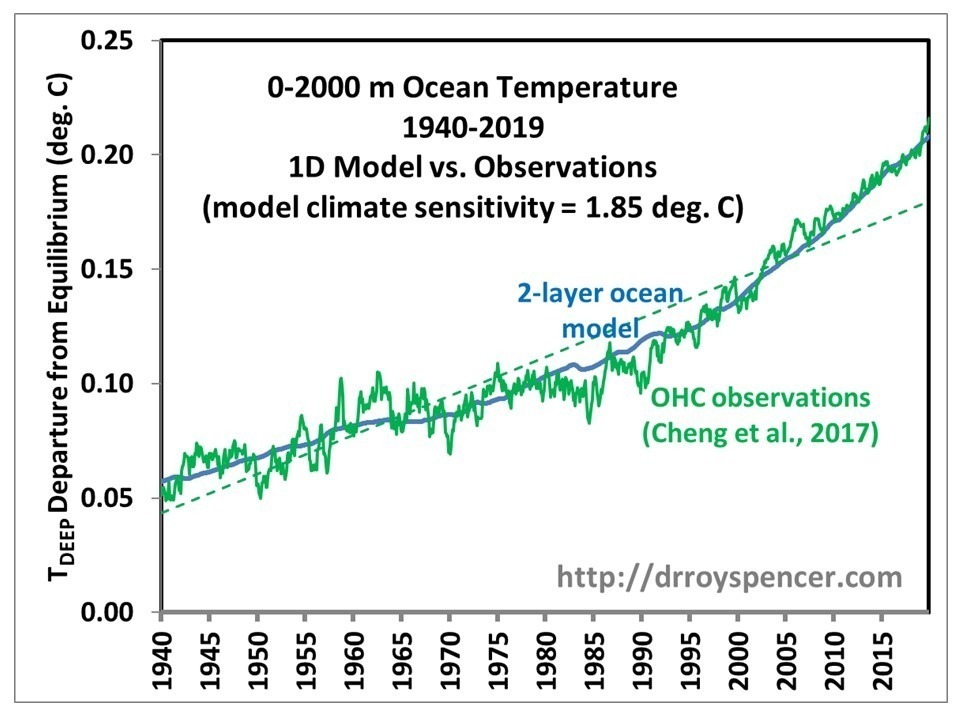
Thus, based upon basic energy budget considerations in a 2-layer ocean model, we can explain the IPCC-sanctioned global temperature datasets with a climate sensitivity of only 1.85 deg. C. And even that assumes that ALL of the warming is due to humans which, as I mentioned before, is not known since the global energy imbalance involved is much smaller than the accuracy with which we know natural energy flows.

If I turn off the ENSO forcing I have in the model, then after readjusting the model free parameters to once again match the observed temperature trends, I get about 1.7 deg. C climate ECS. In that case, there are only 3 model adjustable parameters (ECS, the ocean top layer thickness [18 m], and the assumed rate or energy exchange between the top layer and the rest of the 0-2000m layer, [2.1 W/m2 per deg C difference in layer temperatures away from energy equilibrium]). Otherwise, there are 7 model adjustable parameters in the model with ENSO effects turned on.

For those who claim my model is akin to John von Neumann’s famous claim that with 5 variables he can fit an elephant and make its trunk wiggle, I should point out that none of the model’s adjustable parameters (mostly scaling factors) vary in time. They apply equally to each monthly time step from 1765 through 2019. The long-term behavior of the model in terms of trends is mainly governed by (1) the assumed radiative forcing history (RCP6), (2) the assumed rate of heat storage (or extraction) in the deep ocean as the surface warms (or cools), and (3) the assumed climate sensitivity, all within an energy budget model with physical units.

My conclusion is that the observed trends in both surface and deep-layer temperature in the global oceans correspond to low climate sensitivity, only about 50% of what IPCC climate models produce. This is the same conclusion as Lewis & Curry made using similar energy budget considerations, but applied to two different averaging periods about 100 years apart rather than (as I have done) in a time-dependent forcing-feedback model.


531 Responses to “New 80-Year Deep-Ocean Temperature Dataset Compared to a 1D Climate Model”

Toggle Trackbacks

  1. Svante says:

    So that’s within the IPCC likely ECS range of 1.5 C to 4.5 C.

  2. Brad Patton says:

    I am sorry but it all reminds me of cold fusion. We are dealing with such tiny temperature changes and such a fantastically large area.
    Forgive me here but normally the top of ocean warms in summer and we all go swimming it cools in winter by a hell of a lot more than .004 C. I find his results meaningless because it is so tiny and there are a zillion variables at play. But NASA is now D&I (meaning they hire 2nd and 3rd tier candidates) so it must be right. No?

  3. argus says:

    So the deniers just need to get out of here with their denyin’, and the alarmers can quit scolding their parents and focus on gradumating high school with gud grades.

  4. Nate says:

    ‘a climate sensitivity of only 1.85 deg. C.’

    Interesting. Have you tried to put an error range on this number yet?

    It seems that since you are fitting the deep ocean warming that your ECS could very sensitive to your ocean model, 2 layer vs something more complicated like Hansen 1981, where he assumed heat diffuses from the surface down the thermocline with a diffusion constant k.

    • We have used a 20-layer model in the past with heat diffusion. The results are basically the same. What is important is that as the surface warms, heat is pumped (mixed) from the surface layer downward at a rate that provides agreement between the model and the observations for the surface layer and the deep layer. No matter what the physical mechanisms are that accomplish that, there is still an average rate at which it occurs which can be parameterized with a single scaling coefficient time the temperature difference between the top layer and the deep ocean.

  5. bdgwx says:

    Cheng shows a +20e18 kj change from 2018 using the annual means. I estimate (roughly) the top 2000m of the ocean to have a mass of 0.7e21 kg. And ocean water has a specific heat capacity of about 4kj/kg.C. That yields a dT of 0.0071C. Note that I get 0.0035C when using the total mass of the ocean 1.4e21 kg. Obviously if a better estimate of the mass of the top 2000m is different than my rough estimate then it will change my 0.0071C result.

    • yup, I corrected it, I used the wrong data as input to that… I get +0.0089 C for 2019-minus-2018.

      I used a global ocean area of 361 million sq. km (v3 of the Cheng dataset includes the Arctic Ocean); 3850 J/kg C for specific heat of seawater; and 1025 kg/m3 for density of seawater.

      I’ve sent Cheng an email asking what values of these we should use for conversion back to temperature (or, better yet, if he has a v3 temperature dataset). I find it annoying that the OHC dataset providers do not provide the conversion factors they used to get to OHC.

  6. Pathway says:

    I’m just sure we accurately knew what the temperature of the ocean was 80 years ago.

  7. Nate says:

    “Over the years I have frequently pointed out that the global energy imbalance (less than 1 W/m2) corresponding to such small rates of warming is much smaller than the accuracy with which we know the natural energy flows (1 part in 300 or so), which means Mother Nature could be responsible for the warming and we wouldn’t even know it.”

    Well, not really. The total input of 240W/m2 is irrelevant.

    The only important energy flows are imbalances that PERSIST for years or decades.

    We are measuring that persistent imbalance, 0.6 W/m2, extremely well via the trend in ocean heat content over the last 20 y. That trend is very well resolved.

    • Roy W. Spencer says:

      Yes, the change in OHC is a measure of the long-term average imbalance. My point is that we do not know the *causes* of the imbalance because we do no know the natural energy flow components of the imbalance to that level of accuracy, either from first principles or from observations.

    • Nate says:

      “we do no know the natural energy flow components of the imbalance to that level of accuracy”

      Ok. Still your fit in figure 1, especially to the overall shape is impressive, and same with your fit to SST.

      All without invoking any long-lived natural energy flows other than ENSO..

      Surprising that AMO and PDO dont seem to be needed. Maybe they are just moving the OHC around without much net change?

    • bdgwx says:

      Even ENSO only moves the OHC around the hydrosphere and between the atmosphere and possibly cryosphere. I know of no mechanism by which it can actually materialize a positive global energy imbalance except by possibly a cloud albedo feedback. But then you’d expect cloud forcing to have negative and positive phases as well. Yet that +0.6 W/m^2 OHC imbalance is so persistent. Nevermind that we have little evidence that the cloud forcing is that high. Double nevermind that you would then have to explain where that GHG forcing went if not into the geosphere. There are similar arguments for the AMO and PDO as well…

    • Nate says:

      True. Maybe why we dont see much of ENSO in his OHC fit, fig 1. But we do seem to need it to fit SST, previous posts.

    • Dr Roys Emergency Moderation Team says:

      bdgwx, please stop trolling.

  8. gallopingcamel says:

    Here is what the IPCC said about “Sensitivity” in AR5:

    “Equilibrium climate sensitivity is likely in the range 1.5°C to 4.5°C (high confidence)….”

    One hundred and eighteen years after the Arrhenius theory was published the sensitivity constant was known to a precision of +/- 50%! That is SINO (Science In Name Only).

    The fraudsters should admit that the correlation between [CO2] and temperature from 1850 to 1998 is merely a coincidence.

    There is a causal relationship between [CO2] and temperature over the last seven glacial cycles that is evident from the EPICA and Vostok ice cores. However, temperature is driving [CO2] given that CO2 lags by many hundreds of years.

    • Nate says:

      Yes GC, but you know well that is a red herring. The Earth can walk and chew gum at the same time.

      CO2 of course responds to temperature when something else, in this case solar insolation, is forcing the temperature.

      That says zilch about the inverse process of co2 forcing temperature. Though there is evidence of that in the record also.

    • bdgwx says:

      Yes. The fact that CO2 is in a feedback relationship with the temperature in addition its forcing relationship has been known for quite some time. What this means is that CO2 can both lead and lag the temperature change depending on the agent that catalyzed the initial temperature change.

      • Chic Bowdrie says:

        I think you mean the feedback/forcing relationships have been hypothesized for quite some time. No one has any actually data to verify that CO2 causes anything more than noise.

      • Nate says:

        Chic, this study by the good doctor is more evidence, another piece added to the pile that you’ve been shown. Such evidence accumulates and taken as a whole makes a solid case, even to scientist skeptics like Roy. But you’ve shown no desire to look at evidence objectively.

        • Chic Bowdrie says:

          You need to re-read the post. This is a “what if” scenario. There is no data or evidence indicating that CO2 had anything to do with ocean temperature increase. Your correlation-is-causation mentality and closed mind has you stuck on brainwashed.

          • Loydo says:

            And you Chic need to read a little more widely. I suggest a good starting point is Grant Fosters most recent post here https://tamino.wordpress.com/ where he calls out Roy’s “40% of Warming caused by earlier Volcanic cooling” and shows that his “we do no know the natural energy flow components” is pretty dubious.

          • Chic Bowdrie says:

            Loydo,

            Does Grant Fosters take Dr. Spencer’s comment out of context like you did?

            “we do no[t] know the natural energy flow components of the imbalance to that level of accuracy, either from first principles or from observations.”

            Can you provide evidence to the contrary?

        • Nate says:

          Chic, “Your correlation-is-causation mentality”

          Wrong. This is: let’s take a theory and try to fit the observations with it.

          I explained this is ONE piece of many pieces of evidence. A test of the hypothesis that no mysterious new forcings need to be invented to account for the historical temperature and OHC records that we have.

          It shows that the physics-derived GHE forcing, plus known natural forcings are sufficient, and even matches pauses in 40-70, and 2000s, and rapid rise in OHC beginning in 80s.

          “and closed mind has you stuck on brainwashed.”

          Obviously projecting your own issues onto others, including Roy.

          • Chic Bowdrie says:

            “This is: let’s take a theory and try to fit the observations with it.”

            That is a pretty good definition of an attempt to show causation by correlation in the vernacular of a lay person. You can manipulate a model to fit data until the cows come home and it won’t make a lick of difference. You need to show the model works on future generations. You are practicing faith-based science.

            From Roy’s post:

            “Let’s assume ALL of the warming of the deep oceans since 1940 has been human-caused, and that the Cheng dataset accurately captures that. Furthermore, let’s assume that the HadSST sea surface temperature dataset covering the same period of time is also accurate, and that the RCP radiative forcing scenario used by the CMIP5 climate models also represents reality.”

            That sounds exactly like what I meant by a “what if” scenario. I’m not projecting anything. You haven’t provided any hard data showing that an increase in CO2 will cause an further affect on global temperature.

          • Nate says:

            ‘This is: let’s take a theory and try to fit the observations with it.’

            “That is a pretty good definition of an attempt to show causation by correlation in the vernacular of a lay person. You can manipulate a model to fit data until the cows come home and it won’t make a lick of difference. You need to show the model works on future generations. You are practicing faith-based science.”

            Well then most of science would not be convincing to you.

            As far as predictions of future trends, we have that also, eg Hansen 1981 did that very well. But that didnt work for you either.

            When Roy says ‘lets assume’ that data is accurate, thats called testing a hypothesis, which is again standard science.

            No his analysis is not definitive, but another useful piece of evidence.

            If you could offer him an alternative natural forcing that could replace the GHE, what would it be? And can you show that it could equally well explain the data?

            Doubtful.

          • bill hunter says:

            Nate says: “If you could offer him an alternative natural forcing that could replace the GHE, what would it be? And can you show that it could equally well explain the data?”

            That unfortunately has been at the heart of arguments for the effects of CO2 and even more unfortunate that isn’t even a logical argument much less a scientific argument. It is well known as the logical fallacy argumentum ad ignorantiam. Yet despite that well known fact it doesn’t hardly stop anybody.

          • Svante says:

            “Process of elimination is a logical method to identify an entity of interest among several ones by excluding all other entities.”

            https://en.wikipedia.org/wiki/Process_of_elimination

          • bdgwx says:

            Bill, it’s called picking the model/theory that best explains reality. Let me ask you this…We know that neither newtonian mechanics nor general relativity can explain reality perfectly so how do you choose which one to use?

          • bill hunter says:

            Svante and BDGWX, well as long as you fully understand that its not evidence.

            There is a difference between selecting a target for investigation vs claiming the target is guilty.

            BDGWX, the theories of newtonian mechanics and general relativity have been confirmed via experiment and observation as verified approximations of reality.

            Observing a single falling apple for one tiny fraction of time midway in its fall to earth with a rather sloppy measuring device the needed constant readjustment during that time period doesn’t hardly lend any credence scientifically or statistically.

            That is the substance of the fallacy argumentum ad ignorantium. One cannot claim ones ignorance of an alternative as evidence, one can only choose ignorance as an excuse to focus ones attention on gathering evidence because that’s a personal choice. Keeping it a personal choice vs a legal mandate is as key of an element of freedom as free speech.

          • bdgwx says:

            I’m ignorant of a gravity theory that can explain reality any better than what we already have which we know isn’t 100% right. By your standard it is therefore unscientific for me to argue that NM or GR be used to model reality. You want us to abandon a model/theory that is useful for no model/theory at all. See the problem?

            And besides scientific understanding progresses by means of falsification; not truthification. We can’t absolutely prove the consensus model of climate is true anymore than we can absolutely prove that NM or GR are true because that requires infinite effort. In fact we have good reason to believe that neither NM or GR are absolutely true. But we can create hypothesis and attempt to falsify them as a means of eliminating possibilities. And we can rank models/theories by how well they match reality. And when you do that you find that GR works better than NM. Similarly the consensus model of the climate works better than weak-GHG or no-GHG models.

          • Svante says:

            “We can rule out every other scientific theory except the GHG theory”:
            https://tinyurl.com/s8tdwvy

          • bill hunter says:

            bdgwx says:
            “You want us to abandon a model/theory that is useful for no model/theory at all. See the problem?”

            Useful? A hypothesis is only useful for directing work for validation.

            The model for gravity is useful beyond that because you can predict if you choose to drop something current theories will tell you to a high degree of accuracy the result.

            People quickly adopted the model as they intuitively knew that the same would result if they dropped something.

            However, nobody has ever created climate change or any proxy for it by adding CO2. This is the usual departure point where science is elevated to religion and sold to the public by those seeking power/fame/wealth/or even just a living when what is called for is an effort to validate the theory.

            It becomes even more suspicious when its suggested that validation is not needed. All alternatives like Svensmark are earmarked as unvalidated and the powers to be will not accept it without validation. If they were consistent they demand the same for the CO2 theory.

          • Svante says:

            Perhaps this anecdote has a bearing on the weird ideas you find here:
            https://tinyurl.com/ua7lsht

          • Nate says:

            Bill,


            It is well known as the logical fallacy argumentum ad ignorantiam. ”

            Well not quite. It is understood that all scientific theories are provisional, until something better comes along. It could take centuries, as it did for GR to come along and advance gravitational theory.

            As of now there is lots of evidence to support GHE theory, including its successful use in weather prediction, and climate change models 40 y ago that correctly predicted GW over next 4 decades.

            Something better hasn’t come along yet, but it could.

          • bill hunter says:

            Nate says: “As of now there is lots of evidence to support GHE theory, including its successful use in weather prediction, and climate change models 40 y ago that correctly predicted GW over next 4 decades.”

            Come on Nate thats ridiculous. Its like you see some guy ambling down the street and notice he is ambling in the same direction the wind is blowing. So you build a wind ambling model and predict the guy is going to continue straight until the next intersection.

            Viola he makes the next intersection and you claim your model has been validated and that the wind determines the direction of the ambling man.

            What you need to begin to approach anything statistically valid is for the wind to change directions numerous times and the man also changing directions. Even then its just a statistical validation meaning it could still be wrong. When no direction change has occurred leaves open the possibility that man was ambling in the direction he is going based upon something that occurred perhaps long ago, like he decided, before you started observing him and he wasn’t ambling in the same direction as the wind, to walk down to the corner. This should be third grade stuff, even a third grader understands somewhat the implications of his decisions but it seems to fly directly over the head of mainstream science. Why is that? For the answer to that I suggest you go back upthread and review the various reasons why stuff gets elevated to the religious level. And for all those in the congregation singing hallelujahs for every verse delivered by those doing the religious elevating, a Mark Twain review would be in order about only believing properly trained professional people who owe you a legally enforceable duty to tell you the truth.

          • Nate says:

            “you see some guy ambling down the street and notice he is ambling in the same direction the wind is blowing. ”

            Very colorful, Bill, but not remotely similar to what was done 40 y ago.

            In 1980 we had a 40 y history of flat plus noise.

            We had an 80 year history of wandering around in a range of 0.4 degrees.

            To ‘guess’ the next 40 y based on recent past history would have been a futile exersise, with dozens of possible futures.

            Of course, we know that physics, not guesses, was the main basis for the correct prediction of GW.

          • Nate says:

            To attempt to bring your ‘wind’ into it and make it analogous to 1980 and GHE, the wind would have been erratic up to the point you see the man ambling down the street. You observe that the man is drunk and seems directionless.

            You predict two things: the wind will increase in a direction sideways to the ambling man, you predict the wind will remain steady in that direction for the foreseeable future.

            You further calculate the force of the wind on the man and find it to be substantial.

            You then predict that the increased wind will blow the man sideways in the direction it is blowing for the foreseeable future.

          • bill hunter says:

            Nate says: “Very colorful, Bill, but not remotely similar to what was done 40 y ago.

            In 1980 we had a 40 y history of flat plus noise.”

            Interesting Nate? We were spewing CO2 for those 40 years plus and it was flat until 1980? Then the ambling man isn’t directed by the wind, right?

          • Nate says:

            Yep. Here is how Hansen explained it so accurately 40y ago.

            “It is shown that the anthropogenic carbon dioxide warming should emerge from the noise level of natural climate variability by the end of the century, and there is a high probability of warming in the 1980’s.”

          • bdgwx says:

            bill, The transient RF from CO2 was about +0.5 W/m^2 from 1940 to 1980. During this period aerosol RF was large enough to offset most of the combined GHG RF. In addition Agung erupted in the early 60’s putting an even greater negative RF on the climate system. Overall CMIP models reproduce the 1940-1980 stall period with remarkable skill. They also reproduce the 1998-2012 stall period pretty well too (CMIP6 better than CMIP5 in that later case).

          • bill hunter says:

            Yep. Here is how Hansen explained it so accurately 40y ago.

            “It is shown that the anthropogenic carbon dioxide warming should emerge from the noise level of natural climate variability by the end of the century, and there is a high probability of warming in the 1980’s.”

            Gee, Nate you seem subject to selective inculcation.

            How about the warming from 1911 to 1945? What emergence from natural variability did that come from?

            But lets speculate that some of the natural warming and cooling periods are indeed as Hansen claimed. That might suggest that the cooling period from 1945 to 1980 which was less intense that either the warming before or after contains some element that isn’t just “noise” in the system that indeed there is a warming trend occurring both at the beginning of the 20th century and at the end of the century that isn’t noise. So lets say noise makes up the signal that more than flattened the period 1945 to 1980. The flip side of that noise would then account for at least half of the current warming.

            And of the part still unaccounted for we need to consider the early 20th century warming as mostly natural also, so lets cut the modern warming in half again. What do we come up with from an actual observation of the ambling man? That some of the modern warming is attributable to something mankind is doing maybe?

            Well yeah I am all in on that. Its just I am not going to led by the nose to find some tortured explanation for everything that isn’t consistent with the direction of the ambling man over history. Fact is if you want to rest your case on the ambling man you have to actually observe everything he is doing not just what you want to focus on.

          • bdgwx says:

            bill, in terms of external forcings the period from 1910 to 1945 exhibited waning aerosol forcing and increasing GHG forcing. The solar grand maximum contributed a little bit as well though its magnitude was much less than the GHG and aerosol forcing which dominated this period.

          • bdgwx says:

            errata…volcanic aerosol forcing waned during this period. Anthroprogenic aerosol forcing increased but not as fast as GHG forcing.

          • Svante says:

            bill hunter says:
            “How about the warming from 1911 to 1945?”

            CO2 is long term, it lasts for millenia.
            Other forcings can negate it for decades.
            In the mean time it keeps accumulating,
            as the green line shows here:
            https://tinyurl.com/qsg36yu

          • bill hunter says:

            bdgwx says: “errata…volcanic aerosol forcing waned during this period. Anthroprogenic aerosol forcing increased but not as fast as GHG forcing.”

            bdgwx, aerosol “forcing” history is dodgier than co2 “forcing”.

            This subthread is about theory validation and not that there are theories or not. Clearly there are theories.

            You guys keep leaning back onto what you consider to be the “best theory”. However, such theories developed in academic science don’t live within the regulated sphere as do theories that result in products, procedures, and medicines in engineering and medicine. There results must be empirically established as sound and effective before they get foisted on people. Professionals can’t cut somebody’s arm off to see what happens.

            Further the entire liberal meme is about how economic deprivation harms people. . . .yet the libs bending to elitist environmental concerns and attempting to alarm the people about CO2 is going to create economic deprivations for the poor, especially in this country when this country starts agreeing to exceptions for other countries.

            This regulation of doctors, engineers, and accountants simply doesn’t apply to authoritarian governmental systems with sufficient power to take everything the system desires away from the people. In terms of CO2 regulation that lack of accountability is paramount in my view. Favorite/best theories is the fodder of personal choice, not regulation.

          • bdgwx says:

            We probably should have done the environmental impact study prior to experimenting with the climate system. But we didn’t know any better at the time and so what’s done is done. Now the next generation may have to deal with the consequences that the previous generation foisted upon them. At least now we do have a few rounds of the EIS complete so we’re not flying blind anymore. Still much to learn though…

          • bill hunter says:

            bdgwx says: “We probably should have done the environmental impact study prior to experimenting with the climate system. Now the next generation may have to deal with the consequences that the previous generation foisted upon them.”

            Experimenting with the climate system? Life itself is an experiment. One cannot do an EIS on unknown impacts. Further, I would judge future generations have much more to worry about, like namely how many of them will survive gestation. The impacts of that are well known.

          • Svante says:

            Aha, the liberal leftist CO2 molecule is disregarding poor people.

          • Nate says:

            Bill pretends it’s all about the science being wrong for awhile, until frustrated with how that is going, his true concerns come out

            “further the entire liberal meme is about how economic deprivation harms people. . . .yet the libs bending to elitist environmental concerns..yadda yadda yada”

          • bill hunter says:

            Nate says: – Bill pretends it’s all about the science being wrong for awhile, until frustrated with how that is going, his true concerns come out-

            Don’t project your tunnel vision on me Nate.

            I am an environmentalist and I believe that reducing fossil fuel use would have some benefits. Personally, that has nothing to do with CO2 as I think CO2 will result in a net benefit. However, CO2 is not the only issue surrounding fossil fuel use.

            And as an active environmentalist when it appears some benefits are to be had through regulation, I get behind it as long as the cost of environmentalism is borne primarily by those with the most interest in it. Environmentalism is a luxury affordable only to those who have the resources and the lack of competing problems so they can benefit from it.

            You might be into “saving the earth”, but the earth doesn’t need saving and even if it did you have absolutely zero idea of what would be required. The only thing you can see is what is a benefit for yourself. I ascribe not to the concept of saving the earth but instead to the concept of protecting nature for the benefit of mankind.

            In order to get beyond the end of your own nose in understanding what might benefit mankind it behooves you to listen to the concerns of all others, in particular those struggling the hardest. Wanting to help 3rd world countries is an honorable desire but becomes an evil deed when you do it on the backs of your poor neighbors. There is way too much special interest attention in politics, the wealthy, public employee unions, and corporations; and way too little attention to the common man.

          • Nate says:

            It’s ok Bill to admit you despise libtards so much that you can’t bring yourself to look at the science objectively. You are in good company here.

          • Nate says:

            ‘Gee, Nate you seem subject to selective inculcation.

            How about the warming from 1911 to 1945? What emergence from natural variability did that come from?’

            What about those years? They CAN be explained with natural variability (volcanoes ~ 1905-1915, ENSO 1940s) and the initial onset of AGW.

            The point has been to understand the record WE HAVE with known natural and anthropogenic forcings that are validated with physics-based models combined with empirical knowledge.

            This is what Roy did in this post. This is what GCMs do.

            This what Hansen did in his 81 paper. Then he went further and boldly predicted how the temperature, and its spatial pattern, would change over the next 4 decades.

            The difficulty of doing that can not be overstated, and therefore, objectively, it must be considered a convincing piece of evidence that adds to many others.

          • bill hunter says:

            Nate says: —-Its ok Bill to admit you despise libtards so much that you cant bring yourself to look at the science objectively. —-

            Libtards? I never use that word.

            You aren’t a liberal. Liberals are freedom loving people who believe in helping others. You are also not a progressive as progressives also like to do stuff that actually helps people.

            Today’s phony liberal likes to hurt the weak and think that giving them a few handouts is adequate compensation. Calling them libtards is an insult to true liberalism. Just plain mean people fits so much better.

            Nate says:
            —-What about those years? They CAN be explained with natural variability (volcanoes ~ 1905-1915, ENSO 1940s) and the initial onset of AGW.—-

            You are going in circles. Rationalizing a rationalization without evidence the initial rationalization is correct is like riding a pony ride at the fair. All it does is go around in circles.

            Nate says:
            —-The difficulty of doing that can not be overstated, and therefore, objectively, it must be considered a convincing piece of evidence that adds to many others.—–

            Nothing at all difficult about that. I made an entire career out of straightening people out on that single piece of illogic. Climate is always changing. Anybody can easily predict it will change simply by continuing to predict it over and over again. Eventually they will be right. The trick isn’t predicting climate changing or running in a single direction because it has a history of doing that for 10’s of thousands of years at a time. The trick is predicting when it will change and giving the date. One gets into a debate with somebody about when human emissions began to take effect and it becomes a game of excuses. . . .aerosols, volcanos, stars, ocean uptake, selectively after the fact observation adjustments. God only knows what else.

          • Nate says:

            Bill, you are building a strong case that you are anti-science.

            “The trick is predicting when it will change and giving the date”

            Then you should very pleased that Hansen certainly did just that!

            If you think he should have identified an exact month or year, then…well strawman supremo.

            Here’s how science at its best actually works. If your model can account for what we already know, eg past Earth temperature record, or in the case of General Relativity, Mercury’s orbit anomalies, then that’s good.

            But if you then use the SAME model and predict accurately a future set of observations with it, Earth temp pattern over next 40 y, or in case of GR, the shift of star positions near a solar eclipse, then that is very impressive indeed.

            That feat, and further successful tests, are what lead most other scientists to be convinced.

            If a few individuals are very determined to stay unconvinced, oh well, no matter.

            Science moves on regardless.

          • bill hunter says:

            Nate says: —Science moves on regardless.—-

            Well it certainly moves along without you. You haven’t come up with a single scientifically-established principle I disagree with yet you are way out there with your speculations.

          • Nate says:

            Bill here is the current record of global temp thru 1980. Very similar to the one shown in the Hansen 81 paper with the same 5 y smoothing.

            https://tinyurl.com/v5vl967

            The paper modeled this record, and as I noted it then used that model and “predicted how the temperature, and its spatial pattern, would change over the next 4 decades.”

            You: ‘Nothing at all difficult about that.’

            OK, please look at the record that we had then, and tell us precisely how you would have gone about predicting the next 40 y.

            Of course you need to pretend that you have not come from the future.

          • Nate says:

            ‘a game of excuses. . . .aerosols, volcanos, stars, ocean uptake, selectively after the fact observation adjustments.’

            Yes, in 1981 paper, volcanoes, the sun, ocean uptake, and CO2 were all needed to model the surface temp history.

            Roy additionally included ENSO, again well known to impact surface temperature, and improved the fit to the past record.

            Why do you think science is making ‘excuses’ by including in a model of surface temperature, natural phenomena that are known, empirically, to affect surface temperature?!

          • bill hunter says:

            Nate says: —OK, please look at the record that we had then, and tell us precisely how you would have gone about predicting the next 40 y.—

            Well you build a model based upon the size of the greenhouse effect under the assumption that CO2 accounts for all of it, then look at the historical data i.e. 1870 to 1944 and replicate it as obviously nothing else could account for that increase under your assumption that CO2 is the control knob and viola you have incorporated all recent historical natural and unnatural changes in your model. The only thing that could go wrong would be something that caused significant natural change to stop or reverse. Since ice core records have a variance of a couple degrees C over the course of several centuries warming is apt to continue perhaps for another century from the warming the began around 1700.

            Thats essentially how you model anything. The real deal comes in validation. If you are claiming that something mankind is doing ever increasing emissions you will know that validation will not come soon and thus you get real political about it instead.

          • bill hunter says:

            Nate says: —-Why do you think science is making excuses by including in a model of surface temperature, natural phenomena that are known, empirically, to affect surface temperature?!’—-

            Its an excuse because even Hansen admits we know very little about the effects of natural phenomena on climate. Corrections have gone through massive changes from when it was first identified that explanations were in order. Explanations have gone through their own process of criticism to a point where the most defensible adjustments are the ones we know the least about.

            Dr. Syun Akasofu noted this as his major complaint that we need to understand natural phenomena in order to correctly parse out the effects of CO2.

            An auditor understands how to detect bias in this process. I spotted it about 5 minutes into my examination of the topic about 12 years ago. It was one chart published by the IPCC that clearly sent a message of bias.

          • Nate says:

            “we know very little about the effects of natural phenomena on climate. Corrections have gone through massive changes from when it was first identified that explanations were in order. Explanations have gone through their own process of criticism to”

            Again Bill, here you are criticizing science for doing exactly what science SHOULD be doing. And that is trying to understand what we observe with empirical data and models, then improving those models over time as we gather more empirical data.

            Eg. Volcanoes. After modeling the response of temperature to past volcanoes we had Pinatubo in 91, and used data from it to test and improve the models.

            Or Ocean heat uptake. We now have Argo data to test and improve the models.

            In every area of Earth science such progress is being made.

            This is why I use the the term ‘anti science’ to describe your criticisms of this type of model improvement as ‘excuses’.

          • Nate says:

            “Well you build a model based upon the size of the greenhouse effect under the assumption that CO2 accounts for all of it, then look at the historical data i.e. 1870 to 1944 and replicate it as obviously nothing else could account for that increase under your assumption that CO2 is the control knob and viola you have incorporated all recent historical natural and unnatural changes in your model.”

            Bill,

            a. Your prediction of the future is built on the CO2 GHE. That seems to be an admission that it is required to make a prediction.

            b.Your ‘assumption that CO2 accounts for all’ is not what was done and did not work to model the temp record.

          • Nate says:

            And

            c.To stop looking at the record after 1944. Why? No credible prediction of the future would be made by simply ignoring that part of the record that doesn’t fit.

          • bill hunter says:

            Nate says: ‘Again Bill, here you are criticizing science for doing exactly what science SHOULD be doing. And that is trying to understand what we observe with empirical data and models, then improving those models over time as we gather more empirical data.’

            Thats your problem with science Nate. . . .your reading comprehension scores are too low.

            I never complained about science doing modeling or adjusting those models or fixing anything else that is a problem. Your reading comprehension abilities are screwing you up. In fact, professionally I have done modeling and done all those things. What I take issue with is after all that without a shred of real validation they claim the science is settled. I have no other complaint than that.

            Nate says: ‘This is why I use the the term anti science to describe your criticisms of this type of model improvement as excuses.’

            thats not anti-science Nate thats anti-scientist claiming his work has been validated after making all those adjustments.

            Adjustments are fine when an experiment is going awry but its time to reset the clock not claim validation.

            Its not science when you have to fiddle with the instruments mid experiment when they aren’t producing the results you want. But fiddling with the instruments is a pre-experiment activity. Its only a validation because they want it to be.

            Nate says: ‘Bill,

            a. Your prediction of the future is built on the CO2 GHE. That seems to be an admission that it is required to make a prediction.’

            What predictions? I made no predictions. Is that your lousy reading comprehension deceiving you?

            Nate says: ‘Bill,
            ‘b.Your assumption that CO2 accounts for all is not what was done and did not work to model the temp record.’

            Obviously your reading comprehension of the science has caused you to confound short term climate variation from natural factors with the Hansen’s conclusion that the mean greenhouse effect is totally controlled by CO2. Its hard to imagine how long you have been involved in this discussion and even that hasn’t sunk in yet.

            Nate says:’And

            c.To stop looking at the record after 1944. Why? No credible prediction of the future would be made by simply ignoring that part of the record that doesnt fit.’

            They didn’t just ignore it Nate, they figured the rate of warming would accelerate over the 1911 to 1944 natural warming. As an auditor I spotted that almost instantly because its the most common audit finding there is; where people selectively look at the past in order to estimate the future in a way thats favorable to them.

            And of course if you are looking at someone else’s work and the results are not favorable to you and you believe them. . . .well what can I say? Its the major reason there is an audit profession.

            So as much as you want to pigeon hole me so you can disregard what I am saying, that has zero effect on what I am saying. You need to sharpen your skepticism its so dull it wouldn’t cut butter.

          • Nate says:

            Bill,

            You said about predicting the future Earth temperature in 1980:

            “Nothing at all difficult about that.”

            Then I asked how, and you tried to answer:

            “Nate says: OK, please look at the record that we had then, and tell us precisely how you would have gone about PREDICTING the next 40 y.

            Well you build a model based upon the size of the greenhouse effect under the assumption that CO2 accounts for all of it, then look at the historical data….”

            Now you say:

            “What predictions? I made no predictions. Is that your lousy reading comprehension deceiving you?”

            Ok it seems you did not understand the question, or evaded it because you realized that it IS quite difficult to make a prediction without including the CO2 GHE.

          • bdgwx says:

            People have been trying for decades to make predictions using weak-GHG or no-GHG theories and those predictions inevitably end up being bad. Many of them are so astonishingly bad that they can’t even get the direction of the temperature changes correct. Nevermind their failure in explaining the paleoclimate record.

          • bill hunter says:

            Nate says: —-Then I asked how, and you tried to answer:——

            Reading comprehension got you again Nate. If you think you know that CO2 is the control knob a prediction is easy. If you don’t know what CO2 can do its impossible.

            so making predictions when you think you are a know it all is easy. All you need is faith that you are right because you sure don’t have science.

            bdgwx says: “People have been trying for decades to make predictions using weak-GHG or no-GHG theories and those predictions inevitably end up being bad. Many of them are so astonishingly bad that they can’t even get the direction of the temperature changes correct. Nevermind their failure in explaining the paleoclimate record.”

            That has nothing to do with validating a theory bdgwx. Using that as such is the fallacy argumentum ad ignorantiam.

          • Nate says:

            Bill,

            “If you think you know that CO2 is the control knob a prediction is easy. If you don’t know what CO2 can do its impossible.”

            So..you admit it is not possible to make a prediction at all, much less an accurate one, without including CO2.

            Progress!

            While if we include CO2, it is easy to make a prediction. But it could easily end up wrong, if CO2 is not a factor, or if you dont understand the natural contributions, or if you dont understand the ocean uptake.

            But to have it be qualitatively and quantitatively accurate about the past and the future, and include natural, and be based on physics…not easy!

          • Nate says:

            Bill, One thing you said that hasnt been addressed is this:

            “Since ice core records have a variance of a couple degrees C over the course of several centuries”

            What period are you referring to here?

            Im not aware of any reconstruction of global temps showing that for last 2 millenia.

            You might be thinking of Greenland-only temps.

            The century-scale variations in the global reconstructions are typically in the range of 0.5 C.

            https://en.wikipedia.org/wiki/Hockey_stick_graph#/media/File:1000_Year_Temperature_Comparison.png

          • bdgwx says:

            Bill said: That has nothing to do with validating a theory bdgwx. Using that as such is the fallacy argumentum ad ignorantiam.

            Yes it does. If your model/theory does not match observations with reasonable skill then it is not valid. That’s called falsification.

          • bill hunter says:

            Nate says: —-So..you admit it is not possible to make a prediction at all, much less an accurate one, without including CO2.

            Progress!———-

            Thats meaningless Nate. Its all based upon a process that has never been verified by science Nate.

            Being able to input unverified processes in a model is easy as if you judge climate as random any scenario has an equal chance.

          • bill hunter says:

            bdgwx says: ”Bill said: That has nothing to do with validating a theory bdgwx. Using that as such is the fallacy argumentum ad ignorantiam.’

            Yes it does. If your model/theory does not match observations with reasonable skill then it is not valid. Thats called falsification.’

            Well thats precisely what the formal definition of argumentum ad ignorantiam is bdgwx. Here is the Google description of it:

            [i]’Argumentum ad Ignorantiam: (appeal to ignorance) the fallacy that a proposition is true simply on the basis that it has not been proved false or that it is false simply because it has not been proved true. This error in reasoning is often expressed with influential rhetoric.'[/i]

            The mainstream GHE isn’t true because it hasn’t been proven to be false! And of course the influential rhetoric is like: “the planet has a fever!” in attempt at scaring little boys and girls.

            Further I am not arguing its false.

            People tend to develop beliefs, its part of our nature of being decisive. However, the true philosophic position of a skeptic in this situation is to believe neither it is true nor that its false.

            If you take a position against the GHE as some quantify it you are judged to be a skeptic. However, technically, under that definition, if others don’t believe your position they are skeptics too. That would make everybody a skeptic all believing what they want to believe because they would be skeptical of everything else.

            An auditor has to train himself to be a true skeptic, keep an open mind, and not conclude anything until the evidence has been gathered. Its not an easy discipline.

          • Nate says:

            “Its all based upon a process that has never been verified by science Nate.”

            In your auditor opinion, Bill, not in the opinion of physical sciences.

            The basic procesess of the GHE havr been verified.

          • bill hunter says:

            Nate says:Its all based upon a process that has never been verified by science Nate.

            In your auditor opinion, Bill, not in the opinion of physical sciences. The basic procesess of the GHE havr been verified.
            ————–

            Thats does not at all appear to be true Nate.

            The key process that involves all the gases in the atmosphere (due to a multiple layered model) is the exchange of heat trapped at TOA down through layers of the atmosphere back to the surface. Where is that described and verified? Currently its thought to be ok to just plug the necessary numbers in a model to produce a greenhouse effect.

            Its not guess work its reverse engineering from the results desired based upon faith that CO2 is the ultimate cause of the GHE.

            Science has already admitted that they can’t verify it because of the inability to experiment with a planet. They won’t verify it within in any reasonable timeframe that makes the modeling exercise cost effective for that purpose. The theory will either remain unverified or it will be falsified anytime in the next few hundred years.

            Dr. Syun Akasofu hits the nail on the head when he said that you must first understand how natural variation works (i.e. how the atmosphere works) in order to understand the effects mankind will have on it. Yet what we have is like kindergarten going on in the understanding of how the atmosphere works. Just a decade ago there was almost complete denial of any future role for natural variation in the climate. Thats ignorance on steroids.

  9. Perfecto says:

    Climate Science – where papers about data fabrication are the cutting edge.

  10. spike5 says:

    OHC was basically model based before ARGO, and still mostly is.

    Models made to comply to the meme.

    Very few measurement anywhere in the Southern oceans before ARGO

    https://i.postimg.cc/8PT3MYqB/ocean_temp_coverage.png

    The whole exercise is basically meaningless.

  11. frankclimate says:

    Roy, your calculated ECS ( with adjusting for ENSO) is fairly well corresponding to the found best estimate in LC18 and also my recent blogpost https://judithcurry.com/2020/01/10/climate-sensitivity-in-light-of-the-latest-energy-imbalance-evidence/ looking at the latest foundings of the Earth energy imbalance during the last 20 years is in this ballpark. IMO we get multiple lines of evidence…

  12. Ftop_t says:

    +1

    An unbiased look at the measuring process compared to the derived result for change in temperature clearly shows the perceived change is a fraction of the margin of error.

    Imagine someone professing that the average temperature of their oven for the month is 44C where as last month it was 39.996C and then claiming it was because they had guests over exhaling more this month vs how often they cooked.

    Wind speed, cloud cover, changes in ocean currents have orders of magnitude greater unaccounted for impact than the calculated change.

    • Nate says:

      ‘for change in temperature clearly shows the perceived change is a fraction of the margin of error.’

      Except no one is claiming they can account for the one year change in temperature with AGW alone. That is a strawman.

  13. Stephen P Anderson says:

    Simon Aegerter and Hermann Harde have now commented over at edberry.com.

  14. Ovi says:

    What is the solid blue line? Is it an average of the temperature data or is it the model? This post is over my head and I need clarification.

  15. gallopingcamel says:

    @Nate,

    You say that CO2 is forcing temperature and you are probably right.

    However if the effect was as powerful as the IPCC suggests (1.5 to 4.5 K per doubling of [CO2]) the CMIP models would be working.

    Clearly the IPCC’s models don’t work and my contention is that the effect of CO2 is at least an order of magnitude less than the IPCC claims.

    While consensus is irrelevant in science I do get a warm feeling when prominent scientists appear to agree with what I have been saying for many years:

    https://youtu.be/Oog7-KOtpEA

    • bdgwx says:

      CMIP models work pretty well.

      https://tinyurl.com/ulcn6tt

      Can you present a model that provides a better match to observations from 1880 through 2019?

      • gallopingcamel says:

        From 1880 to 1998 there is a plausible correlation between average global temperature and the Keeling curve if you ignore the decline from 1933 to 1975.

        After 1998 you are into the “Pause” and it is a “Travesty” that models based on CO2 can’t explain that.

        The CO2 theory is completely demolished by the Greenland and Antarctic ice core studies.

        As to models that do work I am making progress and hope to have something published soon. My model shows a [CO2] sensitivity about 50 times lower than what the IPCC claims. Wish me luck with the peer review process!

        • bdgwx says:

          I’m more interested in the correlation between the net effect of all forcing agents and the global temperature than in any one agent alone.

          I don’t see the travesty during the ‘pause’ that you speak of. There is certainly some divergence relative to CMIP5 that has since been made up. CMIP6 did much better. Neither has experienced an excursion outside the 2-sigma envelop for the last 90 years.

          Ice cores are consistent with the hypothesis that CO2 is a player in the overall climate system. I’m not sure what you think is being demolished here.

          Great. I’m looking forward to seeing your model. Make sure you back test it against the paleoclimate record as well. We need it to be consistent with the PETM, other ETMx periods, magnitude of glacial cycles, transition from 40k to 100k cycles, faint young sun problem, etc. We also need it to be consistent with other contemporary observations like OHC, cryosphere changes, cooling of the stratosphere, etc.

    • Nate says:

      “Clearly the IPCCs models dont work and my contention is that the effect of CO2 is at least an order of magnitude less than the IPCC claims.”

      How can it be an order of magnitude when direct comparisons show the average run is low by AT MOST a factor of 2?

      How can it be an order of magnitude when skeptic analyses find a sensitivity within the IPCC range, like Roy’s 1.85C?

      • wert says:

        The Liberal truth: the range is from 1.5 to 4.5, or worse, and people who endorse anything under 2K, are de nialists when those who speak for 10 degrees at Arctic, are considered some good people.

        So yes, the IPCC is the truth but also it is too conservative and we have only 10 years, even if the AR didn’t say so.

        Did this clarify the difference between oil shills and real scientists (such as Mann, Hansen, Oreskes)?

        /may contain a source of sarcasm

        OoM == factor of ten, usually, sometimes factor of two.

    • bobdroege says:

      I wouldn’t put much stock in that guy, he thinks the Sahara Desert is in Europe.

    • Dr Roys Emergency Moderation Team says:

      “As to models that do work I am making progress and hope to have something published soon. My model shows a [CO2] sensitivity about 50 times lower than what the IPCC claims. Wish me luck with the peer review process!”

      Best of luck GC.

  16. Scott R says:

    This paper I read made me say wow today. I guess I’m not the only person to see the 60 year cycle in the AMO. I was very surprised to read about how the reconstructed TSI was manipulated. That definitely gives one pause considering it was just adjusted again on the SORCE website. You guys may have heard me complain about that. I’m not fully on board with everything here in this paper, some of the timings were off. I don’t think the author realized that there is also an 84 year component within the AMO and southern ocean.

    https://www.researchgate.net/profile/Nicola_Scafetta/publication/249316185_Solar_and_Planetary_Oscillation_Control_on_Climate_Change_Hind-Cast_Forecast_and_a_Comparison_with_the_CMIP5_GCMS/links/0c96052d466457edd4000000/Solar-and-Planetary-Oscillation-Control-on-Climate-Change-Hind-Cast-Forecast-and-a-Comparison-with-the-CMIP5-GCMS.pdf?origin=publication_detail

    • Scott R says:

      I recently made a facebook post about the natural cycles I found within the southern ocean. (60, 84 years in length)

      https://www.facebook.com/100000276969216/posts/2914986341853903/?d=n

    • Dan Pangburn says:

      AMO index is graphed at Figure 6 in http://globalclimatedrivers2.blogspot.com and appears to have a period of about 64 years which is the same as 5-yr smoothed average global temperature as shown in Figure 10.6

      • Scott R says:

        Dan,

        Look a little deeper. Ive found that there are actually 2 components to the AMO. 60, 84 years which align to orbital forcing from Jupiter, Saturn, Uranus. How these cycles amplify or interfere with each other determines the data. Look for the 60 year down beat at 2000, 1940, 1880 roughly. Every 3rd great conjunction occurs near Jupiters perihelion. It has the strongest signal in the data set.

        • Dan Pangburn says:

          Scott,
          Thanks for that. I have long suspected some sort of relation between other heavenly bodies and the ocean cycles but have not come up with anything.

          The 64 year saw-tooth approximation has worked well for the net of all ocean cycles since 1895. It is still holding (96.7% match with measured average global temperature 1895-2018, Fig 10.6 at http://globalclimatedrivers2.blogspot.com ) but I expect it to eventually fade.

          What do you think a time dependent function that accounts for the net of all oceans should look like?

  17. Ryddegutt says:

    The large worldwide ocean current circulation can have cycle times in the order of 1000 years. Maybe we see a 1000 years old MWP signature in the ocean today.

    https://ui.adsabs.harvard.edu/abs/2017AGUFMPP41E..07G/abstract

    https://notrickszone.com/2019/01/10/science-the-deep-ocean-plays-a-leading-role-in-global-warming-its-colder-now-than-during-the-1700s/

  18. bdgwx says:

    IPCC AR5 shows +2.30 W/m^2 and maybe +0.1 W/m^2 of anthrop and natural warming respectively through 2011. CO2 to present adds 5.35*ln(411/391) = +0.27 W/m^2. That brings us up to +2.7 W/m^2. The EEI is +0.7 W/m^2. That means about 2.0 W/m^2 has equilibriated. BEST shows 1.0C of warming. This results in a climate sensitivity of 1.0 / 2.0 = 0.50C per W/m^2. We have 5.35*ln(560/411) = 1.6 W/m^2 + 0.7 W/m^2 = 2.3 W/m^2 of unmaterialized and EEI forcing still needing to equilibriate. And 0.50 * 2.3 = 1.15C of future warming. So 1.00C of transient warming + 1.15C of future warming we have 1.00 + 1.15 = +2.15C. That’s my back-of-the-envelop calculation. A bit higher than 1.85C, but still below ~3.0C of warming estimated by the IPCC for 2xCO2. And yes, I’m aware that this is dependent on several assumptions and subject to errors as a result of glossed over details that are all open for debate. The point is that different observation based methods do indeed yield lower amounts of warming than what the IPCC is estimating. But…one important question is will the sensitivity (in C per W/m^2) remain low or increase as is expected?

    • Dan Pangburn says:

      Estimates of climate sensitivity have been declining for decades. https://notrickszone.com/2017/10/16/recent-co2-climate-sensitivity-estimates-continue-trending-towards-zero/ . Analysis using Hitran data show CS to be not significantly different from zero. https://watervaporandwarming.blogspot.com

      • Loydo says:

        “Estimates of climate sensitivity have been declining for decades.”

        No they haven’t Dan. You’ve been tricked. This is what that graph looks like when it hasn’t been doctored by removing the recent high results. Its bogus and Scafetti is a Heartland conman. The complete compilation shows it has been steady for decades.

        https://www.carbonbrief.org/wp-content/uploads/2019/03/Updated-compilation-of-climate-sensitivity-studies-featured-in-the-Carbon-Brief-climate-sensitivity-explainer.jpg

        Your second link it is equally disinforming…try this one.

        https://www.youtube.com/watch?time_continue=1&v=4PAbm1u1IVg&feature=emb_logo

        • Dan Pangburn says:

          Loy, A graph without source references is worthless. But never mind, it is wrong anyway. CS is not significantly different from zero.

          Your second link, perhaps intended for children, provides a misleading concept of the GHE, partly because it apparently does not understand that most of the absorbed energy is radiated by water vapor molecules not CO2 molecules.

          Your comment on my second link is also worthless. The analysis at the link might be different from anything that you have encountered before. Do you know what Hitran does? I have yet to see where anyone correctly accounted for water vapor.

          A key result is demonstrating that water vapor has been increasing faster than POSSIBLE from feedback. I suggest you actually study the analysis and try to understand it. I welcome specific comments.

        • Nate says:

          Dan, you show a graph, and some claims of what it shows. Have you shared the details about it with the scientific community via a peer-reviewed publication?

          • Dan Pangburn says:

            Nate,
            I show many graphs and analyses and it is all available on-line to the public. I welcome rational challenge.

            The peer reviewers of the top journals are alarmists and reject papers outright which disagree with their perceptions. Thus the plethora of papers agreeing with their perceptions and paucity of papers that do not. The lessor journals are not so much afflicted and might be more receptive. There is a growing number of peer reviewed papers e.g. listed at https://notrickszone.com/2019/06/17/consensus-200-new-2019-papers-support-a-skeptical-position-on-climate-alarmism which support the skeptic position.

          • Nate says:

            ‘The peer reviewers of the top journals are alarmists and reject papers outright which disagree with their perceptions. ‘

            There are a variety of papers published that disagree with IPCC conclusions, that analyze available data and come to different conclusions for example about climate sensitivity.

            Peer review is imperfect, but it is an important filter of junk papers which make unsubstantiated claims, misrepresent or neglect to mention previous findings, fail to understand established facts or physics, or which leave out unfavorable data.

            People who are most likely to have the expertise in the field to judge whether your paper is ‘junk’ or not, are unlikely to seek it out on your blog.

          • Nate says:

            So for example, your paper makes this claim

            “Humanitys contribution to planet warming is from increased atmospheric water vapor resulting nearly all from increased irrigation. The increased CO2 has negligible effect on warming. ”

            Given that your paper focuses on water vapor, but does not actually demonstrate that CO2’s effect and its feedbacks are negligible, this is a good example of what I would call an unsubstantiated claim, and would likely lead to rejection in peer review.

  19. gallopingcamel says:

    Dan Pangburn showed how sensitivities are trending downwards.

    When I tried to respond Dr. Roy’s “Bot” blocked me.

    So I will try sending my comment broken down into parts in the hope of finding out what is causing the problem.

  20. gallopingcamel says:

    PART A:
    Even though the sensitivity estimates are trending downwards they may still be far too high.

    Happer & Wijngaarden have a “Full Physics” model that has yet to be published in a peer reviewed journal but you can find it at the “co2coalition” site.

  21. gallopingcamel says:

    PART B:
    Happer understands the physics of CO2 better than most “Climate Scientist” points out that the effect of all the minor GHGs is minimal owing to “Saturation”.

    The model I use is simpler but it arrives at the same conclusion. My “Sensitivity Constant” is 0.02 K/doubling of CO2 concentration.

    • Loydo says:

      Happer should be ashamed of himself for perpetrating that myth. He would know full well that its at the top of the atmosphere where adding CO2 matters. There is little H2O up there so adding CO2 raises the emission height and that is what raises the temperature at the surface – not CO2 at the surface.

      Another way of putting it:
      For an optically thick atmosphere, it is the TOA budget plus the lapse rate that dominantly control the surface temperature. The surface budget is relatively unimportant. Another way of looking
      at it is that the atmosphere is so opaque to IR that the radiation to space is determined by just the first one optical depth from the top, which, loosely speaking, reaches into the mid trop.

      In pictures:
      https://1.bp.blogspot.com/–auq-uToKy0/Xh51G89lsfI/AAAAAAAAErA/ucmk-4QT_YQ5yQ5c-PF0Vd57JMVQaK7yQCLcBGAsYHQ/s1600/Picture1.png

      Surprise, surprise, Heartland again.

    • Nate says:

      80 y old Happer is not a climate expert and is now focused on political advocacy.

      He is unfortunately another in a long line of accomplished scientists who have gone off the rails when they got elderly.

      • gallopingcamel says:

        Clearly you did not bother to read the paper either. At sixty six pages full of equations it is quite challenging.

        Happer is trying to figure out why the IPCC’s model don’t work. If you don’t like Happer’s explanation, do you have a better explanation for why the models fail?

      • Nate says:

        “Clearly you did not bother to read the paper either. At sixty six pages full of equations it is quite challenging.”

        See my comment above on one of their papers.

        Did you understand it? Why do you think its correct?

        • gallopingcamel says:

          “Did you understand it? Why do you think its correct?”

          My expertise is similar to Happer’s (quantum electro-optics) but he knows far more about CO2 than I do. IMHO opinion only a handful of people in the world can match him on that topic.

          I do not say that Happer is correct. Nothing any physicist tells you is “correct” in the sense that it can be called “TRUTH” or a “LAW”. All we have in physics is the ability to represent reality in equations.

          There are two things I like about Happer’s paper. Firstly it is closer to representing what is observed than the IPCC’s GCMs.

          Second, it agrees with my model.

        • Nate says:

          If we admit that we are not expert enough to understand a paper, as I also often have to admit, then IMO we cannot objectively judge who has done it right.

          If one outlier paper disagrees with hundreds of previous papers, then assuming the outlier is the right one is a poor bet.

          Its based on ideological biases, and not facts.

          If it were a life or death medical choice, most of us would not pick the outlier.

          • gallopingcamel says:

            @Nate:
            “Its based on ideological biases, and not facts.”

            Not so. Happer’s model is “Full Physics” but that does not mean that it is right.

            My model is much simpler than Happer’s but that does not make it right either.

            The reason to prefer our models is that they come closer to explaining observations than our rivals such as James Hansen and Gary Russell.

            The way to test a model is to compare it against observations as Feynman explains:

            “It doesn’t matter how beautiful your theory is, it doesn’t matter how smart you are. If it doesn’t agree with experiment, it’s wrong.”

          • Nate says:

            “The reason to prefer our models is that they come closer to explaining observations than our rivals such as James Hansen and Gary Russell.”

            Love to see this oft-mentioned closer fit to observations.

            What observations?

      • Nate says:

        ‘explanation for why the models fail’

        Yes,

        a. the ‘failure’ of the models is highly exaggerated or even nonexistent.

        https://tamino.files.wordpress.com/2019/11/nasa.jpg

        b. The Earth is complicated, there are still some uncertain parameters, like aerosol and albedo forcings.

        The idea that the models need to show a perfect match to observations, else they are a ‘failure’ is not logical. Black and white thinking.

      • bdgwx says:

        GC, you’re going to need to define “IPCC’s model don’t work” objectively because the GCMs in the CMIP suite, radiative forcing, etc. models seem to work pretty well from my vantage point.

        https://tinyurl.com/ulcn6tt

        What is it that you are seeing with CMIP5 and CMIP6 that leads you to believe that they don’t work?

        https://tinyurl.com/y5rxmwgb

        What is it that you are seeing with paleoclimate models that leads you to believe they don’t work?

        https://tinyurl.com/sw84cqw

        What is it that you seeing with radiative forcing and energy budget models that leads you to believe they don’t work?

  22. gallopingcamel says:

    The problem was in the last part (PART C) that contains a youtube link. I will try again as it is a good one.

  23. gallopingcamel says:

    https://youtu.be/gLzcz_l391w

    You have to love the John Nash quote……….”disciplines that include the word “Science” in their titles are not science.”

    • Nate says:

      Sometimes true.

      Christian science.
      Scientology
      Political science.

      Not guaranteed

      Earth science
      Geoscience
      Materials science

  24. Snape says:

    @Loydo

    So a thicker atmosphere would not increase the GHE…… ours is already so saturated that higher is all that matters? Has this concept been proven, or just hypothetical?

    *********
    There is another way of looking at it:

    Chic Bowdrie: All the energy re-radiated from the surface will be absorbed in first km or so and thermalized by inter-molecular collisions. Another 100 ppm CO2 will not alter that phenomenon.

    Me: Yes, so there is a globally averaged altitude at which most of the upwelling surface radiation is absorbed. I would argue that adding another 100 ppm CO2 would result in this altitude being slightly lower.

    Given a lower altitude of emittance, the downwelling LWIR is now coming from a thicker, warmer layer of atmosphere, and is therefore more intense.

    In other words, an increase in radiative forcing to the surface.

    • gallopingcamel says:

      Whether you add 100 ppm of CO2 or take it away won’t change the fact that the troposphere is an adiabatic problem.

      In adiabatic problems what matters most is “Gamma” = Cp/Cv which is ~1.4 for air and 1.3 for CO2.

      Thus CO2 does have an effect but it is much smaller than the IPCC models assume.

  25. Scott R says:

    Not 1 model properly includes natural cycles caused by the orbits of planets. They effect both the barycenter of the sun, and the activity on the sun. Their unique effects on the NH and SH with their very different albedo can explain all the proxy data, all the recorded data from the 100,000 year cycle down to the 60 year cycle yet most mainstream scientists ignore it. 90% of the conversation here should be about fixing this situation and starting with an accurate assessment of natural climate changes due to the sun BEFORE humans started influencing it. Once we do that, we can truly gage our effects, which while grossly overstated, are not 0. Once we have accurately and honestly measured our influence with an open mind, we can try to figure out what has gone wrong in the models.

    • gallopingcamel says:

      You are not alone. Here is a link to the horde of relevant papers:
      https://notrickszone.com/2019/10/03/55-new-2019-scientific-papers-link-solar-activity-to-climate-change/

      • Bindidon says:

        gallopingcamel

        “Here is a link to the horde of relevant papers…”

        Are you serious?

        1. notrickszone.com is one of the trickiest pseudoskeptic web sites.

        2. Scafetta? Zharkova?

        Their papers are full of stuff completely debunked by real scientists like Leif Svalgaard.

        Sound skepticism is good, gallopingcamel. But what you show here isn’t.

        • gallopingcamel says:

          Shame on you Bindidon for your vile “Ad Hominem” attack on Nicola Scafetta.

          Nicola occupied the office directly above mine at the Duke university FEL (Free Electron Laser) laboratory.

          He is one of the most honest people I have ever met and one of the most courageous too.

          Nicola may be wrong from time to time but he is head and shoulders above the “Climate Mafia” when it comes to ability and integrity.

          • Nate says:

            GC’s very unhappy with criticisms of his team members, but calls an entire field of scientists ‘fraudsters’ and accuses them of doing ‘SINO (Science In Name Only)’

            Apparently he’s comfortable with his hypocrisy.

          • Nate says:

            Also, Bindidon has only criticized Scarfetta’s published work as having been debunked by another paper.

            Fair, IMO.

            Not technically an ad-hom which is attacking the person.

      • bdgwx says:

        NTZ’s talking points are contradictory. One argument will be “there is no consensus on the amplitude of historical solar forcing” and then the next will be “climate change and TSI variability are strongly correlated through the Holocene”. NTZ is a continual gish gallop of previously debunked talking points, falsified hypothesis, and contradictory statements absent a comprehensive alternative model that can explain and predict reality any better than what we already have.

    • ren says:

      So it is due to Jupiter’s gravity that the Earth has relatively constant living conditions.
      Tidal heating (also known as tidal working or tidal flexing) occurs through the tidal friction processes: orbital energy is dissipated as heat in either the surface ocean or interior of a planet or satellite. When an object is in an elliptical orbit, the tidal forces acting on it are stronger near periapsis than near apoapsis. Thus the deformation of the body due to tidal forces (i.e. the tidal bulge) varies over the course of its orbit, generating internal friction which heats its interior. This energy gained by the object comes from its gravitational energy, so over time in a two-body system, the initial elliptical orbit decays into a circular orbit (tidal circularization). Sustained tidal heating occurs when the elliptical orbit is prevented from circularizing due to additional gravitational forces from other bodies that keep tugging the object back into an elliptical orbit. In this more complex system, gravitational energy still is being converted to thermal energy; however, now the orbit’s semimajor axis would shrink rather than its eccentricity.
      https://en.wikipedia.org/wiki/Tidal_heating

      • bdgwx says:

        No. Jupiter’s tidal interaction with the Earth is minuscule.

        • Scott R says:

          bdgwx,

          As Jupiter moves from it’s perihelion to aphelion, it makes sense that this creates a reoccurring wave of 12 years of solar activity within the sun does it not? A 2nd wave is formed as Jupiter and Saturn conjunct. Because there are 3 different conjunction locations, we have a 60 year cycle. These 2 competing waves create the 11 year solar cycle. Each type of conjunction does something different. The reason is that the earth is better at absorbing energy at certain times of year, and in the NH. Small changes in the earth sun distance do matter on a decadal time scale, especially when you consider that it isn’t the exact conjunction that matters, but where the planets set up for multiple years. Pouring extra energy into the NH summer makes the largest difference to global temperatures. Also both hemisphere’s get a boost during the Yoshimura cycle, when the conjunction occurs close to Jupiter’s perihelion. The only cycle that allows cooling follows the Jupiter Saturn conjunction near earth’s perihelion. That is precisely where we are at! As soon as this conjunction and the 3.6 enso harmonic end, I expect at least 15 years of sharp global cooling.

          • Scott R says:

            The only cycle that allows cooling follows the Jupiter Saturn conjunction near earths APHELION. sorry

          • bdgwx says:

            Sure. Jupiter may influence the solar cycle. But that’s a different topic.

            Jupiter’s tidal dissipation with the Earth releases about 100,000x less energy than that released from the Moon. The Moon’s tidal dissipation amounts to about +0.01 W/m^2.

          • Scott R says:

            bdgwx,

            I agree with you, Jupiter earth direct interactions are so small they can be completely ignored. If the relationship was direct, we would see a 13-14 month beat as the earth passes Jupiter.

            Clearly, the 3.6 year beat in the global temperature is a 3rd harmonic of the 11 year solar cycle, which surprisingly has an easier signal to detect then the 11 year cycle itself!

            I’d actually like to study the moon sometime, and it’s effects on climate, but I’m working down the list of forcers from most important to least. The moon isn’t in my top 4 that is for sure.

  26. Snape says:

    @gallopingcamel

    [Adiabatic:
    relating to or denoting a process or condition in which heat does not enter or leave the system concerned.]

    Heat is constantly entering and leaving the troposphere system, hence I was not discussing an adiabatic problem.

    • gallopingcamel says:

      The is an example of what Charles Mackay called the “Madness of Crowds” in 1841.

      This idea has been brought up to date by Irving L. Janis.

      I strongly recommend his book:
      “Groupthink: Psychological Studies of Policy Decisions and Fiascoes”

  27. Eben says:

    Debating over climate models is like debating the length of the Unicorns tail .
    I mean dudes are even sirius ???

  28. Snape says:

    @GP

    Sure, there is constant mixing within the LT, and that is considered an adiabatic process, but to say the troposphere is therefore an [adiabatic problem] is nonsense.

    Along with mixing, a continuous flow of energy is entering and leaving – just the opposite of adiabatic.

  29. Snape says:

    @GC, not GP

    • gallopingcamel says:

      “Nonsense” may be too strong a word.

      Like so many things in modeling it is an approximation that one makes to simplify analysis. The way to test such things is to compare what the equations say against observations.

      In the case of planetary tropospheres the dry adiabat can work very well. For example observations on Saturn fall within 6% of the dry adiabat prediction.

      On Titan and Earth the dry adiabat does not work well because both bodies have oceans. To fix this problem modelers use an “Adabatic Scaling Factor” (aka Alpha).

      When modeling Earth I use McClatchey et al. (1972) as the template. Setting “Alpha” = 0.60 produces an excellent fit in the troposphere.

      When modeling Titan I use the HASI (Huygens probe) data and set “Alpha” = 0.77. See here:
      https://diggingintheclay.wordpress.com/2014/04/27/robinson-and-catling-model-closely-matches-data-for-titans-atmosphere/

  30. The Earth conducted an experiment over the past three million years that charted climate change against atmospheric CO2. After comparing glacial and interglacial periods to CO2 levels, Earth’s finding was that there was no correlation. Several interglacials were noted that were warmer with much higher sea levels than the Holocene interglacial with atmospheric CO2 levels of 280ppm. Slightly lower CO2 levels were noted during glacial periods which ended before CO2 levels increased moderately. For the past three million years interglacials began when CO2 was low and ended when CO2 was higher.

    The same proved true for shorter periods since 1900; temperature rose rapidly from 1920 to 1940 with littler change in CO2 from 280ppm. Then as CO2 rose rapidly after 1940, global temperature fell rapidly until 1980. The rise in both temperature and CO2 from 1980 to 2000 was followed by a pause in temperature increase that persisted almost twenty years while CO2 continued to steadily rise.

    Looking at just the past 10,000 years, Greenland ice core and lake and ocean sediment cores show we now live in the coldest 1,000-year period of the past 10,000 years, and that the greatest warming and corresponding higher sea levels were found 6,000 to 8,000 years ago during the Holocene Climate Optimum. The following three warming periods before the present – Minoan, Roman, and Medieval – were each cooler than its predecessor and current warming is the coolest of all.

    Proof of warmer periods in the past 10,000 years are also evidenced by ancient tree lines further north and at higher altitudes, coral mounts several feet above current sea level, and ancient beaches above present ones.

    Thousands of studies exist that prove earlier warming was significantly higher and globally distributed. The Earth gives evidence that none of the models can refute.

    • gallopingcamel says:

      The only correlation I can find between CO2 and temperature extends from 1200 AD to 1998 which corresponds to the part of Michael Mann’s “Hockey Stick” that follows the Medieval Warm Period that he tried to air-brush from history.

      Even over that period there are temperature declines that occurred while [CO2] was rising. For example the decline you mention from the late 1930s to the mid 1970s.

      There is a strong correlation between CO2 and temperature shown in the EPICA and Vostok ice core records but the time resolution is good enough to prove that temperature leads [CO2]. Even in climate science cause precedes effect.
      https://wattsupwiththat.com/2012/04/11/does-co2-correlate-with-temperature-history-a-look-at-multiple-timescales-in-the-context-of-the-shakun-et-al-paper/

      Going further back in time it is hard to see any correlation between CO2 and temperature and there are several examples of anti-correlation, for example 145 and 435 Mega-years BP (Before Present):
      http://www.biocab.org/carbon_dioxide_geological_timescale.html

    • Nate says:

      Michael,

      Every spring in each hemisphere solar insolation increases, and the hemisphere warms. Seasonal warming.

      This has nothing to do with CO2 levels, but CO2 sources do respond to warming.

      Same can be said about glacial cycles.

      Neither one disproves that rising CO2 levels can ALSO warm the Earth.

  31. Snape says:

    The drug company Pfizer is one of 30 stocks in the Dow Jones index. If the other 29 are flat over the course of a year, and Pfizer is up, then you would see a perfect correlation between Pfizer and the Dow. Pfizer would have driven the market gain.

    In 2109 the Dow was up 22%, while Pfizer was down 10%. Does this prove the above claim is false? Does this prove there is no correlation between Pfizer and the Dow?

    • bdgwx says:

      Great analogy. Let’s take it further still.

      Merck has a surprise earning announcements. This boosts confidence in the industry causing Pfizer’s stock price to increase as well. The Dow as a whole goes up. Who catalyzed the increase? Merck. Did Pfizer still play a role in the magnitude of the Dow’s increase? Absolutely!

      As we’ve stated before CO2 is like Pfizer in the analogy. It can catalyze changes in temperature on its own thus yielding a lead relationship with the temperature. Or it can respond to a temperature change catalyzed by something else and force the temperature higher from there thus yielding a lag relationship with the temperature.

    • bobdroege says:

      It is easier to prove that someone who makes a claim of no correlation is talking nonsense.

      The only way to have no or zero correlation is if all your data is zero or all your data is the same, ie all data point are (3,4) (3,4) etc.

  32. Snape says:

    Thanks, and I like your additions.

  33. caffeine withdrawals says:

    If observations showed more warming since 1975 than the 1.85C model, wouldn’t that imply a higher sensitivity? Closer to 2-2.5?

    • bdgwx says:

      Yes. It’s pretty easy to see in Dr. Spencer’s graph above that a polynomial regression would result in an ECS > 1.85C. I don’t know how much greater, but certainly 2C and probably closer to 2.5C would be my guess as well.

  34. Dan Pangburn says:

    Lindzen & Spencer, accounting for all feedbacks, find Climate Sensitivity less than 1.5, probably about 0.3 and perhaps even negative. http://co2coalition.org/wp-content/uploads/2019/12/Lindzen_On-Climate-Sensitivity.pdf

    Water vapor has been increasing faster than POSSIBLE from water vapor feedback due to average global temperature increase. This indicates that CS is not significantly different from zero. https://watervaporandwarming.blogspot.com

    • Nate says:

      ‘This indicates that CS is not significantly different from zero.’

      No not obvious at all.

      It indicates that irrigation MAY be contributing to water vapor increase.

  35. Snape says:

    Dan
    Right or wrong, I think your idea is really interesting. Here is a study that comes to a different conclusion:

    https://iopscience.iop.org/article/10.1088/1748-9326/aae018

    • Dan Pangburn says:

      Snape,
      Thanks for the link.

      Interestingly the values they used for WV are lower than at present time. Huff estimate for cooling towers in 1971 was about 36% of mine in 2017 ( https://www.iea.org/data-and-statistics/charts/world-electricity-generation-by-fuel-1971-2017 agrees with the increase) Also, Boucher estimate for all human related emissions in 2004 is 77% of mine in 2017. Given the time differences, IMO the entirely independent estimates are very close to each other.

      On the downside, they used GCMs known to be faulty, which assume CO2 rules. This has been shown to be wrong at ground level by Hitran. They make this statement: ,,Increases in water vapour greenhouse effect are small because additional vapour cannot reach the upper troposphere,, which IMO is a bogus assumption. I did not see where they had accounted for WV increasing 1.5% per decade as measured by NASA/RSS. Also, they do not appear to grasp the mechanism of energy redirection made possible by thermalization. They mention neither.

      Bottom line, they were trying to determine the influence on global warming from WV with models that falsely assumed CO2 increase caused GW. I found that WV increase contributed to GW and CO2 increase tagged along.

      • Nate says:

        ‘are estimated for surface emission using idealised experiments conducted with the CAM5 global atmospheric model at fixed ocean temperatures. Water is introduced in vapour form at rates matching total anthropogenic emissions’

        “additional vapour cannot reach the upper troposphere,, which IMO is a bogus assumption.”

        To assert that their modeling of the movement of water vapor into the atmosphere is bogus, is simply that assertion without evidence.

        Meanwhile Dan, how are you modeling the movement of water vapor from surface into the troposphere?

        • Dan Pangburn says:

          Nate,
          I have no knowledge of how they model the movement of water into the atmosphere and did not comment on that. What makes no sense is their assertion that the added WV cannot reach the upper troposphere. What would prevent it? I suspect that their modeling imposes unrealistic constraints if that is what it determines.

          As I state in Sect 6 of http://globalclimatedrivers2.blogspot.com , I ASSUME that the % increase in atmospheric WV varies directly with the % change in vapor pressure. The assumption is implied in the later link. I believe I saw on-line legitimate measurements demonstrating this to be true but have not been able to find it back. The assumption is not used in the demonstration, using Hitran, that CO2 has no significant effect on climate.

        • Nate says:

          Well a constraint that seems reasonable is that the atmosphere in middle troposphere can only hold water up to saturation vapor pressure before it forms clouds and this is dependent on temperature.

          They say: “greenhouse-gas warming is outweighed by increases in reflectance from humidity-induced low cloud cover, leading to a near-zero or small cooling effect.”

          That seems plausible, no?

          • Dan Pangburn says:

            Nate,
            I agree that the saturation limit, properly applied, is appropriate for GCMs (the only GCM that I know of that appears to track actuals very well is the Russian one). I only use global averag.e stuff and it is never saturated everywhere so does not apply.

            I list a lot of other compelling evidence, but the Hitran assessment combined with allocation of two other factors besides WV results in a match of 96.7% of measured since 1895 indicates that I have identified the main drivers of climate chang.e.

            Water makes it cooler where you irrigate be.cause of evaporation but water vapor is a ghg and more of it makes it warmer everywhere else. Averag.e global WV has been increasing 1.5% per de.cade. Ocean surface temperature is cyclic, sunspots are cyclic and there is a limit to how much WV the atmosphere can hold so there is a limit on how much the planet will warm.

          • Svante says:

            Dan Pangburn says:
            “there is a limit to how much WV the atmosphere can hold”

            Yes, the limit depends on temperature, which is regulated by non-condensing GHGs.

          • Dr Roys Emergency Moderation Team says:

            Svante, please stop trolling.

        • Nate says:

          The other key point is they feel they need to use a general circulation model because the irrigation added humidity is near surface on land, and thus it doesnt distribute uniformly throughout the troposphere and everywhere on Earth.

          Its effect is more complicated than your simple model would suggest, and that effect can only be seen in realistic 3D model of the atmosphere.

        • Nate says:

          Dan,

          let me just make one last point. Your discussion in section 8 of the relative increase in GHE due to water vapor vs CO2:

          “8. Hitran [52] using Quantum Mechanics calculates, besides many other things, the relative absorb/emit intensity of water vapor molecules vs CO2 molecules. Comparison at zero altitude is shown in Figure 0.25.”

          I believe this is quite crude compared to the actual calculations of GHE of these molecules that can be found in the literature, which take into account the lapse rate and changes in mean altitude and temperature of the last radiating layer which is CO2-dominated.

          • Dan Pangburn says:

            Nate,
            The QM assessment identifies the absorb/emit properties (relative intensity vs wavenumber) of the mole.cules themselves. Lapse rate, etc. dont contribute.

        • Nate says:

          Dan, Just trying to understand what you are claiming and why.

          In your ch 14 calculation of CS for Co2 you find:

          ” This calculation resulted in CS = 1.07 K for doubling CO2 to 550 ppmv from 275 ppmv. ”

          Which seems consistent with what others find.

          Then you state:

          “Assessments in Section 2 have determined that CS is not significantly different from zero.”

          How does this make sense?

          • Ball4 says:

            Makes sense in that Dan is defining the meaning of his “not significantly different than zero” as CS = 1.07 K for doubling CO2 to 550 ppmv from 275 ppmv.

          • Nate says:

            Yeah, and that CS =1.07k is BEFORE the WV FB that he agrees should happen is included.

          • Dan Pangburn says:

            Nate,
            WV has been increasing faster than POSSIBLE from feedback.

          • Nate says:

            Dan

            Your work shows internal contradictions that need to be reconciled.

            1. Just Hitran calculated shows CS of co2 must be near 0

            2. Calculation in ch 14 shows CS from just co2 with no FB is 1.07 K.

            3. You claim extra WV beyond pred of your simple model of FB WV. Therefore CS of Co2 must be 0.

            In 3, the logic is lacking.

            a. EXTRA not/= ALL.
            b. Your model of WV expected from FB is a crude model, and it could be wrong (in fact other work finds different)
            c. No uncertainties given. Thus no quantitative conclusions can made.

          • Dan Pangburn says:

            Nate,
            I calculated CS several different ways for comparison. Using the default values in Modtran6 for 1976 Standard Atmosphere produced CS = 0.76. Area weighted averaging using defaults produced CS = 1.07. IMO the defaults are some sort of consensus opinion and CS is actually even closer to zero and might even be negative. Starting with the Hitran assessment, 10% of 0.6 K warming so-far due to CO2+WV = 0.06 K. S.caling CO2 up to 550 ppmv results in CS = 0.06 * (550-275)/(410-275) ≈ 0.12 K. And that would be reduced by the added cooling from added CO2 in the stratosphere.

            Measured water vapor increase trend is steeper than determined from feedback so there is no feedback effe.ct.

          • Dan Pangburn says:

            Nate,
            I struggled with the EXTRA not/=ALL issue and initially suspe.cted the same conclusion that you are apparently thinking might hold. One way to look at it is that irrigation provides WV therefore it is a dire.ct CAUSE of WV increase. WV is a ghg, therefore warming is a RESULT of WV increase.

            The Hitran assessment corroborates this.

          • Nate says:

            “One way to look at it is that irrigation provides WV therefore it is a dire.ct CAUSE of WV increase. WV is a ghg, therefore warming is a RESULT of WV increase.”

            Not solid logic there Dan.

            You find x can cause y and ASSUME nothing else can cause y.

            And you have found in one calculation that something else indeed causes y, and this agrees with findings of many others.

            You further ASSUME that this result must be wrong, because ‘1976 Standard Atmosphere produced CS = 0.76.’ is somehow incorrect in your opinion.

            Opinions and assumptions without logical or factual basis are not particularly valuable in science.

          • Nate says:

            Here is an example paper https://journals.ametsoc.org/doi/full/10.1175/JCLI-D-15-0485.1?journalCode=clim

            Notable findings that disagree with yours:

            “The PW trends are smaller over land than over ocean”

            “The scaling ratio of the PW percentage changes with Ts shows large spatial variations, with generally larger values over ocean than over land. This ratio ranges from about 4%7% K−1 over oceans poleward of 30 in both hemispheres to 10%14% K−1 over most tropical oceans, but it is below the expected value (~ 7% K−1) from the ClausiusClapeyron relation over most land areas.”

          • Dan Pangburn says:

            Nate,
            That paper contains several true statements but multiple erroneous ones. A particularly egregious mistake is a misapplication and possibly a misunderstanding of the Clausius-Clapeyron equation. The CC equation relates volume change to latent heat (enthalpy change) when a liquid changes to a vapor. They use it as though it was the first derivative of the vapor pressure vs temperature curve as a % of vapor pressure which, with compounding, maxes out at 7.37%/K. I calculate this at Section 7 of https://watervaporandwarming.blogspot.com .

            They say that ,, the amount of water vapor in the atmosphere is controlled by air temperature,, This is only true at saturation which occurs locally in GCMs but never when using global averages.

            In spite of Mears being affiliated with RSS, they were apparently not aware of the NASA/RSS TPW data in stating ,, reliable data of atmospheric water vapor are still lacking.,, . IMO, even if there is bias in the measuring system the trend of 1.47% increase per decade should be good.

            I work only with global averages. I made no comparison of PW trends over land vs over ocean.

            They assume that CO2 increase started the warming (there is no proof) and ignore the increase in WV as a result of irrigation. Their assump.tion is what is demonstrated to be wrong with both the simple calculations using Hitran data and the calculation of measured vs calculated WV increase trends shown in Figure 7.

          • Nate says:

            “They say that ,, the amount of water vapor in the atmosphere is controlled by air temperature,, This is only true at saturation which occurs locally in GCMs but never when using global averages.”

            I dont think you have proven this assertion.

            The general circulation is important and can’t be ignored. It produces latitude bands with very low RH, and deserts.

            These regions are not going to get humidified by distant irrigation.

            Why? because extra vapor is short lived, is funneled to already moist areas where it rains out, like the tropics, and temperate zones.

          • Dan Pangburn says:

            Nate,
            Saturation means relative humidity is 100%. Global average relative humidity is always less than 100%.

            This study shows that, on average, when average WV increases, humidity increases at dry places as well as wet places https://wattsupwiththat.com/2018/12/25/the-dryer-gets-wetter/

            The argument that WV does not matter because of short residence time is misleading. WV is continuously replaced and it is the WV at any time that matters as a ghg. Because I only consider global averages, global average WV applies. GCMs should use local WV.

          • Svante says:

            Dan Pangburn says:

            “This is only true at saturation which occurs locally …”

            And that local saturation puts a cap on the total atmospheric WV.

          • Nate says:

            “Because I only consider global averages, global average WV applies. GCMs should use local WV.”

            Yes, and that you can do that is an assumption without solid support.

            Your model is a gross simplification compared to what general circulation models can do, and thus your findings, which disagree with them, carry a big asterix, IMO.

            ‘Global average relative humidity is always less than 100%.’

            Yes and well below 71%, though > 71% of the surface is water. Because the atmospheric circulation and troposphere temperature mainly determine RH.

    • Dan Pangburn says:

      Ian,
      Most agree the planet has been warming. The big mistake by many is what caused it. This works: https://watervaporandwarming.blogspot.com

      • Stephen P. Anderson says:

        Wouldn’t warming cause more water vapor?

        • Dan Pangburn says:

          Ste,
          Yes. The higher vapor pressure of warmer water drives more moisture into the air. But the amount of WV in the atmosphere is measured by NASA/RSS and reported monthly. Analysis and Fig 7 in the linked paper show that the WV has been increasing faster than POSSIBLE from warming feedback.

          • Stephen Paul Anderson says:

            Why isn’t the temperature increase just non systematic randomness and this is causing WV to increase? And, that water vapor and CO2 have little effect on temperature. This seems like the most stable scenario.

          • Stephen Paul Anderson says:

            The non systematic random increase in temperature is causing both WV and CO2 to increase.

          • Dan Pangburn says:

            Ste,
            It is important to understand thermalization and be aware of the steep de.cline (~1200 to 1) in WV mole.cule population. The combination allows energy redire.ction. Much of the energy absorbed by CO2 at low altitude is thermalized making it available to WV mole.cules which, progressively with increasing altitude, emit it to space. This, combined with the increased radiation from CO2 mole.cules in the stratosphere is what has resulted in CS (to CO2) being not significantly different from zero.

            True, there is a lot of apparent randomness in the data. Much of this is likely a result of roiling (at this tiny fluctuation magnitude) of SST as shown in this animation: https://www.youtube.com/watch?v=aKMY4JRN0kk

            The 30+ year trend looks representative (that is all of the accurate global WV data available) and I have compared the measured WV trend with WV trends calculated from reported average global temperatures for the five reporting agencies. Some showed less separation and one (UAH) more than the example shown in Fig 7.

  36. gallopingcamel says:

    You can find Richard Lindzen’s latest thoughts on the sensitivity of climate to CO2 here:

    http://co2coalition.org/2019/12/04/on-climate-sensitivity/

    Dr. Roy gets an honorable mention. If you can’t be bothered to read the whole 28 pages here are two paragraphs from the summary:

    “Have we then proven that dangerous warming is truly impossible? Not quite. Although current estimates of short-wave feedbacks dont even suggest positive feedback factors in excess of about 0.3 (with the possibility of negative values remaining), we cant preclude that something may someday be discovered that raises this to a value that is significantly larger. Our simple calculation that suggested that sensitivities in excess of 1.5C were precluded depends upon the assumption that models are correct in producing negligible natural internal variability. It is, however, remotely conceivable that there was in reality (as opposed to in models) natural internal variability that was exactly what was needed to cancel the effect of high sensitivity, but that this internal
    variability would eventually be overwhelmed, and allow the high sensitivity to reveal itself.

    This remote possibility is far from settled science, and the thought that multi-trillion dollar policies would be implemented to putatively prevent this, seems far from rational. This is especially so when one considers that for about 95 percent of the time since complex life systems appeared (about 600 million years ago), levels of CO2 were much higher than they are anticipated to become (as much as 10-20 mes todays levels) without evidence
    of a relationship to global mean temperature.”

    • Gordon Robertson says:

      Cam…”You can find Richard Lindzens latest thoughts on the sensitivity of climate to CO2 here:”

      Don’t take my critique of this paper wrongly. I support both Richard and Roy in their work and their stance on catastrophic global warming. I just find the explanations far too simple.

      For example, Richard states in his paper: “When the rest of our atmosphere is added, several things change because our atmosphere contains various substances (water vapor, CO2, clouds and other less important gases) that absorb infrared radiation…”.

      There is no explanation as to how GHGs in the atmosphere that amount to about 0.31% of the atmosphere overall can cause this kind of warming (33C). The theory ignores the effect of the oceans and has never been subjected to the scientific method. Furthermore, it contradicts the Ideal Gas Law which requires gas to contribute heat based on their mass percent (Dalton’s Law).

      In the opening lines of the paper, the theory is related to Arrhenius and Callandar. One of the most important voices of that era has been omitted, that of scientist extraordinaire, R. W. Wood. He was held in high esteem by the likes of Niels Bohr due to his work on gases like CO2. Bohr consulted with him while formulating his quantum model of the atom on the subject of the spectral lines of sodium.

      Wood did not think CO2 could cause such an effect as claimed by Arrhenius et al. In fact, he performed an experiment to prove that heating in a real greenhouse was not due to infrared radiation, but to a lack of convection. Convection alone should keep the Earth’s surface cooler.

      Arrhenius was no lightweight, he was an esteemed scientist in his own right. However, Wood’s proposal that the warming of the atmosphere was due to the majority gases like N2 and O2 absorbing heat directly by conduction then rising into the atmosphere and being unable to release the heat, has my vote as a far better explanation for atmospheric heating. Coupled with the stabilizing and moderating effect of the vast oceans, I think the explanation lies there.

      Neither can I buy the argument that heating of the surface causes the negative temperature gradient in the atmosphere. That theory does not explain why the pressure gradient is also negative whereast the effect of diminishing gravity on tiny air molecules does.

      A negative gravity-induced pressure gradient is explained by gravityt, satisfying the Ideal Gas Law. Furthermore, I think it’s a stretch to claim anything adiabatic in a gaseous atmosphere with no barrier to constrain the gases.

      • E. Swanson says:

        Look, Gordo’s back! did they let you out of the loonie farm? OR did you get a new contract to spread disinformation for more loonies?

        I see that you are repeating your same claims to deny the Green House Effect, pointing to R.W. Wood’s simple experiment as proof that there’s no atmospheric Green House Effect. When will you ever get over the fact that the GHE was poorly named and is NOT a very good analogy for what happens in the atmosphere. Wood didn’t model the effects of CO2, just the effects of changing the emissivity of the cover plates on his boxes. But the effect may have been so small that his apparatus could not detect the change.

        My Ice Plate experiment demonstrated such an effect, showing that even a slab of ice could warm a heated plate more than an IR transparent plastic cover. No, that wasn’t a violation of the 2nd Law. Of course, I expect that you will probably ignore these results, as usual.

        BTW, nobody is arguing that “the pressure gradient is also negative” has nothing to to do with the negative temperature gradient. This fact results in vertical convection within the troposphere which moves sensible and latent heat to higher elevations, etc.

    • Nate says:

      GC,

      ‘Richard Lindzens latest thoughts on the sensitivity of climate to CO2’

      ‘If you cant be bothered to read the whole 28 pages’

      Given the hundreds of papers analyzing climate sensitivity, not sure why we should spend the time to read only this one?

      Probably better to read a review article like Knutti, 2017.

      https://www.nature.com/articles/ngeo3017

      It illustrates that the range of sensitivity found in these papers for the transient climate sensitivity, TCR, is at least 1.5 and most likely > 2.

    • Dr Roys Emergency Moderation Team says:

      E Swanson, please stop trolling.

  37. ren says:

    The temperature on the tops of tropical storm clouds in the South Pacific is around -85 degrees C.
    https://images.tinypic.pl/i/00996/qi8mf2rv18t7.jpg

  38. Scott R says:

    Have any of you ever thought about the red planet’s strange orbit? It is highly elliptical, and the perihelion location is peculiar. Jupiter seems to have corralled the perihelion of Mercury, Venus, Earth, Saturn, Uranus, and Neptune all to the same side of the solar system, but Mars is an outcast with it’s Aphelion on this side of the solar system. I wonder if the orbit of Mars was disrupted in the past by something which contributed to it’s current state (and also it’s volcanic activity shut down obviously which wasn’t good for it’s magnetic field). Sadly, the planet is energy starved. A more circular orbit probably wouldn’t help it move out of a co2 ice age. Maybe a larger tilt would as the ice at the poles would be limited to seasonal vs long term. It makes you wonder if there is a phase on Mars that can boost the atmospheric pressure enough for liquid water to be found in perhaps the deepest trenches and basins.

    https://arstechnica.com/science/2016/05/peering-into-the-ice-caps-of-mars/

    • ren says:

      Abstract
      The loss of water from Mars to space is thought to result from the transport of water to the upper atmosphere, where it is dissociated to hydrogen and escapes the planet. Recent observations have suggested large, rapid seasonal intrusions of water into the upper atmosphere, boosting the hydrogen abundance. We use the Atmospheric Chemistry Suite on the ExoMars Trace Gas Orbiter to characterize the water distribution by altitude. Water profiles during the 2018–2019 southern spring and summer stormy seasons show that high-altitude water is preferentially supplied close to perihelion, and supersaturation occurs even when clouds are present. This implies that the potential for water to escape from Mars is higher than previously thought.
      https://science.sciencemag.org/content/367/6475/297

    • ren says:

      It is likely that the gravity of the moon affects the maintenance of the Earth’s liquid core.
      The Earth’s troposphere is very thin. Its average height is only about 10 km.

      • Scott R says:

        ren interesting. Sad that is the case that water can be stripped away that easily. If only Mars still had it’s active core. I wonder about future terraforming activities for Mars. Yes we are venturing into fiction but just for fun why not?

        The Mars tilt is currently 25 deg, but has varied from 18-48 deg from what I read. If a large moon could be introduced to the planet somehow at the right time, you could stabilize that axial tilt in a range like 42-48 deg, you could end any chance of dry ice carrying over to the next season at the poles. That would increase the atmospheric pressure and perhaps warm the core enough to generate a magnetic field to protect it. Sadly, Ceres is an order of magnitude too small to do the job if we roughly consider that a moon needs to be 1% the mass of the host planet to heat the core. I haven’t run the numbers to see if a closer orbit might make up for that without destroying Ceres. Just for the sake of argument, say it would be enough… we could SLOWLY crash it into Deimos to put it into a stable orbit. lol Perhaps we could crash something into it to slow it’s initial velocity around the sun and just push it into Mars orbit. Probably easier to do this than steal a moon from Jupiter. Good luck with that right?

  39. Snape says:

    A strange coincidence, but WUWT had a post just today on the topic of water vapor from irrigation:

    https://wattsupwiththat.com/2020/01/21/claim-agricultural-irrigation-helps-prevent-global-warming-in-the-tropics/

    • bdgwx says:

      This effect has been known for awhile. I’ve seen a few studies related to the effect in the corn belt of the United States as well.

  40. Perfecto says:

    The von Neumann quote is a gem. I bet his five parameters can be constant…

  41. Snape says:

    @bdgwx

    Agreed the local effects have been known, but I dont understand why Dans idea is not valid to some extent.

    Evaporation from the ocean is thought to enhance global warming. But based on the findings, if the ocean were to rise and cover part of California, the change would result in global cooling or neutral.

    As if the current 70% sea/land ratio is optimum for warming, but an increase to 71% would have no effect.

    • bdgwx says:

      I don’t think Dan’s argument is abjectly invalid. But it does depend on water vapor being a catalyzing agent for temperature change which is not supported by the evidence. Note that catalyzing a temperature change is different than amplifying one.

      Lets assume that WV can catalyze longterm temperature changes though. If you believe that this effect dominates warming trend then you are now left with even more questions. What happened to all of that energy that was trapped by CO2, CH4, CFCs, etc? Given the large reservoir of water and a billion years of opportunity why didn’t a runaway GHE start? And why has no one been able to demonstrate that this model can convincingly explain and predict reality any better than what we already have?

  42. Snape says:

    If the sea level was falling instead of rising, there would obviously be more dry land. Would this result in warming or cooling?

    Take it all the way to no ocean at all. Warmer or cooler?

  43. Gordon Robertson says:

    test

  44. Snape says:

    @bdwgx

    The study below, and several others, assert that increases in water vapor is a strong feedback to warming. We also know that earth was a humid hot house when oceans covered a much larger land area. Which makes the findings on irrigation somewhat contradictory. Just sayin.

    [If you were living on Earth 60 million years ago, it was a much hotter, wacky world, with no ice at the pole caps, and palm trees and crocodiles in whats now Wyoming, Koll says.]

    http://news.mit.edu/2018/how-earth-sheds-heat-space-092

    • Nate says:

      The hot houses were due to several things, but mainly large amounts of atm CO2 from high tectonic activity, like volcanoes.

      The position of the continent’s was important also.

    • bdgwx says:

      And that hothouse occurred with solar forcing of -1.2 W/m^2 relative today.

    • bdgwx says:

      Super interesting. If I’m interpreting this paper correctly what it is saying is that WV’s temperature feedback effect has a range of 230-300K. The strong feedback they are referring to is with the OLR. As Earth warms OLR increases and H2O provides a strong heat shed avenue that self limits its amplifying effect on the temperature. But this OLR feedback breaks down at around 300K at which point the WV temperature feedback becomes non-linear. At 340K the OLR feedback is turn off and the temperature feedback is no longer self limiting. A runaway GHE begins in earnest. The good news…it would require the Earth hitting 300K before the non-linearity phase begins.

  45. Gordon Robertson says:

    swannie…”I see that you are repeating your same claims to deny the Green House Effect, pointing to R.W. Woods simple experiment as proof that theres no atmospheric Green House Effect”.

    R. W .Wood did not claim there is no warming effect due to an atmosphere he simply explained it differently and better. Neither have I claimed there is no warming effect due to the atmosphere I just don’t think a trace gas making up 0.04% of the atmosphere can create that much warming. More like 0.04C, in line with its mass percent.

    If you are asking me to consider your experiments in the same class as experiments by Wood, don’t hold your breath.

    • E. Swanson says:

      Gordo, You have again displayed your lack of interest in science, giving no critique of my experiment or Dr. Roy’s experiment. All you offer is an empty comment: “I just dont think a trace gas making up 0.04% of the atmosphere can create that much warming”. That comment ignores decades of research and measurements which prove otherwise.

      Finally, you add a putdown of my efforts, again without any stated reason for doing so. Don’t worry, your opinion isn’t worth the electrons to display it on the screen, so I won’t “hold my breath”.

      • Gordon Robertson says:

        swannie…”…I just dont think a trace gas making up 0.04% of the atmosphere can create that much warming. That comment ignores decades of research and measurements which prove otherwise.

        Finally, you add a putdown of my efforts, again without any stated reason for doing so”.

        I have stated my reasons over and over. Your experiments are a blatant contradiction of the 2nd law of thermodynamics AND there is a good alternative explanation for your results. You are confusing an uncompensated heat transfer from cold to hot for the natural effect of heat dissipation. When heat is prevented from naturally dissipating, the temperature of a body will rise.

        To remind you, the words of Clausius when he described the 2nd law is that heat can NEVER be transferred BY ITS OWN MEANS from a colder body to a hotter body. He said nothing about that condition satisfying the dubious ‘net transfer of energy’, the pseudo-science used by alarmists to get around the 2nd law.

        Let me put it even better….you CANNOT transfer any form of energy from a lower potential energy level to a higher potential energy level BY ITS OWN MEANS. Water will not flow uphill BY ITS OWN MEANS and neither will a bolder at the base of a cliff rise up onto the cliff BY ITS OWN MEANS. Naturally, either a bolder at the top of a cliff, or water at the top of a waterfall, has a much higher potential energy than at the bottom, where the PE is zero.

        By the same token, heat can never, BY ITS OWN MEANS, be transferred from a lower potential energy level (ie. cooler) to a higher potential energy level (ie. hotter). Clausius proved it and no one has proved him wrong.

        With regard to an atmosphere with 0.04% CO2, NO ONE has ever proved that CO2 at that level can raise the temperature of air by 33C. It has never been proved by the scientific method, only by consensus related to unvalidated climate models.

        • Ball4 says:

          “With regard to an atmosphere with 0.04% CO2, NO ONE has ever proved that CO2 at that level can raise the temperature of air by 33C.”

          YOU are wrong Gordon, scientific method instrumentally observed Earth global 255K at TOA and 288K near surface which is a difference of 33C for Earth atmosphere with 0.04% CO2. It is your boulder method that is unscientific atm. prose.

          • Gordon Robertson says:

            ball4…”YOU are wrong Gordon, scientific method instrumentally observed Earth global 255K at TOA and 288K near surface which is a difference of 33C…”

            You don’t seem to understand what the 33C is about. It’s the difference between an Earth with and atmosphere, which is more a statistical guess than a measurement, and an Earth without an atmosphere, which is a total guess based on a badly applied Stefan-Boltzmann equation and a gross generalization of its application. Has nothing to do with TOA temperature versus temperature at surface.

            Besides, no warming in the atmosphere related to 0.04% CO2 has ever been measured or observed. It is sheer conjecture provided by modelers, the likes of Gavin Schmidt at GISS, who has claimed a warming effect from CO2 between 9C and 25C depending on the WV content.

            As John Christy of UAH has claimed, the atmosphere is far too complex for us to understand it well.

          • Ball4 says:

            The 33C difference has everything to do with instrumentally measured global TOA temperature versus air temperature near surface at the 95% significance level in real life. WITH the scientific method!

            Nobody knows the global median surface temperature of an Earth without an atmosphere at 95% significance level so no one can use the scientific method to justify 33C difference (or any other difference) for the no atm. scenario over today’s atm. constituents and pressure.

            Gordon just doesn’t know what Gordon is writing about. The warming in the atmosphere related to 0.04% CO2 has been measured so is observed; Gordon simply ignores and/or doesn’t understand the scientific method.

        • E. Swanson says:

          Gordo, Yes, you have repeatedly stated your incorrect understanding of the situation, failing to understand that the “MEANS” is the low entropy short wave energy from the Sun. The temperature at the surface is just the result of that sunlight passing thru the climate system and exiting to the 2.7 K sink of deep space. The atmosphere transfers energy from a lower entropy state to a higher one, as the system moves energy from the surface to deep space.

          Clausius was speaking about mechanical devices especially closed cycle devices, such as steam engines, which can not be run in reverse to produce heat from mechanical work without losses. Those losses must be replaced by input from an external energy source, such as the electricity required to run a heat pump. Otherwise, a heat engine could be devised to produce power which could then be used to run a heat pump that then provided the heat as into the heat engine, which would be perpetual motion, a violation of the 2nd Law.

          • Gordon Robertson says:

            swannie…”The atmosphere transfers energy from a lower entropy state to a higher one, as the system moves energy from the surface to deep space”.

            Talk about gish-gallop. Your understanding of entropy is as poor as your understanding of the 2nd law. Entropy was defined by Clausius as the sum of infinitesimal quantities of heat at a temperature T, at which the differential changes occur, and it has no application to the short wave EM from the Sun, or the long wave IR emitted by the Earth.

            Entropy applies ONLY to heat transfer. It’s not a statement of the condition of a system only to its transfer of heat. There is no such thing as a low/high entropy state unless you are comparing the entropy of a system that generates less heat to one that generates a higher amount of heat.

            You cannot apply entropy in the manner you suggest. The total entropy related to a system is given by S = integral dq/T where dq is the infinitesimal change and T the temperature at which the change takes place. If you draw the heat from a heat bath of constant T, then T can be pulled outside the integral sign and S = T.(integral dq). Therefore entropy is the total amount of heat transferred.

            The significance of entropy is its sign, which can only be positive, for an irreversible process. If the process is reversible, the entropy is always zero. Entropy is a mark of the direction of a process and with heat it signifies that in an irreversible process, the heat transfer is always from a hotter region to a colder region. Of course some transfers can be faster than others therefore the entropies would be measured based on the degree of their positive signs.

            Clausius intended entropy to be a mathematical statement of the 2nd law. It can never be negative, although some scientists state it as a negative due to the sign assigned to heat the direction of heat transfer. If it’s treated as a -ve sign then it can never be +ve.

            Your example is proof that heat transfer can only happen between a hotter body, like the Sun, to a cooler body like the Earth. The IR radiated from the Earth can only be effective if it contacts a mass cooler than the surface. IR from the surface will not warm a human body at a higher temperature.

            Anyone who has tried to survive in snow and ice environments at sub-zero temperatures can tell you that. The human body loses heat to such an environment, as predicted by the 2nd law. And no, it’s not about a net energy balance, the heat is transferred in one direction only.

            “Clausius was speaking about mechanical devices especially closed cycle devices, such as steam engines, which can not be run in reverse to produce heat from mechanical work without losses”.

            When Clausius stated the 2nd law, he did not confine his definition to any specific system. He simply said that “HEAT” can NEVER, by its own means, be transferred from a colder region to a hotter region.

            Since heat is the kinetic energy of atoms, the 2nd law suggests that the kinetic energy of atoms can only be transferred to atoms with a lower kinetic energy. It would make no sense if atoms with a certain kinetic energy could transfer that energy to atoms at a higher energy level.

            When heat is transferred via radiation, the same principle applies. Heat cannot be transferred through space directly with any degree of efficiency. That’s why air, with its atoms/molecules far apart wrt the size of an air molecule, is very poor at transferring heat. That’s true even with CO2 at 0.04%.

            Therefore, heat transfer by radiation depends on a conversion of heat to infrared at a higher temperature and the absorp-tion of that infrared by a cooler body. That process cannot be reversed for the same reason I just gave and for an earlier explanation based on potential energy difference.

            The principle of energy transfer between states of different potential/kinetic energy still applies. It makes no sense that radiation from a cooler body could raise the temperature of a hotter body. Such is the case when it is suggested the IR from cooler GHGs in the atmosphere can raise the surface temperature.

            Energy simply cannot be transferred, by its own means,from states of lower potential or kinetic energy to states of higher PE/KE.

          • Ball4 says:

            Gordon there is so much that is simply wrong in your discussion of ideal gas entropy and its changes (dS/dt = Q/T) that it would take me several hours to explain. And my efforts would do NO good for you. Except make ME feel better.

            Suffice it to say consult a good beginning thermo. text book on the adiabatic free expansion of an isolated ideal gas – you know like the atm. where the proper integrating of dS/dt = Q/T would give delta S=0 which is clearly wrong.

            Underlying the correct use of of that eqn. for delta S = 0 is the working rate be -p*dV/dt whereas in an adiabatic free expansion W = 0 (which is what is meant by “free” expansion along the lapse rate). That ought to trigger your interest to dig deeper but I doubt it will have any effect on you at all. You will continue your incorrect epistles on Clausius’ term: entropy. These should be simply ignored except to point out they are wrong & consult a text. The correct ideal gas delta S formula (of the universe) is much more complicated in an adiabatic free ideal atm. gas expansion such as along the atm. dry lapse rate.

          • E. Swanson says:

            Gordo, You are repeating your usual bad physics again.

            You are ignoring the fact that thermal IR EM emissions of GHG’s occur at discrete wavelengths, with side bands around that wavelength widening due to pressure. Those wavelengths are not temperature dependent, as they are properties of the specific molecular species. The effects of temperature are seen in the spectrum intensity, usually presented as different Planck black body emission curves on graphs of GHG emission or absor_pton intensity vs wavelength.

            Those emitted photons can then be absorbed by other molecules of the same species, whether the aggregate temperature is higher or lower than that of the source. The individual absorbing molecules only respond to the photon wavelength, not the source temperature. And, within a layer of the atmosphere, the photons are emitted in all directions, with the intensity of photons leaving the layer being roughly equal in upward and downward direction. Those downward emissions are the “back radiation” which adds energy to the lower layers. These processes do not violate the 2nd Law, since the net transfer is energy flowing thru many such layers of atmosphere to deep space.

          • bobdroege says:

            I’ll take a crack at this with a proof by contradiction.

            “Since heat is the kinetic energy of atoms, the 2nd law suggests that the kinetic energy of atoms can only be transferred to atoms with a lower kinetic energy. It would make no sense if atoms with a certain kinetic energy could transfer that energy to atoms at a higher energy level.”

            What is observed in a sample of matter is that there is a distribution of speeds and therefore of energies in a sample of gas.

            If collisions between atoms or molecules could only transfer energy from the faster atoms or molecules that have higher kinetic energy to ones with slower with lower kinetic energy, then after a period of time, all molecules or atoms would have the same kinetic energy energy or speed.

            This is not what is observed therefore collisions can transfer energy from the slower to the faster.

    • Dr Roys Emergency Moderation Team says:

      E. Swanson, Ball4, bobdroege, please stop trolling.

  46. CO2isLife says:

    How does CO2 and LWIR between 13 and 18 micron warm the deep oceans? It doesn’t. Fewer clouds and more blue light reaching the oceans does.

  47. CO2isLife says:

    How does the marginal increase in CO2 and LWIR between 13 and 18 micron warm cause a dogleg in the chart starting in 1985? It can’t. That is evidence of fewer clouds and more blue light reaching the oceans.

  48. CO2isLife says:

    No one that understands the quantum physics of the CO2 molecule and LWIR between 13 and 18 micron can seriously attribute the warming oceans to CO2. The fact that climate “experts” are attributing the ocean warming to CO2 proves they don’t even understand the basics. CO2 shows a logarithmic decay, there is no way is would ever cause a dogleg or upward acceleration in temperatures.

    • Nate says:

      No Co2.

      We and others have debunked this claim several times for you already.

      You mustve forgotten. Go back and look.

  49. PhilJ says:

    gallopingcamel,

    “Happer is trying to figure out why the IPCCs model dont work. If you dont like Happers explanation, do you have a better explanation for why the models fail?”

    Yes. Because they are based on a fundamentally flawed assuption.

    Just as Copernicus’ model failed despite tweaking with ‘epicycles’, because it was based on the fundamemtal flaw of a circular orbit;
    So ‘ghe’ models fail despite constant tweaking, because they are based on the fundamental flaw that planets have been heated to their current state by the sun, rather than having cooled to their current state despite constant solar input…

    • Nate says:

      “planets have been heated to their current state by the sun, rather than having cooled to their current state despite constant solar input”

      There should be a TV show with all you guys:

      “Climate deniers say the darndest things”

        • Svante says:

          Interesting, 30% weaker Sun and more clouds meant Venus would have been cooler than Earth is today.

          • PhilJ says:

            Are you kidding? The idea that water ever flowed on the surface of Venus is as idiotic as the idea that the Earth is flat.

            Venus’ atmosphere never cooled enough for rain to reach the surface and cool its crust, thus its crust remained thin and outgassing and cooling of the interior has been far more rapid than Earth.

          • Svante says:

            Yeah, “Due to its high albedo the planet [Venus] absorbs only 157 +/- 6 W/m^2 on average, less than that deposited on Earth (~240 W/m^2), despite the fact that Venus is 30% closer to the Sun.”
            https://tinyurl.com/yxybp73u

            So Venus should be colder than Earth if it didn’t have a stronger green house effect.

          • PhilJ says:

            Svante,

            “So Venus should be colder than Earth if it didn’t have a stronger green house effect.”

            hahaha… you realize Venus’ albedo is because there was never rain falling on the surface scrubbing sulpher out of the sky of course… all that heat ‘trappped’ in the bulk of the atmosphere is geothermal…

            rather all that incoming solar energy has been cooking off Venus’ water. There is very little left… I expect the rest of the atmosphere will blow off quite rapidly once there is no h20 left to induce a magnetosphere…

          • Gordon Robertson says:

            svante…”So Venus should be colder than Earth if it didnt have a stronger green house effect”.

            The surface temperature of Venus was measured by probes on a space vehicle to be 450C. Based on that, astronomer, Andrew Ingersoll claimed that it would be a contravention of the 2nd law to claim that degree of surface heating could come from a GHE.

            https://agupubs.onlinelibrary.wiley.com/doi/abs/10.1029/JA085iA13p08219?deniedAccessCustomisedMessage=&userIsAuthenticated=false

            “Pioneer Venus observations of temperatures and radiative fluxes are examined in an attempt to understand the thermal balance of the lower atmosphere. If all observations are correct and the probe sites are typical of the planet, the second law of thermodynamics requires that the bulk of the lower atmosphere heating must come from a source other than direct sunlight or a thermally driven atmospheric circulation. Neither the so‐called greenhouse models nor the mechanical heating models are consistent with this interpretation of the observations. One possible interpretation is that two out of the three probe sites are atypical of the planet. Additional lower atmosphere heat sources provide another possible interpretation. These include a planetary heat flux that is 250 times the earth’s…”

          • Ball4 says:

            Gordon that 1980 paper suffered from the as yet unknown error mechanisms in the 3 small probes. Try catching up on your reading, those errors caused the probe data to be inconsistent with actual Venus atm. opacity. For example, gas flow through the window retainers was found in the lab. Find more recent papers that obtain Venus atm. opacity correctly and support the sparse surface thermometer readings due Venus atm. grey absorber total pressure at the surface.

          • Svante says:

            And the GHE works fine on geothermal energy too.
            All you need is a space interface that is colder than the surface.

    • bdgwx says:

      If the context is planetary evolution timescales then understand that solar luminosity increases by 1% every 125 million years.

    • Dr Roys Emergency Moderation Team says:

      Svante, Ball4, bdgwx, please stop trolling.

  50. Eben says:

    CO2 is a thermal conductor not an insulator ,
    The only planet that can be warmed up by CO2 is The Bizarro World.

    • Norman says:

      Eben

      Please study some actual science. You are getting garbage from bad blogs. CO2 would not be a thermal conductor at all. It is a good insulator for conductive energy flows.

      https://www.engineeringtoolbox.com/thermal-conductivity-d_429.html

      Maybe look at this list for thermal conductivity. Look at the thermal conductivity of Carbon Dioxide. It is 0.0146 less than asbestos.

      Why are the skeptics that choose to post seem to be so totally ignorant of science and yet so incredibly arrogant? So far the only skeptics I see with any actual science knowledge is gallopingcamel and Dan Pangburn (maybe a few others but it is quite rare to find one). He at least knows some science. The vast majority of skeptics seem to be quite illiterate of science and have gotten all their phony ideas from blogs.

      Good skeptics at least do some work and learn the topic they are skeptical about, they don’t make stupid statements about things they know nothing about.

      • Svante says:

        Norman says:

        So far the only skeptics I see with any actual science knowledge is gallopingcamel and Dan Pangburn (maybe a few others but it is quite rare to find one).

        Kristian has an interesting science based argument, true skeptics like barry had to argue measurement uncertainties.

    • Bindidon says:

      Eben

      “CO2 is a thermal conductor not an insulator…”

      Even when provocating you behave dumb. Is ‘Eben’ another nickname for ‘Robertson’ ?

  51. Eben says:

    And those images of black holes and gravitational lensing , all made on Photoshop
    The supposed boson discovery – no detector ever detected or observed anything looking like a boson – totally made up.
    the gravitational waves – after running for years detecting nothing – pulled out of thin air just when the funding was about to run out.
    In the future this time will be known as epoch of fake science

    https://youtu.be/Nrq64GZjEh8

    • Nate says:

      Ok, now we know where Eben stands. Against science.

    • Norman says:

      Eben

      I have to agree with Nate. The video you posted is very stupid in all ways. They take a few clips and add some words and some gullible people go “Oh my a HOAX!” Hope you posted that junk as a joke to show how easy some people can be fooled to believe anything.

      You want to see actual footage of space station material it is available on youtube to watch.

      Here is one.
      https://www.youtube.com/watch?v=lMtXfwk7PXg

      • Eben says:

        The video is just a silly parody , it has nothing to do with what I write down in words , you are just too dum to see it

      • Eben says:

        One think you can be sure of any time when encountering warming propagators , they have absolutely no sense of humor

    • Bindidon says:

      Eben

      Wow! Is that good!

      I would add that
      – Einstein’s relativity theory is pure nonsense;
      – the speed of light isn’t the highest possible;
      – time dilation is a hoax.

      Great.

      I personally believe that Earth is flat, that the Universe turns around it, and that it was created 8000 years ago.

      • Gordon Robertson says:

        binnie…”I would add that
        Einsteins relativity theory is pure nonsense;
        the speed of light isnt the highest possible;
        time dilation is a hoax”.

        Good to see you are still misquoting and misunderstanding.

        I never said Einstein’s theory of relativity is pure nonsense I have claimed that inferences based on the theory are nonsense, like time dilation. Far more qualified people than me have claimed the theory itself is not even a theory. Louis Essen, an expert on time who invented the atomic clock claimed that. He based his POV on the fact the GRT is full of suppositions and inferences from thought experiments.

        Einstein admitted the mathematical portion of his GRT can be worked out with Newtonian physics. In fact, we did some of that in our engineering physics classes. It has only been recently that GRT has been taught in physics classes.

        There is no way to establish that nothing can exceed the speed of light. Dayton Miller claimed that light requires a medium to move through (an aether). No one has found that aether to date but Einstein admitted that if Miller is right his GRT is wrong.

        Very recently, it has been discovered that so-called empty space is teeming with sub-atomic particles. If that’s the aether to which Miller referred, then the speed of light may be limited by it.

        Time dilation is a hoax for the simple reason that time is a human invention. Human’s defined time as a constant therefore it cannot dilate. Otherwise the angular velocity of the Earth, upon which time is defined, must change.

        • gallopingcamel says:

          @Gordon,
          Time dilation may seem weird but if the velocity of light is immutable then mass and time are variables.

          I spent 12 years manipulating relativistic electrons for fun and profit. After a while you get used to the weirdness. Let’s see how this plays out in a real laboratory.

          Our electrons circulate in an evacuated tube that has a circumference of 129 meters. They travel in bunches so it is a simple matter to detect them each time they complete a circuit so as to calculate their velocity.

          On each circuit the electrons get “kicked” by an electric field. Our driver circuitry has enough power to accelerate the electrons to many times the speed of light in a Newtonian universe.

          The best we achieved was electrons with a “Beta” of 0.99999988273. Beta is like a “Mach number”……it is used to measure velocity compared to lightspeed.

          This is strong support for the idea that we live in an Einsteinian universe so what else does that imply? Another factor is “Gamma” which is the square root of one divided by (one minus Beta squared).

          Gamma is the Lorenz factor that relates to time and mass. According to the theory of Relativity our electrons should have a “Gamma” = 2,000 meaning that time is running 2,000 times slower in their time frame. So how do you measure that?

          Contrary to most people’s expectations it turns out to be absurdly easy to measure “Gamma”. We use 40 bending magnets each designed to deflect the electrons by 9 degrees. Forty times 9 is 360 so our electrons remain in a closed loop. The magnet field would be 0.0006 Tesla in a Newtonian universe but our machine refuses to work until the magnets are set at 1.2 Tesla.

          Thus we know that our electrons have 2,000 times more mass than their rest mass.

          Apologies to our esteemed leader for going so far “OT”.

      • Gordon Robertson says:

        binnie…”I personally believe that Earth is flat, that the Universe turns around it, and that it was created 8000 years ago”.

        If you have ever travelled through the Canadian prairies you might be inclined to believe the Earth is flat. Most people, included astronomers, regard the Earth as the centre of the universe with the Universe moving around it. Most people speak of the Sun as if it orbits the Earth.

        In fact, when time was originally defined, based on one rotation of the Earth, they forgot to take into account that the Earth was in motion around the Sun. Scientists had to invent a newer form of time based on the so-called fixed stars in the universe.

      • Bindidon says:

        Oh Noes… the dumbest commenter this blog ever experienced really seems to be back.

        And he repeats the same nonsense again, ad nauseam.

        Jesus.

    • bobdroege says:

      A simple Geiger counter can detect bosons, fermions as well, but you have to know to tell the difference.

      Crystals are more specific to bosons, they can even tell you what color.

  52. Scott R says:

    Someone please explain how the bar connecting the sun to the center of the milky way is possible, yet on the smaller scale of the solar system, this force can be ignored and planets just follow their normal, predicted orbits based on gravity alone? Could this also be related to why the galaxy doesn’t fly apart to begin with?

    https://phys.org/news/2011-12-insight-bar-center-milky.html

    • Gordon Robertson says:

      scott r…”Someone please explain how the bar connecting the sun to the center of the milky way is possible”

      The only honest answer is that no one knows. Unfortunately, astronomers are not paid to claim they don’t know, so they are inclined to issue a lot of bs. That would not be so bad if the bs was claimed as a theory but astronomers like Carl Sagan made money on TV asserting the bs as fact.

      These days, it is alarmist climate scientists asserting the bs.

      • Scott R says:

        Gordon Robertson,

        In addition to being a climate change realist lets say, I have some doubts to the story we have been told as far as dark matter and dark energy. It just doesn’t make sense that dark matter is supposedly everywhere, yet within the solar system it does nothing. Outside of the solar system it dominates over gravity. What gives? Folks arguing for the electric universe model might be on the right track as far as extra solar forcing. Anyways, I have an open mind to it. But why don’t we see this forcer on earth and within the solar system? Nothing makes sense to me honestly.

  53. Snape says:

    A few years ago I argued here that the amount of energy a given area accumulates, (in the LT for example) is a function of velocity. V = distance/time

    So if the top of the LT is at an altitude of 10 miles, and if on average it takes a joule leaving Earths surface an hour to get there, the velocity I am talking about is 10 miles/hour.

    Faster means less energy will accumulate. Slower, more will accumulate. This is because for every moment a joule remains in the troposphere, that many more joules will have entered the troposphere to join it.

    GHGs act to slow the velocity (defined above) of energy moving from surface to space. If an atmosphere with no GHGs, convection slows the velocity that energy moves from surface to space.

    Here, a slower velocity equals longer RESIDENCE TIME. Residence time being the more familiar way of expressing the same idea.

    • Gordon Robertson says:

      snape…”So if the top of the LT is at an altitude of 10 miles, and if on average it takes a joule leaving Earths surface an hour to get there, the velocity I am talking about is 10 miles/hour”.

      The energy, called electromagnetic energy, travels at the speed of light. It’s also transmitted like a field with a path.et.ically few CO2 and WV molecules in its way. It’s mass is non-existent therefore its velocity is meaningless as a force.

      However, EM dissipates it’s intensity with the square of the distance it travels so by the time it reaches the LT, it would be pat.he.ti.cal.ly weak.

      R.W. Wood claimed it would lose most of its effectiveness a few feet above the surface. That applies to CO2 and WV back-radiation EM as well. By the time it reached the surface it would be effectively non-existent.

      Try it with a 1500 watt ring on an electric stove. Turn it on till it’s red and hold your hand near it. You’ll feel a combination of super-heated air molecules and radiation. Move your hand a few feet above the ring and you’ll feel virtually nothing.

      You cannot roast marshmallows a few feet from a campfire.

      If you’re talking about the velocity of a mass of air molecules, it’s not the velocity of the mass that determines heat energy, it’s the spacing between molecules internally and the velocity of each molecule within the mass.

  54. Snape says:

    How can a bigger, hotter pile of energy in the LT radiate to space at the same rate as a smaller, colder pile? Answer: the bigger pile is moving upward more slowly.

    To see this, picture a bulldozer pushing a small pile of dirt over a cliff, and another dozer pushing a bigger pile of dirt over a cliff. The latter dozer can travel at a slower speed, moving the same volume of dirt as the former.

    • Gordon Robertson says:

      snape…”How can a bigger, hotter pile of energy in the LT radiate to space at the same rate as a smaller, colder pile?”

      Why are you talking about pile.s of energy? Energy has no mass while a pile of anything has mass. Furthermore, you need to specify the energy in question and how it gets to TOA. Heat cannot reach the TOA because it requires mass to transfer heat. Only EM can reach the TOA and it’s not k.o.s.her to compare piles of EM.

      • Gordon Robertson says:

        part 2…

        Lindzen claims energy (presumably heat energy) reaches near to the TOA via convection, by way of thunderclouds, etc. He is not clear on how that energy is transferred to space.

        Since heat is the kinetic energy of atoms, as the air parcels rise in altitude, they thin out (lose pressure) and the heat is dissipated naturally. The notion that heat can escape the Earth’s atmosphere only by radiation is dubious. If you shoot a parcel of air into a large vacuum like space, the parcel will dissipate into nothingness and the temperature will drop to 0K.

        That obviously does not happen since gravity binds most of our atmosphere. However, an air parcels of high density reaching higher altitudes will dissipate heat naturally as the pressure decreases.

        Energy is clearly not well understood. We have no idea what it is, only how it acts, and the properties of various kinds of energy.

        • Gordon Robertson says:

          snape…think of this problem in reverse. You have the vastness of space adjacent to the Earth at nearly 0K. Consider any molecules of air adjacent to that space but still under the influence of Earth’s gravity so they cannot escape. The temperature of those molecules have to be close to 0C. That’s not due to the nearness of space, it’s due to the thinness of the air, which translates to less molecules to create heat.

          As you move into the atmosphere, as the air density increases, things should get warmer. We know the stratosphere is heated somewhat by UV radiation absorbed by O2 molecules. When we reach the upper troposphere, the temperature rises linearly as does the pressure.

          Why can’t we reverse that temperature gradient between Earth and space to explain heat dissipation without radiation? Unfortunately, climate science has obscured that process by explaining it as a lapse rate related to heat rising. I think that is wrong, I think gravity creates the gradient alone and rising heat is a mere anomaly imposed on that steady state.

  55. Snape says:

    Even better, imagine a 40 meter section of conveyor belt, moving south to north. One apple per second is place on the south end. How many apples will be on the conveyor belt at steady state?

    It depends on the velocity of the conveyor. The slower, the more apples.

  56. Snape says:

    @Ball4

    Yes, radiation travels at the speed of light, but from surface to space it does not travel in a straight line. The path is torturous, and a longer path takes longer.

    • Ball4 says:

      All at the same speed. Your conveyors and bulldozers need to do so as well.

    • Norman says:

      Snape

      YOU: “The path is torturous, and a longer path takes longer.”

      I don’t think this is correct. This would only be the case if you had some type of perfect mirror set up and the radiation would make many jumps around before finding a spot to leave the mirrored system.

      The radiation travels a short distance and is destroyed, converted into vibrational energy of molecules in the atmosphere. The process is not one that takes a long time.

      There is really no energy build up as you suggest. What takes place is a atmosphere with temperature and emitting gases emits some energy back to the surface. The surface absorbs this energy and with a constant input from solar, will reach a higher temperture because of this DWIR.

  57. Snape says:

    *Garden hose example

    A)
    – Lay a garden hose in a straight line through an ice or snow covered section of your driveway.
    – Turn on the faucet.
    – If the water is warm enough, the snow or ice in contact with the hose will melt.

    B)
    – Now, instead of in a straight line, lay the hose in a coiled or twisted shape, so that the water in the hose is taking a tortuous path through the given area.
    – The result brings more heat and melting to the cold surface.

    *******

    This is true even though the velocity of water through the hose itself has not changed. And notice the rate of thermal input/output to the area is exactly the same in either case – straight or twisted.

    • Ball4 says:

      A) atm. UWIR that goes straight through has no warming realized
      B) atm. DWIR source flow through is cooler than the surface

      Snape, my point is better to explain the real process; you are pushing analogy too far.

  58. Snape says:

    @Norman

    Norman: [The radiation travels a short distance and is destroyed, converted into vibrational energy of molecules in the atmosphere. The process is not one that takes a long time.]

    Me: There are continuous flows of energy entering the lower troposphere from the surface, moving upwards and eventually exiting into the stratosphere. It takes time to get from a to b.

    In the atmospheric window, energy travels in a straight line and at the speed of light. A to be b is very fast. What you have described is much slower. Energy is absorbed by molecules, and these molecules do not travel upwards at anywhere near the speed of light.
    A slower conveyor belt.

    Norman: [There is really no energy build up as you suggest]

    Me: Of course there is. Atmospheric mass is fairly constant. If at a higher temperature then this mass has more energy. Think OHC, which is measured in joules, but for the LT instead.

    Norman: [What takes place is a atmosphere with temperature and emitting gases emits some energy back to the surface. The surface absorbs this energy and with a constant input from solar, will reach a higher temperture because of this DWIR]

    Me: Yes, of course, and I am not trying to challenge the well established science. Just looking at it in a different way.

  59. Snape says:

    If you placed one apple per second on a conveyor belt that was moving at the speed of light, then 99.9% of the time there would be no apples on the conveyor belt.

    For heat flow, substitute joules for apples.

    • Ball4 says:

      Your apples are also a continuous wave so the conveyor belt is 100% full of wave apples & individual apples at the same time as the surface is not blinking UWIR radiation. Your analogy breaks down quickly.

  60. Snape says:

    @Ball4

    The analogy breaks down if you use a continuous wave of light, like from a light bulb. Works if you use the equivalent power but in discrete pulses:

    [A typical commercial strobe light has a flash energy in the region of 10 to 150 joules, and discharge times as short as a few milliseconds…..]

    https://en.wikipedia.org/wiki/Strobe_light

    ******

    So each second, a 10 joule pulse of light that lasts only a few milliseconds? You would be in the dark for most of the time (although your eyes might not think so).

  61. Snape says:

    @Gordon

    [Why cant we reverse that temperature gradient between Earth and space to explain heat dissipation without radiation? Unfortunately, climate science has obscured that process by explaining it as a lapse rate related to heat rising. I think that is wrong,]

    Heat dissipation to space without radiation??
    Space is a vacuum, Gordon. Read about the problem with your idea here:

    http://www.qrg.northwestern.edu/projects/vss/docs/thermal/2-does-heat-move-differently-in-space.html

    • Gordon Robertson says:

      snape…”Heat dissipation to space without radiation??”

      I was not talking about dissipation to space, I was talking about the natural dissipation within a gas as it’d pressure decreases. The pressure of the gas near TOA is extremely low, therefore the temperature (average kinetic energy) of those molecules should be very low. As you move toward the surface, the pressure will increase and so will the temperature.

      In the stratosphere, there is additional heating from solar UV that skews the temperature gradient. Temperature is pretty linear with temperature till the stratosphere.

      See my post below.

      • Gordon Robertson says:

        Ignore my post, I need to think it out more.

        • E. Swanson says:

          Gordo, Could you have possibly been wrong all this time?

          HERE’s Something for you to think about. That post is the introduction to several others which provide considerably more details.

          I suggest that you must somehow show that these posts are incorrect if you are to ever to have anything meaningful to say about AGW.

          • gallopingcamel says:

            I used to like Science of Doom even after they banned me.

            What a pity that the site does not show much action any more. All the more reason to appreciate this site.

  62. Snape says:

    @Svante, Norman, Ball4

    Upthread I wrote,
    [a slower velocity equals longer RESIDENCE TIME. Residence time being the more familiar way of expressing the same idea.]

    You might think it is nutty or inappropriate to try and apply the concept of residence time to energy, but I am not totally alone. This is from a recent paper:

    [We are refering to a measurable and conserved substance. A good example of this type is the parameter defined in atmospheric chemistry as the average residence time of each individual gas, defined as (1). M is the total average mass of a gas in the atmosphere and F the total average influx or outflux. In time the averages for the whole atmosphere Fi and Fo are equal. Another example used in climate studies is the amount of water in a reservoir[1]. In this case, M is the amount of water stored in the reservoir and F is the amount of water that goes in and out of the reservoir.
    In this paper we want to extend the substance that flows from matter to energy, and estimate the average residence time of energy in Earths atmosphere and in the Sun. Obviously, in equation (1) M and F will now represent the total amount of energy in the system and the energy flux -in or out- respectively.]

    https://arxiv.org/pdf/1906.01932.pdf

  63. PhilJ says:

    E. Swanson,
    Regarding your link above..

    “If you do the maths (see the end of the post), you find that the equations say that the earth should be about -18C (255K) when in fact it is an average +15C across the globe. Whats going on?

    As usual the whole thing rests on the fundamental flaw that the Earth has been warmed up to its current temp by the Sun.

    In fact the Earth has cooled to its current temp despite solar input and will continue to cool until its interior is solid rock, it no longer generates a magnetic field and has lost all its atmosphere.

    No mythical ghe is required to explain this temp. Just chemistry and physics, as a hot ball of molten metals and gases cools to space…

    • bdgwx says:

      Geothermal energy is about 0.1 W/m^2 right now with roughly half being radiogenic and half being primordial. I don’t think losing 0.1 W/m^2 is going to make a huge difference. Keep in mind that solar forcing increases by about 0.1 W/m^2 every 10 million years or so anyway. Losing the atmosphere certainly make a big difference. But no atmosphere means no GHE either. And yes the GHE is required to explain the temperature of the Earth both past and present.

      • PhilJ says:

        bdgwx,

        “And yes the GHE is required to explain the temperature of the Earth both past and present.”

        no it is not. The GHE was an idea invented to explain the temp being 33 K above the computed 255K..

        the much easier (and non imaginary) explanation, is that the calculated 255K is the temp that the Earth is cooling towards.. not something that the Earth has been warmed up from…

        It is the difference between 2 pots of water placed on a burner with the same input.. one never boils and the other boils happily away until all the water is gone…

        The difference? One was a pot of cold water placed on the burner, the other was already boiling.. 😉

        • Dan Pangburn says:

          Phil,
          You are displaying you lack of engineering/science skill.

          • PhilJ says:

            haha really? How so? would you prefer I put a pulsating heat lamp above the pots? lol

          • bdgwx says:

            PhilJ, if you replaced the burners below with cycling heat lamps above and kept everything equal except for the initial temperature of the two pots then both pots would achieve the same equilibrium temperature. The initial temperature of the pots as no material effect on the eventual outcome of the experiment.

        • bdgwx says:

          Assuming the only difference is initial temperature then both pots will eventually boil away. Or if the input was lowered such that a boil cannot be maintained then both pots will achieve the same equilibrium temperature. Now add a thermal barrier to the pot that had the lower initial temperature. You will observe that the pot that started out colder will have the higher equilibrium temperature.

    • Dr Roys Emergency Moderation Team says:

      bdgwx, please stop trolling.

  64. Gordon Robertson says:

    snape…this did not post then I lost my place.

    part 1….

    snape…”In this paper we want to extend the substance that flows from matter to energy, and estimate the average residence time of energy in Earths atmosphere and in the Sun”.

    Sounds like more modelling pseudo-science. The energy in question is heat, after all, we are discussion global warming. Call the energy by it’s name, it’s heat.

    Heat does not flow through the atmosphere to a significant degree because the molecule are spaced too far apart to conduct it significantly. So, you are talking about electromagnetic energy which is converted from heat at the surface. EM is flowing, not heat.

    EM is a different form of energy altogether and it does not obey the same rules as thermal energy. Heat is the kinetic energy associated with atomic motion while EM is a product of a change in energy level of an electron in an atom. EM is composed of an electric field perpendicular to a magnetic field and the entire field has a frequency as it is propagated from the atom.

    • Gordon Robertson says:

      part 2….

      There is no ‘substance’ flowing from matter to energy, the matter produces the energy that flows. There is no way to calculate the average residence time of EM because no one knows what it is or where EM goes when it is propagated.

      Feynman produced diagrams in an attempt to track EM and unless you understand physics at that level, you are fooling yourself. The motion of EM in the atmosphere is a highly complex motion, so complex that the biggest computers could not track it. The irony is, due to their bloated egos, modellers think they can track EM while incorrectly calling it heat.

      Besides, every atom in every molecule making up the Earth’s surface is emitting EM. Those atoms outnumber the atoms in molecules of the atmosphere by a large number and only 0.31% of the tro.p.os.phere is able to capture EM. Since the amount of EM produced by the surface swamps the number of atoms in molecules able to absorb it, there is no hope that GHGs in the atmosphere could absorb enough EM to create the fict.i.t.i.ous heat trapping blanket created by climate alarmists. GHGs would represent a few threads in a blanket.

      Is it not time you gave up trying to prove the un.pro.va.ble and come over to the skeptic side?

  65. Gordon Robertson says:

    part1…

    swannie…”HEREs Something for you to think about.”

    I have read that pseudo-science before from s-o-d who spec.ia.li.ze in such general.iz.ed sci-fi. I read one of their articles about the 2nd law, and all they managed to prove was their i.g.no.ra.nce of the 2nd law.

    In the article at the link you provided, they talk a lot of math.e.ma.ti.cal jargon without proving how much EM is absorbed by CO2 compared to how much EM is emitted by the surface. They present the tired old graphs that shows a suspect sp.e.ct.r.um in which IR appears to be absorbed by CO2, albeit in milliwatts.

    • Gordon Robertson says:

      part2…

      I repeat…in milliwatts. Even if the mw are integrated over a range of frequencies it amounts to about 28 watts, which is about 5% of the power emitted by the surface. That, of course, is true if the graphic is correct.

      I’m sorry, but the CO2 absorp-tion spectrum is swapped by the WV spectrum and there is no way to separate the two. That graphics did not come from measurement it came from a model from someone’s mind.

      So, how much EM does CO2 absorb and what effect does it have on temperature. It’s a total theory that absorp-tion of EM by GHGs is responsible for a 33C warming from the temperature of a planet without an atmosphere and oceans.

      The 33C warming, if it is that much, has another explanation that awaits discovery. There is no way that CO2 at 0.04% could have done that and S.O.D did not even address that problem. S.O.D specializes in propaganda backed by mystery math.

      • Gordon Robertson says:

        I might dd that there is no correlation between how much EM GHGs absorb and the heating effect they produce. The heating is presumed and agreed to by consensus.

      • Gordon Robertson says:

        typo…”but the CO2 absorp-tion spectrum is swapped by the WV spectrum”

        should be “but the CO2 absorp-tion spectrum is swamped by the WV spectrum”

      • E. Swanson says:

        Gordo continues to present his delusional physics again, writing:

        I’m sorry, but the CO2 absorp-tion spectrum is swapped by the WV spectrum and there is no way to separate the two. That graphics did not come from measurement it came from a model from someone’s mind.

        It’s well known that the water vapor effects dominate below the tropopause, which separates the region of strong vertical convection from the stratosphere above. There’s a natural separation of the two GHG’s in the fact that there’s little water vapor above the tropopause. Above that level, the thermal IR EM energy exiting the Earth must occur via the other Green House gases, primarily CO2.

        In the troposphere, vertical convection dominates, but the pressure height of the tropopause is directly influenced by the processes above. If the lapse rate in the troposphere is (nearly) constant, raising the troposphere height will result in a warming of the surface, other things being equal. Theoretical calculations show this and data from balloons in the tropics have been analyzed which indicate that the pressure height of the tropopause has increased, which is consistent with AGW.

        All your comments ignore the upper atmosphere and the energy flow when you assert that GHG’s aren’t the cause of the Earth’s surface temperature, calculated as 33 k above that of an airless planet. You do not offer an alternative explanation, so the work of many scientists over more than 100 years must be taken as the logical conclusion.

        • Ball4 says:

          E. Swanson, Gordon demonstrates he is indeed not accomplished in atm. physics. We should take his 7:19am advice for granted: “Ignore my (Gordon’s) post, I need to think it out more.”

          Here are 2 minor points for you, maybe just your imprecise language:

          1) Above (the tropopause), the thermal IR EM energy exiting the Earth & atm. system mainly occurs via the other IR active gases, primarily CO2 while non-IR active O2, N2, Ar also radiate away minor amounts of system thermal energy to deep space.

          2) …calculated and measured as ~33K above that of Earth with surface 1bar O2,N2 atm. as opposed to “airless” which no one has measured or meaningfully calculated.

    • Dr Roys Emergency Moderation Team says:

      E. Swanson, Ball4, please stop trolling.

  66. Snape says:

    Gordon

    You have a knack for saying things that are utterly ridiculous. It can be overwhelming when they come by the dozen.

    Please, one at time!

    • Gordon Robertson says:

      snape…”You have a knack for saying things that are utterly ridiculous. It can be overwhelming when they come by the dozen”.

      Nothing personal, but ridiculous is in the eye of the beholder. My physics is sound, and if it’s off, it’s not by far. You simply cannot do what you are trying to do re tracking energy through the atmosphere.

      BTW…I am never attacking you, as I said, there is nothing personal. That goes for everyone posting here, I don’t hate anyone.

      • Ball4 says:

        “My physics is sound..”

        No, Gordon’s physics is mostly imaginary. But Gordon gets at least one physical thing correct shouting “EMR IS NOT HEAT.” Gordon needs now to work to learn physical thing two correctly and so forth.

      • Dr Roys Emergency Moderation Team says:

        Ball4, please stop trolling.

  67. Snape says:

    [Near the equator, large-scale convection causes air to rise. On reaching the upper troposphere, this air flows poleward. Beneath the diverging air, surface pressure drops and an equatorial trough develops. Over the maritime tropics, tall convective clouds form in the vicinity of the equatorial trough, where the sea surface temperature is quite high. This deep convection, the most conspicuous feature of the tropical circulation, in the company of precipitation transports latent heat from the earth’s surface to the upper atmosphere.]

    https://www.scientificamerican.com/article/why-do-we-have-a-hurrican/

    ********

    [Heat does not flow through the atmosphere to a significant degree because the molecules are spaced too far apart…..]
    – Gordon Robertson

    • Gordon Robertson says:

      snape…”Near the equator, large-scale convection causes air to rise. On reaching the upper troposphere, this air flows poleward”.

      Yes…molecules of air are rising and molecules of air are involved in a large-scale convection. However, heat cannot flow through air in any significant way. The heat is being moved because the molecules are moving.

      The conductivity of heat through air is very low. Not worth mentioning. Air is essentially an insulator.

      • Gordon Robertson says:

        BTW…that sounds like Lindzen’s theory. I have no objection to it, in fact I like most of it. He just fails to explain how the heat gets dissipated at higher altitudes. Since 99% of that air is nitrogen and oxygen, the heat obviously cannot be radiated away by either. At high altitude, there won’t be much in the way of WV, and CO2 at 0.04% won’t get it done.

        Personally, I think the reduction in pressure of the air with increasing altitude will dissipate heat quite naturally.

        • Entropic man says:

          I think not.

          Convection is adiabatic. As gas volume increases with altitude the heat content per unit volume decreases with altitude, but the heat content per unit mass remains constant.No heat dissipation due to convection.

          To explain heat dissipation you need another mechanism.

          • Gordon Robertson says:

            snape…”Convection is adiabatic. As gas volume increases with altitude the heat content per unit volume decreases with altitude, but the heat content per unit mass remains constant.No heat dissipation due to convection”.

            An adiabatic process is one that does not exchange heat with its surroundings. How can a parcel of air rise via convection and not exchange heat with its surroundings?

            An example often offered as an adiabatic process is the compression of air by a bicycle pump. As the air is compressed, it warms and that heat is not supposed to escape the system, but it does. You can feel it if you touch the hose where it connects to the pump. In fact, it gets quite warm.

            With a pump. the metal cylinder of the pump prevents the air from expanding laterally therefore all of the pressure is exerted vertically on the gas. The gas heats.

            Why??? Because you are forcing the air molecules closer together. That produces many more collisions between molecules causing the average kinetic energy to rise. A rise in kinetic energy is an increase in heat, as measured by temperature.

            The air in the atmosphere near the surface is compressed by gravity. For the same reason that the compressed air in the bicycle pump warms, so does the air near the surface. There are far more collisions between molecules near the surface than at the top of the troposphere. Furthermore, the heating of the surface by solar energy warms the air by conduction.

            That heated air has a lower density than air because heated air expands. Therefore it rises. There are no walls to contain it however and the rising air has to mingle freely with the cooler surrounding air. That means it cannot be an adiabatic process.

            If you had a huge vertical column of air, miles across, you might be able to claim within certain bounds that the central core is adiabatic but that is not a true adiabatic process. Nonetheless, as the heated air rises, the effect of gravity on the parcel reduces with altitude and the gas can expand even more. As it expands, it cools naturally.

            How do you think rain is produced? Heated water at the surface produces water vapour which rises. At higher altitudes it too expands and cools and the cooling causes condensation. Any gas at a certain temperature that is allowed to expand will cool.

            If a gas expands, its mass per unit volume decreases as well. It cannot remain the same. If the mass of a gas is reduced by removing x amount of molecules it will cool and the heat content will be reduced.

            Heat is not a mystery entity, it is the kinetic energy of atoms. The less atoms you have the less heat you have.

            PV = nRT

            The ‘n’ is the number of atoms, molecules, or moles.

            n = PV/RT

            If R and V are constant, then n = P/T(V/R). That means n is proportional to pressure and inversely proportional to temperature. That’s the way it works, if pressure is reduced at higher altitude it means there are less molecules per unit volume, meaning less collisions, a reduced average kinetic energy, and a lower temperature.

            It’s tough to use volume as an analogy in the atmosphere because there is really no container. The volume of the atmosphere is due to the attraction of gravitational force. However, one might argue that the atmosphere is a relatively constant volume, or one might treat it as a series of layers, each with a given volume.

            I have no idea why climate scientists have ignored gravity in their lapse rate theory. They make it sound as if convection alone is causing cooler temperatures at higher altitudes but the lapse rate theory cannot explain a reduction in pressure with altitude.

            Ignoring the effect of gravity is ridiculous. If it were not for gravity, the atmosphere would disappear into space and what was left would be experienced by humans as 1000 mph winds at the Equator. That is, if we could stay on the surface without being flung off into space.

          • Ball4 says:

            “How can a parcel of air rise via convection and not exchange heat with its surroundings?”

            Because that particular rising parcel is NOT on the adiabatic dry lapse, it’s in a healthy thunderstorm exchanging thermodynamic internal energy U with surroundings. It stops rising when it equilibrates usually below tropopause.

            “An example often offered as an adiabatic process is the compression of air by a bicycle pump.”

            The proper example is an adiabatic process in the RAPID compression of air by a bicycle pump. If the compression is done slowly enough the temperature has time to equilibrate, the gas doesn’t warm.

            “For the same reason that the compressed air in the bicycle pump warms, so does the air near the surface.”

            NO. Pistons and cylinders do NOT inhabit the atm.

            “I have no idea why climate scientists have ignored gravity in their lapse rate theory.”

            They have not. The adiabatic lapse rate theory including gravity does explain a reduction in pressure with altitude for a parcel on the LR line where Q and W are zero for that parcel.

            Gordon, you have a lot to learn about atm. physics & it does no good telling you here as you repeatedly demonstrate. The place to learn is a beginner’s atm. thermo. text book & I always suggest Bohren 1998.

          • Stephen Paul Anderson says:

            Eman,
            I’ve been trying to reply to this for two days, stupid filters. Congratulations, you have just redefined convection. Why don’t you tackle the laws of thermodynamics? They need some revision. Maybe your GHE theory will make sense then.

  68. CO2isLife says:

    By what mechanism could CO2 and LWIR between 13 and 18 microns cause a dogleg in temperatures? The marginal impact on W/m2 due to CO2 doesn’t support such a rapid change.

    • Gordon Robertson says:

      CO2….”By what mechanism could CO2 and LWIR between 13 and 18 microns cause a dogleg in temperatures?”

      It would be a pretty amazing gas if it could cause such abrupt warming at a density of 0.04% then cause an 18 year flat trend between 1998 and 2015. If CO2 has such properties, we should be using it in homes as a super-insulator and to back-radiate heat lost through walls and roofs back into homes to raise their temperatures.

      Heck, we wouldn’t need furnaces anymore, CO2, the wonder gas, would keep our homes permanently warm….the only gas that can produce perpetual motion. According to theory, it could also slow down the loss of heat from homes. After all, if it can warm the atmosphere by 33C why can’t it be used to heat our homes?

      • Ball4 says:

        We should be using added CO2 in homes as large as a planetary or moon atm. in sunlight. In the normal home or greenouse, the path length is way too short for CO2 daylight warming.

  69. ren says:

    You need to distinguish the average temperature on the Earth’s surface, which is quite constant, from the temperature of the troposphere, which depends on the production of water vapor at the equator. Another issue is the temperature in the stratosphere, which is the result of high-energy radiation.
    14 CO2, heats the lower stratosphere and affects the escape of water vapor into the stratosphere, which means a loss of energy on the Earth’s surface.
    “The highest rate of carbon-14 production takes place at altitudes of 9 to 15 km (30,000 to 49,000 ft) and at high geomagnetic latitudes.
    Production rates vary because of changes to the cosmic ray flux caused by the heliospheric modulation (solar wind and solar magnetic field), and due to variations in the Earth’s magnetic field.
    After production in the upper atmosphere, the carbon-14 atoms react rapidly to form mostly (about 93%) 14CO (carbon monoxide), which subsequently oxidizes at a slower rate to form 14CO2, radioactive carbon dioxide.”
    The weaker the solar wind, the greater the 14CO2 production in the lower stratosphere and upper troposphere. Similarly, the amount of ozone in these layers increases due to strong ionization during low solar activity.
    https://en.wikipedia.org/wiki/Carbon-14
    https://www.cpc.ncep.noaa.gov/products/stratosphere/strat_a_f/gif_files/gfs_t100_nh_f00.png

  70. ren says:

    During the period of solar minimum, the El Nino4 index remains at a constant high level.
    https://climexp.knmi.nl/data/ihadisst1_nino4a_2017:2021.png

  71. ren says:

    The solar wind remains very weak.
    https://cosmicrays.oulu.fi/

    • Gordon Robertson says:

      ren…”The solar wind remains very weak”.

      The solar wind proves that the space between the Earth and the Sun is not a vacuum. It’s likely not even near 0 K. It is full of superheated electrons and protons that make up the solar wind. In fact, the entirety of space around the Sun is full of those particles.

      Geophysicist, Syun Akasofu, who pioneered studies on the solar wind, claimed that the interaction of those particles with Earth’s magnetic field induced a large voltage which caused electrical currents to run through the atmosphere, the oceans, and the solid surface. Those current might be affecting our weather and climates.

      Akasofu is the same scientists who claimed the IPCC was wrong to blame current warming on greenhouse gases. He claims the IPCC erred by ignoring natural warming from the Little Ice Age. In fact, he ventured a number, claiming an expected warming from the Little Ice Age of about 0.5C/century. That’s about what we have experienced.

      • ren says:

        The point is that the speed of the solar stream does not exceed 500 km/s.

        • Gordon Robertson says:

          ren…”The point is that the speed of the solar stream does not exceed 500 km/s”.

          I got your point. You mentioned the solar wind and we have had discussion on this blog that space is a vacuum. I am trying to draw attention to the generalizations made about science and alternative explanations for global warming.

  72. Gordon Robertson says:

    sorry, this did not post and I lost my place.

    Part 1…

    swannie and ball4…”Above that level, the thermal IR EM energy exiting the Earth must occur via the other Green House gases, primarily CO2″.

    This is a quaint theory put forward because no one has ever measured or observed what is going on. We need to know how much heat is up there and how a trace gas like CO2 can emit it to space. It’s highly unlikely that is the case so there must be another mechanism in place.

    It’s either that or we don’t fully understand the processes involved. For example, heat, as measured by temperature, decreases with atmospheric pressure, as it does in any gas. At least, it does unless you can adjust the volume, and/or the number of molecules to compensate. The 18 year flat trend in the UAH data, from 1998 – 2015, has pretty well disproved the theory.

    • Gordon Robertson says:

      part2…

      What you propose above does not come from physics or chemistry, it’s an ad hoc theory proposed largely by climate modellers and based on a century old theory that has never been adequately tested in the atmosphere.

      I am betting on the fact that we don’t understand the processes involved. Climate modellers have done us a great injustice by overly-simplifying the physics to radiation alone. They pay lip service to convection and conduction but for the most part, they completely ignore basic principles like the Ideal Gas Law, especially Dalton’s Law of Partial Pressure. If they understood that part of the IGL, they would be forced to abandon the notion that 0.04% CO2 could cause any significant heating, or produce significant dissipation.

      Modelling science attracts mathematicians, and even computer programmers, who are not well versed in physics. Even when you get a climate scientist with a degree in physics, like James Hansen, you have a physicist who has spent much of his career in astronomy, pursuing a wild guess by Carl Sagan that the atmosphere of Venus was caused by a runaway greenhouse effect. That far-flung theory has now become the basis for science at NASA GISS.

      • Gordon Robertson says:

        part3…

        Until scientists can put numbers to the effect of 0.04% CO2 on atmospheric warming and cooling, via dissipation to space, you don’t even have a theory. It’s nothing more than an aside, an agreement.

        It amazes me that current alarmist theories completely ignore the 99% of the atmosphere that is nitrogen and oxygen. When a real greenhouse warms, it has nothing to do with the 0.04% CO2 in the air, or the water vapour. You could remove both and the greenhouse would still warm. It does so when SW solar heats the soil in the greenhouse, and the infrastructure, and air in contact with both is warmed.

        The same applies to the atmosphere. SW solar heats the solid surface and the oceans, and air in contact with both is heated. The lapse rate to which you refer involves the process of the heated air rising….nothing to do with radiation. The difference between the real greenhouse and the atmosphere is that the real greenhouse is enclosed and convection is stifled. That is not the case in the atmosphere, if it was the case, hot air could not rise.

        There is something really wrong with the greenhouse theory. It has not been studied effectively and we are at the mercy of hackers who program nonsense into computers.

        • E. Swanson says:

          Gordo, Your 3 part reply continues to ignore the basics of atmospheric science, including the long effort to build models to mimic the physics of the atmosphere. You just hand wave and deny the factual basis, including satellite and surface based measurements of the spectral emissions of all the gases, along with the laboratory science, all of which has been put into the theoretical explanation of the world in which we live. You continue to confuse the physics of a greenhouse with those atmospheric process, as if that old analogy actually describes the scientific understanding of Global Warming.

          You are not interested in truth, only in spreading denialist misinformation. The proof is in your statement:

          The 18 year flat trend in the UAH data, from 1998 – 2015, has pretty well disproved the theory.

          That comment represents intentional cherry picking of a portion of the data which starts with a strong El Nino and ends just before the next strong El Nino, thus the trend is small. If one slightly changes the dates, say, 1999 thru 2017, a solid warming trend appears in the calculation.

          Fortunately, your game is an obvious con and you should be ignored. You are just another useless internet troll.

          • Gordon Robertson says:

            swannie…” Your 3 part reply continues to ignore the basics of atmospheric science, including the long effort to build models to mimic the physics of the atmosphere”.

            If you set out to model the atmosphere, how would you do it? You would need to take in very complex systems like conduction and convection of heat plus the relationship between radiation and heat. You might want to know the exact relationship between radiation and the electrons that produce them in atoms. In other words, you’d want to be well versed in quantum theory, not just as a theory, but with how it can be practically applied.

            You would want to understand the turbulent flow of fluids like gases and water. You would definitely want to understand the 2nd law explicitly since weather is pretty well based on the transfer of heat.

            So, what have modelers done? They have used existing differential equation theory such as the Navier-Stokes equations to describe gaseous flows in the atmosphere and probably in the oceans. However, not enough is known about such systems, as pointed out by John Christy of UAH. So, the modelers got creative and started inventing theory.

            One of their inventions was giving a heating effect value to CO2 while completely ignoring the quantity of CO2 in the atmosphere. Nowhere in modeling theory, or in general physics/chemistry, has such a value been elicited through experiment via the scientific method. Modelers have guessed a value.

            Secondly, they have invented a positive feedback involving radiation from CO2 back to the surface while ignoring the definition of positive feedback. All positive feedback of the type they use requires an amplifier. However, luminaries, [sarc/off], like Gavin Schmidt of NASA GISS, have presumed there is amplification inherent in feedback, which is not true.

            Therefore, models have a built-in system of amplification that bears no merit and a so-called forcing mechanism in CO2 which has never been proved to create the heat it is claimed to produce. If you take those two inaccuracies out of models they will produce no future warming of a calamitous nature.

            Ergo, current models come nowhere near to mimicking the atmosphere or the ocean-atmosphere interface. That’s why they are called unvalidated models.

          • Gordon Robertson says:

            swannie…”That comment represents intentional cherry picking of a portion of the data which starts with a strong El Nino and ends just before the next strong El Nino”

            The point is, the flat trend includes the 1998 EN and it was admitted by the IPCC in one of their reviews (AR5). They admitted 15 years of it, ending in 2012, well before the 2016 EN began.

          • E. Swanson says:

            Gordo, Replying to last comment first, in which you wrote:

            The point is, the flat trend includes the 1998 EN and it was admitted by the IPCC in one of their reviews (AR5). They admitted 15 years of it, ending in 2012, well before the 2016 EN

            You apparently have no understanding of the mathematical effect of the 1998 spike on the trend calculation. It’s rather like a kid’s see-saw where the heaviest kid lifts the lightest kid off the ground. A spike at the beginning of the period results in a lower trend. When the spike is at the end of the period, the reverse is true. Wake up and smell the coffee, it’s not 2015 any more…

          • E. Swanson says:

            Gordo, asks how I would model the atmosphere. Well, I’ve never attempted to build such a model, though most of my “career” involved building models of dynamic systems. I would think that the models used to forecast weather would be appropriate, using the same fundamental equations. The first problem with modeling climate is such models are usually of lower resolution to be able to be run over many years, not days. Thus, the ability to produce fine scale events, such as local vertical convection, clouds and hurricanes, is limited.

            The rest of your post continues to display your lack of understanding of the physics. There’s considerable evidence, both from lab work and from real world measurements, which show the impact of CO2 and other GHG’s in the atmosphere. Even though CO2 is a trace gas, it’s impact is strong because it’s influence is strongest above the troposphere where other gases have minimal emissions, an effect which is propagated downwards to warm the surface.

            Lastly, your in confusion, you continue to mistakenly assume that “amplification” requires some sort of “amplifier”, whereas it’s the overall effect of all the internal processes which result in an increase in the temperature beyond the basic impact of increased CO2. For example, you fail to understand that a warming atmosphere will likely result in more water vapor, a GHG, in the atmosphere and a warmer world will imply less snow and sea-ice, reducing the surface albedo, both of which would result in added energy at the surface.

        • bdgwx says:

          I counted 3 factually and egregiously wrong statements and 1 strawman in part 3 alone. And it is still apparent that the GHE hypothesis not understood. That is going to make it difficult if not impossible to mount an effective challenge against it.

    • Dr Roys Emergency Moderation Team says:

      E. Swanson, bdgwx, please stop trolling.

  73. Norman says:

    Geraint Hughes posted this article.

    https://principia-scientific.org/nasas-great-peak-fake-swindle/#comment-31241

    What he posts seems correct. The problem is when you see this type of material.

    http://climatemodels.uchicago.edu/modtran/modtran.doc.html

    This has blackbody curves to compare the Modtran. The blackbody curves all seem to peak around 15 microns or less.

    This does seem complete distortion of physics and it comes from the University of Chicago.

    You put in data on a blackbody calculator and the peak for 320 K is less than 10 microns! 15 microns is way down the curve.

    http://www.spectraplot.com/blackbody

    The above calculator is validated by another calculator.
    http://www.calctool.org/CALC/phys/p_thermo/wien

    Things like these does make the skeptical argument about fraud considerably stronger. The actual CO2 emission would be much lower than the standard data given. Something here is very wrong. Can science actually gotten this bad in pursuit of an agenda. I hope not!

    • Nate says:

      Norman,

      There is nothing nefarious going on here.

      It is well known that plotting BB spectra vs wavenumber gives a different peak position (if converted to wavelength) then if plotted vs wavelength directly.

      No distortion. No fraud. Just math.

      http://www.oceanopticsbook.info/view/light_and_radiometry/level_2/a_common_misconception

    • Nate says:

      “The actual CO2 emission would be much lower than the standard data given.”

      Absolutely not. The W/m2 for CO2 peak is the same for a wavelength or wavenumber spectrum.

      • Norman says:

        Nate

        Thanks for your intelligent reply. I will have to do more reading and research to correctly understand the concepts.

        https://www.spectralcalc.com/blackbody/CalculatingBlackbodyRadianceV2.pdf

        • Nate says:

          This may help from Wiki on Wien’s Law.

          “Maxima differ according to parameterization

          Notice that for a given temperature, parameterization by frequency implies a different maximal wavelength than parameterization by wavelength.

          For example, using T = 6000 K and parameterization by wavelength, the wavelength for maximal spectral radiance is λ = 482.962 nm with corresponding frequency ν = 620.737 THz. For the same temperature, but parameterizing by frequency, the frequency for maximal spectral radiance is ν = 352.735 THz with corresponding wavelength λ = 849.907 nm.

          These functions are radiance density functions, which are probability density functions scaled to give units of radiance. The density function has different shapes for different parameterizations, depending on relative stretching or compression of the abscissa, which measures the change in probability density relative to a linear change in a given parameter. Since wavelength and frequency have a reciprocal relation, they represent significantly non-linear shifts in probability density relative to one another.

          The total radiance is the integral of the distribution over all positive values, and that is invariant for a given temperature under any parameterization. Additionally, for a given temperature the radiance consisting of all photons between two wavelengths must be the same regardless of which distribution you use. That is to say, integrating the wavelength distribution from λ1 to λ2 will result in the same value as integrating the frequency distribution between the two frequencies that correspond to λ1 and λ2, namely from c/λ2 to c/λ1. However, the distribution shape depends on the parameterization, and for a different parameterization the distribution will typically have a different peak density, as these calculations demonstrate.”

        • Nate says:

          “I will have to do more reading and research to correctly understand the concepts.”

          And pls apply at least as much skepticism when someone at PSI casually tosses out the F word (Fraud).

    • Dr Roys Emergency Moderation Team says:

      “Geraint Hughes posted this article.

      https://principia-scientific.org/nasas-great-peak-fake-swindle/#comment-31241

      What he posts seems correct.”

      As usual.

  74. Bindidon says:

    I’m wondering why all the commenters here feel the need to reply to Robertson’s nonsense.

    It won’t take much time for him to come back with his thoroughly stupid claim about NOAA having slashed 4500 stations!

    He never had a look at the GHCN V4 directory!

    My guess is that he even doesn’t know how to unzip files. Otherwise he would know since longer time that GHCN V4’s data set currently consists of over… 27000 stations (27361 the last time I downloaded the data).

    *
    As long as Robertson fills this blog with his endlessly repeated trash, I’ll keep out.

    It is simply too boring to look at such nonsense like the Moon being unable to rotate about its axis, etc etc etc.

    The more you commenters reply to his nonsense, the more nonsense he will write in turn.

    Why don’t you simply ignore him???

    • Ball4 says:

      Simply ignoring Gordon would be less fun Bindidon. True, you can learn a lot just by observing his obvious and sometimes obscure mistakes but heck, it’s a blog, have some fun with the denizens. In the process one can increase one’s own understanding of atm. physics.

      Dr. Spencer doesn’t ignore the less educated, he tries to engage and teach in part through experiments. Some of his students progress while others regress, an age old circumstance.

      • Bindidon says:

        Ball4

        Sorry, we seem to live in two different worlds.

        I don’t speak about ‘obvious and sometimes obscure mistakes’, but about discrediting, denigrating and lying.

    • Gordon Robertson says:

      binny…”Im wondering why all the commenters here feel the need to reply to Robertsons nonsense.

      It wont take much time for him to come back with his thoroughly stupid claim about NOAA having slashed 4500 stations!”

      I have answered your first point several times. It’s because I’m a handsome, intelligent brute who people have trouble ignoring or avoiding.

      As to your second point, you can lead a horse to water but you cannot make him drink.

      https://web.archive.org/web/20150410045648/http://www.noaa.gov/features/02_monitoring/weather_stations.html

      In the words of NOAA themselves: ” Why is NOAA using fewer weather stations to measure surface temperature around the globe from 6,000 to less than 1,500?”.

      Over at chiefio, he has proof that NOAA has slashed 90% of the stations from its record since 1990. A more enlightened person would have an interest in what he has to say since he too delves into NOAA records, as well as those of GISS. He has a background in such analysis.

  75. ren says:

    N rotations/day, is planets sidereal rotation period
    But for N = 10 it is 1,1548
    If Earth were rotating 10 times as much, Earths effective temperature would be:
    288 K * 1,1548 = 332,58 K
    https://www.cristos-vournas.com/

    • ren says:

      For the final Te result
      N (rotations/day) value is operated twice in forth root
      Te = [ Φ (1-a) So (1/R²) (β*N*cp)¹∕ ⁴ /4σ ]¹∕ ⁴ (K)
      https://judithcurry.com/2020/01/25/week-in-review-science-edition-117/#more-25661

    • ren says:

      We still forget that the Earths troposphere is extremely thin. Therefore, the atmosphere has little effect on surface temperature.
      The troposphere is characterized by turbulent mixing and overturning. This turbulence results from uneven heating of the surface and the atmosphere. Temperature decreases with height in this layer. This temperature decrease is known as the environmental lapse rate and averages 6.5 C/km. This layer extends from the surface up to an average altitude of 11 km (Ahrens 10).
      https://vortex.plymouth.edu/atmosphere/layers.html

      It is different on Venus.

      The troposphere on Venus contains 99% of the atmosphere by mass. Ninety percent of the atmosphere of Venus is within 28 km of the surface; by comparison, 90% of the atmosphere of Earth is within 10 km of the surface. At a height of 50 km the atmospheric pressure is approximately equal to that at the surface of Earth.[20] On the night side of Venus clouds can still be found at 80 km above the surface.[21]

      The altitude of the troposphere most similar to Earth is near the tropopausethe boundary between troposphere and mesosphere. It is located slightly above 50 km.[17] According to measurements by the Magellan and Venus Express probes, the altitude from 52.5 to 54 km has a temperature between 293 K (20 C) and 310 K (37 C), and the altitude at 49.5 km above the surface is where the pressure becomes the same as Earth at sea level.
      https://en.wikipedia.org/wiki/Atmosphere_of_Venus

  76. gallopingcamel says:

    @Ball4, said:
    “YOU are wrong Gordon, scientific method instrumentally observed Earth global 255K at TOA and 288K near surface which is a difference of 33C for Earth atmosphere with 0.04% CO2. It is your boulder method that is unscientific atm. prose.”

    Wow! There are still people who think the GHE (GreenHouse Effect) is 33 K.

    That fantasy is based on impeccable mathematics undone by incorrect assumptions concerning the thermal properties of planets.

    If the GHE was 33 K the surface temperature would be roughly 255 K whereas observations show a much lower figure (197 K). Here is a link that explains in more detail:
    https://tallbloke.wordpress.com/2014/04/18/a-new-lunar-thermal-model-based-on-finite-element-analysis-of-regolith-physical-properties/

    You owe Gordon an apology.

    • Ball4 says:

      “observations show a much lower figure (197 K)”

      gc, the 197K is from an airless moon with regolith. The 33K GHE exists for a L&O surface 1bar nearly transparent earthen atm. It is important to understand which GHE basis is being discussed – airless or ~transparent 1bar atm.

      In more detail, you confuse a median global brightness temperature of ~197K measured by Diviner radiometers on an airless moon with assumptions for optical properties of its global regolith with a 1bar N2,O2 earthen nearly optically transparent 1bar atmosphere deduced from measurements by CERES radiometers with measured optical properties of earthen L&O surface global ~255K for 33K GHE.

      Note Gordon uses a stationary boulder for an analogy of a vibrating molecule in motion. His poor analogy is at fault and quickly breaks down.

      • gallopingcamel says:

        My definition of the GHE is the temperature difference between Earth “As Is” and Earth without an atmosphere.

        So what is your definition?

        • bdgwx says:

          Earth “as is” vs. the hypothetical scenario of Earth without GHG gas species in the atmosphere but all other things being equal.

        • bdgwx says:

          The point is to isolate the temperature difference that is directly attributable to the GHE and only the GHE. Obviously the atmosphere, albedo, surface composition, rotation rate, etc. all contribute the temperature difference between the Earth and Moon. That’s not being challenged, but it’s also not the point either.

          • Ball4 says:

            “So what is your definition?”

            gc, the best atm. greenhouse power definition I’ve seen is from Haberle in Icarus 223 (2013) p. 619-20.

            Tse-Te where Tse=effective surface temperature & Te=planetary effective temperature

            Many times, in the literature, you find:

            Ts-Te where Ts=mean surface temperature

            which Haberle shows is less meaningful, less accurate when surface T varies enough in time and/or space. The basis for “surface” is important too as many in the literature include an existing 1bar atm. w/L&O surface whereas N&Z used the concept of an “airless” (their term) surface with best guess optical properties of moon regolith in their curve fits. For earthen GHE many times you will find Te basis 1bar atm:

            Ts-Te = 288-255=33K, rounded

            For earthen GHE with Earth in “airless” N&Z condition & with moon regolith assumed global surface optical properties for N&Z basis Te:

            Ts-Te = 288-197=91K, rounded

        • Gordon Robertson says:

          cam…”My definition of the GHE is the temperature difference between Earth As Is and Earth without an atmosphere”.

          Cam…don’t forget the oceans.

      • Gordon Robertson says:

        ball4…”Note Gordon uses a stationary boulder for an analogy of a vibrating molecule in motion. His poor analogy is at fault and quickly breaks down”.

        Au contraire, the vibration of atoms in a solid are a very good example of heat transfer via the 2nd law. We have become so strung out on the theory, that radiative heat transfer is the only means of heat transfer, that we forget the other two forms, conduction and convection. Clausius claimed the 2nd law applies to all three.

  77. Snape says:

    @GC

    Let me add to what Ball4 said. The 255K Earth is a thought experiment – what would the global mean be given no GHGs, but with everything else unchanged, including albedo?

    Tallbloke has not clued in, and thinks he is clever by making calculations as if the planet were covered by regolith.

    Meanwhile, Gordon is convinced that the energy leaving Earths surface just disappears onto thin air. No comment by you, other than you think we owe him an apology. Ridiculous!

    • Ball4 says:

      “The 255K Earth is a thought experiment” as well as satellite radiometer measured multiannual planetary effective temperature. In same way as the moon’s 197K but with the moon’s best guess global optical properties.

    • Gordon Robertson says:

      snape…”Gordon is convinced that the energy leaving Earths surface just disappears onto thin air”.

      I have never claimed that, I have claimed that most heat leaves the surface via conduction and convection and that radiation is a minor player. I quoted R.W. Wood, who pointed out the obvious, that radiation is subject to the inverse square law. I did not claim it disappeared, I claimed it was highly dissipated after a few feet and that it was ineffective in the heating of GHGs at higher altitudes than a few feet.

      Compare that to a radar sail on a ship, transmitting a signal at 10,000 watts. By the time it travels a mile and back to the receiver it has been reduced to millionths of a watt.

      • bdgwx says:

        The ISL arises due to the relationship between the radius and the surface area of a sphere. In Earth’s case the surface area of the sphere at radius 6360 km and 6390 km is a difference of only 1%. In other words, by applying the ISL we can see that Earthly radiation is attenuated by about 1% at 30 km above the surface. So that 400 W/m^2 of LW radiation at the surface is attenuated to 396 W/m^2 at 30 km. What about your “few feet claim”? The attenuation at 10m is 0.0003%. That hardly qualifies as “highly dissipated”.

        • Gordon Robertson says:

          bdg…”by applying the ISL we can see that Earthly radiation is attenuated by about 1% at 30 km above the surface.”

          I think your math is at fault somewhere. R.W. Wood, who was an expert on CO2 radiation, claimed surface radiation would be insignificant within a few feet.

          I gave an example, and I wonder if anyone has tried it. Heat up an 1500 watt ring on an electric stove till it glows cherry red. Hold your hand close to it and you will feel super-heated air plus the effect of radiation. Pull you hand back a few feet above the ring and you can barely feel the heat, never mind the radiation.

          The 1500 watts, of course, applies to the electrical power dissipation not the radiation. Still, when a ring glows cherry red, the radiation given off far exceeds the infrared range in frequency. Say the temperature is 1000 C and the radiation intensity is T^4, with a multiplier of the Stefan-Boltzmann constant. What does the radiation intensity mean?

          The multiplier is 5.67 x 10^-8/(m^2.K^4)

          • Gordon Robertson says:

            Obviously, it’s not that significant in the first place or it would cook your hand at a few inches. At 4 feet, you can’t really feel the effect of a 1500 watt source at a guesstimated temperature of 1000 C. What possible intensity could the radiation from the Earth’s surface have at 30 km?

            Certainly not 1%. Maybe 0.0000000001%.

            IMHO, a major mistake made by people using the Stefan-Boltzmann equation is to put a label of x watts on EM radiation. That radiation has no power, it only has potential power.

            Claiming a body at temperature T is emitting radiation of 100 watts is false. A watt is a measure of mechanical power, of doing work, or its equivalent in heat calories, and radiation from a body is not doing work. It doesn’t even have an equivalence like the equivalence of heat and work. The EM cannot do anything till it is absorbed by mass with a lower temperature than the emitting body.

            When you talk about EM, you can only talk about a field, or flux flow. If that EM is absorbed by electrons in an atom, the electrons can be stimulated to do work.

            When S-B put out that equation, nothing was known about how heat was transferred through space. Nothing was known of the source, the electrons in atoms. Heat was presumed to flow through space via some kind of aether.

            We know these days that is wrong. Heat, as the kinetic energy of an electron, is converted to EM by electrons in atoms and the heat creating the EM is lost. That is, the emitting body cools. I am sure S-B were referring to heat when they claimed EM is measured in watts. They thought it was heat leaving a body and flowing through space.

            I am not quibbling over their T^4 relationship between the temperature of a body and the intensity of emitted radiation, I am just asking what it means. It’s not power because it can do no work till it is converted back to heat.

          • bdgwx says:

            GR said: What possible intensity could the radiation from the Earths surface have at 30 km?

            The attenuation due to the ISL is 1%. The attenuation due to other factors including GHGs is about 85%. This 15% that is allowed through is called the atmospheric window. See Wild et al. 2013.

          • E. Swanson says:

            Gordo wrote:

            Obviously, its not that significant in the first place or it would cook your hand at a few inches. At 4 feet, you cant really feel the effect of a 1500 watt source at a guesstimated temperature of 1000 C. What possible intensity could the radiation from the Earths surface have at 30 km?

            Your analogy completely misses the fact that your 1500 watt stove element acts like a point source the further away you move from it. With the atmosphere, the surface curvature is so small that the surface and the layers within the atmosphere can be treated like parallel plates. The IR emissions from a large fire can ignite flammable materials many feet away from the source. As an example, consider Australia’s recent fires…

          • Gordon Robertson says:

            bdg…”This 15% that is allowed through is called the atmospheric window. ”

            First we have a greenhouse in the sky now it has windows. Do you believe all that pseudo-science?

            In the field of electronics we have all sorts of analogies to dumb down the science. Some people liken the current running through a circuit to water through a pipe. I could never fathom the reason for such Electronics for Dummies simply because charge running through a circuit is nothing like water running through a pipe.

            Others, at a more technical level, have adopted the notion of current injection. When you play games like that you omit the reality that a current requires a voltage (electromotive force) to move it. Current does not move on its own volition. Others imagine holes moving in a semiconductor, again, a useless ploy that negates the fact that only electrons can move through a semiconductor.

            There is no IR window in the atmosphere and if you see it as such you are missing what electromagnetic radiation is about. Those who are prone to using such analogies tend to get caught up in the math while missing the real processes. That’s why this gibberish about catastrophic global warming has taken hold.

            There is no way that EM leaving the surface is dissipated by only 1% at 30 km. EM leaving a radio station antenna at 50,000 watts is received at only a few milliwatts after a few miles. In the old days, with TV antennas on almost every home, the EM signal at the antenna was measured in microwatts. The transmitter were all line of sight.

          • Nate says:

            Gordon,

            Welcome back.

            With all your R&R you still haven’t figured out that the Earth surface is not a point source, and radiation barely decreases with altitude above a planet this large.

          • bdgwx says:

            GR,

            So your challenge to the ‘atmospheric window’ is based not on the the fundamental process involved but purely on your dissatisfaction with jargon?

            Yes. The ISL attenuation is most certainly small at 30km. I showed you the calculation below. You are free to check my work. But honestly it shouldn’t even require a calculation to convince you. This is an intuitive concept using trivial geometric skills.

            Regarding “getting caught up in the math”…guilty as charged.

        • bdgwx says:

          Let’s assume the burner is a 0.1m sphere where the 1500 W input is entirely converted into radiation. The flux at 1.0m is then:

          ((1.0^2 * 3.14 * 4) / (0.1^2 * 3.14 * 4)) * 1500 = 15 W/m^2.

          Here is the same calculation for Earthly radiation at 30km.

          ((6360e3^2 * 3.14 * 4) / (6390e3 * 3.14 * 4)) * 400 = 396 W/m^2.

          Notice that the ISL attenuation for the burner at 1.0 meters is 99% whereas the attenuation for the Earth at 30e3 meters is 1%. Why? Because the burner flux originates from a very small surface area and spreads out a lot but the Earthly radiation originates from a very large surface area and spreads out only a little bit.

    • Dr Roys Emergency Moderation Team says:

      Snape, Ball4, bdgwx, E.Swanson, please stop trolling.

  78. gallopingcamel says:

    Ball4 & bdgwx,
    This is good! I thought that we had a “Disagreement” but it is more like a “Failure to Communicate”

    Let me begin with Ball4 since he goes to the heart of the paper I am writing. Starting with Earth “As Is” I am calculating the effect of adding CO2 for 1, 2, 3, 4, 5, 6, 7, 8, 9, 10, 11 & 12 doublings.

    Then going the other way, reducing the amount of CO2 by 1, 2, 3 & 4 halvings.

    This is not an original idea. You can find it in Hansen et al (2013). Figure 7(a) in this paper is the output from Gary Russell’s model. Figure 7(b) shows the sensitivity constants that he used, including one that is 27.7 K/doubling of CO2. The reference point is Earth’s atmosphere as in 1950 when the [CO2] was 310 ppm.

    My model is based on papers published by Robinson & Catling from 2012 to 2014 using total atmospheric pressure while Russell relies on an (alleged) logarithmic relationship between CO2 and temperature:

    Doublings……..-3…..0…..3…..6…..9….12 [CO2]
    Hansen et al…..245…288…302…321…331…341 K
    Gallopingcamel…288…288…288…290…300…387 K

    According to my model 12 doublings of [CO2] boils our oceans. That sounds even worse than Hansen’s exaggerations.

    In my defense I have struck a blow for sanity by showing that halvings of [CO2] have no measurable effect. Anyone with a grain of common sense should already know that.

  79. gallopingcamel says:

    @Snape,

    Somehow I overlooked your comment:
    “@GC
    Let me add to what Ball4 said. The 255K Earth is a thought experiment what would the global mean be given no GHGs, but with everything else unchanged, including albedo?”

    Like Ball4 you have gone to the heart of the paper I am working on. I am trying to answer the question you pose above. Will the paper get published? It may take a while to fight through the “Peer Review” process.

    If a discipline does not allow dissenting views to be heard it can’t be dignified with the name “Science”. The word “Cult” comes to mind.

  80. Entropic man says:

    Nothing to do with not allowing dissenting views. The paper has to be coherent, consistent and consilient.

  81. Bindidon says:

    gallopingcamel

    You wrote above:

    Will the paper get published? It may take a while to fight through the “Peer Review” process.

    If a discipline does not allow dissenting views to be heard it can’t be dignified with the name “Science”. The word “Cult” comes to mind.

    *
    If YOU were a reviewer and would read in a paper presented by anybody such a sentence:

    … while Russell relies on an (alleged) logarithmic relationship between CO2 and temperature…“,

    then YOU would yourself CERTAINLY have a negative meaning about that paper!

    How can you write such words, proving at best that you prefer to ignore fifty years of scientific debate, just because you don’t like its results?

    Did you ever read at least Myrhe & al.’s 1998 paper?

    https://agupubs.onlinelibrary.wiley.com/doi/10.1029/98GL01908

    *
    I propose that you carefully (!!!) read the two following head posts written by Clive Best on his blog:

    1. http://clivebest.com/blog/?p=8837
    2. http://clivebest.com/blog/?p=4597

    Let me moreover predict that if after having read that stuff, you still consider this logarithmic relationship being ‘alleged’, then your paper won’t pass any peer review process ever. No chance!

    And… no: this won’t be due to a ‘dissenting view’.

    • Gordon Robertson says:

      binnie….”I propose that you carefully (!!!) read the two following head posts written by Clive Best on his blog:”

      You first link is based on someone working with models, not doing measurements in the atmosphere. Your other links involve supposition, not measurement.

    • gallopingcamel says:

      Thanks for those interesting links that were new to me. The Myrhe paper lacks the specificity of Hansen et al (2013) so I don’t see much relevance.

      The comments in the “Best” links were illuminating. Apparently Clive Best did not realize where the logarithmic relationship came from until he read the Arrhenius (1896) paper on February 16, 2019.

      Nick Stokes made a comment that I can’t improve on.

      You seem to think that Thorium reactors are impractical. There are at least four projects under way which means that people with money to invest disagree with you.

    • gallopingcamel says:

      British people like to make “Deliberate Understatements”. I must admit to that fault when I used the term “alleged” to describe the totally absurd idea that there is a logarithmic relationship between the concentration of CO2 and global temperature.

      All it takes to enjoy the exquisite absurdity is to take the claims of Hansen et al. (2013) literally. They say halving the concentration of CO2 lowers the global temperature by 28 K. Given that there is no limit to “Halvings” it would only take ten of them to reduce the global temperature by 280 K.

      I hope you can tell me what is wrong with that.

      • Entropic man says:

        The CO2 forcing equation is

        ∆T=5.35ln(C/Co)3/3.7

        Halving the CO2 from 400ppm to 200ppm cools the temperature by

        5.35ln(200/400)3/3.7 = 3C

        Another halving to 100ppm cools by

        5.35ln(100/400)3/3.7 = 6C

        Drop to 1ppm and you cool by

        5.35ln(1/400)3/3.7 = 27C.

        Once temperatures drop below 0C you lose most of the water vapour feedback, so that last calculation is probably an overestimate.

        That’s 3C per halving. Since this is way lower than your claim of 28K/halving methinks you misread Hansen et al 2013.

        • Gordon Robertson says:

          entropic…”Halving the CO2 from 400ppm to 200ppm cools the temperature by

          5.35ln(200/400)3/3.7 = 3C”

          There is not one shred of scientific evidence to prove that. It has never been tested using the scientific method, it’s just more ba.b.b.ling from climate modelers.

        • gallopingcamel says:

          Mr. Entropic,
          You got that equation slightly wrong. Here is a link that shows exactly where the sensitivity constant came from.
          https://diggingintheclay.wordpress.com/2013/03/07/arrhenius-revisited/

          Arrhenius corresponded with Hogblom and Angstrom who persuaded him to reduce the sensitivity constant.

          • bdgwx says:

            I thought Arrhenius changed his 5.4C per 2xCO2 from 1896 to 4.0C in 1908 upon recalculating with updated lunar radiation data. Perhaps Hogblom and Angstrom provide him with updated radiation data for CO2 as well?

            At any rate the Arrhenius equation comes in different variations. The variation on the blog here relates concentration directly to temperature using a base-2 sensitivity parameter whereas the canonical variation relates concentration to an energy flux using a base-e sensitivity parameter. You then need to take the canonical result and map it to a temperature using a climate sensitivity parameter. Typical values are 5.35 W/m^2 per e and 0.75C per W/m^2. It’s the climate sensitivity parameter that is uncertain and is believed to be variable.

      • bdgwx says:

        What paper are you looking at? The Hansen et al. 2013 paper regarding climate sensitivity that I’m reading states 0.75C per W/m^2 with 2xCO2 being 3.7 W/m^2 which yields 2.8C per 2xCO2 for the fast feedback ECS.

        • gallopingcamel says:

          There are two Hansen et al. (2013). The one I am referring to has James Hansen, Makiko Sato, Gary Russell, and Pushker Kharecha as authors.

          I am replicating Figure 7(a) and 7(b) on page 16.

          Figure 7(b) shows a sensitivity constant of ~27 K/halving for /4 & /8.

          Hansen adopts these extreme sensitivities in attempt to claim that CO2 drove the last seven glaciations. Some years ago I showed that a sensitivity constant of 16 K/halving is enough as long as you factor in “Polar Amplification”.
          https://diggingintheclay.wordpress.com/2013/05/04/the-dog-that-did-not-bark/

          Inexplicably Hansen overlooked polar amplification so his “Sensitivity” is even more insane than mine.

          • bdgwx says:

            That’s not per halving though. That’s for a very specific halving and for a different kind of Earth. Namely it is the drop from 1/4 to 1/8 and for altered ocean depth and snow/ice albedo properties (of which I’m unsure of the reasoning). This arrangement is what activated the snowball tipping point in this particular simulation. I believe the point of that experiment is to demonstrate that climate sensitivity in C per W/m^2 is U shaped where the current state of the climate is currently at the bottom of the U but with increasing perturbations of CO2 (especially on the halving direction) the sensitivity can increase substantially as tipping points are activated. The message from Hansen in this paper is that the canonical 0.75C per W/m^2 (or 3C per 2xCO2) sensitivity is reasonable though likely a lower bound with the more likely sensitivity being closer to 1C per W/m^2 (or 4C per 2xCO2) or possibly higher. Hansen is NOT saying that a 28C response is expected from a halving or doubling of CO2. In fact, he’s saying the opposite because the 1st halving or doubling has a more modest effect compared to the extremes.

      • Bindidon says:

        gallopingcamel

        When I read your lines here, containing increasing nonsense (as perfectly demonstrated by two commenters), I reply the following:

        – (1) you very probably never have read the 38 pages long paper

        ‘Climate Sensitivity, Sea Level, and Atmospheric CO2’
        written by Hansen, Sato, Russell and Kharecha

        – (2) before you prove your ability to write a paper of similar quality, I propose that you simply shut up. You make yourself ridiculous.

        Rgds
        J.-P. D.

        • Gordon Robertson says:

          binny…”you very probably never have read the 38 pages long paper ”

          Cam is a scientist he doesn’t read fiction from the likes of Hansen et al.

          • gallopingcamel says:

            @Gordon,
            Shameless plug! While I was a professional physicist who built the world’s first integrated fiber optics factory (1978) and led the team that built the world’s brightest gamma ray source (1995) I am a mere amateur when it comes to climate science.

            As such I read a wide range of junk science written by people like Michael Mann and James Hansen.

            Some of my critics here such as Bindidon, Snape, bdgwx and Entropic man read even more of this trash than I do. Worse still some of them act like cult members who put their hands over their ears when someone disagrees with what they see as “Holy Writ”.

            Several days ago I mentioned that I am replicating Figure 7 in Hansen et al. (2013) and yet Bindidin says that I never read that 38 page paper. He got the length of the paper wrong….it consists of 31 pages and the “Figure 7” I am referring to appears on page 16.

            That the British Royal Society founded in 1660 should publish such a load of rubbish shows that they are as corrupt as NASA/GISS. A pox on both their parties!

          • bdgwx says:

            GC, FWIW I don’t necessarily buy into the high sensitivity estimates like those from Hansen and others. I’m more of a middle-of-the-road advocate at least right now. I’m very open to debate on the precise sensitivity though. My position can certainly be moved on this matter.

    • Dr Roys Emergency Moderation Team says:

      bdgwx, please stop trolling.

  82. ren says:

    Tropical downpours from the Pacific have moved to northern Australia.

    • Gordon Robertson says:

      ren…”Tropical downpours from the Pacific have moved to northern Australia”.

      Your announcement is premature. We have been deluged by rain here in the Vancouver, Canada Pacific region area and we are warmed to expect 2″ more by the weekend. Furthermore we recently neared a record cold spell in this day of global warming alarm.

  83. Snape says:

    More conveyor belt fun! 😊
    Earlier, I wrote:

    [Imagine a 40 meter section of conveyor belt, moving south to north. One apple per second is placed on the south end. How many apples will be on the conveyor belt at steady state?

    It depends on the velocity of the conveyor. The slower, the more apples.]

    *****
    Apples were meant to represent joules. The north end of the conveyor belt was meant to represent the tropopause.

    If the speed of the conveyor belt is set to 8 meters per second, then at steady state there will never be more than 1 joule within 8 meters of the tropopause.

    If the speed is slowed to 1 meter per second, then at steady state there will never be less than 7 joules within 8 meters of the tropopause.

    A higher ERL?

    • Chic Bowdrie says:

      Snape,

      You told me once how to search for something archived on Dr. Roy’s blog. Can you refresh my memory? It will be much appreciated.

      • Bindidon says:

        Chic Bowdrie

        I mostly use Google when trying to access such things.
        Sometimes I even manage to find a comment of mine that way…

        • Chic Bowdrie says:

          I’m looking for something specifically on this blog and Snape’s method eliminates everything else. It’s a very efficient way to find out if and where a keyword or name has been discussed here.

          • gallopingcamel says:

            Greetings “Chick Bowdrie”. Too bad that Verity Jones is no longer blogging. I miss her and Lucia but Jeff Id is back at least part time.

          • Bindidon says:

            Chic Bowdrie

            “Im looking for something specifically on this blog…”

            My guess is that you heavily underestimate Google’s power.

            Let me give you an example.

            I recently wanted to know again why the solar radiation in that earth’s hemisphere hit by the sun has to be calculated with the square of the cosine of the angle of incidence of the radiation.

            I remembered that this was explained to me in this blog by a commentator nicknamed “Bart”.

            So I typed

            drroyspencer Bindidon Bart square cosine

            into Google’s search window and … ooops, here it is, it was the 2nd link that the machine suggested:

            http://www.drroyspencer.com/2019/01/chuck-todd-devotes-an-hour-to-attacking-a-strawman/#comment-338072

            Btw, the comment by Huffman below Bart’s was, to say the least, succulent.

          • Chic Bowdrie says:

            gallopingcamel,

            Yes, and I always enjoy your comments and perspective. Maybe you could do a guest post on WUWT or tallbloke’s talkshop sometime.

        • Chic Bowdrie says:

          Bindidon,

          Thanks for the help. This was my specific search goal. I recently discovered a blogger named Kevan Hashemi who wrote a series of posts on climate change. The last post was “Falsification of AGW.” https://tinyurl.com/v7xm567

          The series ended in 2016 with unresolved issues IMO. I was curious to see if there had been any comments by Hashemi or discussions involving him on this blog. My google search for drroyspencer and Hashemi turned up nothing on this blog.

          • Bindidon says:

            Chic Bowdrie

            Thanks in turn for the convenient reply, I’m happy to have helped a little bit.

      • Dr Roys Emergency Moderation Team says:

        Chic, try searching “site:drroyspencer.com keywords” in Google.

        So long as you remember the GPE and GHE are debunked.

  84. pochas94 says:

    ECS to what, again? CO2? Really!

    • bdgwx says:

      Unless otherwise stated ECS usually refers to the fast feedback global temperature response to a doubling of atmospheric CO2 concentration. Did I understand your question correctly?

      • pochas94 says:

        See gallopingcamel’s comment down thread “Richard Lindzen ranks..” Humidity in the radiating zone is variable (follows solar activity) and this will affect the emission height which will in turn affect surface temperatures. This among other things makes CO2 as the climate control knob a very naive theory and sensitivity calculations based on it of limited value.

        • bdgwx says:

          CO2 is not the climate control knob; only a climate control knob. But yes CO2’s modulation of the climate comes with feedbacks that are hard to quantify. The cloud feedback is one such hard to quantify feedback. Lindzen believes it be negative thus making the climate system more resistant to change. Others believe it to be positive thus making the climate system more susceptible to change.

  85. Scott R says:

    Congrats to the entire NH, which has just reached it’s average snow mass for the year 5 weeks early. This is just the beginning folks. We are about to change earth climate modes and drop. We are at the end of the 3.6 year cycle, the end of the 60 year cycle, the end of the 365 year solar cycle. Are you prepared? How does this snow mass fit into your w/meter sq calculation? hmm

    https://globalcryospherewatch.org/state_of_cryo/snow/fmi_swe_tracker.jpg

    • Bindidon says:

      As usual, Superalarmist and Coolista Scott R publishes scary material from some site best fitting to his narrative.

      Here is the material Scott R previously used but which, I guess, was no longer showing enough dramatic cooling: this is Rutgers Snow Cover Monthly Absolute Data for the Northern Hemisphere.

      https://climate.rutgers.edu/snowcover/files/moncov.nhland.txt

      Here are the numbers since January 2018:

      2018 01 46930123
      2018 02 46293160
      2018 03 41825151
      2018 04 32059447
      2018 05 18258591
      2018 06 7837764
      2018 07 3007503
      2018 08 2732578
      2018 09 6365338
      2018 10 20057853
      2018 11 37773625
      2018 12 44546889
      2019 01 47239378
      2019 02 46025445
      2019 03 39479635
      2019 04 29059873
      2019 05 17063208
      2019 06 5936217
      2019 07 2612904
      2019 08 2507846
      2019 09 5144589
      2019 10 22255876
      2019 11 37060191
      2019 12 43468543

      These number show absolute values in km2 (i.e. 43.47 Mkm2 for Dec 2019).

      For January 2020’s first week, Rutgers reports 44.85 Mkm2.

      Much more interesting is the remarkable stability of the departures wrt the mean of 1981-2010:

      https://drive.google.com/file/d/1NjHX1d5He9QY7r-woFjynd2i9n97weGO/view

      But while the trend for 1979-2019 is
      -0.004 +- 0.068 Mkm2 / decade (i.e. flat),

      the trend since 2010 is, as opposed Scott R’s alarmism,
      -0.528 +- 0.667 Mkm2 / decade.

      These trends are not statistically significant, as the standard error is higher than the trend. This due to the very high deviations from the mean, as you can see on the graph above.

      *
      But… the snow cover surface in the NH nonetheless is DECREASING.

      If the NH was cooling, the snow cover surface of course would increase.

      The fact that the snow cover’s MASS increases is very probably due to the fact that, unluckily for the Arctic, snow is becoming wetter and wetter due to the warmth around, and hence… becomes heavier.

      Warming alarmists aren’t helpful people, and Cooling alarmists aren’t either.

      • Scott R says:

        Bindidon,

        If I recall, I investigated that snow cover dataset and found some discrepancies when I compared it to NOAA. Definitely underreporting hmm.

        There are so many discrepancies in what you just said. So which is it? Does CO2 cause evaporation and increase the snow fall? Does CO2 cause heating and decrease the snow fall? It can’t be both. Or perhaps there is a cycle.

        Any trend you make between 1980 and present is still going to be positive. We were in the middle of an ice age scare at that time. This cooling isn’t going to happen overnight and magically erase a 40 year trend. It is a slow roll over just like every natural cycle on every time frame, with most likely the 2012 ice min the ultimate bottom.

        • Bindidon says:

          Scott R

          1. Did I mention CO2?

          2. Here is a preview of your ‘ultimate bottom’:

          https://drive.google.com/file/d/1whjK8qPkavJwDOwApRu0ExXk02cK2Aac/view

          In March 2012, all Coolistas thought ‘Wow! Now the Arctic sea ice extent will grow again for decades.’

          But in 2020 we see that in 2019 the ultimate bottom unexpectedly got a little scratch for the first time.

          • Scott R says:

            Bindidon,

            The average for your data isn’t accurate. It should not be a straight line.

            According to the arctic sea ice index the lowest number ever recorded for a month is August 2012, 3.57. October 2019 was 9.33. For your data set the 2012 line clearly held at -3 for an extended period of time, which definitely allowed for a maximum w per meter sq of sunlight to warm the earth rather then reflect back to space. So no, 2012 ice min is still there… 8 years running now that has held. I do find your data interesting in that it has a higher resolution than mine. Where can I download that to investigate it further?

          • Scott R says:

            I can’t seem to get woodfortrees links to post. But that is where I downloaded my data from.

          • Bindidon says:

            Scott R

            Sorry, but though being myself no more than a layman, I see that your reply reflects a knowledge below minimal novice level.

            Here is the graph for Arctic sea ice extent in absolute form:

            https://tinyurl.com/qs7k6ov

            The graph below

            https://tinyurl.com/wj7my6n

            represents exactly the same data, but in daily anomaly form.

            This means that all plots – the 1981-2010 mean of course included – represent the difference, day by day, between the absolute data and the climatology data, i.e. the 1981-2010 mean for the day.

            This means thus also, that the anomaly plot for the mean is a straight line at zero, as it represents for each day the subtraction from a value by itself.

            And sorry: in anomaly form, the lowest drop now belongs to 2019. This is totally irrelevant, but numbers are numbers.

          • Bindidon says:

            Scott R (ctnd)

            The data source for the Arctic & Antarctic sea ice extent graphs:

            ftp://sidads.colorado.edu/DATASETS/NOAA/G02135/north/daily/data/
            ftp://sidads.colorado.edu/DATASETS/NOAA/G02135/south/daily/data/

            In both directories you see
            – a climatology file containing for each year’s day the average for 1981-2010;
            – a file containing the daily absolute values.

          • Bindidon says:

            Scott R

            A final remark.

            The graphs shown above deal only with sea ice extent. There is unfortunately no daily data for sea ice area (i.e. 100 % pack ice, extent being >= 15 %).

            Such data is available only in SIDADS’ monthly time series:

            ftp://sidads.colorado.edu/DATASETS/NOAA/G02135/north/monthly/data/
            ftp://sidads.colorado.edu/DATASETS/NOAA/G02135/south/monthly/data/

            Anomaly construction is here somewhat more complicated: there is no climatology aka baseline available, you have to generate it by your own.

          • Scott R says:

            Ah I finally see what I missed. You are showing the departures, not absolute values. You said absolute values and then posted departures. I get it now. It is interesting, but it does not make for an actual ice min.

          • Bindidon says:

            Scott R

            You said absolute values and then posted departures.”

            Where?

          • Scott R says:

            Your initial reply:

            Here is the material Scott R previously used but which, I guess, was no longer showing enough dramatic cooling: this is Rutgers Snow Cover Monthly Absolute Data for the Northern Hemisphere.

          • Bindidon says:

            Scott R

            “Your initial reply”

            No.

            1. It was followed by

            “Much more interesting is the remarkable stability of the departures wrt the mean of 1981-2010″

            2. You then introduced sea ice in the discussion immediately after that.

            Please Scott R! You are wasting my time. I give up, it is too boring.

  86. Dan Pangburn says:

    Nate,
    Good job! (pointing out ,,plotting vs wavenumber gives a different peak position than plotting vs wavelength,,)

    I had not paid much attention be.cause actuals matched the BB curve thru the atmospheric window. Glad to hear that the NASA graph and Modtran are OK.

    But you still need to take a serious look at water vapor vs CO2.

  87. Snape says:

    @Chic Bowdrie

    You might be thinking of someone else. I use google and see what turns up.

    @Bindidon

    Something is not right with your chart. 2012 still holds the record for minimum sea ice extent:

    https://www.carbonbrief.org/wp-content/uploads/2019/09/Arctic-sea-ice-minimum-2019.png?_gl=1*2q9po5*_ga*YW1wLUZQYTF1Ml9CNzZzQ25KbHJXS2d1Tk1Id0dJUkUyeXZJSFZvbEZOMGFkMGM2MUZwZEVpNVYxOWJBUXozTFJrSE4.

  88. Snape says:

    @Bindidon

    Oh, your chart shows the greatest departure from normal, with 2019 being the new record.

    Very interesting!

    • Gordon Robertson says:

      snape…”your chart shows the greatest departure from normal, with 2019 being the new record”.

      Binny’s chart is a testament to how cold it gets in the Arctic winter. When the peak of summer strikes, there are still 4 million square kilometres of ice left on the Arctic Ocean and there is no mention of how thick it is.

      Tell Binny you could fit the area of Germany into that ice extent 10 times.

      A couple of months after the September peak shown on the graph, the entire Arctic Ocean will be frozen to a depth of 10 feet.

      Why are alarmists clinging so desperately to the Arctic Sea Ice extent? It means nothing.

    • Bindidon says:

      Snape

      “… with 2019 being the new record.”

      One more time, the blog’s scanner shows its strange behavior.

      Here is the reply:

      https://drive.google.com/file/d/1P2RSDP_Bp1gidoTEOXxR_wPFrGobk9wu/view?usp=sharing

      • Scott R says:

        Folks the sea ice departure in October is not going to make a large difference to the total energy received vs reflected in the arctic. You already have the polar night starting by then. The absolute minimums are reached earlier in August / September when the sun is still up, and that has not made a new low since 2012. April – Mid September is what we need to study.

  89. bill hunter says:

    Svante says: “Aha, the liberal leftist CO2 molecule is disregarding poor people.”

    I don’t think its the CO2 molecule the poor need to worry about.

  90. Bindidon says:

    For those who speak about everything but know nothing, here is data about the Arctic sea ice volume:

    polarportal.dk/fileadmin/polarportal/sea/CICE_curve_thick_LA_EN_20200130.png

    This is DMI’s variant; PIOMAS by wash.edu shows much lower volume data compared with the Danish people’s data.

    • Gordon Robertson says:

      binny…”here is data about the Arctic sea ice volume:”

      More humour from Binny. Here is a disclaimer from the same site:

      “The data is based on DMIs model calculations”.

      Since when does ‘model calculations’ become ‘data’.

      • bdgwx says:

        Even something as trivial as a common thermocouple requires a model to derive a meaningful temperature. Why the fuss?

        • Bindidon says:

          bdgwx

          Don’t loose your time with this guy, he doesn’t even understand that the ‘coolest’ surface timeseries evah – WeatherBELL’s –

          – (1) is not based on data, but on the reanalysis of data
          and that
          – (2) this reanalysis is itself based on a complex model.

          The very best is that such a pretentious and ignorant guy manages to discredit model-based evaluations in comments he posts on the blog of a scientist who himself uses models:

          http://www.drroyspencer.com/2020/01/weak-el-nino-conditions-help-explain-recent-global-warmth/

          • Gordon Robertson says:

            binny…”The very best is that such a pretentious and ignorant guy manages to discredit model-based evaluations in comments he posts on the blog of a scientist who himself uses models:”

            Roy plays with models for entertainment value…nothing wrong with that. In his real job, he works with real data from real satellites, and his partner, John Christy, does not shy away from saying what he thinks of climate models.

            If Roy is such a model afficiondo, why is it the alarmists modelers. who largely run climate peer review now, are always out to get him?

            They use models in meteorology, but any meteorologist worth his salt will tell you that weather forecasting is a good part guessing based on previous experience. They have gotten pretty good at it but they have decades of real data to play with, not to mention real scenarios to lean back on.

          • bdgwx says:

            Speaking of Spencer and Christy’s real job…a model is required derive UAH temperatures. No model…no UAH dataset.

          • E. Swanson says:

            Gordo, as bdgwx noted, the UCH products from Christy, et al. are the result of several models. The first (MT, TP and LS) is based on a model of the thermal emissions of O2 molecules from the surface to TOA, (the same sort of model which it the basis for the theory of the GHE, BTW). The second (LT) is based on a model which combines the MT, the TP and the LS, a process which includes a model of the atmosphere. There are also the models used to compensate for orbit decay, change in LEC time for each satellite and changes in warm target temperatures within the instruments.

            You don’t want models? Then stop posting comments extolling the virtues of those UAH products.

          • Bindidon says:

            Robertson the ignorant boaster

            “In his real job, he works with real data from real satellites, and his partner, John Christy, does not shy away from saying what he thinks of climate models.”

            Ha ha ha haa…

            C’est vraiment la meilleure blague depuis longtemps.

            That you are loosing your time in writing hundreds of lines of rubbish each day: that does not interest anybody here, Robertson.

            What is terrifying is the time all other people loose in replying to your tremendous rubbish.

            This blog was so pretty good during your absence…

        • Gordon Robertson says:

          bdg…”Even something as trivial as a common thermocouple requires a model to derive a meaningful temperature. Why the fuss?”

          I fail to see what a real, physical thermocouple has to do with a virtual model. You could model a thermocouple in a computer program but it would have no reality till you got two dissimilar metals and welded them together just right.

      • Dr Roys Emergency Moderation Team says:

        bdgwx, E. Swanson, please stop trolling.

  91. Snape says:

    [One note about water vaporit is a condensing gas whereas CO2 is noncondensing. So while H2Os radiative effect is strong it is also being regulated by the condensing action which is itself regulated by the temperature.]

    *******

    Is it possible for a warming event, like an el nino, to trigger a runaway feedback loop?

    a) An increase in SST warms the lower troposphere.
    b) a warmer LT allows for an increase in water vapor.
    c) more water vapor increases the GHE, making SST and LT warmer still.
    d) water vapor continues to increase.

    ******

    My answer is no, because the strength and speed of the feedback loop is not strong enough to prevent the global SST from falling back to neutral or colder once the el nino has run its course.

    At which point the process is reversed.

    • bdgwx says:

      But because it is a condensing gas it will either precipitate out reducing the concentration or form clouds which can increase albedo. But yeah, the fact that countless El Ninos, hyperactive tropical cyclone seasons, and whatever it does not appear that Earth ever experienced a runaway water vapor feedback despite having a billion years of opportunity.

  92. Scott R says:

    Bindidon,

    Your daily departure arctic ice record in mid October… It was -30 C on the Greenland ice sheet at that time. Just an FYI.

    The southern most tip of Greenland was also averaging below freezing conditions by October…

    So again, the absolute ice min is what we need to look at, and from April – mid September, and that has not made a new low since 2012.

    • Bindidon says:

      Scott R

      Stop talking about little parts of the problem all the time.
      What is Greenland compared with the entire Arctic above 60N?

      It is the same mistake as if you would compare the Globe with these little 2 % of it named CONUS.

      • Gordon Robertson says:

        binny…”Stop talking about little parts of the problem all the time”.

        Scott was talking about fact, in the Arctic winter it freezes to -50C and 10 feet of ice form on the Arctic Ocean. That’s a major part of the problem for you alarmists, but typically, as an alarmist, you claim it to be a ‘little part’.

        You alarmists are creating a non-issue over essentially one months of Arctic summer. The rest of the year it is frozen solid.

  93. Snape says:

    @Scott

    Your albedo argument also applies to snow. Snow cover in the months surrounding the summer solstice reflects much more sunlight that during fall or winter. With that in mind:

    https://climate.rutgers.edu/snowcover/chart_anom.php?ui_set=1&ui_region=nhland&ui_month=6

  94. Snape says:

    @bdgwx

    Ignoring clouds, my point is that there would in fact be a runaway warming if the el nino persisted. The feedback to warming is more water vapor. The feedback to more water vapor is warming.

    Nothing to make it precipitate out.

    • Dan Pangburn says:

      Sna,
      There is not enough feedback for runaway. At most, FB with compounding is only about 7.37%/K. Sect 7 at https://watervaporandwarming.blogspot.com If el nino persisted there would be an associated temperature rise but no runaway.

      • Gordon Robertson says:

        dan…”If el nino persisted there would be an associated temperature rise but no runaway”.

        In that case, other parts of the planet would have to cool in order to balance the energy. EN draws its heat from somewhere and the heat is ultimately from the Sun.

        We may still be warming from the Little Ice Age and any apparent heating from EN would have to be explained by such an event. In any case, as you claimed, there would be no runaway effect.

  95. Dan Pangburn says:

    Nate,
    I usually find stuff at PSI not credible.

    • Dr Roys Emergency Moderation Team says:

      https://principia-scientific.org/greenplate-effect-it-does-not-happen-proof-no-2/

      GPE experimentally debunked again. Try it yourself.

      • E. Swanson says:

        DRsEMT re-appears out of the dark web, posting a link to another experiment by Geraint Hughes. Don’t know why it took DRsEMT so long to post this, but now that the comments are closed, I can’t add anything there, so I’ll post my reply here.

        First, none of Hughes’ runs attain steady state, as is obvious from his graphs, all of which show temperatures increasing at the ends of his 10 minute runs. He should be testing steady state temperature, not change from ambient.

        Secondly, he again claims that all the air is removed from his chamber, based on the reading of his mechanical gauge. It’s well known that a mechanical gauge does not indicate whether there is any air left in the chamber. He should have used an electronic gauge, many of which are now available as tools for the HVAC business. Even a small amount of air within the chamber will produce a strong convective flow, given that his 100 watt bulb is located below the plate(s) and will become quite hot.

        Third, Hughes wrote:

        I have also changed the light bulb, from a 40 watt spiral bulb, to a 100 watt Bulb with built in reflector, this ensures that all the energy is directed upwards towards the plate & as it has a higher rating it is achieves higher steady state temperatures and achieves much quicker warming phases.

        Only a small portion of the energy from the bulb is thermal EM radiation, the rest may be transferred to any remaining air within the chamber without a vacuum. Were the bulb to be completely surrounded by a high vacuum, I doubt that it would survive very long, as the filament would be likely to fail. In any event the radiant energy from the sides of the bulb would also heat the glass cylinder which exhibits high emissivity. Hughes gives no data for the surface temperature of the cylinder, which defines the environment within which the test(s) are conducted.

        In short, his tests do not disprove the Green Plate Effect.

        • E. Swanson says:

          DRsEMT, And another point which demonstrates Hughes’ experimental failure. His temperature measuring probe has a rather long tube and Hughes simply drops it into a pipe fitting glued to the top of his first plate (time 11:41) and the probe “wobble” indicating a poor contact (22:48). As a result, there’s only a small contact between the tip of the probe and the plate, along with another contact point on the edge of the hole thru the fitting. Then the probe appears to be touching the side of the hole in the upper plate (44:37). As a result, his probe can not be said to be providing an accurate measure of the temperature of the lower plate, as the tube is exposed over most of it’s length to the thermal IR EM from the tube, etc.

          In my Green Plate Demos, my thermocouples were placed within 1/8″ holes in the 1/4″ thick plates, which I think provided a much better measure of the plates’ temperatures. Hughes doesn’t understand what he is doing, IMHO.

          • Dr Roys Emergency Moderation Team says:

            He wasn’t overly impressed by your experiments either.

            Complain all you like. It’s all been covered, and only your desperation remains.

          • E. Swanson says:

            DRsEMT, Since Hughes rather obviously has no clue what he’s doing, his rejection of my GPE demo is of no concern to me. To be sure, his experiments took some effort, but that in no way excuses him for his basic failure(s). That he immediately jumps to the conclusion that there’s no GHE from his half-ass experiment says to me that he had already decided the results before doing his work.

            I notice that you didn’t address any part of my critique in your reply, as is your usual response when backed into a corner.

          • Dr Roys Emergency Moderation Team says:

            No corners, all already addressed in comments at both articles. You lost.

          • E. Swanson says:

            DRsEMT claims that my critique is addressed in the comments for Hughes’ post. The only comment I found is that from Hughes in which he repeats his claim that I am a liar because my plates did not exhibit some cooling when the vacuum is applied. Of course, as I noted above, his device likely does not accurately measure the temperature of the lower plate, given the poor thermal connection between his plate and his temperature probe. That the gas remaining in the enclosure would cool as the vacuum is applied is well known and that cooling would also be sensed by the long probe tube, the walls of the cylinder and, yes, the lower plate.

            Take another look at the graph in my demo. When the pump is switched on, there is a slight pause in the rate of warming of the Green plate and an even stronger plateau in the graph of the bell jar temperature. Hughes is flat out wrong, just as he is in his claim that he has disproved the GPE.

          • Dr Roys Emergency Moderation Team says:

            “DRsEMT claims that my critique is addressed in the comments for Hughes’ post.”

            Posts. Two posts, two sets of comments.

            Now quit your whining and get over yourself.

          • E. Swanson says:

            DRsEMT, Answer my critique if you want to be believed. As for whether my comments have been addressed, you might. at least. post a link or maybe even a quote, instead of expecting me to read thru a hundred or so mostly off topic comments to look for that killer gem which debunks my demo.

            DRsEMT, please stop trolling, as you-know-who used to say…

          • Dr Roys Emergency Moderation Team says:

            If you were honest, you wouldn’t have written already debunked “critiques” in the first place.

            Quit your whining, get over yourself and please stop trolling. You really are relentless.

          • E. Swanson says:

            DRsEMT, Given the possibility that AGW may be an existential threat to much of the world’s biomass and the great difficulty of changing our present path, I think that being relentless is warranted.

            You are just as “relentless”, as you repeat your undocumented claim that my criticisms have been “debunked”. In science (as opposed to politics), there’s no debate without the presentation of the facts. Go back to your cave TROLL.

          • Dr Roys Emergency Moderation Team says:

            Quit your whining, get over yourself and please stop trolling.

          • E. Swanson says:

            DRsEMT, You first.

          • Dr Roys Emergency Moderation Team says:

            Kids these days.

      • Dan Pangburn says:

        Nate,
        This is an example of nonsense on PSI. It is an experiment by someone who does not understand how heat transfer works, especially the concept of view factor when considering radiation. Misunderstanding the results is an example of confirmation bias. The GHE is obvious to anyone competent in engineering heat-transfer analysis.

    • Dr Roys Emergency Moderation Team says:

      …and here is the first one. Be sure to read through all the comments at both links.

      https://principia-scientific.org/greenplate-effect-it-doesnt-happen/

      GPE experimentally debunked.

  96. Bindidon says:

    It’s a bit late now at UTC+1; tomorrow I’ll generate, out of data till Dec 2019, two time series out of the raw GHCN daily:
    – one for the Globe,
    – one for the Arctic above 60N

    – together with the two corresponding land time series of UAH6.0 LT.

    The comparison of the two comparisons of station data vs. lower (or better: mid) troposphere is interesting.

  97. Snape says:

    @Dan

    I cant tell from your link why you think I am wrong about the runaway feedback, but I do see a potential flaw in my reasoning.

    Start with an LT temperature increase of 2.0 C. What if the resulting increase in WV only produced 1.0 C of warming?

    The extra 1.0 C would again increase WV, but this time only enough to produce 0.5 C warming….. and so on.

    Diminishing returns.

    ******

    Comments?

    • Gordon Robertson says:

      snape…re Dan…”I cant tell from your link why you think I am wrong about the runaway feedback, but I do see a potential flaw in my reasoning”.

      A runaway feedback requires an amplifier (gain) to operate.

      The notion that back-radiation from CO2 could in any way raise the surface temperature should have been caught early in its pronouncement. It not only contradicts the second law, the raising of the surface temperature to produce heat beyond its natural temperature from solar heating is a blatant case of perpetual motion.

      With regard to EN, you cannot amplify heat from within a system unless you provide a means of amplification, like some sort of heater rigged so that some kind of feedback can trigger it. You are creating energy from nothing otherwise.

      • E. Swanson says:

        Gordo continues to spout his deviant physics. “Feedback” doesn’t require an “amplifier”, just a source of power controlled by some feedback process. Change the process and the system will change accordingly.

        Adding insulation to a structure with a constant source of input power will increase the temperature within. There’s no violation of the 2nd Law, just physics. Still don’t believe me? Take two foam coolers which can be nested together. Paint the inside of one black and add a cover plate which allows the transmission of visible SE EM, such as glass or plastic. Add a device to measure temperature. Place it out in sunlight and record it’s maximum temperature. Now, place the first cooler in the second and place it back in direct sunlight again. Even yu could do that. Tell us what happens to the temperature.

        • Gordon Robertson says:

          swannie…”Feedback doesnt require an amplifier, just a source of power controlled by some feedback process. Change the process and the system will change accordingly”.

          Negative feedback does not require an amplifier. It is used in audio amplifiers to dissipate stronger audio frequencies on a per frequency basis. We are talking about positive feedback which, by definition, has a gain component in it.

          G = A/(1-AB)

          G = overall ‘signal’ gain
          A = Amplifier gain
          B = feedback signal.

          If the sign of AB is negative, because the feedback signal has a negative (out of phase) sign, then 1 – AB is larger than 1 and G becomes less than 1. Since an amplifier cannot de-amplify (it’s maximum gain is 1 in a cathode follower) the negative feedback indicated occurs in processes which are natural.

          On the other hand if AB is positive and not equal to or greater than 1, the overall signal gain, G, is greater than 1 and more importantly, it increases with each cycle. That’s why positive feedback systems are inherently unstable.

          They can be controlled, as in electronic oscillators, but uncontrolled, they runaway. In an electron circuit, the runaway is controlled by the power supply since it can only supply so much current. With natural resonant phenomena like on the Tacoma-Narrows bridge incident, the positive feedback induced gain eventually destroyed the bridge.

          Such natural resonance involving vibrating members (support cable) is about the only positive feedback that comes to mind that does not require an amplifier. However, resonance is known to be a natural amplifier so it did have an amplifier. There is no such resonant systems in the atmosphere, nor is there an amplifier. I mean, what could amplify heat in the atmosphere with the result that the atmosphere gets hotter as a unit?

          The process by which GHGs supposedly cause a positive feedback is sheer pseudo-science. There are two reasons for my statement:

          1)heat cannot be transferred from GHGs to the surface in such a manner as to raise the temperature of the surface to a temperature higher than it is warmed by solar energy (2nd law)

          2)a process in which a warmer body, the surface, heats GHGs in the atmosphere, then has its temperature raised by GHGs sending energy back to it, is a case of perpetual motion. The only way that could happen is if the GHGs are at a higher temperature than the surface. Even at that, it would be debatable as to whether GHGs, making up 0.31% of the atmosphere, would have the required energy to do that.

          • E. Swanson says:

            Gordo, as is his usual approach, assumes that the term “feedback” requires an amplifier, as indicated from his equation. He continues with all sorts of claims based on his assumption that his mathematical model describes the processes which govern the flow of energy into and out of the atmosphere. His apparent complete lack of understanding of those processes leads to his conclusion that these processes violate the 2nd Law and would be a case of perpetual motion or lead to a runaway temperature catastrophe, both of which are flat out wrong.

            Hint: If you don’t do your homework, you will get the wrong answer.

      • Dan Pangburn says:

        GR,
        There is no contradiction of the second law. It is just the way radiation heat transfer works. Perhaps it would be more acceptable to you to perceive it as radiation at wavelengths from the lower temperature cancel radiation of the same wavelengths from the higher temperature. Net energy flow is still from warmer to cooler as the second law dictates.

        The surface/ground gets heated by the sun and gets warmer when you slow its means of cooling. The means of cooling is reduced because of increased shielding (from increased WV) from the cosmic background temperature of about 2.7 K.

        Amplification is intrinsic in the positive slope of the water/vapor saturation vs temperature curve. Runaway does not occur under normal conditions because the effective gain is low. Temporary local conditions can produce temporary high gain with temporary runaway. This is exhibited as el ninos.

        • Gordon Robertson says:

          Dan…”There is no contradiction of the second law. It is just the way radiation heat transfer works. Perhaps it would be more acceptable to you to perceive it as radiation at wavelengths from the lower temperature cancel radiation of the same wavelengths from the higher temperature. Net energy flow is still from warmer to cooler as the second law dictates”.

          It’s a pretty complex problem, Dan, from several angles. In the first place, Clausius stated clearly in his works that radiative heat transfer must obey the 2nd law which he stated succinctly as follows: Heat can never be transferred ‘by its own means’ from a colder body to a warmer body.

          I italicized the phrase ‘by it’s own means’ because he followed with an in-depth explanation of what that meant. In essence, he meant that a process in which heat flowed from cold to hot required immediate compensation, which cannot occur spontaneously.

          At no time did he mention a net energy balance but of course he was not privy at the time to how electromagnetic energy is related to electrons moving between energy levels in atoms.

          From what we know about EM today, you simply cannot cancel one wave of EM with another. I think the reason is clear, EM has no mass and no means of interfering in such a manner. If you run visible EM through adjacent slits and focus it on a target, the EM will add and subtract at the target to produce light and shadow. As far as I know, that does not apply to IR. That interference is due to phase differences in the frequencies of various EM elements but that interference cannot take place in mid air as far as I know.

          There is confusion in the Clausius discussion on radiation because in his day, and even into the days of Planck into the 20th century, there was a belief that heat could flow through space. Planck referred to that as heat rays and Clausius inferred that as well. Subsequently, many modernists tend to think as EM as rays of heat whereas EM contains no heat. Heat is not a property of EM since heat requires matter.

          The Stefan-Boltmann equation suffers from the same belief system. The S-B equation is suggesting that EM radiated by a body of temperature T can be measured in watts/m^2. However, the watt is a measure of mechanical energy (force over a distance) which has a heat equivalent in calories. However, there is no equivalence between EM and the watt. EM has a potential to induce work in a body which absorbs it but as EM it can do no work.

          The phenomenon to which you refer takes place only at thermal equilibrium. The theory goes that at equilibrium, there ‘should’ be an averaging of energy in the atoms in either body so that a so-called net energy balance occurs between the bodies. Furthermore, that theory applies to blackbodies only, a la Kircheoff.

          Quantum theory, as formulated by Bohr initially, circa 1913, and formulated by Schrodinger in his famous equation, circa 1925, is based on the sole electron in a hydrogen atom orbiting the nucleus which has a single proton. Schrodinger used the calculated attraction between the electron and the proton and the angular momentum in a Bohr orbit in his equation. The many possible results of the equation described a variance in orbital diameters in which the electron could abide, measured in electron-volts.

          Bohr had already hypothesized in 1913 that electrons had to occupy certain quantum levels and if they moved from a higher level to a lower level they emitted a quantum of EM. Conversely, if they absorbed a quantum of EM with sufficient intensity and frequency it would cause the electron to jump to the next higher quantum level.

          That explains why heat cannot be transferred by its own means from a colder body to a hotter body via radiation while respecting the 2nd law. The colder body simply cannot radiate EM with enough intensity at the proper frequency to elevate the electron to the next level.

          Each electron has a certain frequency in each orbital level corresponding to a certain kinetic energy. The frequency is dependent on the velocity of the electron through an orbit and the KE is dependent on the electron’s mass and velocity. That KE translates to heat. So, if an electron absorbs a quantum of EM and jumps to a higher quantum level, the resultant of all electrons in a mass doing the same corresponds to an increase in heat of the entire mass.

          This explain why radiation from a cooler source cannot increase temperature of a hotter body. The EM simply lacks the frequency and the intensity to raise the electron to a higher quantum level. A balance of energy has no place in the process, EM from a colder body is simply ignored by electrons in a hotter body just as certain frequencies in an electron circuit are ignored by filters with a specific pole frequency. And why antennas of certain lengths ignore EM whose wavelength/frequency does not correspond.

          • Dan Pangburn says:

            GR,
            That was a nice history lesson but I cannot tell whether you did not read what I wrote or simply do not grasp it.

            Both what I said ,, Net energy flow is still from warmer to cooler as the second law dictates.,, and what you said ,, radiation from a cooler source cannot increase temperature of a hotter body,, are correct.

            Take the blinders off and read it again.
            It does NOT say that cooler bodies heat warmer bodies.
            It does say that a body with a heat source will get warmer if shielded from a colder heat sink.

            It is why you put a coat on when it is cold out and why the GHE works.

            This is simple, basic stuff in engineering heat transfer analysis.

          • Dr Roys Emergency Moderation Team says:

            Dan Pangburn, please stop trolling.

          • Midas says:

            DREMT,

            So now you’re attacking one of your fellow AGW deniers.

          • Dr Roys Emergency Moderation Team says:

            Nothing “fellow” about somebody defending the GHE.

    • Dan Pangburn says:

      Snape,
      That is the idea, diminishing returns. It happens way faster though because the increase of each step is never more than 7.37% and it poops out in three steps. That is what I am trying to get across in Section 7.

  98. Gordon Robertson says:

    NOAA is out-doing themselves with new jargon. Now we have atmospheric rivers.

    https://www.msn.com/en-ca/weather/topstories/atmospheric-river-hits-b-c-coast-what-it-is-and-what-does-it-mean/ar-BBZwWUI?ocid=hplocalnews

    On the ‘Wet’ Coast of Canada, in Vancouver, we have become expert with rainy weather. As a child, and as an adult, I played soccer on fields that were so water-logged that small lakes had formed on many parts of the field. On at least one occasion, there was more water ‘on’ the field, as small lakes, than there was green grass.

    The parks poobahs no longer allowed kids to enjoy this sort of experience since games are banned on parks in December and January. The eco-weenies, many of whom use children as a ploy to press their pseudo-science about catastrophic global warming, are stopping the same kids from enjoying playing soccer in wet weather.

    Of course, the same eco-weenies will amplify NOAA’s jargon about atmospheric rivers and blame it on climate change. Rubbish, I snort. We have always had such rain storms in this part of the world.

    It’s weather.

  99. gallopingcamel says:

    @bdgwx said:
    “GC, FWIW I dont necessarily buy into the high sensitivity estimates like those from Hansen and others. Im more of a middle-of-the-road advocate at least right now. Im very open to debate on the precise sensitivity though. My position can certainly be moved on this matter.”

    Well said! In an attempt to lower the rhetorical temperature I will try to stick to facts and figures henceforth.

    • Gordon Robertson says:

      cam…” In an attempt to lower the rhetorical temperature I will try to stick to facts and figures henceforth”.

      How would that go over in the rugby clubhouse? ☺ They have already branded you galloping camel, how do you think they’d receive you speaking like a ponce? ☺ ☺ I’m sure you be fined at the next trial.

      I do get your point about emotion but I don’t feel this arena should be emotion-free, at least not all of the time. This pseudo-science about catastrophic global warming/climate change is a threat to our way of life. Alarmists are playing dirty, some of them branding innocents as deniers and suggesting sanctions against them.

      Look at the circus going on in Washington with this impeachment farce. I do not support the policies of Trump in general yet I find myself sympathizing with him re the on-going attempts by Democrats to remove him from office for fear they won’t be able to beat him in 2020. As legal scholar Dershowitz has claimed, he has done nothing impeachable.

      Those same Democrats are the idiots behind climate alarm and it behooves me to keep emotions in check when I see idiots like Adam Schiff and Nancy Pelosi usurping democracy for political means. Do you seriously think they won’t use the same tactics against skeptics if they get into power?

      We have people in this blog who refuse to answer a scientific post without preceding it with an ad hom or trying to diminish the status of the poster. Perhaps we could endeavour to omit the crud and just post our thoughts on science.

  100. gallopingcamel says:

    Chic Bowdrie said:
    “gallopingcamel,
    Yes, and I always enjoy your comments and perspective. Maybe you could do a guest post on WUWT or tallblokes talkshop sometime.”

    My esteemed colleagues Nicola Scafetta and Robert G. Brown were featured on WUWT. In some ways they were treated unfairly (especially Nicola) and that dampened my enthusiasm.

    Tallbloke has been wonderful to work with. For example he guest posted my lunar model in three parts. In the event that my paper on replicating Hansen’s “Figure 7(a)” gets published, Tallbloke and Dr. Roy will be the first people to contact.

  101. Bindidon says:

    gallopingcamel

    “In some ways they were treated unfairly (especially Nicola)…”

    Are you serious?

    Scafetta treated unfairly? AT WUWT? By whom please?

    Did you never read the agressive, impolite, insulting ‘comments’ written at WUWT against Nick Stokes or Steven Mosher, by lots of incompetent cowards, mostly behind a nickname?

    PM, I use a pseudonym, but I don’t insult people behind this pseudonym, unless these people insulted me before, as happened many many times on this blog. Then of course I insult back.

  102. Bindidon says:

    For all the people in CONUS who believe the Globe cools down: we enjoy here in Germany for the third time in sequence an incredibly warm winter, with temperatures currently 10 C above mean.

    Here you see what we might have called an ‘average’ winter in Northeastern Germany (2009-2010):

    – max: https://tinyurl.com/udsr-psn (drop the hyphen)
    – min: https://tinyurl.com/v8f3nhd

    And here you see what we have right now (2019-2020):

    – max: https://tinyurl.com/tk27xnt
    – min: https://tinyurl.com/ugaojbw

    Of course we enjoy this, I don’t need snow cover anymore (the last one was… in 2010). But of course we pay this back with much rain and lots of westerly winds from the Atlantic, previously unknown to us.

    Great nonetheless to be bothered neither by cold blasts nor by bushfires!

  103. Gordon Robertson says:

    swannie…”the UCH products from Christy, et al. are the result of several models”

    You fail to understand the difference between a computer model and a computer program used to analyze real data. The former is created from hypotheses implemented as differential equations while the latter uses real data from real satellites.

    There is a difficulty with the sats in the they use receivers that receive real microwave frequencies over a broad band in the microwave range. So, they break the frequency band into more than 15 bands with each receiver tuned to a central frequency in each band. The received data from each receiver has to be weighted to account for over-lapping bands in the spectrum.

    This is typical of receivers in electronic communications. They don’t receive frequencies in square blocks of frequencies, or channels, they are tuned to a central frequency and the gain falls off either side. It the same principle as employed with equalizers for sound, or filters.

    • Gordon Robertson says:

      With such a system using adjacent receivers, part of the signal for one channel leaks into the other and that has to be accounted for. Furthermore, it is not possible to zero in on a group of oxygen molecules radiating in the microwave band so a means had to be found to separate frequencies by altitude. If anything, UAH uses averaging and weighting algorithms to analyze real data.

      This is testament to the effect of gravity on O2 molecules that such molecules radiating at a certain altitudes radiate at a frequency based on the signature temperature of that altitude.

      This has nothing to do with modelling, it’s about analyzing existing and very real data from very real physical sources. Climate models, on the other hand, are not based on real data but on the synthesizing of data (virtual data) based on the particular physics programmed into the program, right or wrong.

      Furthermore, climate modelers have phenomena to observe after the fact. They do not predict future climate based on observation because that is not possible. They create their programs based entirely on theories proposed by the modelers UAH telemtry on the other hand does observe data directly.

      • E. Swanson says:

        Gordo, While I’m not an electrical engineer, I think I understand bandwidth. The MSU receivers have a band width of 220 MHz, while the channels are separated by a much wider range. For example, the four channel frequency are (1-4): 50.30, 53.74, 54.96, 57.95 (GHz). thus, the channel separation is: 1-2 = 3.44 GHz, 2-3 = 1.22 GHz and 3-4 = 2.99 GHz. Note also that channels 1 and 2 use a different feed horn from 3 and 4. the original TLT used only channel 2. From these facts, I think your comment is plain wrong.

    • Gordon Robertson says:

      btw…would you classify a mercury thermometer as a model? I would not, they are real physical devices that indicate the human invention of temperature based on the expansion of mercury in a column when it is heated.

      You can’t even call a thermometer a proxy for temperature in the same way tree rings are used as a proxy for the average heat in an area at a particular time.

      However, with thermometers, only two readings are taken a day and the high and low averaged. So, for one thermometer in one region the temperature for that day is already skewed as an approximation. When all temperatures are processed in a database for a region, by an outfit like NOAA, many thermometer readings are discarded and temperatures for some regions are synthesized in a model based on temperatures recorded in stations up to 1200 miles away.

      It should be noted that NOAA has discarded nearly 90% of its thermometer sources since 1990 and replaced them with synthesized temperatures from a model.

      With such nefarious practices in place, why would you complain about the far more scientific practices of UAH?

  104. gallopingcamel says:

    The main point of this post is that Dr. Roy finds that while energy transfer into the oceans is not known with precision, the data is consistent with the lower end of the IPCC’s claims for the sensitivity constant.

    The IPCC suggests a sensitivity constant ranging from 1.5-4.5 K/doubling of [CO2].

    In my opinion Dr. Roy is trending in the right direction but I hope to show that the effect is more likely to be at least an order of magnitude smaller. Of course this “proof” will be based on models. How many of you trust models?

  105. Gordon Robertson says:

    bdg…”A model is required to map voltage to a temperature. No modelno temperature measurement”.

    Then you’re claiming that a digital voltmeter that can measure temperature directly via probes is nothing more than a model? I fear you are caught in a conceptual, theoretic world. I prefer the actual physical world where processes occur in real time totally bereft of models.

    I can create a computer model to emulate the effect of heat on water, for example. Or mercury. But, first, I need to have the results from real experiments to create my model. I have to know the relationship between heat and the expansion of mercury, for example. I can even validate the model by observing real mercurty expanding with the application of X calories of heat.

    BTW…temperature itself is based on a concept. Only humans care about temperature for which we developed a scale based on the freezing and boiling points of water. Temperature is a measure of the effect heat has on water at standard temperature and pressure.

    • bdgwx says:

      A model is a set of heuristics, equations, and/or algorithms that accept input to produce output. They can be simple or complex, but do not necessarily need to be executed by a computer though that would obviously be more convenient especially for complex models. For a thermocouple there needs to be a model that relates materials and voltage to a temperature. For satellites there needs to be a model that relates microwave emissions to a temperature. Further still that model must consider things like orbital drift, channel weighting, and many other items to produce an accurate global mean temperature.

      • Gordon Robertson says:

        bdg…”A model is a set of heuristics, equations, and/or algorithms that accept input to produce output”.

        Yes…and they are virtual, not real. They are mathematical calculations. The reality is represented by the O2 molecules, the microwave EM the emit, and the satellite telemetry that detects and measures the EM. No model required.

        “For satellites there needs to be a model that relates microwave emissions to a temperature”.

        Only if you are trying to model the atmosphere in a computer program. In a lab, in a real life situation, you point a microwave detector/receiver at oxygen molecules and measure the microwave EM frequencies given off.

        I have studied in the field of electronics most of my life and applied it. I have never found the need to model anything. While studying, in our labs, we had no need of models. We set up the real, physical devices in a circuit and measured voltage, current, and frequency directly.

        You mathematicians have to understand that a real world exists outside of your equations. Reminds of an engineering student while I was studying at university. He had become so used to to seeing mathematical equations representing electrical circuits that he had not realized the L in L.di/dt was actually a physical device…an inductor, a coil. I don’t know what he had expected the i in di to flow through.

  106. Roy, do you remember my post to you a month or so ago, where I pointed out the statement in the Feb 2018 upgraded AR5 WGI (science basis) at: https://www.ipcc.ch/site/assets/uploads/2018/02/WG1AR5_Chapter08_FINAL.pdf and the FAQ 8.1 where the IPCC declares that water vapor is [at least] three or four times a stronger greenhouse gas than CO2.

    However, for CO2 to remain the “bad guy” the IPCC had to give CO2 the task of turning the “climate knob” by insisting that global climate would be considerably colder without this role given to CO2 (utter nonsense, if I may say so).

    My point in the entire climate debate is based on geology, where the present climate debate should be discarded and all scientific effort redirected to study what caused the previous millennial sequences of alternating changes in weather.

    Earth received its oceans some 3 billion years ago when the young Earth had cooled enough for water vapor to condense. Furthermore, the CO2 rich atmosphere was just waiting for hot brines to form complex molecules with the help of the Sun. Obviously the next step in the evolution was the initiation of photosynthesis where simple “cyanobacteria” got the idea to multiply (grow) by using CO2 and H2O and as a result expelling oxygen. This changed the anaerobic environment to an aerobic atmosphere that has prevailed ever since.

    During countless millennia our water planet saw new life forms develop from very simple cells to complex plants and animals. Earth’s climate has been conducive to the development of new life forms all relying on a climate where H2O is in liquid form. It is fantastic that a suitable climate has persisted on Earth despite tumultuous perturbations from extra-terrestrial bombardment by various celestial meteorites, comets, asteroids, etc, and even very destructive earthquakes and massive volcanic eruptions.

    My view as a geologist is that the carbon dioxide rich early atmosphere paved the road for complex life forms we see today; all dependant on an atmosphere of water vapor, nitrogen, oxygen and some trace gases including CO2. However, the view propagated by the IPCC that the continuos anthropogenic use of fossil fuels will raise atmospheric CO2 concentration to a dangerous level because of the assumed “strong” greenhouse gas role given to CO2.

    So what is a dangerous level? When I went to school the average CO2 concentration was on average 0.03%. Today it has risen to 0.04% probably mainly due to a slightly warmed climate following the end of the Little Ice Age. I can also accept that part of the rise can be due to accelerated use of fossil fuels.

    The 25% rise in atmospheric CO2 is clearly seen in satellite imagery as a landscape greening in many parts of the World. This is a clear indication that plants have benefitted from the increase in CO2. This phenomon is well known by farmers and the reason is that the majority of plants we see growing today are from times with a much higher natural atmospheric CO2.

    • bdgwx says:

      H2O has limited ability to catalyze temperature changes on its own. Something else needs to catalyze a temperature change before it can amplify the change. CO2, however, can catalyze temperature changes on its own.

      CO2’s greenhouse gas role is not assumed. It is based on the abundance of evidence spanning 170 years and many disciplines of science.

      If CO2 increased “mainly due to the slightly warmed climate” then where what carbon reservoir sourced the atmospheric increase and what reservoir sinked the anthroprogenic increase?

    • Gordon Robertson says:

      bdg…”CO2s greenhouse gas role is not assumed. It is based on the abundance of evidence spanning 170 years and many disciplines of science”.

      You alarmists keep claiming this but not one of you has offered this so-called evidence that relates an atmospheric concentration of 0.04% CO2 to nearly 1C warming during that 170 years. At best, you alarmists refer to a study by Tyndall in which he proved gases like CO2 can absorb IR. Second best, is a mathematical analysis by Arrhenius, at a time when electromagnetic energy and it’s relationship with atomic structure was not understood.

      Both of them felt a warming produced by CO2 would be beneficial so neither of them saw such warming as catastrophic. The issue is not whether CO2 can produce some warming, it’s the insinuation that a doubling of CO2 will be catastrophic. There is absolutely no evidence to support the catastrophic scenario.

      Personally, I think the Ideal Gas Law limits warming of CO2 to its mass percent. That would be a few hundredths of a degree C for a 1C warming.

  107. Boris Winterhalter says:

    I do suggest that you bdgwx says: February 3, 2020 at 11:27 AM read my part on the FAQ 8.1 and the note that CO2 is assumed by Andrew Lacis https://www2.bc.edu/jeremy-shakun/Lacis%20et%20al.,%202010,%20Science.pdf, a paper from 2010.

    This assumption has been accepted by the IPCC in https://www.ipcc.ch/site/assets/uploads/2018/02/WG1AR5_Chapter08_FINAL.pdf

    However, the geological history of climate contains sufficient signs that CO2 HAS NOT BEEN the regulator of amiable climates of our planet as long developed fauna and flora has prevailed. This, despite occasional tumultous environmental events have occurred making drastic changes in life forms. At the same times the concentration of atmospheric concentratuions of carbon dioxide has varied at last ten fold compared to the present. THERE FORE MY DEDUCTION IS THAT THE CLIMATE ROLE OF CO2 HAS BEEN GROSSLY EXAGERRATED, WHILE THE MAIN FUNCTION HAS BEEN TO KEEP PLANT LIFE PLENTIFUL FOR FAUNA TO PROSPER!

  108. Bob Paglee says:

    Al Gore and all those fellow anti-Carbon Dioxide Environmentalists are now dancing in the streets because there is very little of the previous enormous CO2 contribution from innumerable sirliners that cannot fly now anymore because of restrictions due to the contravirus. THE SOLE GOOD EFFECT?

Leave a Reply