UAH Global Temperature Update for February 2020: +0.76 deg. C

March 2nd, 2020 by Roy W. Spencer, Ph. D.

The Version 6.0 global average lower tropospheric temperature (LT) anomaly for February, 2020 was +0.76 deg. C, up considerably from the January, 2020 value of +0.57 deg. C.

This is the warmest monthly anomaly since March 2016 (+0.77 deg. C), and the warmest February since 2016 (+0.86 deg. C), both due to El Nino warmth. Continuing weak El Nino conditions are also likely responsible for the current up-tick in temperature, as I recently demonstrated here.
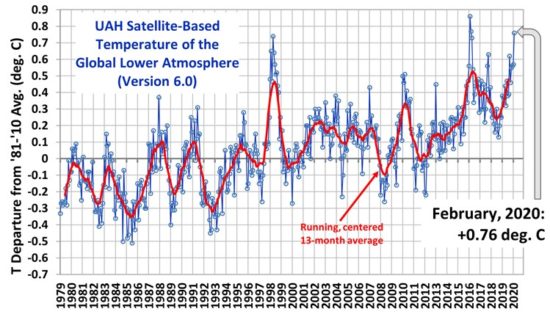
The linear warming trend since January, 1979 remains at +0.13 C/decade (+0.12 C/decade over the global-averaged oceans, and +0.18 C/decade over global-averaged land).

Various regional LT departures from the 30-year (1981-2010) average for the last 14 months are:

 YEAR MO GLOBE NHEM. SHEM. TROPIC USA48 ARCTIC AUST 
 2019 01 +0.38 +0.35 +0.41 +0.36 +0.53 -0.15 +1.15
 2019 02 +0.37 +0.47 +0.28 +0.43 -0.02 +1.04 +0.06
 2019 03 +0.35 +0.44 +0.25 +0.41 -0.55 +0.97 +0.59
 2019 04 +0.44 +0.38 +0.51 +0.54 +0.50 +0.92 +0.91
 2019 05 +0.32 +0.29 +0.35 +0.40 -0.61 +0.98 +0.39
 2019 06 +0.47 +0.42 +0.52 +0.64 -0.64 +0.91 +0.35
 2019 07 +0.38 +0.33 +0.44 +0.45 +0.11 +0.33 +0.87
 2019 08 +0.39 +0.38 +0.39 +0.42 +0.17 +0.44 +0.24
 2019 09 +0.62 +0.64 +0.59 +0.60 +1.14 +0.75 +0.57
 2019 10 +0.46 +0.64 +0.28 +0.31 -0.03 +0.99 +0.50
 2019 11 +0.55 +0.56 +0.54 +0.55 +0.21 +0.56 +0.38
 2019 12 +0.56 +0.61 +0.50 +0.58 +0.92 +0.66 +0.94
 2020 01 +0.57 +0.60 +0.53 +0.62 +0.73 +0.12 +0.66
 2020 02 +0.76 +0.96 +0.55 +0.76 +0.38 +0.02 +0.30

The UAH LT global gridpoint anomaly image for February, 2020 should be available in the next few days here.

The global and regional monthly anomalies for the various atmospheric layers we monitor should be available in the next few days at the following locations:

Lower Troposphere: http://vortex.nsstc.uah.edu/data/msu/v6.0/tlt/uahncdc_lt_6.0.txt
Mid-Troposphere: http://vortex.nsstc.uah.edu/data/msu/v6.0/tmt/uahncdc_mt_6.0.txt
Tropopause: http://vortex.nsstc.uah.edu/data/msu/v6.0/ttp/uahncdc_tp_6.0.txt
Lower Stratosphere: http://vortex.nsstc.uah.edu/data/msu/v6.0/tls/uahncdc_ls_6.0.txt


520 Responses to “UAH Global Temperature Update for February 2020: +0.76 deg. C”

Toggle Trackbacks

  1. TheFinalNail says:

    Thanks for the update Dr Spencer. January revised upwards slightly I see, making it the stand-alone warmest January on record for UAH. February also sets a new monthly record. Can these record high anomalies really be explained by a “weak El Nino” alone?

    TFN

    • TheFinalNail says:

      See correction below. Feb 2016 was warmer than Feb 2020, which was second warmest. Even so…

      TFN

      • Greg Goodman says:

        The double bump pattern seen throughout the record seems to be manifesting perfectly.

        Maybe there is some other cause and ENSO is just part of the response , not the “cause”.

        The 98 second hump was unusually strong and may be a climate response to the cooling of 1991 Mt Pinatubo eruption.

        The repetition interval of the camel humps is 7.2years. I have no idea what is behind that.

        • Scott R says:

          Greg Goodman you are on to something. In fact the period of the cycle is 3.6 years, or 1/3rd solar cycle. The underlying 11 year cycle causes one of the humps to be suppressed so it is not as apparent but it is there. I confirmed this regularly occurring cycle goes all the way back to 1850 using the HADSTT3 dataset for the tropics.

          • From the Mauna Loa Monthly data analysis page described on my web site:
            “There is a prominent maximum in both spectra at a frequency of 0.0234 cycles per month, that is, a wavelength of 42.7 months which corresponds to the 43.2 month average interval between the maxima in the correlogram, allowing for the coarse one month sample interval for each of the time series.

            Remarkably, the 42 month period was known by the Babylonians and Israelites 2500 years ago, being mentioned in the Book of Daniel in the Old Testament and the Book of Revelation in the New Testament of the Bible. It is the synodic period for the Sun, Earth, Moon combination whereby the three form the same configuration every 42 months. This is not to be confused with the Earth – Moon synodic period of 29.5 days which applies to the conjunction of the Earth and the Moon with respect to the Sun. Furthermore the 42 month period is similar to the El Nino cycle and may be the source of the heat that drives this event.

            This is in agreement with the paper from Geli Wang et al [ Ref. 6] who used wavelet analysis to detect a 3.36 year cycle in the Central England Temperature dataset, which they attributed to the El Nino Southern Oscillation.”

        • barry says:

          I read a long time ago that the average periodicity is 3.5 years, but that it is not regular. And you can see the latter point just by eyeballing the data.

          https://origin.cpc.ncep.noaa.gov/products/analysis_monitoring/ensostuff/ONI_v5.php

          https://www.esrl.noaa.gov/psd/enso/mei/

    • Jeremy Koberstein says:

      New record high anomalies are to be expected in a linear upwards trend. But a linear uptrend alone isn’t evidence of human caused global warming, we want to see acceleration up for evidence.

      https://imgur.com/JfsAQUC

      What Im watching over the next 2 years is for the anomalies to sustain between the yellow and upper red regression lines. Why 2 years? If anomalies start to sustain below yellow within two years then the trend still looks linear to me. Again, if they sustain above yellow that would be the first indication of acceleration occurring to me and THEN I would start worrying about global warming.

      • PMHinSC says:

        Jeremy Koberstein:
        “…THEN I would start worrying about global warming.”

        At what temperature do you think global warming (presumably referring to average global temperature) is a problem to worry about?

        • Greg says:

          1.5 deg C over century is NOT a problem. Along with the extra CO2, probably a net advantage.

          Their arbitrary 2 degs was always “safe” until they realised it was not happening and had to reinvent what “safe” meant.

          • Mike Roberts says:

            1.5C over a century is quicker than ecosystems have had to cope with in the past. To state that it is not a problem seems fairly complacent, to me.

            Who is “they”?

        • Greg says:

          ” if they sustain above yellow that would be the first indication of acceleration occurring to me and THEN I would start worrying ”

          Whatever happens in the next two years will not change an objective interpretation of the 40y record. It’s weather. If it drops 0.2 deg it will not change anything either.

          Dr Spencer’s blog has this graph, on which he comments:

          land typically warming (and cooling) more than the ocean, as would be expected for the difference in heat capacities

          http://www.drroyspencer.com/wp-content/uploads/UAH-LT-land-vs-ocean-anomalies-550×413.jpg

          However, the slope of that scatterplot looks damned near close to 1 to my eye. I don’t know how he manages significantly more warming overland.

          The surface record shows land warming about twice a quick.

          • Nate says:

            “1.5 deg C over century is NOT a problem.”

            Thanks Greg, that is reassuring to hear from an expert such as yourself.

      • Midas says:

        Please explain why we need acceleration for it to be human-caused.

        • Greg says:

          You would need acceleration over the 20th c. because the AGW is supposed to only have become significant since about 1960 according to IPCC. The early 20th c. warming was natural and just as strong as the later warming.

          Unless you can explain what caused the natural warming and why is was not also present in the later period, you have ZERO AGW.

          • “Unless you can explain what caused the natural warming and why is was not also present in the later period, you have ZERO AGW.”

            Obviously not true. You just subtract the natural warming from the observed warming. (Or measure the CO2 forcing directly using satellites or instruments to measure back-radiation, as has been done. In fact, even calculating forcing based on the gas concentrations would suffice.)

            In fact, once all known forcings are taken into account, anthropogenic forcing accounts for MORE than 100% of observed warming. All other influences produce a small cooling, which partly offsets anthropogenic GHGs.

          • lewis guignard says:

            Hopefully it is AGW. Then we can expect the climate to remain as warm as it is or warmer – a good thing.

            Cold is bad. Hard to grow things in cold weather.

          • Gods give me strength…

          • Nate says:

            Lewis doesnt seem to be aware that people live between 40 deg N and 40 deg S latitude.

        • Jeremy Koberstein says:

          1. Amount of GHG in atmosphere increases temperature of planet.
          2. Rate of GHG emissions per year has been increasing (afaik).
          3. Therefore, the RATE of warming should be increasing. Acceleration.

          That being said in 50?100? years the linear uptrend will start to cause problems without any acceleration and we should take precautions for that. But maybe my overall position wasn’t properly stated in my post. All I was trying to say was that I’m personally not worrying until I see more evidence for acceleration.

      • barry says:

        Ditto for Midas.

        “But a linear uptrend alone isn’t evidence of human caused global warming, we want to see acceleration up for evidence”

        Why would that be evidence of human caused global warming? You realize that the CO2 warmig effect is logarithmic?

        And if this acceleration became clear, would you really acept it as evidence?

        • Jeremy Koberstein says:

          I was unaware CO2 warming was logarithmic, thank you for informing me. I think that would certainly dampen a lot of acceleration. Of course if arctic ice melts among other factors it will eventually accelerate and we need to eventually take precautions. My post was just drawing a line in the sand where I would personally start worrying and taking action. Until then I won’t.

      • “But a linear uptrend alone isnt evidence of human caused global warming, we want to see acceleration up for evidence.”

        So plot an exponential fit.

        • Greg says:

          forcing is the log of concentration, so log(exp) = linear. Learn the basics.

          in any case ou host says he used IPCC “forcing” not concentration of CO2.

          • “Learn the basics.”

            Arf. Let me repeat the original question: “But a linear uptrend alone isnt evidence of human caused global warming, we want to see acceleration up for evidence.”

            You just argued that linear growth IS evidence for anthropogenic forcing, using “the basics”. (Albeit not all of them.) If you want to see “acceleration up” you would still have to plot an exponential (or polynomial) fit, but you’ve now made that a separate point.

            Point 1: To measure acceleration, you don’t plot a linear fit.

            Point 2: You don’t need acceleration to show anthropogenic forcing.

            Well done.

        • Jeremy Koberstein says:

          I think an exponential fit could work at this point but you want to leave room for error, deviations, noise, whatever you want to call it. My line in the sand where I will be worried is about 2 years for that. I recognize there is more concrete statistical methods but I’m just sharing my personal eye ball test with other people.

  2. Tim Wells says:

    Its been a horrible winter in the UK depressing wet windy and not very warm.

    • Mikey says:

      Oh, come on, Tim! We haven’t had any snow (where I live – and that’s the important part) or ice – no ice at all! We’ve just had our lowest February electricity consumption in the 14 years we’ve lived in our home. Only four weeks to go and it’s over!

      • Tim Wells says:

        What’s it matter whether we have had any snow, it’s been constantly cold? I see Artic sea ice ain’t far off norms either.

        • Bindidon says:

          Tim Wells

          “I see Artic sea ice aint far off norms either.”

          Typical ‘skeptic’ reaction: you look at little recent bits you think they’ll turn everything around.

          Here is a graph showing you how pretty well 2020 climbs up.

          Let’s hope it won’t follow 2012 too far during the year, and escape from it downturn:

          https://drive.google.com/file/d/19I6WWxw-xavC0H7K7tS_Ocef8BE2gzcs/view

          I’m sad of this Arctic warming whose consequence is no more than permanent ice sheet and sea ice melting!

          Its consequence namely is the increase of weather perturbation and precipitation, westerly wind everyday.

          Basta ja!

          Of course we enjoyed the third non-winter in sequence, no snow let alone ice.

          Rgds
          J.-P. D.

        • Mike Roberts says:

          Yeah, not far off norms. The thing is that the “norm” is now far below what it was a few decades ago.

    • Midas says:

      If you look at the heat maps over your winter, continental Europe has been (almost) consistently ultra warm, while the fringe of the warmth has been flickering over the UK and back again.

    • Bellman says:

      Only if you judge winter by the last couple of weeks. Most of the time it’s been very mild in my experience. CET has December as around 1°C above average and both January and February around 2°C above average.

      • TheFinalNail says:

        Indeed Bellman, winter in CET 2019-20 (DJF) was inside the top 10 warmest winters in that record, which starts in the winter of 1659-60.

    • barry says:

      Had quite a bit of rain today in my back yeard, so that means its global raining.

    • Here in the Alps we have had a single dusting of snow at 500m so far. Not even worth shovelling away. The snow cannons have been eating power up on Flumserberg all Winter.

      Also, we had two wolves there last week! Within sight of my place, something I could not have imagined 30 years ago.

    • Carbon500 says:

      Tim Wells – exactly so! Going on from your comment, average temperatures don’t give a full picture – climate is not defined by temperature alone. The British climate differs according to geographical location, and is unpredictably variable fron season to season.
      Here’s an excellent link – graphs of UK temperatures, rainfall and sunshine going back to 1910 from the Met Office:
      https://www.metoffice.gov.uk/research/climate/maps-and-data/uk-temperature-rainfall-and-sunshine-time-series
      Look for example at the graphs for 2012 – there’s nothing there to suggest anything greatly different from other years, yet the European winter of 2012 was bitterly cold, as a quick internet search will reveal.
      To refer to a British winter as warm is misleading to say the least – death from exposure is not unknown, and people underestimate what’s going on outside their centrally heated houses, warm workplaces and cars at their peril. I remember some years ago reading about a young man who’d gone out in his car, lightly clothed, and the car broke down in a remote area. With nothing to warm him, he died in the cold.

  3. RW says:

    Thanks for the update.

  4. TheFinalNail says:

    Correction to above: February 2020 is the 2nd warmest February in UAH, behind 2016 (0.86C), apologies. Even so, I think the above question is valid. Feb 2016 was in the midst of a very strong El Nino, not at the tail end of a weak one.

    TFN

    • bdgwx says:

      This is a bit of a surprise jump…at least for me anyway. The last 6 months of ONI figures in order from oldest to newest are 0.3, 0.1, 0.1, 0.3, 0.5, and 0.6 ending at NDJ. The only other times TLT was this high was when ONI was > 2.0 for several months prior.

    • Richard M says:

      The North Pacific blob has quickly dissipated moving a lot of warmth to the atmosphere. This should be over now and the lag should not be that long. I think everything will settle down now and around May we will see a more realistic picture.

      • Midas says:

        Yes, the trend value is only +0.31.
        Just wondering, when we next fall below the trend, as we inevitably must, will you be explaining it away as you are now (as you should) or will you be claiming “global warming is over”?

    • barry says:

      Yes, while there are warm anomalies, reality is just around the corner.

  5. bdgwx says:

    At a cursory glance it looks like the increase may be the result of the jump up in the NH temperature. I wonder if this is related to the back-to-back record high Arctic Oscillation events in February.

  6. Jeremy Koberstein says:

    Many understand the mechanics of GHG logically, but HOW MUCH warming is being caused is also important to understand. For us to see meaningful warming from GHG we would need to see acceleration in the anomalies.

    https://imgur.com/JfsAQUC

    What I’m watching over the next 2 years is for the anomalies to sustain between the yellow and upper red regression lines. Why 2 years? If anomalies start to sustain below yellow within two years then the trend still looks linear to me. Again, if they sustain above yellow that would be the first indication of acceleration occurring to me and THEN I would start worrying about global warming.

    • Al Bedo says:

      > For us to see meaningful warming from GHG we would need to see >acceleration in the anomalies.

      Why? That just sounds like an unsubstantiated theory. UAH-measured warming could accelerate but then again it might not – not sure it proves anything either way. The practical problem is that random variation coupled with El Nino effects (plus any potential volcanic eruptions) is likely to cause too much scatter to be sure of whether a short-term (eg 2-year) trend is concave/linear/convex.

      • Jeremy Koberstein says:

        I didn’t fully flesh out the logic of my post but Joel has pointed out below that there’s already acceleration present in the data for 4 years. After 2 additional years we would have 6 years and that would start to worry me. Could 6 years of acceleration be due to random variation? Maybe. At that point I’ll do more rigorous statistical analysis as I’m sure many others will. Until then I’m not worrying.

    • bobdroege says:

      You need to propose a valid test for acceleration, you have not done so.

      You could test the data for a parabolic fit and see if it excludes zero, that would be a start.

      • Jeremy Koberstein says:

        I acknowledge that the eye ball test is not the best but its the most efficient way for me personally. I’ll do more concrete work as I’m sure others will when my line in the sand is crossed.

    • bdgwx says:

      Accelerated warming can occur because of GHG or non-GHG reasons. For that reason tracking the acceleration rate has little if any utility in determining the cause of the warming.

      If you’re looking for a discriminating factor based only on the UAH data then I recommend tracking the TLT-TLS difference. Right now that trend is about +0.42C/decade.

    • Joel says:

      The trend data of the last five years already shows acceleration if you take it to one more decimal place than Dr Roy does. He’s been rounding up to 0.13 since 2017. 2019 was the first time he rounded down to 0.13.

      2015 0.112 / decade
      2016 0.124 / decade
      2017 0.128 / decade
      2018 0.126 / decade
      2019 0.131 / decade

      Trend values are for the data set up to the end of each year.

      I have the same reservations as other commentors about your link between ‘meaningful warming’ and acceleration. However, if you believe that, then surely the acceleration of the last five years should already concern you.

      • Jeremy Koberstein says:

        I believe that you could have an exponential fit to the data at present moment BUT 4 years of acceleration in a 40 year data set is only 10%. I’m simply waiting on 2 more years to confirm acceleration and start taking personal action.

    • Aaron S says:

      This looks something like the camel back el nino pattern of 88 to 92. It will be interesting when enough El Nino events exist to understand their longer term pattern. Another reason not to like the thermometer data sets is they keep messing with the El Ninos (ie reduce the 97 98 but keep 16 17).

  7. Scott R says:

    For this NH data point of +0.96 to be correct, there must be a very large uptick in the 20 deg – 60 deg area ocean / Asia. USA and the arctic are pretty cool and that would need to be offset by something… plus the tropics are 0.76 same as the globe. That also has to be offset to get to 0.96. The last NoExt data points were 0.69 land, 0.50 ocean so we are talking about a doubling of temperature in 1 month. hmm Let’s see what happened in Feb 2016. The NoExt shot up to 1.26 for a one month deal before it dropped to 0.26 May of last year. This looks very similar.

    • bdgwx says:

      Reanalysis shows that the mid latitudes especially in the eastern hemisphere were quite warm.

      • Scott R says:

        bdgwx thanks for the reply… what dataset are you using to conclude that? The NoExt UAH data point for Feb has not been released yet as far as I know. I’m assuming it went way up due to the overall NH number, arctic, tropics. USA went down though, so that invalidates it as a spot check anyways. But Yeah… you could have very warm land temperatures in Asia, and also I see the mid Atlantic was above average. The north Pacific in my opinion is not as warm as it has been in the recent past. So it has to be very warm in the mid Atlantic and Asia. I’m just trying to make sense of this NH mid-latitude number.

      • bdgwx says:

        Reanalysis. There are nearly a dozen of these types of datasets. Some of them are near realtime which is nice. The following site has the NCEP/NCAR reanalysis and GFS analysis datasets in near realtime. Scroll down to the bottom for the monthly charts.

        http://www.karstenhaustein.com/climate.php

        • Scott R says:

          Thanks bdgwx! A lot of useful information there. Much appreciate!

        • bdgwx says:

          Yeah, I like it because it is easy to get to and near realtime. Unfortunately the only reanalysis dataset it has is the NCEP/NCAR.

          The best reanalysis dataset IMHO is the ERA. Unfortunately not many sites have it and none in realtime. You can get the monthly reports here though.

          https://climate.copernicus.eu/surface-air-temperature-maps

          Reanalysis is perhaps one of the best ways to measure the global mean temperature so I definitely recommend tracking them.

  8. Mikey says:

    Could someone kindly point me to a website which shows the balloon data for the lower troposphere – THE TREND, please? I want to see if it is in line with UAH’s 0.13 deg C per decade. I’ve asked this before, last week, and someone did post a link, but it didn’t work. They offered an explanation which simply made no sense. Thanks.

      • Mikey says:

        No, that’s not lower troposphere for radiosonde, only mid.

      • bdgwx says:

        I’m not aware of any actively maintained dataset of radiosonde data that is equivalent to UAH’s TLT product.

        • Mikey says:

          Well, the reason I ask is that Dr Spencer states something along the lines that radiosonde data backs up the UAH claim of 0.13 (rather than 0.20 RSS). So I’m trying to find out where this trend is. I am in a discussion (for which read ‘argument’) with someone online, and he has asked me to provide a link where this can be shown (that radiosonde supports UAH lower tropo trend). But having said it does, I can’t find it!

        • bdgwx says:

          The claim that UAH provides a better match to radiosonde data comes from Spencer and Christy. They do their own analysis and it is often constrained to TMT (mid-troposphere) and for the tropical region only.

          You can read their latest comparison here.

          https://tinyurl.com/rghbr75

    • Mark B says:

      RATPAC has global anomaly data since 1958 at a number of discrete pressure levels. TLT would approximately correspond to the L850 and L700 levels.

      In a web search I didn’t see any particularly current plot, but if I’ve done it correctly the annual trend per level since 1979 is as follows:

      surf : 0.023
      L850 : 0.021
      L700 : 0.018
      L500 : 0.022
      L400 : 0.023
      L300 : 0.017
      L250 : 0.010
      L200 : 0.001
      L150 : -0.003
      L100 : -0.027
      L70 : -0.056
      L50 : -0.064
      L30 : 0.04

      Which is to say the trend from this data set are higher than UAH v6.0 and similar to RSS v4.0.

      The data (I used RATPAC-A) is linked from here:
      https://tinyurl.com/wuhzwch

  9. Rob Mitchell says:

    Count me in as a fellow “lukewarmer” of Dr. Spencer’s. Interesting the Arctic was close to the climate norm. Must be that polar vortex (or what I call the Hudson Bay Low) on the rampage.

    • Richard M says:

      This probably helped the warming of land areas adjacent to the Arctic. The cold Arctic air got bottled up in an area that is not part of the UAH data. The warmth from the more open Arctic water was then moved over these NH land areas.

  10. Scott R says:

    Dr Spencer, could you please confirm your NoExt numbers for Feb?

  11. Mike Maguire says:

    Near record positive AO in February, in fact, at an incredible +++++AO at times, resulted in the cold being locked up in the high latitudes….the Arctic was frigid/near average, which has not been the case for the last few decades.

    Arctic and North Atlantic Oscillation

    https://www.marketforum.com/forum/topic/15793/

    The global warmth anomaly increase came from the tropics and the N.Hemisphere which had modest upticks that did not occur elsewhere.

  12. Midas says:

    Warmest month not associated with an El Nino event
    This month: +0.76
    pre-2015: +0.45

    Warmest three months not associated with an El Nino event
    Last three months: +0.63
    pre-2015: +0.28

    • Scott R says:

      Midas we are still within the 3.6 year cycle peak associated with El Nino events. Do you deny that this cycle exists? The tropics are at +.76 currently. They were at -.12 in early 2018. These temperatures in the tropics have not been seen since the 2016 super ENSO event. They are warmer than they were during the official el nino last year. NOAA is predicting la nina to start, and these temperatures in the tropics will soon crash and drag down the global departure. I can’t wait for that day to silence the alarmists.

      • Midas says:

        You are the only person who talks of such a “cycle”.

        • barry says:

          The paper speaks of a 3.6 and 2.2 year 3rd and fifth harmonic potentially phase-locking ENSO events to the solar cycle, explaining 52% of the variance and in phase with 75% of episodes. The paper ignores 4 cold periods out of phase to make these figures.

          I did a bit of reading, and it seems that there are many attempts to find a solar signal on Pacific SSTs and events, wityh all sorts of different cycle peaks and harmoncs proposed. And as far as I read, much of this variety comes down to how one selects and arranges the data.

          https://journals.ametsoc.org/doi/pdf/10.1175/JAS-D-11-0277.1
          https://agupubs.onlinelibrary.wiley.com/doi/full/10.1029/2011GL047964

          Post 2011 it seems interest in looking for a solar signal in ENSO has dropped off. At least in the literature.

          • Scott R says:

            barry,

            If you drill down to the ocean tropics, the 3.6 year cycle dominates. What they mean by phase locking is that the solar cycle isn’t the same every time, and these 3.6 year cycles conform to that. If you can conclude that a forcer is 52% responsible for something, that means it is the #1 forcer. You can see that relationship here, also the 42 year cycles (there are 2 of them actually). The 60 year cycles dominate more in the arctic / Antarctic.

            https://www.facebook.com/100000276969216/posts/3017605551591981/?d=n

            https://www.facebook.com/100000276969216/posts/2979081735444363/?d=n

          • barry says:

            You seem to me to be gung-ho to promote these cycles, but I see little evidence of self-skepticism, nor indeed of any interest in the 2 papers on the subject that I just linked.

            If your modus is to gather material that seems to support your view while ignoring any that might interfere with it, then that casts a very dubious light on the objectivity of your investigation.

          • Scott R says:

            barry,

            I spend very little time reading articles. I’m more interested in downloading data sets myself and seeing where it takes me. Do you see the 3.6 year cycle in the tropics? How about the 42 year cycles? The 60 year cycle is very clear in the north Atlantic data… it is not as clear in the tropics. This is very logical. The reason for the 60 year cycle is barycenter movement and that primarily impacts the poles that are only exposed to the sun 1/2 the time. The tropics are more sensitive to solar activity as we see the 3.6 year cycle conforming to the 11 year cycle.

            Bottom line, even if you believe that CO2 is causing a gradual warming trend, wouldn’t you like to take these cycles into account to perfect the long term models? I don’t see run away warming here. In fact, the arctic hasn’t been this healthy in years and it is doing it with this very warm February in the mid latitudes.

          • barry says:

            What importance would this proposed 42 month weather cycle have on multidecadal climate change?

            I see that you have little interest in reading papers – except, apparently, ones that conport with your view. If you even read that one at all, instead of doing a quick search of the millions of documents on the web to find one that looked like it supports your view.

            Cycle mania and astrology have always hads their adherents who don’t like to interrupt their work with any learning from others who have alternative views.

            This is the complete opposite of skepticism.

          • Svante says:

            Scott R says:
            “The reason for the 60 year cycle is barycenter movement”

            Paper retraction note:
            https://tinyurl.com/rongc7h

            “… the assumption that the orbits of the Earth and the Sun about the Solar System barycenter are uncorrelated, so that the Earth-Sun distance changes by an amount comparable to the Sun-barycenter distance […] this assumption is inaccurate”

  13. Midas says:

    It’s funny seeing deniers here clambering for other data sources now that UAH is not giving them what they want.

    • Carbon500 says:

      Midas: within the context of your comment, the meaning of ‘deny’ is to declare something to be untrue or non-existent, or to repudiate (reject) something.
      Does that mean that a scientist at a meeting who disagrees with conclusions drawn from presented data is a ‘denier’?

      • Midas says:

        Good to see you couldn’t challenge the main point of my comment.

        • Carbon500 says:

          Midas: I’m not in the slightest bit interested in challenging any of your comments. Put forward observations, graphs, and figures you find of interest and I may agree, disagree or learn something new – that’s the nature of science. Your use of the term ‘denier’ is clearly intended to be inflammatory, and serves no useful purpose – so why do it?

          • Midas says:

            My use of the word “denier” is due to the fact that the only other option offered – “sceptic” – is not applicable. Either come up with an appropriate tag, or put up with that one. And if you really are against inflammatory tags as you suggest, why do you not attack with the same ferocity those who use the term “alarmist”? Have you used that term?

          • Mike Maguire says:

            “My use of the word “denier” is due to the fact that the only other option offered – “sceptic” – is not applicable. Either come up with an appropriate tag, or put up with that one.”

            Hi Midas,
            The most incredible thing about the term “denier” when it comes to climate is that most of the denying comes from people that refer to others as the deniers.

            For instance, denying the current climate optimum for life on this greening planet(the last 40 years have been the best for life in the last 1,000 years) and absurdly calling it a climate crisis/emergency.

            Denying the key role of CO2 as a beneficial gas and the massive benefits that outweigh the negatives for life by a factor of 10.

            These are all words. Please go to my site with over 2 dozen threads/discussions, loaded with empirical data, graphs and authentic science to prove those words.

            How can showing all this data with hundreds of sources and many thousands of measurements………be denying the data or authentic science?

            Look it over and tell me where the denying comes in and point out what I am missing.
            Ignore the political elements there, which often relate to opinions and focus on the science to point out denying.

            You are pretty emphatic about this denying, so you should be able to specifically point out this denying by so called deniers like me……….especially when I have all my work on display for you to critique.

            https://www.marketforum.com/forum/topic/27864/

          • Carbon500 says:

            Midas: alarmist? No, I wouldn’t this word – I much prefer the more traditional ‘scare mongering’!

          • Carbon500 says:

            Mike Maguire: in your case, I’d say that you’re a climate realist. I’d put myself in that category – have a look at my 4.26am comment.
            The IPCC was formed in 1988, and doomsday hasn’t happened yet.
            Note my screen name. I daresay CO2 will reach 500ppm, and we’ll all still be here.
            It’s interesting to note Dr. Spencer’s comment on his homepage that little money is available to be spend on researching natural causes for the observed mild warming – and as I note in my comment I’ve referred to, temperature doesn’t define climate – a range of temperatures forms part of the description of a regional climate, as per Koppen’s classification.
            I’m 71 years old, and British. The climate here hasn’t changed, despite the scary stories.

          • bdgwx says:

            I don’t remember seeing a doomsday prediction from the IPCC. And I’m certain I never saw a prediction that humanity would be gone by 500 ppm.

          • Carbon500 says:

            bdgwx: regarding your comment ‘I don’t remember seeing a doomsday prediction from the IPCC. And I’m certain I never saw a prediction that humanity would be gone by 500 ppm’ – my attempt at ironic humour has clearly failed!

      • It’s funny seeing deniers here scrambling for distractions now that UAH is not giving them what they want.

        • RW says:

          But I thought Roy was fudging UAH to be lower than it should be? NOT.

          It’s very unlikely the recent spike this month has anything to do with long term global warming.

          • bdgwx says:

            Well…that I can agree with. With a trend of 0.134C/decade that works out to 0.001C/month. So global warming contributed 0.001/(0.76-0.57) = 0.5% of the monthly increase. The trend line is at about +0.31C right now. That means 0.45C is from natural variation. And yes…the UAH monthly mean will drop below +0.31C and probably even 0.0C in the not too distant future.

          • It follows almost by definition that short-term spikes are distinct from long-term warming, although beyond the crudeness of trend-plotting there may be changes in variability over time associated with warming. I’d be quite suprised now if the monthly values ever drop below zero again, though. Just going by eye, admittedly a poor technique, the righthand half of the line has hardly dropped below zero at all.

        • Mike Maguire says:

          Carbon 500.

          Yes, CO2 is clearly a beneficial gas by all objective/authentic scientific standards…….biology, agronomy, zoology, climate science.

          What would happen if we could turn back the atmospheric clock over a century ago and revert back to the near starvation level of CO2 in the Atmosphere and cool global temps by 1 deg. C?

          Over 1 billion people would starve to death in less than 3 years with rationing causing food prices to triple.

          I use weather and other elements to predict crops yields for a living.

          The warming, has elevated us into the new climate optimum for life. The increased CO2 has been a one sided block buster bonus.

          Denier?

          I know that its warmed in a big part because the CO2 went up. I know that the atmosphere can hold 5-6% more moisture and heavy rain events are up. I know that heat waves have increased a bit(though the coldest places during the coldest times of year have experienced the greatest warming-part of the benefits). I also know what all the global climate models using mathematical equations to represent the future atmosphere show.

          However, the OBSERVATIONS of life on this greening planet, tell us that we are experiencing a climate OPTIMUM.

          Please tell me what I’m denying?

          • Nate says:

            “near starvation level of CO2 in the Atmosphere and cool global temps by 1 deg. C?

            Over 1 billion people would starve to death in less than 3 years with rationing causing food prices to triple.”

            Kinda hard to believe that 95% of human civilzation occrred during Co2 starvation.

            Also kinda hard to believe thaT 1C warmer is better for anyone below 40 deg latitude.

            Kindof alarmist all around

    • Sören F says:

      >come up with an appropriate tag

      Unconvinced

  14. Roy W. Spencer says:

    Midas, I assume you saw the link I posted where I showed that the recent warming through 2019 was due to weak El Nino conditions, right? Yes, it’s superimposed on a long term warming trend, but the latter is very slow and gradual.

    • Joel says:

      What timescale are you using to judge the warming trend to be very slow and gradual? It’s >1 degree per century. On geological timescales, that’s incredibly fast.

    • fonzie says:

      Midas is a troll (he sees what he wants to see)…

    • Loydo says:

      “the recent warming through 2019 was due to weak El Nino conditions”

      This “weak” El Nino has resulted in global temperatures higher than the super Nino of ’98 and therein lies the problem.

      Roy doesn’t think 0.2°C/decades is anything to worry about afterall whats 1°C gonna do? But the next super El Nino will see a spike way above that and the one after will spike higher again. The global average increase looks moderate but spatial and temporal spikes are not and sooner or later he’ll be living under one. We’ll see how “lukewarmerism” does then.

    • Midas says:

      When was the last time a weak El Nino produced a monthly anomaly of +0.76 8 months after is ended?

    • barry says:

      As Roy is using the MEI for ENSO values, I eyeballed the data to see if there was another episode similar to current, and the best match I could find was 1979/80.

      https://www.esrl.noaa.gov/psd/enso/mei/

      [click on ‘MEI.v2 Values’ tab to see the data]

      If we reduced all warming and variability down to CO2 warming and ENSO variabiity(*), we have UAH av global temp 1980 at -0.04 C, and 2019 at 0.44 C. So 0.48 C over 40 years with a CO2 increase of 75 ppm over that period (22% increase: 336 ppm to 411 ppm).

      That works out to an immediate climate response to CO2 forcing (Transient Climate Response) of 2.1 C for a doubling of CO2. Which is slightly above the current IPCC median estimate of about 1.75 C (median of the range), and inline with the previous IPCC (2007) estimate of 2.1 C per doubling CO2.

      Using a linear regression for the period re temps gives an overall warming of 0.52, for a TCR of 2.36 C per doubling CO2.

      Caveats: figures have been rounded, ranges reduced to means. Tried to be conservative all the way. Other possible cycles beyond ENSO ignored.

      (*) All variability attributed to ENSO is often an implied basis of many posts here and elsewhere – which I think is a mistake. But seeing as it is ‘skeptics’ who tend to run with this implied premise, I trust this calc won’t raise much heat from that quarter.

      • bdgwx says:

        A TCR of 2.36 would probably yield an ECR of 2.8 I think.

      • barry says:

        As IPCC median ECR has remined at 3C while the TCR values have changed, I’m not sure how one could formulate a direct equation. I understand that they are estimated independently.

  15. Snape says:

    Northern Hemisphere snow extent is much lower than usual:

    https://climate.rutgers.edu/snowcover/chart_daily.php?ui_year=2020&ui_day=61&ui_set=2

    I wonder how much this would effect global temperatures?

  16. Snape says:

    I had albedo in mind, so extent is the relevant metric.

    Although not much sun where the extent is low, so maybe it doesnt matter much.

  17. Bindidon says:

    Mikey says:

    ” Could someone kindly point me to a website which shows the balloon data for the lower troposphere – THE TREND, please? ”

    I just downloaded the newest RATPAC-B monthly data from the NOAA source:

    https://tinyurl.com/s64fmf4

    For Dec 1978 – Dec 2019, the 13 RATPAC-B trends are as follows, in C / decade, pressure level in hPa:

    – 1000: 0.27
    – 850: 0.21
    – 700: 0.19
    – 500: 0.19
    – 400: 0.19
    – 300: 0.16
    – 250: 0.09
    – 200: -0.01
    – 150: -0.08
    – 100: -0.25
    – 70: -0.47
    – 50: -0.54
    – 30: -0.59

    All trends with 2 sigma around 0.02.

    For a comparison with UAH,
    – it is best to take the global land series (trend: 0.18 C), because most of the radiosondes are on land, a few on islands;
    – since the average absolute measurement temperature is about 265K, the LT lapsrate at 6.5 C / km, the altitude then is about 3.7 km, what gives us an atmospheric pressure of about 650 hPa.

    This a chart comparing RAT and UAH at 700 hPa:

    https://tinyurl.com/vjk45uh

    The fit is amazing if we consider that RATPAC only consists of 85 not so evenly distributed radio sondes… to be compared with about 2800 land cells in the UAH 2.5 degree grid.

    Rgds
    J.-P. D.

    • bdgwx says:

      Great analysis. I like seeing the trends for each pressure level. The 1000mb to 30mb difference of +0.86C/decade is higher than I would have guessed.

    • Mark B says:

      – it is best to take the global land series (trend: 0.18 C), because most of the radiosondes are on land, a few on islands;

      While the density of ocean measurements, particularly in the Pacific are less than ideal, RATPAC is supposed to be a global area-weighted land/ocean average.

      http://www.euanmearns.com/wp-content/uploads/2016/02/ratpacmapb.png

      • Isn’t RATPAC-B better for coming up with a global average by means of area weighting and considering the scarcity of radiosondes over oceans than RATPAC-A?

        • Mark B says:

          My reading of the RATPAC description is that RATPAC-A is preferred for long term global series analysis while RATPAC-B has the advantage of providing individual station (hence regional) series.

          That said, the global trend vs pressure level calculated by Bindidon for RATPAC-B to kick off this sub-thread aren’t significantly different from what I got using RATPAC-A up thread, so it makes little difference in this context.

          My objection was that that UAH Global rather than UAH Land is the more appropriate data set for comparison with RATPAC Global.

          • Bindidon says:

            Mark B

            “My objection was that that UAH Global rather than UAH Land is the more appropriate data set for comparison with RATPAC Global.”

            If you had done the same job as I did, you would think quite different.

            What you pretend to be better is exactly what I had in 2016 because I had forgotten to look at the land/ocean ratio within RATPAC.

            Thus RATPAC-B was compared with UAH LT Globe, and the match took place far below the 700-500 hPa: I had to move down to 300 hPa, what corresponds to an altitude of about 9000 meters. This is MT level.

      • Bindidon says:

        Mark B

        “While the density of ocean measurements, particularly in the Pacific are less than ideal, RATPAC is supposed to be a global area-weighted land/ocean average.”

        This makes no sense.

        RATPAC has 85 radiosondes, and 70 % of them are located on land, 30 % on islands.

        But conversely, land surfaces account for 30 % of the Globe, this is exactly the inverse situation.

        The result is quite simple: you introduce a cooling bias due to the fact that UAH land has 0.18 C increase per decade, but the oceans show only 0.11 C.

        What I could do would be, like I did for GHCN V3, to generate from the RATPAC context a UAH time series out of the exactly those grid cells encompassing the 85 radiosondes.

        I’m not sure enough it would change much…

        Rgds
        J.-P. D.

    • Bindidon says:

      Anyway we all shouldn’t forget that RATPAC, though being a true subset of the IGRA radiosonde set, is a quite different context than the raw IGRA: the RATPAC data is subject to heavy homogeneisation according to the R&D performed by Leopold Haimberger & team at the U of Vienna in Austria (see RAOBCORE and RICH processing).

      I made years ago a comparison of
      – the RATPAC-B-monthly-combined data
      – the data generated out of the 85 RATPAC stations by using the IGRA methods;
      – the data generated out of all IGRA (V1) stations (1500 at that time).

      The difference is amazing:

      https://tinyurl.com/stlupj6

      The green and yellow anomaly plots aren’t very visible, but that doesn’t matter, the running means tell enough.

      Rgds
      J.-P. D.

  18. Wyss Yim says:

    Nishino-shima eruption south of Tokyo may be an important factor again. It was a factor in the 2014-2016 North Pacific Blob.

  19. Bindidon says:

    Here is the ENSO forecast of Japan’s Met Agency:

    http://ds.data.jma.go.jp/tcc/tcc/products/elnino/elmonout.html#fig2

    As you all can see, we are way away from a La Nina.

  20. Snape says:

    Weekly departures:

    Nino 4: +1.0 C
    Nino 3.4: +0.5 C
    Nino 3: +0.4 C
    Nino 1+2: +1.0 C

    https://www.cpc.ncep.noaa.gov/products/analysis_monitoring/lanina/enso_evolution-status-fcsts-web.pdf

    So while officially neutral, the Nino region is definitely warmer than usual.

    • Midas says:

      I doubt it will be turning into a full-blown El Nino.

    • barry says:

      So say the various monitoring institutues. Small chance of la Nina forming later in the year – according to one model. There is a caveat that forecasts eary in the year are pretty uncertain. From memory, the forecasts firm up post April (anyone have the straight dope on that point?).

  21. Slipstick says:

    Why are we still discussing the linear trend for a patently non-linear system?

    • Because it’s what Dr. Roy puts under the graph, to be absolutely blunt. There are many ways to assess a trend. Linear regression is just a very common and understandable one of them.

    • Midas says:

      So you don’t understand the purpose of a linear trend?

    • bdgwx says:

      Because it is useful. At any rate it sounds like there is some conflation of concepts here where there should not be. Can you better explain the context of your question?

  22. David Overton says:

    Thanks for this valuable data, and the fast reporting each month.

    The rate of change of .13/decade equates to .52 C over the 40 years of history reported. The Keeling curve indicates that over that same period CO2 levels have increased from about 340 ppm to 410 ppm, an increase of 20.6% (https://www.nationalgeographic.org/encyclopedia/keeling-curve/).

    .52/.206 = 2.5C, indicating a carbon sensitivity of approximately 2.5 degrees C of warming for a doubling of CO2. This is pretty consistent with warming observed over the past 120 years, 1.1 degree C and an increase in CO2 from 280 to 410, or 46%. 1.1/.46 = 2.39. Also consistent with estimates developed at Princeton and at MIT.

    If this is approximately correct, we can expect to reach a 2 degree C increase well before CO2 doubles (560 ppm). That is 150 ppm away, and at our current rate of 25 ppm increase per decade, we will reach that level by 2080, unless something changes. Right now, the US Energy Information Agency predicts increased fossil fuel energy and increased CO2 emissions through 2050 at least.

    My conclusion is that we need to begin reducing dependence on fossil fuels quickly. Is there anything wrong with any of this logic? Thanks for any insights.

    • Rob Mitchell says:

      The United States leads all nations in reducing carbon emissions in 2019.

      https://www.iea.org/articles/global-co2-emissions-in-2019

      If the rest of the world would follow the lead of the United States by getting out of the Paris Climate Accord, the better off we all would be.

      • That link actually states that EU emissions declined by 5%, almost double the 2.9% given for the USA. What you are saying is merely that the USA had far greater absolute emissions to begin with.

        The bigger they are..

        • Rob Mitchell says:

          Elliott, are you actually trying to make a big deal about “the bigger they are..?”

          Asia is responsible for about 10 Gigatons of emissions. The United States is responsible for 4.8 Gt. Bottom line, the United States led all nations by reducing carbon emissions by 140 Mt on a per country basis. Carbon emissions grew by 320 Mt (0.8 X 400) per the report by Asia. Your “bigger they are” argument falls apart there.

          The United States is demonstrating to the world how to reduce carbon emissions by allowing the consumer to have free-market choice for their type of electric power generation. Not mandates from a centralized governing authority.

          • Bindidon says:

            Rob Mitchell

            You wrote upthread:

            ” Asia is responsible for about 10 Gigatons of emissions. The United States is responsible for 4.8 Gt. ”

            I think it would be better to replace ‘Asia’ by ‘China’.

            And it would also be better to talk rather about consumption than about emissions.

            Everybody knows that
            – emissions are to a great extent bound to industrial good production;
            – this is especially valid for China whose car traffic per capita is way below that of US or Europe;
            – the consumption per capita in China is way lower than in US or Europe, as it is restricted to a minority;
            – China’s CO2 emissions therefore are mainly generated by export activities.

            Here is a consumption-based chart of CO2 emissions:

            https://tinyurl.com/t9ctgbk

            If CO2 emission taxes had to be paid by the consumers rather than by the producers, we would have a considerably different situation.

            China namely exports so many goods – and hence emits so much CO2 – only because
            – the Chinese products are cheaper – at the expense of population’s health and environment’s quality in China;
            – the importers and gross product buyers all around the world want to buy following ‘the cheaper the better’, and therefore buy Chinese;
            – the manufacturers in US and Europe transferred (some decades ago) part or total of their production to China to reduce their costs.

            This is a problem caused not only by the Chinese ‘communist’ dictatorship.

            The responsibility for this situation also is in the hands of

            – the buyer side: no one in the US or Europe is required to buy Chinese products (which of course leads to bigger dividends for the shareholders, but conversely to increasing frustration among the end-buyers);

            – the WTO, which in fact is supposed to punish the government of China for continuing dumping due to insufficient wages and disastrous environmental failure.

          • “Elliott, are you actually trying to make a big deal about ‘the bigger they are..?'”

            Merely quoting it. The fact remains that the USA retains a disproportionate share of both current and legacy emissions, and therefore has both more scope and more responsibility for reductions.

            “Asia is responsible for about 10 Gigatons of emissions.”

            Asia has more than ten times the population of the USA. Each Asian is responsible, therefore, for less than a tenth of the emissions of the average US resident. Hence more responsibility and greater scope.

            “The United States is responsible for 4.8 Gt. Bottom line, the United States led all nations by reducing carbon emissions by 140 Mt on a per country basis.”

            But not by any meaningful one. In terms of per-person emissions, absolute share of remaining emissions and historical legacy emissions Americans are still among the worst offenders.

            “The United States is demonstrating to the world how to reduce carbon emissions by allowing the consumer to have free-market choice for their type of electric power generation. Not mandates from a centralized governing authority.”

            I’m not interested in your religious convictions. Gas concentrations are all that matter here. I would just point out that for someone pretending to believe in individual choice you say an awful lot about nation states. Americans are not entitled to five times the consumption levels of Chinese merely because their political organisation is smaller. It is the aggregate of emissions of all the world that are going to cook us.

          • Bindidon – Yes, we should account CO2 emissions at the point of consumption to get a true picture. Americans are also not entitled to a greater share of emissions or greater credit for reductions simply because they outsource them.

      • Nate says:

        Rob, that means the market didnt follow the efforts of Trump to get us backbinto coal in a big way.

        • Rob Mitchell says:

          At least Trump isn’t mandating one form of electric power generation over the other. He is allowing coal fired power plants, but he isn’t mandating a form of electric power generation like liberal-progressive-socialist types want to impose onto the public.

          The good news is that the United States is demonstrating to the world it can reduce carbon emissions by free market choice from the consumer. Hopefully, the rest of the world will follow the lead by the US.

          • “he isnt mandating a form of electric power generation”

            But he should be. Whatever the distorted market of today could achieve, one undistorted by subsidies and with a sensible carbon price could do better. Nor do we have time left for the theological niceties of orthodox market faith. We are facing a crisis, and childish finger-pointing at “socialists” demonstrates nothing but a lack of seriousness. Coal plant needs to be shut down at gunpoint, if necessary, and subsidies to carbon-emitting industries must stop.

            I’m waiting for you to drop the fundamentalist mask and pretend that the heresy of subsidies need not even be examined, by the way. let alone corrected. It will be commented upon.

            “the United States is demonstrating to the world it can reduce carbon emissions by free market choice from the consumer”

            Well, by outsourcing them to Asia and not producing much that anyone wants to buy, and then leaving them off its own balance sheet. But nice try.

          • Nate says:

            “is demonstrating to the world it can reduce carbon emissions by free market choice from the consumer”

            You mean those tax credits for wind and solar and plug in cars, and Obama era rebates for LED lighting, GHG emission standards for power plants and auto mpg standards had nothing to do with it?

    • John Finn says:

      TOA forcing can be estimated from Myhre et al, i.e.

      F = 5.35 x ln(410/340) =~ 1 w/m2

      This suggests sensitivity = 0.52 deg per w/m2

      Forcing due to Doubling CO2 = 5.35 x ln(2) = 3.7 w/m2

      Temperature increase from 2xCO2 = 0.52 x 3.7 = 1.9 deg C

      Very similar to Lewis & Curry and several other recent estimates.

      • Midas says:

        As the current rate of CO2 increase will take us past doubling pre-industrial levels by the end of the end of the century, I guess we can forget about limiting ourselves to +2 if we do nothing to change our habits.

        Does that paper factor in feedbacks?

        And you haven’t factored in the multi-decade lag between atmospheric CO2 concentrations and resulting global temperatures. Estimates for that lag average at around 30 years. So you should be comparing CO2 concentrations of 1990 to those of 1950. No one estimates the lag at less than 20 years, so feel free to compare 2000 concentrations to those of 1960. That makes your first calculation 0.83 instead of 1.

      • bdgwx says:

        You need to factor in the thermal inertia of the climate system. This can be done using either Midas’ approach of adjusting for the lag time or by utilizing the measured energy imbalance. If you want to stick with 0.5C per W/m^2 then the +0.6 W/m^2 (at least) imbalance adds another 0.3C for a total of +2.2C. However, this assumes the climate sensitivity remains constant at 0.5C per W/m^2. There is good reason to believe that the climate becomes more sensitive as it perturbed further from its balance state and tipping point feedbacks are activated. A climate sensitivity of 1.0 W/m^2 cannot be eliminated.

      • barry says:

        Yes, John has calculated the Transient Climate Response, which is the immediate response to forcing, rather than the Equilibrium Climate Sensitivity, which is the response after lagged effects are accounted for (*).

        IPCC current TCR is 0.175 C per doubling (median figure calculated from range 0.1 to 2.5).

        I got a similar figure above.

        * For example, one way Equilibrium Climate Sensitivity is calculated with a GCM is to immediately double CO2 and then waiting until climate response (ie, global temperature) stabilizes, which typically takes decades in the simulation.

        • Steve Case says:

          barry says: at 4:03 PM
          For example, one way Equilibrium Climate Sensitivity is calculated with a GCM is to immediately double CO2 and then waiting until climate response (ie, global temperature) stabilizes, which typically takes decades in the simulation

          Uh huh. Yes the sun reaches its zenith at noon but temperatures lag, so the hottest part of the day is a few hours later. Also, the hottest part of the year is a few weeks after the solstice. And you want us to believe that the lag time for CO2 is decades. Is that the biblical 40 years?

          From my file of tag lines quotes and smart remarks:

          “The most important lesson in Climate Science: Never make an unfounded assertion on a timeline that expires before you do.”

        • bdgwx says:

          Steve,

          I fail to see the biblical connection.

          Its not the lag time for CO2. Its the lag time for Earth’s energy imbalance to return to zero and for heat transport processes between reservoirs to stabilize. Other agents can create the initial energy imbalance. So it is not just CO2 for which the lag is relevant.

          Also the 40 year (your figure) lag is for the fast feedback ECS. So if you are incredulous of it then you’ll be even more incredulous of the slow feedback ECS which can take hundreds or even thousands of years to play out.

          • Steve Case says:

            bdgwx,
            Forty is an interesting number, it appears a lot of places besides the bible. Forty winks, Lizzy Borden’s forty whacks etc. Barry said decades – I just wondered if that was about forty years or so.

          • barry says:

            “And you want us to believe…”

            I don’t want you to believe anything. I’ve read stuff on the subject, and the definitions of ECS and TCR, while a bit more involved than what I’ve put down here, are not that controversial.

            As you’ve noted, there are feedbacks on different time scales depending on what you’re talking about. For a sustained perturbation on the global climate system, there are various feedbacks on different timescales, from water vapour changes which are very fast, to the deep oceans and glacial ice sheets like Antarctica, which take millenia to equilibrate.

            ECS is semantically the response to perturbation once all these feedbacks have equilibrated with the sustained perturbation. In the context of AGW, it is figured as the response to a doubling of CO2.

            But conventionally ECS is the ‘Charney Sensitivity’, based on the fast responses and the response of the upper oceans (full ocean response is more than 1000 years). The upper oceans take decades to equilibrate – I’ve read ’30 to 40 years’. The canonical Charney Sensitivity is 3C per doubling, and many ECS estimates hover around that value.

            The term for climate sensitivity incorporating millenial scale feedbacks is usually ‘Earth System Sensitivity’.

            https://i.imgur.com/RVCL9oM.png

          • barry says:

            eh, steve, substitute the word ‘lag’ for ‘feedbacks’ in my last post, to be clearer.

          • Steve Case says:

            barry says:
            March 6, 2020 at 10:16 PM
            “And you want us to believe…”

            I don’t want you to believe anything.*

            The upper oceans take decades to equilibrate – I’ve read ’30 to 40 years’

            Indeed, Chapter 5 of the IPCC’s AR4 report; executive Summary; page 387 tells us:

            The oceans are warming. Over the period 1961 to 2003, global ocean temperature has risen by 0.10[deg]C from the surface to a depth of 700 m.

            You know what Barry? I can’t get too excited about 0.10 of a degree.

            Besides that, does anyone really believe that scientists have really measured temperature of the entire ocean with a precision of 0.01 degree?

            Well anyway, what you are going on about is apparently a tiny fraction of a degree. There’s an old saying about fly specks and pepper.

            *If you don’t want your audience to believe what you’re saying why are you saying it?

          • bdgwx says:

            SC: I can’t get too excited about 0.10 of a degree.

            Let me put that into perspective. A 0.1C change stores 1.4e21 kg * 3850 j/kg.C * 0.1C = 540e21 j of energy in the ocean. That is enough energy to increase the temperature of the atmosphere by 540e21 j / 5e18 kg / 1000 j/kg.C = 108C.

            Don’t heat what I didn’t say. I didn’t say that the temperature of the atmosphere is going to rise that much. I’m just trying to point out just how much energy is required to change the ocean temperature by +0.1C. It’s a lot!

            SC: Besides that, does anyone really believe that scientists have really measured temperature of the entire ocean with a precision of 0.01 degree?

            Yes. Absolutely.

          • Steve Case says:

            bdgwx says:
            March 7, 2020 at 4:58 PM
            SC: I can’t get too excited about 0.10 of a degree.

            Let me put that into perspective. A 0.1C change stores 1.4e21 kg * 3850 j/kg.C * 0.1C = 540e21 j of energy in the ocean. That is enough energy to increase the temperature of the atmosphere by 540e21 j / 5e18 kg / 1000 j/kg.C = 108C.

            Don’t hea[r] what I didn’t say. I didn’t say that the temperature of the atmosphere is going to rise that much. I’m just trying to point out just how much energy is required to change the ocean temperature by +0.1C. It’s a lot!

            SC: Besides that, does anyone really believe that scientists have really measured temperature of the entire ocean with a precision of 0.01 degree?

            Yes. Absolutely.

            Some more perspective, an increase of +0.1C isn’t going to warm anything more than +0.1C.

            Yes, the people who wrote the AR4 must have believed that scientists can measure the oceans that precisely. Me? I know B.S. when I see it.

          • bdgwx says:

            SC: Yes, the people who wrote the AR4 must have believed that scientists can measure the oceans that precisely. Me? I know B.S. when I see it.

            A single ARGO float has a precision of 0.002C. As of today there were 4079 floats. The trivial error of the mean is then 0.002/sqrt(4079) = 0.0003C. However, the error ends up being higher than that for several reasons. Cheng 2020 uses more than just the ARGO floats and lists his error as 0.003C. That is still less than 0.01C.

            I’m curious to see your estimation for the error and how it is derived. Would you care to share?

          • barry says:

            “Some more perspective, an increase of +0.1C isnt going to warm anything more than +0.1C.”

            Who said the oceans are causing something to warm?

            What that 0.1C represents is an amount of energy that the upper oceans have acquired. It is a large amount of energy. Far more energy than the troposphere has acquired, but then the troposphere requires far less energy to heat up by the same amount.

            The oceans are taking up excess energy, which is a good thing. If they didn’t take the extra energy out of the atmosphere we’d be boiling by now.

            “I know BS when I see it.”

            Me too. The Earth is flat. I’ve looked and looked and cannot see a curve no matter how much distance I have ahead of me. Don’t believe me? I have scores of websites with experts explaining the hoax.

          • Steve Case says:

            bdgwx says:
            March 7, 2020 at 10:04 PM

            barry says:
            March 7, 2020 at 10:23 PM

            A single ARGO float has a precision of 0.002C.

            I love it, a SINGLE float … which says nothing about accuracy.

            Correcting Ocean Cooling

            And the ARGO floats weren’t deployed 1961-2003 The first one was released in 1999

            So are the oceans warming up? It is predictable that climate science would claim they are, and if new and improved instrumentation is deployed, I can predict that the headline will be, “Worse than previously thought.”

            Who said the oceans are causing something to warm?

            If they’re not, then so what? Who cares, and why? Or to quote a famous American politician, “What difference does it make?”

          • bdgwx says:

            SC: I love it, a SINGLE float which says nothing about accuracy.

            The error of mean depends upon the error of the individual samples that were used to compute the mean. Understanding the error of a single float is essentially in computing the error of the mean computed from a set of many floats.

            SC: And the ARGO floats werent deployed 1961-2003 The first one was released in 1999

            Correct. The error for ocean temperatures prior to ARGO was higher.

            But…because there is now a long period of overlap the ARGO data can be used to calibrate and assess the accuracy of pre-ARGO data.

          • Steve Case says:

            bdgwx says:
            March 8, 2020 at 7:35 AM

            I put up the link to the adjustments Dr. Josh Willis made to the Argo floats over ten years ago. Have they been adjusted since? The only reason I know he did it back in 2008 is that page I linked to. At the time NPR had written a story on it as well. A lot of climate data is corrected, and the corrections always seem to favor the worse than previously thought pattern.

            Maybe an increase of 0.010C over the period 1961-2003 to ocean temperature is a true statistic. I find the implied accuracy of ±0.001C somewhat unbelievable.

          • bdgwx says:

            SC: I put up the link to the adjustments Dr. Josh Willis made to the Argo floats over ten years ago. Have they been adjusted since?

            Almost certainly. Continuous process improvement is a mainstay of scientific data collection of any kind. You want datasets to be constantly improved. That’s a good thing.

            SC: I find the implied accuracy of ±0.001C somewhat unbelievable.

            I find it unimpressive. To each his own I guess.

            I will say that I looked at the error around 1960. It is approximately 0.05C so quite a bit higher 60 years ago.

    • Bindidon says:

      David Overton

      Tout est correct, no further comments needed.

      Except the fact that according to two French scientists (Dufresne, Treiner) who wrote in 2011

      https://tinyurl.com/uqgxgpt

      the increase of CO2 might lead to an increase of water vapor up to a point where the latter begins to enter the atmospheric window through band broadening.

    • bdgwx says:

      That’s a reasonable analysis David. I’ve done similar back of the envelope estimates from observations like that as well and I generally get in the low 2’s for the ECS. One caveat though…this assumes the climate sensitivity in C per W/m^2 remains constant. There is reason to believe that the more the climate system gets perturbed the higher the climate sensitivity becomes.

    • Dr Roys Emergency Moderation Team says:

      “Is there anything wrong with any of this logic?”

      There’s no GHE, so there’s that.

    • coturnix says:

      .135*4/log2(415/340)=1.88 C per doubling

  23. Gordon Robertson says:

    Roy…thanks for all your good work but I think NOAA is intercepting your data and fudging it. The temperatures we are seeing recently have no rhyme or reason to them.

    • barry says:

      On what alternative basis do you estimate monthly global temperature?

    • TheFinalNail says:

      Gordon Robertson

      “… I think NOAA is intercepting your data and fudging it.”
      ___________________________

      According to ‘yourdictionary.com’, The definition of ‘in denial’ is “a refusal or unwillingness to accept something or to accept reality”. The term ‘in denial’ is kinder than ‘denier’.

      TFN

    • Midas says:

      What you “think” typically has little connection with reality.

      • Bindidon says:

        Yes Midas

        Like: “Time dilation is nonsense”, or even worse: “Time does not exist, it is an invention of Mankind”.

        Good grief.

        One day we will hear that “Temperature does not exist, it is an invention of Mankind”.

        • Midas says:

          Did he really say that? Does he think humans need to exist for an object to change its position at a certain rate?

          Without time, nothing changes. Oh wait – maybe time really doesn’t exist for conservatives.

          • Bindidon says:

            Intelligent conservatives all understand the notions of time and time dilation.

          • Svante says:

            http://www.drroyspencer.com/2018/05/in-defense-of-the-term-greenouse-effect/#comment-302682

            Time is such an example. I have debated with posters on this blog who think time exists when it clearly does not. Some have expressed the view that time can affect phenomena like force and mass, which is nonsense. Others have supported the notion that humans age based on chronological time when current science makes it clear we age due to problems in our cells.

            Based on relativity theory, people have claimed time can dilate, which is utter nonsense. Time does not even exist, it was invented by humans based on the period of the Earths rotation.

          • bdgwx says:

            I’m believe this poster challenged the existence of photons as well.

  24. Wow, I’m so glad it continues to cool since 1998 and/or will shortly start to do so.

  25. Midas says:

    Calling Salvatore … where are you Sal?
    It’s now 18 months since UAH was to drop below zero and never re-surface.

  26. Mark Mannion says:

    Yet more of the super-warming trend that started in 2008. The linear trend over the last 12 years is about triple Dr. Spencer’s 0.13/decade trend. This is obviously due to an acceleration of global warming.

    I don’t understand why this doesn’t get as much notice as the warming “pause” or “haitus” that was mentioned ad naseum here and places like WUWT.

    One explanation: it is all due to natural variation. The natural variation was tending colder for a while masking the overall warming. Now that has ended and we are back to the new normal rapid global warming.

    No worry, I am sure v7.0 will come out soon and adjust this latest increase away.

    • Midas says:

      Starting a trend at the bottom of a strong La Nina is no more honest than starting one at the height of a strong El Nino.

      • Janet says:

        I’m guessing that was Mark Mannion’s point.

        Those of us who remember the late 00s/early 10s know that talk of the “pause” (or even the “end of global warming”) was everywhere at the time.

        Now there’s 12 years of warming that is as noteworthy on the *high* side as the 12 years of “pause” was on the *low* side. But none of the people who were so vocal about the “pause” in 2010 are promoting a “rapid acceleration of warming” in 2020.

        I agree that 12 years of faster-than-normal warming isn’t particularly meaningful, just like 12 years of slower-than-normal warming wasn’t. It would be nice to see some “mea culpas” and apologies from the pause-promoting people of 2010 but I wouldn’t hold my breath.

    • gbaikie says:

      “The linear trend over the last 12 years is about triple Dr. Spencers 0.13/decade trend. This is obviously due to an acceleration of global warming.”

      The length of measuring is + 40 years. 40 year times 0.13/decade trend = .52 C for 40 years.
      You want to say something about some “imagined” short term trend of 12 years.
      Longer term trends, have something to do with “global warming”, “12 year trends” don’t have anything to do with “global warming”.

      So, it is not, obviously, “due to an acceleration of global warming” .
      Rather, it obviously, has to do with your imagination.

    • barry says:

      You missed the irony in that post, gbaike. The immediate response got it.

  27. Dr Roys Emergency Moderation Team says:

    Kristian should like this one:

    https://www.nature.com/articles/s41598-020-57917-8

  28. Du Toit Strydom says:

    Maybe because the masking effect of Chinese pollution has been significantly reduced as observed by NASA satellites recording levels of air pollution.

    • Midas says:

      Just wondering whether this reduction in pollution is due to measures taken by the Chinese, or whether it is due to temporary atmospheric effects, or some other factor?

  29. Richard Barraclough says:

    Mods

    Twice over the last 24 hours I have tried to submit a comment, but both have vanished.

    Any ideas??

    • Richard Barraclough says:

      Don’t worry – that one went straight in. I’ll try again

    • Seems to be a persistent problem with the site. No-one has a really convincing explanation. I’ve perceived that it happens more often when I post links, but that’s not consistent and could be a spurious impression.

    • Mark B says:

      At least part of the problem is that there are spam filter settings on the site that reject posts they probably shouldn’t. For instance I tried earlier to post a link to a National Climate Data Center and the post was rejected because the initials of “Data Center” match the initials of a particularly unhinged poster of a couple years ago.

    • bdgwx says:

      The D and C thing is pretty annoying, but usually easy enough to work around. It’s the other nebulus reasons that frustrate me. I will say that using a different web browser can help.

  30. Lars H Hatlevik, Norway says:

    The warm Winter here in Europe, was predicted last Fall, due to a positive North Atlantic Oscillator. So the high reading for February, is not solely caused by a weak El Nino. It must at least be a combination of El Nino, positive NAO, and some manmade warming (where a doubling of co2 gives ca +1 degree warming, which is no problem.)

  31. Dr. Mark H. Shapiro says:

    OMG! Even climate-change-denying Dr. Roy may have to agree that climate change is real.

    • barry says:

      Very little in that statement has truth to it. EG, Dr Spencer (he’s not some guy on TV) agrees that more CO2 should technically cause more warming at the surface. His departure from mainstream views is a bit subtler.

  32. DocSiders says:

    For at least 150 years we’ve seen a linear warming trend when “averaged” on climatic a time scale…see the strong evidence from the world’s biggest thermometer, the oceans (linear tidal gauge trends…all over the world for 150 years and continuing).

    In statistics trends are given significant weight. It is not sensible to look at a 150 trend of unknown cause and then attribute the last 30 years to some new cause…old cause stopped and new cause took over — sounds kind flimsy doesn’t it? That’s because it is flimsy.

    • That’s why attribution is not just a matter of looking at trends, and consumes volumes of work over decades, including palaeoclimate work to examine causes over geological time. I might just add that the IPCC was formed in 1988, which is now a little MORE than 30 years, which should indicate to you that this attribution is not just based on the last 30 years of work.

      I’d add that the science recognises a whole array of influences on climate, rather than just one, and that without greenhouse forcing we would now be cooling rather than warming.

    • RW says:

      Correct. It’s flimsy for sure. The dominant cause of the warming in the last 150 years, which is only about 1 degree C, is still not known. Anthropogenic CO2 is unlikely to be a major factor in the latter half of the warming, and it’s not even clear that the net anthropogenic influence is even warming. It may not even be.

      • Arless McGee says:

        RW,
        According to BEST, global surface temps have risen +1.5*C since 1860 with the entirety rise since 1910. So, it’s not ‘about 1 degree C in 150 years’ as you claim, it is +1.5*C in 110 years time since 1910.

        Anthropogenic CO2 accumulation started swiftly accumulating in the atmosphere around 1860.

        So, yes it is quite clear.

      • bdgwx says:

        First, it is absolutely known. It is quite clear that CO2 has had a significant impact on the global mean temperature especially after 1960.

        Second, how can you say that CO2’s impact is unlikely in one sentence and also say the cause of the warming is unknown in another? How do you know that CO2 cannot be responsible if you don’t even know the cause of the warming? That’s not being very skeptical.

    • RW says:

      “including palaeoclimate work to examine causes over geological time.”

      Alleged attempts to estimate climate sensitivity by looking at paleo data are absolute nonsense. Milankovitch forcings alone can explain the large temperature changes from glacial to interglacial periods. And extraordinarily well.

      • bdgwx says:

        Milankovitch cycles can certainly help explain the timing, but not the magnitude of the glacial cycles. But Milankovitch cycles aren’t a magic bullet to explain the timing either. You still have to consider GHGs. For example, the glacial cycles transitioned from 40k intervals to 100k intervals. The Earth’s carbon cycle helps explain why this transition in timing occurred. Also, orbital cycles don’t help at all in solving the faint young Sun problem. GHGs are an essential piece of the solution. In fact, just considering CO2 and solar forcing alone is a far better match to the paleoclimate record than just considering Milankovitch cycles alone. Of course, considering all factors provides the best match of all.

        • Svante says:

          bdgwx says:
          “glacial cycles transitioned from 40k intervals to 100k intervals.”

          Modelled here:
          https://www.ncbi.nlm.nih.gov/pmc/articles/PMC6447376/

          The key is regolith removal!

          • Svante says:

            Note that a gradual change of the regolith cover causes a rather rapid (few hundred thousand years) transition from the 41- to 100-ka world, in good agreement with observational data”

            Our results also support the notion that the current CO2 concentration of more than 400 ppm is unprecedented over at least the past 3 Ma and that global temperature did not exceed the preindustrial value by more than 2C during the Quaternary. In the context of future climate change, this implies that a failure in substantially reducing CO2 emissions to comply with the Paris Agreement target of limiting global warming well below 2C will not only bring Earths climate away from Holocene-like conditions but also push it beyond climatic conditions experienced during the entire current geological period.

        • barry says:

          Single Study Syndrome has a cure. Read more studies on the subject.

          Always worth looking for any updated information:

          https://tinyurl.com/vcypj33

          You may find none, but at least you will be up to date.

          • Svante says:

            Nothing there to challenge it, as far as I can see.
            The idea is not new, just the accuracy of the model.

          • barry says:

            The accuracy of the model was independently verified?

          • Svante says:

            You’re such a skeptic. The paper is less than a year old so you’re right, it’s just a hypothesis but I fell for it. I often do so thank you for the red flag.

          • bdgwx says:

            Its a pretty good hypothesis. If not true then we’ll need to find another internal mechanism that modulates the timing of glacial cycles because there is no obvious reason why these cycles would have transitions from 40k to 100k intervals by orbital dynamics alone. And we know the carbon cycle modulates the climate system so…

          • bdgwx says:

            I found this post by Clive Best to be intriguing.

            http://clivebest.com/blog/?p=8656

          • bdgwx says:

            BTW…after researching Milankovitch cycles a bit more today I think I’ve learned to keep a more open mind both on the timing and the magnitude of the glacial cycles.

        • RW says:

          bdgwx,

          “Milankovitch cycles can certainly help explain the timing, but not the magnitude of the glacial cycles.”

          No, they can fully explain the magnitude (and are by far the best explanation). Milankovitch forcings are on the order of 50-100 W/m^2 (see Roe 2006). Estimated GHG ‘forcings’ that occur are at most 2 W/m^2. Meaning Milankovitch forcings are at least 25-50 times as large. And we haven’t even brought into the fore the absurdity of comparing the positive feedback effect of melting ice leaving maximum ice to that of minimum ice where the climate is now. It’s spectacular nonsense on steroids, and that’s being generous.

          • bdgwx says:

            The 50-100 W/m^2 figure is not a radiative force. It is the insolation at 65N during the summer.

            The direct radiative force of the Milankovitch cycles is actually close to 0 W/m^2. The cycle works through the indirect feedback effects for changes in the distribution of solar insolation both over the latitudes and over the seasons. Radiative forcing and thus energy imbalances develop as a result of the indirect effects like changes in albedo (dust, ice, etc.) and GHG concentrations.

            Milankovitch cycles are definitely important, but also subtle.

          • RW says:

            bdgwx,

            “The 50-100 W/m^2 figure is not a radiative force.”

            It is Milankovitch forcing, and yes it is a radiative forcing. It’s just not a globally averaged radiative forcing, but more localized. It can explain entirely the changes from glacial to interglacial without any effect from GHGs needed at all. And it does so extraordinarily well.

            That anything about climate sensitivity, especially high sensitivity, can be deduced from some sort of small GHG effect involved in these cycles is spectacular nonsense on steroids. It is laughably absurd for the reasons I stated earlier.

          • RW says:

            “Milankovitch cycles are definitely important, but also subtle.”

            Really? If 50-100 W/m^2 swings in insolation are ‘subtle’, then what is the measly 1.5-2.0 W/m from additional GHGs?

            Of course, they’re not subtle, but are absolutely enormous changes in the distribution of incoming solar energy.

            There is nothing else to see here. You won’t find anything else of this nature in geophysics that gets better than this. Not only does it correlate really well, it logically makes perfect sense. Case closed.

          • bdgwx says:

            That’s not what a radiative force is though. An RF is a perturbation in Earth’s energy budget. Milankovitch cycles do not (at least not directly) change Earth’s energy budget. What they do is change the distribution of the energy both spatially and temporally. But the Earth still receives the same amount of energy. It is via the indirect and subtle changes in other processes that change Earth’s energy budget.

            I’m not challenging that role Milankovitch cycles play in modulating Earth’s climate nor am I challenging the large changes in the distribution of insolation. What I’m saying is that they can’t, by themselves, explain the glacial cycles fully.

            The correlation between temperature and Milankovitch cycles alone isn’t that great. You’re not being very skeptical.

            And by the way…wasn’t it you that told us that these processes aren’t understood well enough to quantify their radiative force?

          • bdgwx says:

            RW,

            Let me ask you some questions to help illustrate my point…

            1. How do you explain the mid Pleistocene transition problem without invoking any other forcing agent?

            2. How do you explain the asymmetric behavior where descents into glacial eras are slow, but ascents into interglacial eras are abrupt without invoking any other forcing agent?

            …it’s not an exhaustive list of questions relevant to the topic, but it should spur some thought I think.

          • RW says:

            bdgwx,

            “What I’m saying is that they can’t, by themselves, explain the glacial cycles fully.”

            Yes they can and extraordinarily well. This was the conclusion of Roe’s paper.

          • RW says:

            bdgwx,

            “How do you explain the mid Pleistocene transition problem without invoking any other forcing agent?”

            I’m unfamiliar with it.

            “How do you explain the asymmetric behavior where descents into glacial eras are slow, but ascents into interglacial eras are abrupt without invoking any other forcing agent?

            its not an exhaustive list of questions relevant to the topic, but it should spur some thought I think.”

            No one is claiming there are no other forcing agents. There undoubtedly are, but they’re minor/meager is the point. When Milankovitch forcing is 25-50 times that of GHG forcing, it’s spectacular nonsense to think it isn’t the dominant driving force behind glacial/interglacial transitions, and that rather it is driven by some (tiny) GHG induced positive feedback effect/response. Moreover, it’s even more spectacularly nonsensical to think from this, assuming it were true, that the net positive feedback effect of leaving maximum ice to that of minimum ice where the climate is now can be used to estimate/infer climate sensitivity to increased GHGs in the current climate.

            The main point of contention here is the notion that something about current climate sensitivity can be deduced or inferred from these glacial/interglacial transitions. It can’t.

          • RW says:

            Moreover still, the estimates of high sensitivity (in the current climate) are not mostly from the net positive feedback effect of melting ice, which only plays a small role, but are instead mostly from the (alleged) net positive feedback effect of water vapor and clouds.

            So we have even a 3rd thing here that makes no sense stacked on to the other two.

            Again, the main point in all of this is you can’t infer anything about climate sensitivity from the glacial/interglacial transitions.

          • bdgwx says:

            RW: I’m unfamiliar with it.

            That’s the switch from 40k to 100k intervals.

            RW: When Milankovitch forcing is 25-50 times that of GHG forcing,

            First, no it’s not. We’ve already gone over this.

            Second, how can you make such a statement if you don’t think forcing is even quantifiable to begin with?

          • barry says:

            Roe is unable to explain concurrent warming in the Southern Hemisphere when insolation focus moves Northward, as in the LGM. Roe is speaking mainly about the NH ice sheet. From the closing comments of the paper:

            “This certainly does not rule out CO2 as a primary cause of tropical or other climate variations, or of the apparent synchronization of the ice‐age signal between hemispheres.”

            Much research before and after has investigated the NH/SH synch and the role of CO2 globally during ice age transitions. I don’t know why anyone would tout a single paper, especially a 14 year-old one – as the final wordk, not why anyone would selectively represent its findings.

            It’s an oddly defensive paper – the general consensus at the time, as now, was that the Milankovitch cycles are the ‘pacemaker’ of Qauternary ice age trasitions. Then, as now, the precise degree to which CO2 and ice sheets (and vegetaion and freshwater injections, dust etc etc) fed back on the transitions.

          • barry says:

            …. has been an area of active research.

            To the originating point, climate sensitivty is assessed under different ratio of contributions to the overall change. You can get some kind of estimate whether you give insolation a leading role or CO2 or albedo changes. Climate sensitivity is not bound to a particular forcing, only to changes in RF in general. Doesn’t matter if it’s the sun or CO2, climate sensitivity is much more about the response of the system than the type of driver.

          • RW says:

            barry,

            I can see you missed the point as well. No one is saying there aren’t feedbacks involved in the transitions. There undoubtedly are, mostly from growing/melting ice. The issue is the dominant driving force of the transitions and whether one can deduce anything about the sensitivity in the current climate (from GHGs) from the transitions.

      • “Alleged attempts to estimate climate sensitivity by looking at paleo data are absolute nonsense.”

        Source, please.

        “Milankovitch forcings alone can explain the large temperature changes from glacial to interglacial periods. And extraordinarily well.”

        No, they are far too subtle on their own. They explain the periodicity, not the magnitude. GHG, albedo and other feedbacks are required to explain the magnitude.

        • RW says:

          Milankovitch forcings are estimated to be 50-100 W/m^2. See Roe 2006.

          • bdgwx says:

            That’s the insolation at 65N during the summer. That’s not the same thing as radiative forcing.

          • Nor does it have anything to do with nonsense.

          • The only figure in that range in the article which seems related to your claim is the following: “Figure 1 shows a comparison of the two ice volume reconstructions with variations in daily‐averaged summer solstice insolation at 65N (hereafter referred to as June 65N) for the last 750 kyr. Peak‐to‐peak amplitudes are close to 100 Wm−2.”

            bdgwx is correct, therefore: This is insolation, not forcing. The following discussion quotes a range of 340.545 W m-2 to 304.780 W m-2 across the whole of the last Milankovitch cycle for whole-Earth insolation, or 0.07%. Compare this with 0.08% for the 11-year Schwabe cycle: https://www.sciencedirect.com/topics/earth-and-planetary-sciences/orbital-forcing

            Sceptical Science quotes a variation in forcing of ~0.45 W/m^2 across cycles in orbital eccentricity (https://skepticalscience.com/Milankovitch.html), but does not link directly to a source. If anyone can provide a real paper that actually estimates this figure I’d be grateful. Only so much time. 🙁

          • bdgwx says:

            I’d like to know how that 0.45 W/m^2 is derived as well.

          • RW says:

            Elliot,

            “bdgwx is correct, therefore: This is insolation, not forcing.”

            Insolation is the Sun. How is an increase in the Sun’s energy not a forcing? Now, it’s not a globally averaged forcing increase, but it’s still a forcing increase non the less. It’s just a regional forcing increase.

          • bdgwx says:

            RW,

            Neither the intensity of the Sun nor the aggregate amount of energy received by Earth is significantly different. What changes is the distribution of that energy.

            And we’re not saying Milankovitch cycles do not force the climate. They almost certainly do. What we’re saying that 50-100 W/m^2 is not the radiative force value that you assign to the effect.

            The direct radiative force is close to 0. It is the indirect radiative force that is significant. The indirect action is mainly via the snow/ice albedo feedback. When you change the seasonal and latitude distribution of the insolation you change how the snow/ice mass and extents grow/shrink which in turn decreases/increases the amount of solar radiation that is absorbed. This is what causes the planet warm/cool initially which in turn induces a change in the carbon cycle which then induces further changes in the temperature and so on.

  33. Entropic man says:

    Coronavirus has caused a reduction in pollution in China.

    https://www.bbc.co.uk/news/world-asia-51691967

    This reduced albedo, therefore there is less reflected sunlight and the atmosphere warmed.

    Coronavirus caused February to be so warm.

    • barry says:

      Let’s see:

      China area = 9.5 milion sq km
      Global area = 510 million sq km

      China is 1.8% of the area of the globe.

      The change from global surface temps Nov/Dec/Jan (pretty stable through the months) to February is 0.2C

      All we need to do is get the February surface temp for China. If it is 11 C above the January temp, we have a winner.

      Can we leave the rest to you to confirm or reject your hypothesis, Entropic?

    • “Coronavirus caused February to be so warm.”

      Not an entirely crackpot idea, although as barry points out the magnitudes hardly make it plausible. This reminds me of a recent hypothesis that the so-called LIA was caused by the South American genocides, which led to a collapse in agriculture and widespread reforestation, taking up CO2.

    • Entropic man says:

      I confess.

      I put this up as a spoof denier meme to see if anyone would take it seriously.

      • I heard of a doctor who gives his speciality as “left-ear surgeon”. The joke being that most people can’t tell whether or not he is serious.

        It can be hard to tell with some of the types we get here! Remember that half of them think that science is a socialist plot to take away their guns, based on a naturalistic bias introduced by the famous atheist Isaac Newton.

      • barry says:

        Hah, it’s hard to tell between spoofs and the real thing.

  34. Snape says:

    The warming should also be evident in the surface based records. Not sure if that will be the case:

    https://moyhu.blogspot.com/2020/03/ncepncar-reanalysis-monthly-surface.html?m=1

  35. Scott R says:

    I’m still suspicious of this number. NoExt has got to be very high to cause this, and the one point of data I have right now for the USA doesn’t show this. Anyways, as predicted the heat will be short lived. The NH has just crashed unless I’m not understanding this new to me tool correctly.

    bdgwx?

    http://www.karstenhaustein.com/reanalysis/gfs0p5/GFS_anomaly_timeseries_global.html

    • bdgwx says:

      The extreme drop you see is actually part of the 7-day GFS forecast.

      Note that upon upgrade of the GFS to the new FV3 core last year the GFS has shown an unusual cold bias. You can see the forecast bias on the second chart on the main page.

      I don’t usually look at the GFS for the global mean temperature. It is not really designed to measure the global mean temperature (sort of…its complicated). It is not a reanalysis tool. It is designed for realtime forecasting. BTW…it’s cool bias is probably affecting its forecasting skill. I’d imagine the modelers are working on the problem.

      If you look in the middle of the page you’ll see the month to date NCEP/NCAR reanalysis charts. Use that instead.

    • bdgwx says:

      You were right. NoExt had a big jump. The data file has been updated.

      • Scott R says:

        NoExt looks just like what happened in Feb 2016 during the super enso. This may not be an official ENSO, but the tropics are warmer than they were during the official ENSO and the NH mid latitudes sure responded like that this winter. Will it take the hard post enso drop again? Stay tuned.

      • bdgwx says:

        I think it may have been due to the record smashing +AO. Nino 4 region is pretty warm though so who knows. Either way a big drop is inevitable I think. The trend line is only at +0.31C right now.

  36. Dirk McCoy says:

    Dr Spencer, how does recent warming compare with 1920s warming? Was there a CO2 component to 1920s warming? If not, do we know what the cause was? Do we know its not the same cause now?

    I suppose I could ask Midas and Bignell but not sure theyd give me an answer based on data or just name calling and snark.

    • Rob Mitchell says:

      Dirk, they will just throw you into the “denier” club. That is their strongest “scientific” argument.

    • bdgwx says:

      CO2 level around 1920 was about 300 ppm. This put a force of about 5.35*ln(300/280) = +0.37 W/m^2 on the planet. If you assume a climate sensitivity of 0.5C per W/m^2 then this contributed about 0.2C of warming lagged through about 1950 or so. Some of the warming to 1960 was the result of quiescent volcanic activity and the grand solar max as well.

      If you look at the second chart on the wikipedia page for global warming you’ll a representative overview of what was natural and what was anthroprogenic.

      https://en.wikipedia.org/wiki/Global_warming

    • The signature of anthropogenic warming may be discernible as far back as the 18th Century, according to interpretation, and certainly for most of the 20th. The Industrial Revolution, Parliamentary Enclosures and even commercial whaling could all leave a trace, in principle The further you go back, the smaller the anthropogenic component relative to the natural variations. Without knowing in more detail what exactly you are asking about it’s hard even to know where to look for an answer.

      Looking at the graph bdgwx indicated, it strikes me that the interesting feature is really the sharp declines in natural drivers after 1960. This has the effect of separating the aggregate effect into two apparent periods of increase, as one set of causes increases fairly smoothly and another stalls. The 20s warming does not seem anomalous if you consider the spike around the 1940s to be the separate event – it matches post-1960 increase fairly well if you smooth past that peak.

      I have to resort to guesswork now, so you should listen to my more numerate fellows above me, but it looks to me like the spike follows after a latency from the pre-1929 boom. Anthropogenic AND natural drivers remain fairly flat from about 1930 to 1960, so that 1940s peak might be a pulse in boom-era CO2 working through.

    • Arless McGee says:

      Dirk McCoy,
      Yes there was/is a CO2 component to 1920’s warming. CO2 started rising steadily worldwide around 1860, see any CO2 graph. The global surface temp started rising steadily and worldwide fifty years later, around 1910, see any global surface temperature graph.

      So there is that for a ‘CO2 component to 1920’s warming’.

  37. Eben says:

    Looks like climate fight broke out in here

  38. Pft says:

    Ok, 0.76 deg C above the mean of 1981-2010. What is the SD of the Feb data for the period (1981-2010)?

  39. Richard says:

    Anthropogenic CO2 production is at a historic low and set to continue like that for the next few months.

    At the same time the atmospheric CO2 growth rate has remained unchanged.

    This suggests that anthropogenic CO2 production has a minimal effect on the atmospheric CO2 growth rate.

    Perhaps the global uptick in temperature is affected by the reduction in anthropogenic particle production that occurs when the CO2 production declines?

    • barry says:

      “Anthropogenic CO2 production is at a historic low”

      Oh please. Historic lows are next to zero. What on Earth are you talkig about?

      Do you mean that US annual CO2 output is a bit less than the year before? Reference please.

      “At the same time the atmospheric CO2 growth rate has remained unchanged.”

      The growth rate a href=https://www.esrl.noaa.gov/gmd/ccgg/trends/gr.html>always has fluctuations, so that is already a non-valid statement.

      “This suggests that anthropogenic CO2 production has a minimal effect on the atmospheric CO2 growth rate.”

      There are various natural influences on fluctuations in the growth rate, most notably ENSO cycles, but the overall trend is upward, and the correlation with anthro emissons/long term growth rate is robust.

      “Perhaps the global uptick in temperature is affected by the reduction in anthropogenic particle production that occurs when the CO2 production declines?”

      CO2 production is the same as last year, and the drop on coal power is offset from burning oil and natural gas. While advanced economies experienced a drop in fossil fuel usage for energy, non-advanced economies had a big increase.

      https://www.iea.org/articles/global-co2-emissions-in-2019

      IOW, the air doesn’t look to be a whole lot cleaner this year. But perhaps you could find an index that directly measures that quantity. It would help make your case. But then you’d have to factor in other variables, like cloud cover. And then you’re headed down the rabbit hole.

      • Richard says:

        CO2 production is significantly smaller than last year
        https://edition.cnn.com/2020/03/01/world/nasa-china-pollution-coronavirus-trnd-scn/index.html
        it is also worldwide and not about to stop soon.
        In general the market indexes are good indicators of CO2 production and world markets are all showing big drops.

        Atmospheric CO2 is not picking up this drop :
        https://www.co2.earth

      • Richard says:

        CO2 production has fallen dramatically in China
        https://edition.cnn.com/2020/03/01/world/nasa-china-pollution-coronavirus-trnd-scn/index.html
        and the same situation is occurring in many other countries. Market indexes are generally a good indicator of CO2 production and markets worldwide are affected.

        At the same time the atmospheric indicators do not show any change
        https://www.co2.earth

      • barry says:

        Richard, you hqve absolutely zero basis on which to claim CO2 production is at ‘historic lows.’ The CNN article is not about CO2, it’s about nitrogen oxide pollution levels.

        “It is also wordlwide” refers to the coronavirus, not some drop-off in CO2 emissions.

        You are conflating all sorts of ideas, ad you are basing your prognostication of a change in annual emissions on 2 month’s activity in part of China.

        It may turn out CO2 levels drop – and they will over NH Sring as plant growth sucks up CO2 as part of the normal annual turnover. But correlating a cople months CO2 emissions with atmospheric concentration is waaaaay too premature. And you don’t actually have emissions data.

        “Historic lows” – extremely fake news.

        • Richard says:

          The aircraft industry is cancelling flights
          https://www.reuters.com/article/us-china-health-airlines/factbox-airlines-suspend-flights-due-to-coronavirus-outbreak-idUSKBN20Q2XA
          but not just to China. As the virus spreads through Europe it is already having a big effect on flights and is gradually affecting business. Large meetings and sporting events are being cancelled.
          This will happen in the US too.

          For example alarmists would have us stopping using air transport but when worldwide air transport does significantly reduce there is no measurable effect.

          • Midas says:

            In 2018, plane flights accounted for 2.4% of CO2 emissions.
            What percentage of ALL FLIGHTS GLOBALLY have been cancelled?

            Let’s say it’s as high as 5% (it would be nowhere near that, given that the majority of cancellations are only for flights to and from China).
            That makes a drop-off of CO2 accumulation rates of 0.12%.

            The increase in concentrations from December to January was less than 2 ppm. The vast, vast majority of that change is seasonal and has nothing to do with how much CO2 we emit. The average monthly increase in concentrations (ie. averaged over the whole year to remove the seasonal component) is about 0.2 ppm.

            0.12% of that is 0.00024 ppm.

            How would you expect to notice that kind of change when the figures they put out are given only to 3 decimal places?

            Seriously – try to do RESEARCH and THINK before making one of your BS claims. Your ‘gut’ clearly doesn’t work for you.

          • barry says:

            Did SARS draw back CO2 rise in 2003? Nope it made no dent. Industry slowed down consistently in Chiona over 3 months.

            https://www.cnbc.com/2020/02/11/coronavirus-4-charts-show-how-sars-hit-chinas-economy-in-2003.html

            Probably CV will have a bigger impact on Chinese industry, and China is the single largest emitting country in the world, but still only a fraction of worlwide emissions.

            Know what did reverse global CO2 growth? The global Financial Crisis 2008/9. For a year. So we could possibly,/i> see a similar reverse this year, but it is by no means certain and is in any case way too premature to verify.

            Naming even the worst possible outcome “historic lows” is just fatuous nonsense. Actual historic lows would he several orders of magnitude less than recent history. It was only 300 years ago that industrial output of CO2 was zero.

          • barry says:

            I must criticise myself for downplaying here:

            “China is the single largest emitting country in the world, but still only a fraction of worlwide emissions.”

            Well, it’s nearly a third of global ,so a very significant fraction, and industry makes up 2 thirds of China’s emissions, so about a quarter of global emissions.

        • Bindidon says:

          barry

          FYI, so looks the NO2 pollution today, 04 03 2020:

          https://tinyurl.com/toz3wlv

          It’s indeed a little bit less dark than 4 weeks ago… /sarc.

          This CO2 decrease due to China’s production decreasing is laughable.

          Rgds
          J.-P. D.

          • Richard says:

            China’s current reduction in CO2 is approximately 100MtCO2 – or 6% of global emissions over the same two-week period following the Chinese new year holiday in 2019.

            https://www.carbonbrief.org/analysis-coronavirus-has-temporarily-reduced-chinas-co2-emissions-by-a-quarter

            But the effect has already extended well beyond China’s borders. Asia, India, Russia and Europe have also been affected. In the next week or so the US will feel the direct impact.

            This is already more significant than the financial crisis of 2008 and the SARS.

            We can discuss the definition of what value a historic reduction in world CO2 emissions must be however a 5% drop in global anthropogenic emissions should be measurable in the atmosphere.

            When I referred to the atmospheric growth rate of CO2 I meant the yearly trend. So for a given month one can compare the value for the same month of the previous year. For example we can compare January 2019 with January 2020. I’m sorry, thought people consulting this site would automatically understand this.

            I don’t understand the relevance of comparing values over a 4 week period?

          • Nate says:

            Richard, the problem is that the growth rate of co2 shows large variation ~ 50% on time scales of months to a coiple of years from natural source sink variation, due mostly to ENSO.

            http://woodfortrees.org/plot/esrl-co2/mean:12/derivative

            Your 5% short term drop in anthro emissions will be buried in the noise.

          • barry says:

            Ditto Nate.

            http://www.drroyspencer.com/2020/03/uah-global-temperature-update-for-february-2020-0-76-deg-c/#comment-441994

            That’s what 2 contributors to this baord think, Richard. And yes, we wonder why on Earth someone would estimate yearly amounts based on comparing a couple of 4-week periods.

            Too quick, monsieur. Be patient.

    • barry says:

      formatting properly

      The growth rate always has fluctuations, so that is already a non-valid statement.

    • E. Swanson says:

      DRsEMT, Again, for those who may be interested, my previously posted objections to Hughes’ work may be found
      HERE, HERE and HERE.

    • Dan Pangburn says:

      Dr,
      Sorry, but you have been egregiously misled. The experimenters lack of engineering science skill, especially a lack of understanding of radiation heat transfer has resulted in an experimental setup which is a very poor representation of the idealized green plate problem. Some things not considered include view factors plate to plate and, between plates and surroundings. Also, the brief transient and poor coupling to the green plate resulting in such little warming of the second plate that, to the first plate, within the accuracy of measurement, it never looked much different from the ceiling or top cover. The second plate needs to shield from a cold background to make a difference.

      The GHE shields from the cold (about 2.7 K) cosmic background.

      A better experiment is described here: https://app.box.com/s/5wxidf87li5bo588q2xhcfxhtfy52oba

      The common observation that cloudless nights cool faster and farther where it is dry than where it is humid demonstrates that the misleadingly named greenhouse effect exists and that it is caused by water vapor.

      • Dr Roys Emergency Moderation Team says:

        “The GHE shields from the cold (about 2.7 K) cosmic background.”

        Swanson’s experiment does none of the things you criticize any better, but it’s nonsensical to refer to the “temperature” of space. A vacuum does not have a “temperature”. Yes I am aware of the CMBR and the origin of the 2.7 K but from a radiative heat transfer perspective, referring to space as having a “temperature” is ridiculous.

        • bobdroege says:

          If there is matter, it has a temperature, and there is no perfect vacuum.

          Space does have a temperature and it varies.

          It’s amazing the things you will say to support your arguments against the greenhouse effect.

        • Dan Pangburn says:

          Dr,
          Sometimes it is better to remain silent and have people speculate that you might be unjustifiably biased than to speak up and remove all doubt. Neither Swanson, nor I (also an MSME) said or implied that space has a temperature. In fact, a word-search confirmed that neither of us even used the word space.

          If you had any competence in radiation heat-transfer analysis you might be able to recognize what was wrong with what Hughes did and what Swanson did that was better and that his experiment verified that which anyone competent in heat-transfer analysis already knew.

        • Dr Roys Emergency Moderation Team says:

          Mixed messages from bob and Dan, there.

    • Midas says:

      Please illuminate us with the author’s science credentials.

    • Dr Roys Emergency Moderation Team says:

      …and we discussed your objections here, Swanson:

      https://www.drroyspencer.com/2020/02/uah-global-temperature-update-for-january-2020-0-56-deg-c/#comment-435534

      …as well as in the comments at the linked articles, which also include a discussion of your experiment, which Dan linked to (particularly in the first article).

      Everything is covered.

  40. Tim S says:

    This is an interesting development, but anecdotes and single data points do make trends or good science. March and the rest of the year will be very interesting, especially if ENSO goes toward a La Nina period.

    • Forgive me for being cynical, but it seems that this entails a definition of “interesting” which favours decrease. The REALLY interesting thing would be a la Nina during which temperatures continue to rise. But that’s quite unlikely.

    • barry says:

      “Link from NoTricksZone”

      The website dedicated to unearthing any paper that seems to call AGW in to question, even when it doesn’t.

      Here is a case in point. This paper examines the relative effects of short wave (solar) / long wave (atmosphere/terrestrial) radiation on changes in… climate complexity.

      • barry says:

        I know! First para of the conclsions section:

        “The thermodynamic state of the Earth is maintained by a balance between incoming solar radiation and outgoing shortwave and longwave radiation from Earth; changes in the outgoing radiation field generate an energy imbalance which is the driver of current climate change.”

        I prefer to think notricks is fooling themselves. That’s funny. I prefer not to believe that notricks actually understands the papers they link, and deliberatelty distorts the meaning.

      • Dr Roys Emergency Moderation Team says:

        …and it goes on to say:

        “Our research supports the idea that clouds and albedo, which ultimately determine the SW radiation, are variables of the utmost importance for current climate change, in agreement with previous research about the changes in stratocumulus or energy imbalance in the last four decades for example. An increase in cloud coverage of 0.1 would, on average, lead to a 7% increase in spectrally integrated global average reflectance of shortwave radiation55. The Decadal Survey for Earth Science and Applications from Space (2018) lists as one of the key science questions “how changing cloud cover and precipitation will affect climate, weather and Earth’s energy balance in the future”. We investigated the hypothesis that changes in clouds are responsible for the changes in SW radiation by calculating the evolution of complexity of cloud amount using ISCCP data, showing an increase in predictability and lower ApEn values, similarly to SW radiation. Even though the hypothesis of variations in cloud amount could explain the changes in SW radiation and the changes observed in the Transfer Entropy analysis, it is not possible to guarantee that clouds are the only factor since climate is a highly interconnected system, as reflected in the complexity of General Circulation Models.”

      • barry says:

        None of that puts even a sign on the effect of clouds on recent clmate change. Or do you think this:

        “An increase in cloud coverage of 0.1 would, on average, lead to a 7% increase in spectrally integrated global average reflectance of shortwave radiation”

        is what they think the impact of cloud complexity changes have has on recent climate – the opposite driver to what would explain warming?

        No, the bit you quoteddoesn’t go that far. ‘Utmost importance’ doesn’t say what the impact of shortwave radiation on recent climate change actually is, only that it is significant and important, and it is about complexity and dynamics.

        The statement I quoted was the firmest in the paper on attributing radiation to current climate change. notricks must be hoping that word like ‘utmost importance’ reveal more about cause of recent climate change than they actually do. I hope you haven’t been hoodwinked.

      • Dr Roys Emergency Moderation Team says:

        Their argument is based on Figures 1 and 2.

      • barry says:

        Their argument that there seems to be a correlation between a reduction in cloud complexity and short-wave radiation complexity is not based on Figs 1 and 2, but on detrended versions of those data.

        “We investigated the hypothesis that changes in clouds are responsible for the changes in SW radiation by calculating the evolution of complexity of cloud amount using ISCCP data, showing an increase in predictability and lower ApEn values, similarly to SW radiation.”

        “Here we use the MERRA-2 hourly data record since 1980 for global shortwave and longwave radiation, analyzing each year (approximately 8760 points) of the time series separately. Before applying the complexity algorithms to the dataset, we transform the values using a log-ratio (log st/st−1) transformation to induce stationarity and to be able to measure the real complexity of the data, not any trends or seasonal cycles which may exist.”

        I’m going to bet this paper is making a stir in skeptic circles, and they’re all trying mighty hard to ignore what the paper is actually saying and come up with their own interpretations.

        Looks like you’ve drunk that Kool-Aid.

      • Dr Roys Emergency Moderation Team says:

        I was talking about NoTricksZone.

      • barry says:

        That makes complete sense.

      • Dr Roys Emergency Moderation Team says:

        Maybe just read the article.

      • Dr Roys Emergency Moderation Team says:

        There is more than one way to interpret results.

  41. Eben says:

    If you people were willing to learn some fizzix and look up how turbulent / noisy / chaotic systems behave , you would find out there is no trend in this data set, but I’m kinda tired of explaining it.
    Only the people who keep slicing and dicing the numbers every which way are trying to convince you there is one by peeing on your feet and telling you its raining.

    • barry says:

      This comment isn’t a promotion of physics so much as a rejection of statistics. The latter quantifies the former. Noisiness is quantifiable with statistics, so is turbulence. Which is why flying is safer than driving.

      IOW, you have no idea of what you speak.

      • Eben says:

        You are one of the classic shyster spreading nonsense
        This classic line that flying is safer than driving is another fallacy concocted by comparing all drivers and passengers to commercial airline travel, which is comparing apples and oranges.
        As soon as you compare private pilots and regular drivers in the proper context you are 20 times more likely to die in an airplane than a car accident.
        Your straw-men claim that flying is safer than driving is exactly just like your climate shystering.you have no idea what the context is

      • barry says:

        Yawn, it’s statistically true, and its a rhetorical point designed to make it comprehensible. The quantitative point is about analysing turbulence. Despite chaotic winds and thermals, which is far ‘noisier’ than global average temperature – turbulence that you think makes things too unpredictable to be analysed – it’s still modeled well enough for you to safely get on a plane.

        In plain english in case anyone else is as ignorant as yourself: we build things every day that have turbulence modeled into their tolerances. Announcing that a system is unquantifiable (such as deriving a trend) just because the system has noise is pretty damned ignorant. The world you live in is not in danger of grinding to a fiscal halt just because economists can’t predict the day to day rise and fall in market values. This ‘noise’ has little impact on the long term (multidecadal) trend.

        You’re just flapping your jaws, or you’d mount a more credible defence.

      • Nate says:

        ‘private pilots’ are apples?

        OMG.

  42. Midas says:

    UAH February Data with all non-weak ENSO events removed:
    https://tinyurl.com/UAH-Feb-Neutral
    (ie. it includes neutral years, weak El Ninos and weak La Nina)

    • Bindidon says:

      Midas

      Nice little job! Thanks for doing that.

      I suppose you use Excel or Libre Office Calc.

      You could, in addition, right-click on a dot, and add a trend line.

      Moreover, you might respecify the graph’s mode, and click on ‘Lines only’, so we can better see how your time series behaves.

  43. Midas says:

    I deliberately chose not to show lines or a trend line. I think the points themselves show what I wanted to show.

  44. bdgwx says:

    The ONI for DJF just got updated. 0.5

    The last 6 months…

    2020-01 (DJF) = 0.5
    2019-12 (NDJ) = 0.5
    2019-11 (OND) = 0.5
    2019-10 (SON) = 0.3
    2019-09 (ASO) = 0.1
    2019-08 (JAS) = 0.1

  45. Midas says:

    Scott R
    What happened to the La Nina you said we would definitely have by February?

    Ren
    What happened to the La Nina you said we would definitely have by November?

    • Scott R says:

      Midas,

      When did I say “definitely by February”? I doubt I said that. The picture has not changed at all, we are still in the 3.6 year harmonic, waiting for the la nina down beat that occurs around every 11 years approximately 3.6 years after the solar min. See here…

      https://www.facebook.com/100000276969216/posts/2979081735444363/?d=n

      It is possible that this wave is being extended by the Jupiter / Saturn conjunction. Looking at the other conjunctions, it does seem to amplify / extend the 3.6 year wave, except when the conjunction location is near earths perihelion. Since it is near earth’s aphelion, the SH received extra energy this summer. On the other hand, the arctic received less energy last summer which is why the arctic ice continues to recover.

  46. Midas says:

    Greg (in response to your comment near the top of the thread)

    But we HAVE had variation in the last 50 years. It hasn’t disappeared. Have you forgotten the “Pause”?

    https://tinyurl.com/Trend-plus-Variation

  47. Eben says:

    It should be evident to anybody by now that the warming pushers in here don’t know anything about actual climate, they just pretend by drawing straight lines through snippets of data and coloring cherry picked charts bright red to show the parts they want to be seen and hide the parts they don’t.

    • bobdroege says:

      It’s getting hot in herre so hot, so take off all your clothes
      I am getting so hot, I wanna take my clothes off

      nelly

  48. Erik Aamot says:

    Roy,

    Northern Hemisphere +0.96
    Artic …………. +0.02

    how does that happen?

    anyone? anyone?

    • Bindidon says:

      Erik Aamot

      (sounds Norwegian to me)

      You raised an interesting question, and I have some idle time.

      Here is a plot of the differences ‘ NH minus Arctic ‘ :

      https://drive.google.com/file/d/1AvH9ijYhFfZJy8TJ6ZRNcQxIXfurq5R8/view

      Alles gut! Nothing really unusual, in either direction…
      Average difference: -0.04

      Rgds

      J.-P. D. (Germoney)

      • Erik Aamot says:

        yes .. father was Norwegian, Bjorn

        Brother’s name Leif .. Sister is Liv

        no trends in the differences really

    • bdgwx says:

      A positive AO phase might do this. The AO was at record high levels in February.

      • Midas says:

        Correct me if I’m wrong, but I was under the impression that a positive AO merely aided in trapping the cold in the Arctic allowing sub-Arctic regions to stay warm. Same total heat, just differently distributed.

      • bdgwx says:

        I was thinking of heat reservoir transfers. I think the +AO leading to a cool Arctic probably wouldn’t attract much debate. It’s the warming NH overall that I don’t fully understand. But I was thinking the heat could come from the hydrosphere or perhaps even the cryosphere. Ya know…snow mass is running pretty high this winter and freezing water gives heat back to the environment. Did the heat come from the enthalpy of fusion?

    • MrQ says:

      Arctic Oscillation and Polar Vortex Analysis and Forecasts
      https://www.aer.com/science-research/climate-weather/arctic-oscillation/

    • barry says:

      Erik,

      How does what happen? Just displaying the values doesn’t help us understand what you’re asking.

  49. Pft says:

    Thank you

    • Midas says:

      Yes – your point??

    • Dr Roys Emergency Moderation Team says:

      Kids these days.

      • bobdroege says:

        See ya next time you come around with your green plate, greenhouse, no temperature in space, and second law Bull****!

        • Dr Roys Emergency Moderation Team says:

          So all those sources are wrong!?

          • bobdroege says:

            If you mean all the sources that say there is no green plate effect, no green house effect, no temperature in space, and that the second law prohibits heat transfer from cold to hot, then yes they are wrong.

            Your last cite says there is a temperature in space, perhaps it is your reading comprehension that is lacking.

            Therefore, the 2.7K temperature of the CMB may be quoted as the “temperature of space”- it is perhaps the best way to characterize the energy content of empty space. Of course, 2.7K is pretty cold! Basking in the CMB is no way to get a tan!

            Just because you find someone on the internet that spouts some bull**** doesn’t mean they are right.

          • Dr Roys Emergency Moderation Team says:

            I can read them fine, and agree with them. That’s why I linked to them. I said from the start I was well aware of the CMBR, the 2.7 K and everything else.

          • bobdroege says:

            So you agree with principia-scientific?

            That’s to be expected considering your display of scientific understanding.

            So here’s a quiz, identify the error in the science guys post.

            But there may be more than one, but give it your best shot.

          • Dr Roys Emergency Moderation Team says:

            “That’s to be expected considering your display of scientific understanding.”

            Thanks.

          • bobdroege says:

            You are of course, most welcome.

            Just remember, any one who tells you there is no greenhouse effect is lying.

            That is because you can’t figure it out for yourself, and you have to rely on the opinions of others.

          • Dr Roys Emergency Moderation Team says:

            I used to believe in the GHE, a long time ago. Then I figured out for myself, there is no GHE. I started by arguing Devils Advocate.

          • bobdroege says:

            It is not something to believe in.

          • Dr Roys Emergency Moderation Team says:

            I’ll say.

          • bobdroege says:

            In order to play devil’s advocate you need to understand logic.

          • Dr Roys Emergency Moderation Team says:

            Yes, I did have an advantage there.

          • bobdroege says:

            I would say logic is not your strong suit.

          • Dr Roys Emergency Moderation Team says:

            Of course you would.

          • Nate says:

            Red red herring….

            Just so glaring…

            Its a thought experiment. Space is just a massive heat sink held at 3K.

            If instead of space it was a big black-body wall like the monolith in ‘2001’ held at 3 K, the problem would be unchanged.

            The heat flow from the GPs would still be 200 W.

    • barry says:

      A silly argument over what is essentially a semantic issue (what is ‘space’?) that makes no material difference to the much-debated topic of radiative transfer and multi-coloured plates.

      If the plates were not powered and cooled down completely, they would be 2.73 K or greater. That is the radiative temperature of the universe, with which the plates would be in equilibrium. They would never get to 0 k (or ‘no temperature’) in this universe.

      • Dr Roys Emergency Moderation Team says:

        It makes quite a big difference, actually, barry.

        You probably didn’t read the relevant parts of the discussion last month.

        Oh well, I’m not explaining it again…if you can’t be bothered to keep up, you lose out. That’s your problem.

      • barry says:

        Heh. I’m sure you have excellent reasons to inform me that you won’t be informing me.

      • barry says:

        Thanks for that. Your view is quite puzzling.

        If ‘space’ = “the absence of a physical system”…

        To what does the plate system lose its thermal energy? If there is zero environment beyond the outer faces of the green plates, then you have a closed system at the boundary of the GP outward faces, and energy cannot be transferred away from the sytem.

        Could you clarify? How does energy transfer to anything that is not physically there?

      • Dr Roys Emergency Moderation Team says:

        https://en.wikipedia.org/wiki/Thermal_equilibrium

        “Two physical systems are in thermal equilibrium if there is no net flow of thermal energy between them when they are connected by a path permeable to heat”

        There is a path permeable to heat between the plates, and no net flow of thermal energy between them when they are at 244 K…244 K…244 K…so the plates are at thermal equilibrium when separated.

        You also can’t include the so-called “temperature of space”, 3 K, into your considerations, since a vacuum doesn’t have a temperature, and the CMBR is too insignificant to include. You just consider the (lack of) net flow of thermal energy between the plates. The RHTE (radiative heat transfer equation) already includes the SB terms for the green plates, so the fact that they are emitting to space according to their temperature and emissivity is already taken into account when calculating that there is zero heat flow between them at 244 K…244 K…244 K.

        • bobdroege says:

          So logically, if the green plates are emitting to space according to their temperature and they are not being heated by the blue plate, because they are at thermal equilibrium, therefore the green plates must be cooling.

          But you claim they are not, therefore we have a contradiction, so your solution is wrong.

          You have a remarkable Kung-Fu death grip though.

          • Dr Roys Emergency Moderation Team says:

            Equilibrium does not mean equilibrium, for bob.

          • bobdroege says:

            Equilibrium has left the building.

            Your solution is not the equilibrium solution, actually there is no equilibrium solution because there has to be heat flow out of the system.

            What will you trip over next?

            Find another internet source that you will misunderstand.

          • Dr Roys Emergency Moderation Team says:

            There is no contradiction. The green plates are in equilibrium with the blue, and radiate outwards based on their temperature and emissivity. There is 400 W in to the system, and 400 W out.

          • bobdroege says:

            The heat flow path is heater to blue, blue to green, and green to space, but since there is no heat transfer from blue to green because they are at the same temperature there is no flow through the whole system.

            That’s one reason your solution breaks down.

          • Dr Roys Emergency Moderation Team says:

            What is being heated up in space?

          • bdgwx says:

            Another problem with the diagram is that the BP is shown to be radiating at 400 W/m^2 which means the 244K label must be wrong.

          • Dr Roys Emergency Moderation Team says:

            Which diagram, JD’s!?

            https://postimg.cc/KKx5hx4H

            In that diagram, there is the standard 200 W/m^2 being emitted by the blue plate (note the blue arrows…all the arrows are color-coded, you see). The additional green arrows going back from blue to green represent energy from the GPs that is scattered back towards the GPs from the BP rather than getting absorbed, due to a mismatch of photon wavelength. That is how he would have explained it.

          • bdgwx says:

            Yes. That diagram. It shows 400 W/m^2 coming from the BP. How do you get 244K from 400 W/m^2?

          • Dr Roys Emergency Moderation Team says:

            “It shows 400 W/m^2 coming from the BP.”

            No, it doesn’t, as I literally just explained.

          • bobdroege says:

            DREMPTY asks

            “What is being heated up in space?”

            Nothing, as there is nothing to heat up in our system or you BS diagram.

            The photons just keep going.

            So how far away is the source of the cosmic microwave background?

          • bobdroege says:

            Now we have a new story from the peanut gallery.

            Now the radiation from the green plate is being scattered.

            “The additional green arrows going back from blue to green represent energy from the GPs that is scattered back towards the GPs from the BP rather than getting absorbed, due to a mismatch of photon wavelength. That is how he would have explained it.”

            There is no mismatch of photon wavelength because the plates as you specify, are at the same temperature.

            There is “only one way out” of this argument, that is to admit you are wrong.

          • Dr Roys Emergency Moderation Team says:

            That’s not a new story, it’s what JD used to argue. His “way out” would have been that you have to consider the BP as being infinitesimally warmer than the GPs.

            The main point (which I would agree with) is that the GP energy can’t make the BP warmer, because ultimately it comes from the BP in the first place. What you consider to be happening with the GP energy that goes from GP to BP is open to interpretation, but it can’t warm the BP.

            “Nothing, as there is nothing to heat up in our system or you BS diagram.”

            Exactly.

          • bobdroege says:

            DREMPTY,

            so it just goes to your assertion that the green plate can’t warm the blue plate because you don’t understand the second law of thermodynamics.

            “The main point (which I would agree with) is that the GP energy can’t make the BP warmer, because ultimately it comes from the BP in the first place. What you consider to be happening with the GP energy that goes from GP to BP is open to interpretation, but it can’t warm the BP.”

            Nope, wrong.

            And the scattering angle is new, you clowns used to say the blue plate reflects, now it is scattering.

            Both wrong, the plates have emissivities of 1, so they absorb all the radiation they receive.

          • Dr Roys Emergency Moderation Team says:

            To which he would have responded: “a BB is an imaginary construct, that doesn’t mean you can use it to get around the laws of physics”.

          • bobdroege says:

            You can’t squirm out of it that way snake.

            There are materials that have emissivities close enough to 1 for the purposes of solving a homework problem or doing an experiment.

          • bobdroege says:

            It violates the laws of physics for one object to emit at one emissivity and then reflect or scatter with a different emissivity.

          • bobdroege says:

            The blue plate is heated to 290 by the heater, not by the green plates.

          • E. Swanson says:

            DRsEMT again ignores the main fallacy of his argument. If the Green plate in the three plate exercise, assuming 1 m^2 plates, each Green plate will emit 200 watts on each side. That’s a total of 400 watts per plate or 800 watts for both Green plates.

            Where does that 800 watts come from, other than the Blue plate?

          • Dr Roys Emergency Moderation Team says:

            I just linked to a response. The heater. Makes as much sense as bob’s response.

          • E. Swanson says:

            DRsEMT, In the model, your heater powers the Blue plate with 400 watts. Since the three plates are not in physical contact and the space between is a vacuum, the heater doesn’t directly power the Green plates.

            Question? Do you do anything with your life except post BS here.

          • Dr Roys Emergency Moderation Team says:

            Answer: yes.

            Want to know how to get me to stop commenting? Just stop responding to me.

            https://www.drroyspencer.com/2020/03/uah-global-temperature-update-for-february-2020-0-76-deg-c/#comment-444126

        • barry says:

          Still don’t see why it matters if space is 3k or zero k. whether space is a physical thing or not is more of a philosophical question than a point that materially affects the topic. IOW, these are meaningless diversions.

          All that matters is that the universe is very cold – cold enough that we don’t have to worry about adjusting the energy rate of the plate system to space, and to keep things simple. Giving the space ewnvironment a temperature of 2.7K might change the values a bit, but wouldn’t materially affect the argument.

          Still don’t see how the GPs are radiating at the same temp as the blue, when they only get half the ewnrgy of the blue each. Not physically possible. space is not impeding the outflow from the GPs, so they can’t possibly get as warm as the BP. The BP just isn’t giving each GP enough energy.

          • Dr Roys Emergency Moderation Team says:

            It’s not a question of whether it’s 0K or 3K. Pay attention, barry.

          • Nate says:

            DREMT doesnt get that all heat transfer problems are simply boiled down to a set of boundary conditions, BC.

            In this case the space BC is simply a fixed temperature (3K) plane.

            External details are irrelevant. It may as well be a big black wall.

            A big black wall held at 3K would also require the GP to emit 200 W of heat flow to it.

            So yes it is a big red herring, that allows D to continue evading the very real problems we have raised with his ‘solution’.

          • barry says:

            I’m paying attention, DREMT, but you are evading points and answering with non-sequiturs like, “pay attention.” That was old long ago. it doesn’t get any more persuasive with repetition. “Pay attention” is a purely rhetorical device, all the more obviously so when nothign follows it.

            I answered your point on whether space has physical attributes, and you ignored it. You just keep kicking the can down the road whenever someone deals with your BS.

            The GPs cannot be the same temp as the BP when they each receive half the energy of the BP.

            You have NEVER dealt with this point. You can’t do it without resorting to rhetoric. You simply don’t have a phyiscal explanation for this challewnge or you would have presented it long ago.

          • Dr Roys Emergency Moderation Team says:

            But you haven’t been paying attention! It’s not a question of 0K or 3K, it’s a question of 3K or no temperature. “No temperature” does not equal “0K”, “0K” is still a temperature.

            It’s as fundamental as claiming that the space boundary conditions are a fixed temperature (3K) plane. Obviously wrong, because if you had the blue and green plates pressed against a big black wall held at 3 K, and you had any sort of realistic materials, there would be a temperature gradient through the plates such that the side of the GPs touching the big black wall would have to be right down to 3 K in temperature!

            I “dealt with” the point you bring up again the first time you brought it up, last month. In fact, I had actually dealt with it before you brought it up, as I then had to link back to the comment a couple of times for you to actually acknowledge it. You just don’t like the response.

          • Nate says:

            “bviously wrong, because if you had the blue and green plates pressed against a big black wall held at 3 K”

            He evades answering with another big red herring!

            Pay attention! The big black wall is where the radiated heat goes.

            No one has suggested pressing the GP against a big black wall, dumbass!

          • Dr Roys Emergency Moderation Team says:

            OK barry, I will answer your question as bob responded to my point, above:

            The green plates are heated to 244 K by the heater, not by the blue plate.

          • bobdroege says:

            Again Drempty trips over something simple.

            The green plates are not in thermodynamic contact with the heater, thus they are not heated by the heater, they are heated by the blue plate.

            Which has to be at a hotter temperature in order to do that.

          • Dr Roys Emergency Moderation Team says:

            Last time you were all arguing the surplus energy for the blue plate was a result of a drop in temperature of the green plates, such that there was 400 W in, but less than 400 W out, overall. That same surplus can warm the green plates, though. If the BP were to warm, you then have a thermal gradient between the BP and the GPs, and heat flows until the BP is back to 244 K.

            So, ultimately you can argue that the additional energy for the GPs to maintain their 244 K temperature comes from the heater.

          • bobdroege says:

            Right, but you deny that there is heat flow from the blue plate to the green plates because you demand that they are at the same temperature.

            As long as the blue plate is hotter than the green plates, yes you could say the heater is heating the green plates.

            But that’s not your argument, now is it?

          • Dr Roys Emergency Moderation Team says:

            bob can’t deal specifically with the argument I just outlined, so just waffles something out and hopes for the best.

          • bobdroege says:

            Confused again are you?

            “Last time you were all arguing the surplus energy for the blue plate was a result of a drop in temperature of the green plates, such that there was 400 W in, but less than 400 W out, overall.”

            Nope, we were arguing that the excess energy that causes the blue plate to increase to 290 C was coming from the green plates as well as the heater.

            The green plate was dropping in temperature because it gets 200 watts from the blue plate but emits 400 watts, 200 from each of two sides.

          • Dr Roys Emergency Moderation Team says:

            bob 7:10am: “The blue plate is heated to 290 by the heater, not by the green plates.”

            bob 11:01am: “Nope, we were arguing that the excess energy that causes the blue plate to increase to 290 C was coming from the green plates as well as the heater.”

            …and that’s 290 K, bob, not C.

            Confused again are you?

          • bobdroege says:

            Nope DREMPTY,

            Now you are confusing heat and energy.

            I didn’t say the blue plate was heated by the green plate, you can read it again if you like.

            Nice catch on the C instead of K, my mistake, see I can admit to making a mistake.

            So now can you answer how the heat transfers from the blue plate to the green plate with out a temperature difference.

            I fear the crickets.

          • Dr Roys Emergency Moderation Team says:

            I don’t have to, since you will note I said:

            If the BP were to warm, you then have a thermal gradient between the BP and the GPs, and heat flows until the BP is back to 244 K.”

          • bobdroege says:

            So then you would be back to the beginning, and the blue plate will warm again as it is heated by the heater and receives 400 watts from the 2 green plates.

            And the green plates cool as they emit 400 watts while only receiving 200 watts.

            And the wheels on the bus go round and round.

          • Nate says:

            “Last time you were all arguing the surplus energy for the blue plate was a result of a drop in temperature of the green plates, such that there was 400 W in, but less than 400 W out, overall. That same surplus can warm the green plates, though.”

            Hooray, progress. D admits his ‘we cant make energy from nothing’ argument is bogus.

            “If the BP were to warm, you then have a thermal gradient between the BP and the GPs”

            Yes, very good.

            “heat flows until the BP is back to 244 K.”

            Uhh not quite, the BP is still receiving 400 W heat input.

            The thermal gradient means Heat flows from BP to GPs, @ 2 x 200W.

            And heat flows from the heater @ 400 W to perfectly match the BP heat loss to the GPs.

            “a thermal gradient between the BP and the GPs” MUST BE THEREFORE BE MAINTAINED.

            Without such a thermal gradient, it would be impossible to give 200 W input to GP to match its 200 W output and satisfy 1LOT.

            And it would be impossible to satisfy 1LOT for the BP 400 W of heat input requires 400 W of heat output.

          • Dr Roys Emergency Moderation Team says:

            “So then you would be back to the beginning…”

            Back here, bob:

            https://www.drroyspencer.com/2020/03/uah-global-temperature-update-for-february-2020-0-76-deg-c/#comment-444126

          • bobdroege says:

            So it’s back to where you do not understand why the blue plate increases in temperature.

            In order for the heater to heat the green plates, it has to heat the blue plate to a higher temperature than the green plates and maintain that temperature.

            The blue plate doesn’t go back to 244 K.

            Separating the plates causes a resistance to the flow of heat, which causes the blue plate to increase in temperature.

            Simple enough really.

          • Dr Roys Emergency Moderation Team says:

            There’s nothing about your arguments I don’t understand. That’s how I know they’re wrong, as I explained.

          • bobdroege says:

            Not so fast

            You have to support your arguments with the laws of physics.

            Which you are not doing.

            We have told you why your solution runs foul.

            Laws of physics or your opinion.

    • Dr Roys Emergency Moderation Team says:

      I’m not squirming my way out of anything, bob. JD’s diagram was only brought up so that the GHEDT could squirm its way out of the sticky situation you found yourselves in at that point, after all. I never needed to make the arguments that JD made, personally. As far as I’m concerned, no matter which way you want to look at the ins and outs of ab.sorp.tion/scattering/reflection, the bottom line is the BP cannot be warmed by the GPs. It’s an idealized scenario and you have to draw the line somewhere. Otherwise you end up with the ridiculous situation that two passive objects at 244 K warm a heated object from 244 K to 290 K. Or the equivalently absurd position that if you split a thicker plate, heated in the middle, into three sections, and separate them, the middle one warms up!

      • Nate says:

        “Otherwise you end up with the ridiculous situation that two passive objects at 244 K warm a heated object from 244 K to 290 K. Or the equivalently absurd position that if you split a thicker plate, heated in the middle, into three sections, and separate them, the middle one warms up!”

        It is apparent that it is purely your feeling, DREMT, that this scenario is ridiculous or absurd.

        You offer us no objective reasons that these adjectives apply.

        On the other hand we challenged your solution over and over with physics issues, and you simply dodge.

    • Dr Roys Emergency Moderation Team says:

      Pangburn
      Swanson
      Midas
      bdgwx
      barry
      bobdroege
      Nate

      Just the seven against one (including somebody I am not even responding to any more, who keeps commenting at me as though I am, for some reason). The GHEDT doesnt have any qualms about using weight of numbers in their favor. What was it, Crusher Crews!? I think thats what Skeptical Science referred to them as:

      http://www.populartechnology.net/2012/09/skeptical-science-drown-them-out.html?m=1

      • Nate says:

        More irrelevant distractions to further evade dealing with the facts.

      • bobdroege says:

        Now DREMPTY is playing the Martyr card, rather than addressing the issues with the solution to the problem he favors.

        Like:

        Heat transfer without a temperature difference.

        Materials with changing emissivities.

        A mismatch of photon wavelength.

        Which are all violations of the laws of physics.

      • Dr Roys Emergency Moderation Team says:

        Not playing the martyr, just pointing out the obvious. It should only require one of you to talk to me.

        • bobdroege says:

          Well you don’t respond to any of our objections to your solution, so there’s that refusal to engage.

          That’s obvious.

          • Dr Roys Emergency Moderation Team says:

            You demand that I link to JD’s diagram so you can attack that, specifically, without him being able to defend it himself. Because you are what you are.

            I respond to criticisms of my explanations (and attempt to defend JD’s diagram for him), you just don’t accept the responses. Then you all, collectively, play the “you won’t answer my question” game.

            And you don’t make any allowances for the fact I’m having to respond to so many people at the same time. You’re basically all just completely unreasonable people.

          • bobdroege says:

            Just wondering why you continue to defend a diagram that violates the laws of physics.

            If you understood physics, you would get that, you don’t.

            That’s all.

          • Dr Roys Emergency Moderation Team says:

            You brought the diagram up, not me. Then bdgwx brought it up again, because the conversation was not going well for the GHEDT. I could have ignored that, both times, but chose to respond, despite accusations that I ignore this or that.

            All we know, from experiment, is that the GP does not warm the BP. And that’s that.

          • bobdroege says:

            Except those of us who have performed the experiment have indeed verified that the green plate does indeed cause an increase in the temperature of the blue plate.

            That joker from prinipia scientific could not perform the experiment competently.

            And if you know your logic, you would know that you can not prove a negative by experiment.

            Or failure to demonstrate and effect is not proof that the effect is not real.

          • Dr Roys Emergency Moderation Team says:

            Any idea why Swanson set the entire thing up outside, got an extension lead out there so he could plug everything in, take pictures of it all…only to take everything back inside to actually conduct the experiment?

          • bdgwx says:

            It sounds like we all agree that the BP will be warmer than the GPs.

            For me the question is how much warmer. If we make the thought experiment more realistic such that the plates have thickness and finite conductivity then the BP would have to be warmer than 290K. There would be a gradient across the GPs where the outside face is 244K and the inside face is > 244K.

            I was playing around with possible steady-state configurations last night. There are many ways to balance the energy flow depending on the conductivity of the GPs. For example, if the conductivity were such that an equilibrium is achieved with the inner face at 270K then the radiation back toward the BP would be 300 W/m^2. To get the energy flows to balance the BP would have to be 306K radiating at 500 W/m^2.

            The point…the more resistant the GPs are to conduction the warmer the BP must be. In other words…the more effective the GPs are at acting as thermal barriers the higher the equilibrium temperature of the BP. And if you at some point you increase/decrease the effectiveness of the GPs to act as thermal barriers the BP will warm/cool. It is a natural consequence of the system trying to maintain that 200 W net flow to each GP.

          • Nate says:

            “All we know, from experiment, is that the GP does not warm the BP. And thats that.”

            Sure so long as you reject all the thousands of contradictory experimental results, youre fine!

            More signs of self delusion.

          • E. Swanson says:

            DRsEMT wrote:

            Any idea why Swanson set the entire thing up outside, got an extension lead out there so he could plug everything in, take pictures of it allonly to take everything back inside to actually conduct the experiment?

            Another red herring from the resident troll. I never said that I ran my demo outside. You and Hughes are hopelessly confused. Do you see my vacuum pump in any of those photos? I only took part of the rig outside to take photos under cloudy conditions, which allowed photos without shadows, resulting in better visualization. Besides, my first floor solar heated slab moderated the inside temperature, which was nearly constant during the runs.

          • Dr Roys Emergency Moderation Team says:

            It’s just quite an odd thing for you to do. All your photos were from outside, I had always assumed you did the experiment there. Then, on reading your comments under the first Hughes article, you said you did it inside. Personally it makes me wonder if you did it at all. I can see you doing the earlier experiments, but as you progressed further, by the time you got to the point you were using full vacuum, you just weren’t getting the results you wanted. Hughes wondered the same thing, also because you didn’t experience the temperature drop he mentions…you explained that away as being due to the thermal capacity of your plate being greater, if I recall correctly…

          • Nate says:

            “Personally it makes me wonder if you did it at all.”

            Desperate times call for desperate distraction grenades.

            Meanwhile D wants us to believe that heat flows into a plate, while NO heat flows out of it, yet it maintains a steady temperature.

            When we point out that this is an obvious violation of the first law of thermodynamics he has no sensible answers.

        • Nate says:

          “I respond to criticisms of my explanations (and attempt to defend JDs diagram for him), you just dont accept the responses. Then you all, collectively, play the you wont answer my question game.”

          How ridiculous. D keeps coming back and starting the same argumrnt over and over, while refusing to acknowledge that his ‘solution’ violates 1LOT, the RHTE, and all common sense. He has no reality based answers to these criticisms but plenty of red herrings, hand waves and blame for messengers.

          A same person finding himself repeatedly caught unable to defend an indefensible argument, with facts or logic, stops making it!

          What we must conclude is that D is simply not sane.

      • Dr Roys Emergency Moderation Team says:

        “It sounds like we all agree that the BP will be warmer than the GPs.”

        Oh, good grief. As soon as something awkward is raised, in comes bdgwx. Soon to disappear out the back door…

        • bdgwx says:

          As a fun exercise compute the steady-state temperature of the BP if the thermal conductivity of the GPs are 10 W/m.K and have a thickness of 0.1 meters and a cross sectional area of 1 m^2. Now make the GPs a better thermal barrier by reducing the thermal conductivity of the GPs down to 0.77 W/m.K. How much does the BP warm?

        • Nate says:

          D you keep claiming discomfort with splitting plates and getting different results. Its absurd you keep telling us.

          Well then why do window manufacturers go to so much trouble to split windows into two or three panes separated by gaps?

          Is it absurd for them to think that three panes with two gaps could be a much better insulator than one thick piece of glass!

          Is it more absurd to think that if we remove the gas from between the panes, the absence of convection will make these layered windows even better insulators?

          I think its absurd that such technology can work, yet in the GPE, where the very same principles are operating, you think its absurd and ridiculous that separated plates are better insulators.

      • Dr Roys Emergency Moderation Team says:

        #2

        Any idea why Swanson set the entire thing up outside, got an extension lead out there so he could plug everything in, take pictures of it allonly to take everything back inside to actually conduct the experiment?

  50. Eben says:

    The farce of climate models explained
    https://youtu.be/THg6vGGRpvA

    • gbaikie says:

      Well, it’s the farce of climate models explained one way.
      If climate models could predict atmospheric clouds, it would
      be a different story.
      As far as I know, climate modeling admit they can’t predict atmospheric clouds {global atmospheric clouds}.
      The mistake is they imagine they can make climate projections
      {which have any meaning} without needing to predict clouds.

      But there are other variables other than clouds, which they are not predicting. For example El nino and La Nina and the inability to incorporate El nino and La Nina in to the model would also cause error {probably as a guess, large as clouds}.
      And related to that, it said that something like 90% of “global warming” is going into warming the entire ocean. If instead it varied by less than 85% to more than 95%, that would another error you have allow for {or be able to predict} in climate model.

      And also, this points to the big problem with this whole “global warming” religion. Earth has a cold ocean.
      Or Earth’s climate is presently an Icehouse Climate or also called an Ice Age.
      Warming in an Ice Age is not a problem.
      Or we had a century of global warming, We had a century of “global warming” mostly warming the ocean, and the Ocean remains cold, and will remain cold for the next century {or centuries}.

      • Midas says:

        El Nino and La Nina is not climate.

        • gbaikie says:

          Clouds are not climate.

          The surface air temperature is not climate or global climate.

          But the coldness of the ocean indicates the global climate, and
          our cold ocean is a Icehouse climate.

          We have been in an Ice Age for millions of years-
          as everyone knows.

          And an entire ocean of Earth with an average temperature of 15 C [or warmer] is a Hothouse climate

          • Midas says:

            The long-term average surface temperature IS climate.

          • Bindidon says:

            gbaikie

            1. ” But the coldness of the ocean indicates the global climate, and
            our cold ocean is a Icehouse climate. ”

            You perfectly know that our oceans store an increasing amount of energy:

            http://www.data.jma.go.jp/gmd/kaiyou/english/ohc/ohc_global_en.html

            2. ” We have been in an Ice Age for millions of years-
            as everyone knows. ”

            This sentence is simply useless. Why don’t you start at -4.5 billion years?

          • gbaikie says:

            –Bindidon says:
            March 5, 2020 at 4:45 PM
            gbaikie

            1. ” But the coldness of the ocean indicates the global climate, and
            our cold ocean is a Icehouse climate. ”

            You perfectly know that our oceans store an increasing amount of energy:

            http://www.data.jma.go.jp/gmd/kaiyou/english/ohc/ohc_global_en.html

            Yes, and from that link:
            “…more than 60% of the net energy increase in the climate system from 1971 to 2010 is stored in the upper ocean (0 – 700 m), and about 30% is stored below 700 m.”
            60 + 30 = 90%
            [And your link also indicate some error bars- I couldn’t say if accurate}

            “2. ” We have been in an Ice Age for millions of years-
            as everyone knows. ”

            This sentence is simply useless. Why don’t you start at -4.5 billion years?

            Because our Ice Age started in begin about 10 to 15 million years ago, and has got the coolest in the last few million years.

            And in last 1/2 billion years we had many Hothouse Climates and most of this time is not in Icehouse or Hothouse Climate.
            In terms of billions of years, I don’t think we know enough to say much about Earth’s global climate.
            And as I said before, I don’t accept that the evidence indicate we have had Snowball or Slushball Earth.
            And it seems possible {mainly due uncertainty} that currently, we could be living in the oldest times Earth has ever been {geologically speaking}.
            But no one doubts that Earth in last 1/2 billion has had much higher average global temperature and has had Hothouse climates.

            Nor is there any doubt that Earth has had warmer interglacial periods {with in last few million years} then current global average air temperature of about 15 C.

          • gbaikie says:

            “…living in the oldest times Earth has ever been…”
            Correcting typo:
            …living in the Coldest times Earth has ever been…

          • gbaikie says:

            “Midas says:
            March 5, 2020 at 3:28 PM
            The long-term average surface temperature IS climate.”

            I would guess you meant average surface air temperature, but if not, I agree that ocean surface temperature is roughly climate.

            But would add the entire ocean temperature controls the surface ocean temperature of most of the planet. {Most being, about 60%}.

          • Midas says:

            The ocean overturns roughly every 1000 years. So, NO, most of the ocean is playing no part in the recent changes to climate. Or more correctly, most of the ocean has not had time to change in response to recent changes in the climate.

          • gbaikie says:

            –Midas says:
            March 6, 2020 at 5:36 AM
            The ocean overturns roughly every 1000 years. So, NO, most of the ocean is playing no part in the recent changes to climate. Or more correctly, most of the ocean has not had time to change in response to recent changes in the climate.–

            Well, you sort of got it right, but also assbackward.

            Or a + 10,000 year interglacial period doesn’t warm the ocean by much. Or if a few centuries of warming could warm the ocean by a significant amount, we probably we would not be in an Ice Age for millions of years.
            But probably the most accurate way to say it, is the large mass of Ocean acts like a stabilizing aspect or anchor to global climate.

            But if had a constant and large slab of warm water at the surface, you could say it doesn’t matter what temperature the ocean is.
            And the tropic does have a constant and large slab of warm water- but the rest of planet ocean doesn’t.

            Or one could roughly say the tropical zone is like a hothouse climate.
            Or a global Hothouse climate gives a more uniform global temperature, or you have tropical like conditions in the polar regions.
            Or if just looking a tropics, it’s been hothouse climate, for basically forever and the Ice Age is about the region of the world outside of the tropics.

            Or “global warming” has to be about polar amplification: wiki: ” Polar amplification is the phenomenon that any change in the net radiation balance (for example greenhouse intensification) tends to produce a larger change in temperature near the poles than the planetary average.”

            Or an Ice Age is preventing polar amplification. Or a warm ocean is polar amplification.

            Anyways, the average temperature is directly related to the ocean surface temperature. Ocean surface is 70% of the planet, and the average ocean surface temperature is about 17 C, and average land surface air temperature of about 10 C. And a warmer ocean surface prevent land surface from cooling as much during the night and winter.

            Or a characteristic of tropics in uniformity in temperature {day, night, summer, winter]. And characteristic Hothouse global climate is uniformity of temperature- not a large difference between tropics and polar region {and day, night, summer, winter every where on surface of Earth}.

          • Midas says:

            Eff knows how your meandering post explains how I got it “assbackward”. It seems the entire point of that comment was to make no specific point in order to make it impossible to continue the exchange.

            BTW – “ice age”, “snowball earth” and “hothouse earth” are NOT proper nouns.

    • barry says:

      “As far as I know, climate modeling admit they can’t predict atmospheric clouds {global atmospheric clouds}.”

      Not on a daily basis. For the long-term, they are aware of the uncertainties and this is one of the factors in the range of model response.

      “The mistake is they imagine they can make climate projections
      {which have any meaning} without needing to predict clouds.”

      They don’t imagine that cloud uncertaint is immaterial. that’s your fabrication. What they do is to estimate the uncertainties and factor them in. This iw why climate change projections are expressed as a range over a multidecadal period, and depending on a number of different scenarios (future evolution of ‘drivers’ of climate and human factors that may influence those drivers).

      What skeptics tend to do is to reduce a complex field of inquiry into distorting sound bytes which makes it seem like the researchers are blind to X Y and/or Z, or overconfident about the constraints they put on their knowledge.

  51. Bindidon says:

    bdgwx

    I forgot to reply to this comment:

    http://www.drroyspencer.com/2020/03/uah-global-temperature-update-for-february-2020-0-76-deg-c/#comment-441623

    Please have a look at all upwards successive UAH layers (LT, MT, TP, LS), and compare their global trends:

    https://tinyurl.com/y62sq3xo
    https://tinyurl.com/y68tcyur
    https://tinyurl.com/vr5st9t
    https://tinyurl.com/y4ln5u9t

    J.-P. D.

  52. Greetings Dr Roy Spencer,
    Thank you for continuing to provide data for my study of the relationship between temperature and atmospheric CO2 concentration. I definitely prefer to use your data as I do not trust other data sources some of whom are known to make ‘adjustments’ to their time series.
    I am currently analysing CO2 data for La Jolla Pier from the Scripps Institution of Oceanography. I do not get statistically significant results which I suspect may be due to the fact that I have to use the Northern Extension satellite data which is not sufficiently specific to the temperature conditions at La Jolla Pier. I suggest that your data files may be of greater utility if the Northern and Southern Extension zones covered an area from 20 degrees to 60 degrees latitude instead of the current 20 degrees to 90 degrees.

  53. Roy, would it be possible to add a trend line please? Thank you.

  54. barry says:

    Not likely to happen. But you can get the trend value as well ass all the monthly data from this page.

    https://tinyurl.com/y62sq3xo

  55. Kingbum says:

    That’s always been my contention too with global warming Greg. The LIA (little ice age) was what a 200 yr period from 1650 to 1850. Since 1850 we have been warming which coincidentally is the beginning of the industrial age, but it’s pretty well accepted that all the warming up until 1960 is natural. It’s either all natural or it’s all man-made. It is possible we were about to go into a glaciation and coal fired plants saved us from that. That has to be your position if you believe humans are fucking with the climate. My position has always been solar cycles, but solar activity has dropped yet no signal of a cool down so I’m questioning it more. I see weather chaos due to lower solar activity but no temperature decrease.

  56. Entropic man says:

    Month UK

    “its pretty well accepted that all the warming up until 1960 is natural. Its either all natural or its all man-made. ”

    I would disagree with your first sentence.

    The warming from 1880 to 1960 is about 0.25C.

    http://woodfortrees.org/plot/gistemp/from:1880/to:1960/plot/gistemp/from:1880/to:1960/every/trend/plot/gistemp/from:1880/to:1960/every/trend/offset:0.1/plot/gistemp/from:1880/to:1960/every/trend/offset:-0.1

    The problem is that this is barely significant. It might all be due to chance, so you can’t meaningfully prove whether the cause is natural, artificial or leprechauns.

    Saying that, the 0.25C is consistent with the warming expected by increasing CO2 from 280ppm to 315ppm and all the other likely warming factors are neutral. Although you can’t prove it statistically AGW is the best fit option.

    Is it natural or artificial? Probably the latter. The natural forcings are all neutral or cooling slightly.The consensus view is that we have converted a slight natural cooling trend into a significant artificial warming trend.

  57. Entropic man says:

    The sceptics tend to interpret this as the date that AGW started and that pre-1956 warming was natural.More likely, AGE began in or before 1880 and that 1956 is the earliest date that the IPCC can show that the human contribution is statistically significant.

    The temperature rise from 1880 to 1956 is 0.2C. The 95% confidence limits of the annual temperature average are +/-0.1C.(Standard deviation 0.05C )

    As a rule of thumb the threshold for a significant difference between annual averages is 4SD, or 0.2C.

    The sense of this:-

    “Since the mid-20th century, most of the observed warming is “likely” (greater than 66% probability, based on expert judgement) due to human activities. ”

    was in the Third IPCC report in 2001. It was referenced to Question 2 in the Synthesis Report but I can’t find the exact wording.

  58. Svante says:

    Clue here Midas:
    https://www.nytimes.com/2012/07/30/opinion/the-conversion-of-a-climate-change-skeptic.html

    “In its 2007 report, the I.P.C.C. concluded only that most of the warming of the prior 50 years could be attributed to humans.”

    • Svante says:

      IPCC AR5 is often quoted saying:
      https://tinyurl.com/yxnsxyuv

      It is extremely likely that more than half of the observed increase in global average surface temperature from 1951 to 2010 was caused by the anthropogenic increase in GHG concentrations and other anthropogenic forcings together.

      The next sentence is not often quoted:

      The best estimate of the human-induced contribution to warming is similar to the observed warming over this period (Figure SPM.3).

      I say they are way off, because they require very strong proof. Physics tells us that we should have a logarithmic function of CO2 (and CH4), and indeed we have, just look a the graph I linked. Sure there are other factors that play a role in the short term (a few decades), but what we see in the long term is just that logarithmic function. Feed backs may play a greater role in the future but that’s another story.

  59. bdgwx says:

    RSS went up in February as well; just not as much. ERA only increased by 0.02C. Yet again I wonder if UAH is being contaminated by the stratosphere.

  60. ____ says:

    For example, Spleen, Liver, energy, blood and Kidney patterns underlie
    asymptomatic ovulation, but research indicates Kidney deficiency is often the root pattern. If the body has
    a layer of oil onto it I can’t hold on to the muscles and my job is
    going to be harder to accomplish. Providing guidance for your client on ways
    to improve posture and stretching goes further towards developing a rapport.

  61. Midas says:

    Prediction: March UAH will be back down to the trend levels.
    The current trend level is +0.31.

  62. Jeff Hammel says:

    Roy,

    Thank you for your great monthly posting of complex weather data, and all else that comes with it. However, recognizing the great complexity of our environment, I think even you, along with many other brilliant people (experts) need to back out of the trees at least every month, and make sure you can still see the forest.

    To keep eyes on the very important BIG PICTURE (the forest) I think you should ALWAYS chart the actual data points you add monthly, contrasted with the several much warmer model plots utilized every single day AS FACT by those seeking to promote their own importance, mess up our entire free market economy and run the world. I don’t see them this month, don’t see the forest Roy, but I know it is still there. The forest needs to be shown every single month as a constant prodding to those who refuse to change their models for actual temperature data. At this point a crime is being perpetrated against all humanity by use of these unadjusted models. They are not rooted in actual data compiled by you and others, nor associated learning about certain flawed model assumptions which you have written about. These facts command that the models to be re-tuned. This ongoing modeling travesty is very much like the irresponsible piling on by those recently modeling events related to the COVID-19 pandemic.

    We are all witnessing the beginning of a total economic disaster, which we cannot even fathom yet, in part because a “brilliant” model builder predicted 500,000 dead Brits from COVID-19. His irresponsible modeling, a complicit media and other crazies have now scared the shit out of millions. In the past week or so actual data, collected by medical professionals, has forced an adjustment to the model down to ~20,000 deaths. The model was off by a factor of 25X, but no big deal to some I guess. Some media are still busy scaring everyone and have not even reported the model adjustment. A global financial disaster has been strapped to the COVID-19 pandemic by this process, and as I said the cost will amaze and cause great pain to everyone. IT IS THE SAME THING THAT HAS BEEN GOING ON FOR YEARS USING CLIMATE MODELS, and it is high time it stops. Roy, you have the credibility to call people to quit using models to lie, and cause great harm. Please do so every month, along with whatever deeper discussions you post. Some of us are way tired of being lied to by people who value money, power and personal fame much more than actual scientific gains. Our lives are being destroyed by such brilliant people.

    P.S. Look our for the big flying rocks and for viruses; two areas where humans may actually have enough collective power to develop and deploy technology to protect our continued existence. If fraudulent models don’t kill us all first.

  63. Booyah Johnson says:

    Forcing by CO2 is a function of the logarithm of its concentration. Black body radiation increases with temperature. With the increase in temperature more energy is radiated in spectrum that is not absorbed by the atmosphere.

    Climate change therefore should not accelerate and in fact should plateau even if CO2 emissions increase slightly each year.

Leave a Reply