
 Home/Blog
It has been a while since I have posted progress on our DOE-funded research into the Urban Heat Island (UHI) effect in the GHCN station temperatures used to monitor land-based global warming. It should be remembered that everything I post on this subject is (as is usually the case) a work in progress.
What I am addressing is the existence of localized long-term warming associated with population increases which are over-and-above the large-scale warming due to humanity’s greenhouse gas emissions or nature. These urban-influenced changes are very localized, and yet they influence large-scale area averages and make the land areas look like they are warming faster than they really are. The problem is pervasive because virtually all thermometer locations are where people live, and since the 1800s even most rural locations have experienced population growth.
The bottom line is that there are UHI-based trend (warming) effects in the GHCN station temperatures; the only question is, how much have they affected reported temperature trends? Most previously published research on the subject has suggested the effects are small (Hausfather et al., 2013; Wickham et al., 2013; Hansen et al., 2010; Parker, 2010; Jones et al., 2008; Parker, 2006; Peterson & Owen, 2005; Peterson, 2003; Peterson et al., 1999; Gallo et al., 1999; Karl et al., 1988). As a result, you will find most who defend the “climate crisis” narrative will refer to one or more of those studies as showing the “science is settled”, and that GHCN-based land warming estimates are largely free of UHI warming effects.
I have argued that those studies involved methodologies that were not very good. Identifying the UHI effect is difficult. I’ve come up with a novel way of quantifying the average UHI effect, even at stations that would be considered “rural” with presumably no UHI effect. We have a paper in review in Nature Scientific Reports describing the methodology (my blog description of the methodology is here), but I have no idea what chance it has of being published.
I will get right to the results as they stand today. What I show below are for the all-station average of GHCN stations; they are NOT area averages, which are what is needed for climate monitoring. They just show how much the average GHCN station is influenced by spurious UHI warming. The stations cover the latitude bands from 20N to 80N, but are dominated by U.S. stations (about 80% of the total) due to the huge numbers of stations we have in this country.
The plots are for 4 classes of initial GHCN station population density (the first year those stations started operating) during the warm season (May/June/July), and give the cumulative year-on-year temperature increase averaged across all stations in each of the four initial station population classes. The adjusted (homogenized) GHCN station temperature changes are in green, and my calculated UHI effect is in red.
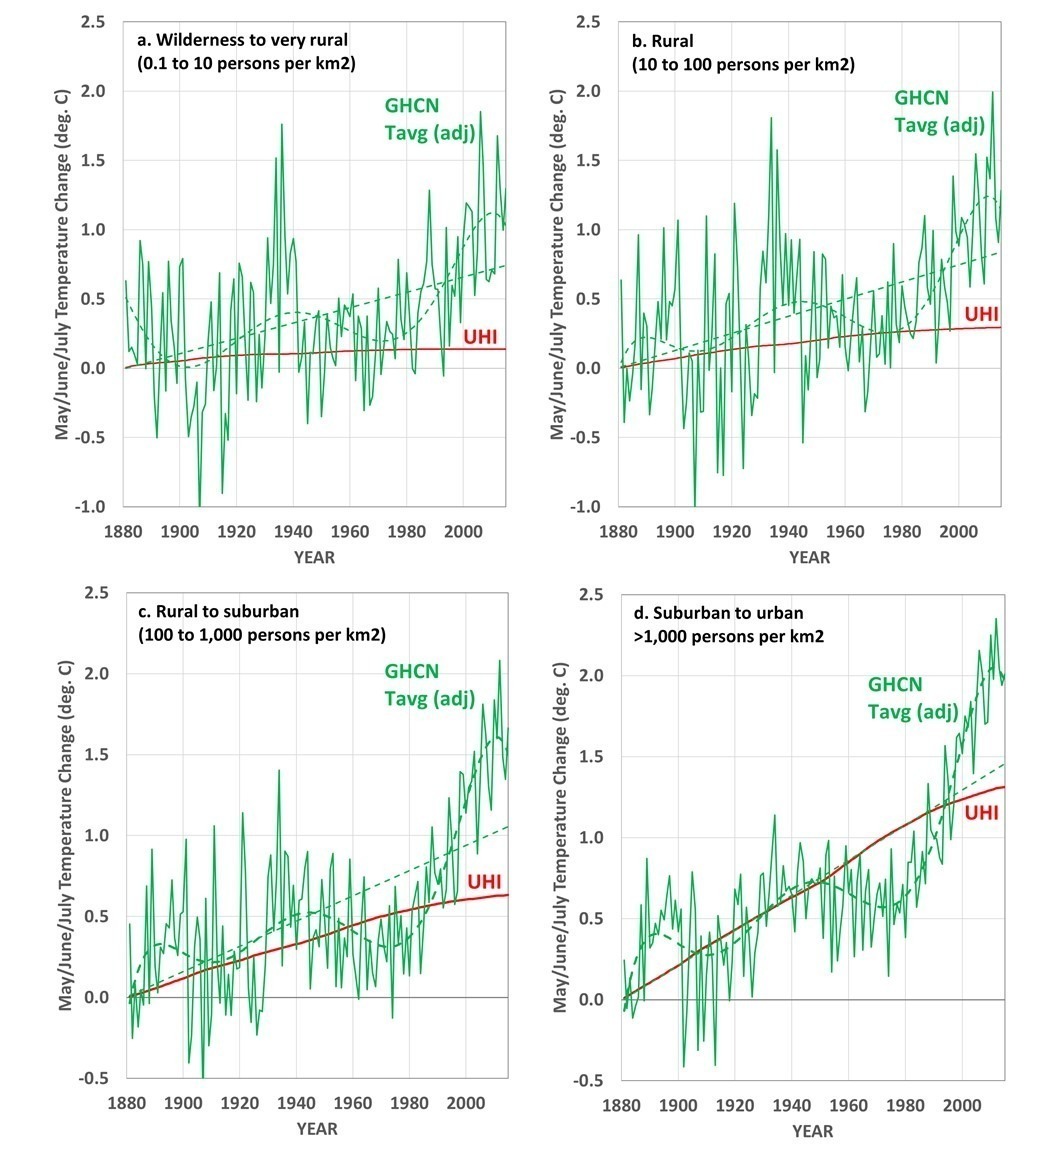
For the “wilderness to very rural” class (upper-left panel), the UHI effect on temperature trends turns out to be quite small, contrary to what I have recently argued. Since many of these low-population stations are at high northern latitudes, this would suggest that the UHI effects on the large warming trends reported there are small.
But as we progress to higher population stations, we find that UHI warming effect becomes larger. In the highest population density class (“suburban to urban”, lower-right panel) my calculation of UHI warming is virtually the entire GHCN-reported warming signal since 1880, but only a small part of the reported warming since 1980.
If these results stand, what will they mean for reported land warming trends?
I’m guessing that the UHI effect on area-average trends since 1980 (the period of most rapid temperature rise) will turn out to be relatively small. But before 1980 it looks like the UHI effect on GHCN temperatures could be substantial. This would change the nature of the global warming narrative, with little land-based warming for the first 100 years starting in 1880.
What could change these results? First, I do not account for increases in the UHI effect due to per-capita increases in infrastructure and energy use (buildings, vehicles, parking lots, electricity use and resulting waste heat). I assume the UHI effect is only a function of population density (partly because we have global gridpoint data on population extending back into the 1800s). Thus, my UHI warming estimates might be a little low for stations where population stopped growing but spurious sources of heat continued to increase, such as in Vienna, Austria (R. Bohm, Climatic Change, 1998).
In any event, I feel like I am finally converging on useful results. One aspect of this is that the record high temperatures now being reported in major population centers in the southwest U.S. and southern Europe need to be revisited based upon the very large urban heat island temperature increases seen in the lower-right panel of the above plot at suburban-to-urban stations.


You write, “Im guessing that the UHI effect on area-average trends since 1980 (the period of most rapid temperature rise) will turn out to be relatively small.”
How does that comport with what you wrote in 2021 here: https://www.drroyspencer.com/2021/01/could-recent-u-s-warming-trends-be-largely-spurious/
which you blame largely on UHI.
You conclude that earlier article with,
“It seems to me that there remains considerable uncertainty in just how much the U.S. has warmed in recent decades, even among the established, official, homogenized datasets.
“I would not be surprised if such problems exist in global land temperature datasets as well as the U.S.
“Im not claiming I know how much it has (or hasnt) warmed. Instead, Im saying I am still very suspicious of existing official land temperature datasets.”
Are you still suspicious of those same datasets?
J.K.-
EXCELLENT question! I’m glad to see some people are paying attention to what I write.
The explanation?
I WAS WRONG!
In that old post, I made the mistake of assuming that even in the U.S. (2.5% of the world), there couldn’t be (1) substantial differences in temperature trends, and (2) a curious preference for the low-population stations to be in the weak warming trend locations, and the high-population stations to be in the stronger warming trend locations.
But it appears that is what happened.
As I stated in the beginning of this new post, “It should be remembered that everything I post on this subject is (as is usually the case) a work in progress.”
Again, a GREAT question.
-Roy
I have a lot of respect for people who can say
“I WAS WRONG!”
The observed trend in your monthly graphs matter. I don’t think there is any UHI there.
Thanks
Do you adjust your satellite data for UHI? How does your lower 48 data compare to the USCRN data supposedly unaffected by UHI.
How to remove Willard (and other obfuscators) from this thread (DropBox files):
1. Download files from:
https://www.dropbox.com/scl/fo/xgdoigbxynh7xzq09kmns/h?dl=0&rlkey=axxrnd7ca64r0gjsfuwcezf82
2. Read HOW TO INSTALL.txt for easy installation details.
Enjoy.
Use with care
Remove all the obfuscators from this site and there would be nobody left.
Ummm… so you are admitting that…
The Greeks say “Know thyself”.
Some of the others here take themselves seriously. (Smile emoji)
A useful experiment: https://weather.uni-freiburg.de/meteobike_extern/meteobike-animation/
Hit play.
Canada deployed its military to help overwhelmed local authorities and emergency workers fight intensifying wildfires, which have burned nearly 10 million hectares of the country’s land so far this year and prompted authorities in parts of the U.S. to issue air quality warnings.
Average Annual Area Burned 1983-2022: 2.2 Mha.
Total Area Burned so far this season is >10 Mha, an area larger than most countries.
https://imgur.com/a/gf2lgnC
Here is Bloedel fire 1938:
https://www.for.gov.bc.ca/hfd/pubs/docs/scv/scv871.pdf
Note the bit about fires from California to Alaska and from the Coast to Saskatchewan.
10 million hectares (24.7 million acres) this year, is not a record-breaking figure
Show me a good estimate of the area burned per year for the last 100+ years, and demonstrate an increasing trend. Then, if there is an increasing trend, show me that there hasn’t been any change in forest management (like there has been in the U.S.) that could cause a greater fuel load susceptible to the inevitable (and natural) dry lightning strikes.
“Show me a good estimate of the area burned per year for the last 100+ years, and demonstrate an increasing trend.”
I refer you to Fire-regime changes in Canada over the last half century. 2019. Hanes, C.C.; Wang, X.; Jain, P.; Parisien, M.-P.; Little, J.M.; Flannigan, M.D. Canadian Journal of Forest Research 49: 256-269. doi: 10.1139/cjfr-2018-0293
https://cfs.nrcan.gc.ca/publications?id=39501
Roy mentioned 100 years. The publication you reference is 57 years (could be updated to only 60 years)
There is a clear pattern in the weather data over the past 150 years of long term climate cycles of, depending upon what metrics you use, of 65 to 100 years. And in addition as per Dr. Syun Akasofu there may well be longer termed climate cycles that influence the climate.
For example the leading hypothesis surrounding the disappearance of the native American Anasazi culture of the American southwest around the year 1600 has been attributed to extended drought persisting up to 300 years or more. The culture existed from the first through the 16th centuries but came under pressure in the 14th century and began a major decline and disappeared by the early 17th century.
Typically, these climate cycles cannot really be seen except perhaps a couple of decades beyond change as we have seen climate can change very slowly when somebody is watching for the pot to boil.
Bottom line is warming has only amounted to less than .11degC/decade now for 26 years over which the world population increased by 36% to 7.9 billion.
At that rate 3 degrees warming will be reached in 270 years at which point the world population should be hitting 200 billion
There was a Canadian in here today where I work and he was telling us that the Canadian government has slashed untold millions from the fire fighting budget and closed dozens of fire lookout stations.
So, is this any really wonder that they can’t get this thing under control in what is turning out to be a dry summer for them?
My opinion: It would appear to me that there was some huge incompetence or ineptitude on the part of the government. Now they are refusing to accept responsibility for it and are conveniently trying to blame it all on “climate change”.
I don’t mean to point fingers at the Canadian government. Surely, we are no better.
Having lived next to Canada, I’m surprised that Canada would be able to do much of anything about wildfires. The country is HUGE and largely uninhabited. I don’t see how anything but a very small fraction of the country could have any level of “forest management”.
The strength of the polar solar field.
23.07.14
http://wso.stanford.edu/gifs/Polar.gif?fbclid=IwAR3LW1hqfS7CDB72B2AOasiSz7NrR8FN1AMxvrXYvZbG_1kxM-aHpT56dgU
The northern polar field appears to have reversed polarity in late February 2023. Solar max normally occurs within 0.5-2 years after the first polar field reversal. We can expect solar max for cycle 25 sometime between August 2023 and February 2025.
https://solen.info/solar/polarfields/polarfields.png
It should be remembered that everything I post on this subject is (as is usually the case) a work in progress.
That is how science should be done.
We have a paper in review in Nature Scientific Reports describing the methodology (my blog description of the methodology is here), but I have no idea what chance it has of being published.
That is NOT how science should be done.
Those temperatures were heavily “adjusted” in locations worldwide, especially in third-world countries.
What I failed to mention is that the “adjusted” GHCN station trends are greater than the “raw” temperature trends, in all population classes.
Hi Roy,
I made an interesting (to me) comparison between raw GHCN data (unadjusted) and the LT-UAH48 data posted on your site.
Virtual station 1 (GHCN-48 station selection):
1) Located in the lower US48
2) And have at least 15 TMAX entries/quarter from 1922 thru 2022
3) And have at least 15 TMIN entries/quarter (same period)
Virtual station 2:
1) UAH LT-US48 converted to GHCN daily data file format.
For the period of 1979 thru 2022 the two virtual stations compare reasonably well (annually). Both show some warming, and the peaks and valleys mostly line up. I didn’t normalize the GHCN data, so, monthly comparisons wouldn’t make sense (absolute vs anomaly).
For the period of 1922 thru 2022 the GHCN-48 set (295 stations!) shows cooling from the early 30s to mid 70s and then warming to 2022. The warmest is 2012, which is about 0.1C warmer than the second warmest (1931).
If you are interested, send me an email and I’ll send you details (graphs, station selection, source code, etc.).
Thanks for looking.
Dr. Roy,
I truly believe you are on to something with these urban heat island effects. I have come to believe that climate change is real, but how much of it is actually rather local in nature?
By looking at some stats, I have found that Tucson has warmed up about 4F since the 1890s. That’s real. But did it actually come from “global warming”? I don’t think so, but I wish we could prove that.
Like you stated, if a significant amount of the climate change is actually coming from UHI effects, that could change the whole climate change narrative.
Thanks for the self-correction, it seems rare to encounter anyone who will do so.
Apologies if you’ve explained this and I’ve missed it: Do your characterizations of each class of area, from wilderness to urban, shift over time, or are they static? If the latter, where in the historical record do you set your “snapshot?” Or is it that the records from a given location change class as conditions change over time?
Is there a seasonal variation of class for location?
Good question. The 4 classes of population density are for the *initial* population density of a station. This seemed like the only logical way to do it. For example, for the first class (0.1 to 10 persons per sq. km), I compute the average year-on-year change in temperature for all stations whose *initial* population density was between 0.1 and 10 persons per km2. Those stations might have started in 1880, or 1931, or 2016… it doesn’t matter. There are tens of thousands of stations, some covering only a few years of record, and I had to find some way to make sense from such huge disparities in station record lengths.
What I decided is that year-on-year temperature changes were the easiest metric to track. I don’t compute “anomalies”… that would involve extensive intercalibration of nearby stations, and what to do if there are no nearby stations? After thinking about this problem, I realized the important metric is the average change from one year to the next. In that case, I can include any stations with at least 2 years of record.
There is no seasonal variation in the population data… the time resolution is every 10 years until 2000 (as I recall) and then it is yearly.
Thanks. Makes sense.
There is another possible angle to this whole problem. It seems to me that CO2 has less effect in areas that are humid, and more effect in areas that are not as humid because the CO2 therefore becomes a larger percentage of the overall greenhouse effect. Has that been considered? Is there some correlation between humidity and urban warming?
Tim S,
One fly in the GHE ointment is a place like Death Valley. Very little of that most important GHE (H2O) in the atmosphere, and temperatures over 50 C.
Whatever the GHE is supposed to do, (nobody can actually describe it), generating record high temperatures is obviously not one of its characteristics.
The highest temperatures occur where GHGs are least. Diurnal variations, likewise, are greatest in the absence of GHGs. Whether people like it or not, both the highest, and the lowest surface temperatures occur with minimum GHGs.
There is no GHE. Any and all increased temperatures are due to increased heat – and GHGs provide no additional heat whatsoever.
That’s exactly what it is. Water vapor in the atmosphere and aerosols absorb some of the sun’s radiation and less reaches the surface. Green areas have a similar effect. Yes, as you wrote, dry air is transparent to infrared radiation, and therefore rocks, concrete and asphalt can get very hot.
In addition, steam increases convection because it is lighter than air, which lowers the surface temperature. An example is hurricanes, which send large amounts of heat energy into the stratosphere. In the stratosphere, greenhouse gases radiate out into space, as evidenced by the lowest temperature in the tropopause.
Dear Dr Roy Spencer,
Living in France, I was recently surprised to uncover how the MeteoFrance meteorological authority is calculating what they call an “Indicateur thermique National” (ITN) through averaging every day the maximum temperatures recorded by a panel of 30 selected meteorological stations. This ITN is used to monitor the heat waves an canicules for the whole territory.
I could find the list of these 30 stations and after plotting them on a map I was stunned in seeing that they are all situated in an urban or suburban zone, or close to the concrete tarmac of an airport. NONE OF THEM is in a rural area or in a forest or mountain region.
https://www.infoclimat.fr/climato/indicateur_national.php#2023;,1981-2010,1,-3.65,368.65,,y,desc,-1291765464000,1717710264000
Then it is easy to understand why, thanks to the UHI effect, Meteo France can trigger the “canicule alert” and stress the french population much earlier and longer every summer.
https://twitter.com/WeatherProf/status/1681087826425782278
“This is the definition of compound, concurrent heat extremes! What you’re looking at is the pressure pattern & wind flow at the 500mb level (5600 m, 18K ft). This is why Death Valley hit 129, the Med may hit 118, Iran heat index 152F and China hit an all-time heat record of 126.”
Yes, yes – I know – it is all due to the UHI effect.
http://tropic.ssec.wisc.edu/real-time/mtpw2/product.php?color_type=tpw_nrl_colors&prod=global2×pan=24hrs&anim=html5
studentb,
You wrote –
“Yes, yes I know it is all due to the UHI effect.”
If you say so, it must be true. Is that it?
Swenson,
You need to recalibrate your sarc detector.
bobdroege,
You need to realise that the scientific method does not mention sarcasm. Sarcasm is a refuge of the retarded who can’t produce facts.
Like you.
Swenson,
Are you using the Scientific Method?
bobdroege,
You wrote –
“Swenson,
Are you using the Scientific Method?”
Why do you ask? Are you retarded, or are you simply mired in a fantasy which precludes you from accepting reality?
You might want to learn how to pose a gotcha, before trying to write one.
Have you come up with a better description of the GHE than your previous attempt – “Putting more CO2 between the Sun and a thermometer makes the thermometer read moar hotter moar better.”?
You obviously arent the brightest bulb in the box, are you?
Carry on.
Swenson,
You want a better description of something you claim doesn’t exist?
Is that one of your facts?
That there is no greenhouse effect?
You know that bulbs in boxes aren’t very bright, to get light out of them you have to take them out of the box and screw them in and turn them on.
You can’t even make a coherent insult!
Bobby,
You claim that a greenhouse effect exists, and describe it thus –
“Putting more CO2 between the Sun and a thermometer makes the thermometer read moar hotter moar better.”.
That seems fairly meaningless to me, but if you claim you have a “better” description (but are keeping it secret), others are free to believe you if they wish.
I asked you if you thought you were the brightest bulb in the box. You pointed out that bulbs in a box were all the same brightness, but then implied that were insulted by my asking an innocuous question.
You are free to feel insulted, bullied, offended or anything you like. That is your choice, but if you want to blame me because you cannot control your emotions . . .
Are you sticking with your description of the GHE, or do you have a “better” one?
Swenson,
That is actually your description of the greenhouse effect, don’t you remember?
Blundering Bobby,
When you wrote “Putting more CO2 between the Sun and a thermometer makes the thermometer read moar hotter moar better.”, it was all your own work, as anyone searching this blog can see for themselves.
Here’s your original comment in full –
“I have already told you Swenson,
Putting more CO2 between the Sun and a thermometer makes the thermometer read moar hotter moar better.
There, seventeen words.”
Don’t blame me because you make yourself look unintelligent.
Swengoolie mikey flynnie
“Heres your original comment in full ”
I plagiarized that comment from you.
To make fun of you.
SROTFLMAO
Blundering Bobby,
When you wrote “Putting more CO2 between the Sun and a thermometer makes the thermometer read moar hotter moar better.”, it was all your own work, as anyone searching this blog can see for themselves.
Heres your original comment in full
“I have already told you Swenson,
Putting more CO2 between the Sun and a thermometer makes the thermometer read moar hotter moar better.
There, seventeen words.”
Dont blame me because you make yourself look unintelligent.
Trying to weasel out of being caught out by claiming that you are only guilty of plagiarism (fraud), rather than mental deficiency, won’t do you much good. Claiming you stole something that does not exist, still won’t get you off the hook of claiming that you have a secret description of the GHE – which is so secret that you are not going to tell anyone what it is!
Not terribly bright, bumbling bobby, not terribly bright at all.
You are definitely no mental giant, that’s obvious.
Carry on.
Still laughing at you Swenson.
Blundering Bobby,
When you wrote “Putting more CO2 between the Sun and a thermometer makes the thermometer read moar hotter moar better.”, it was all your own work, as anyone searching this blog can see for themselves.
Heres your original comment in full
“I have already told you Swenson,
Putting more CO2 between the Sun and a thermometer makes the thermometer read moar hotter moar better.
There, seventeen words.”
Dont blame me because you make yourself look unintelligent.
Trying to weasel out of being caught out by claiming that you are only guilty of plagiarism (fraud), rather than mental deficiency, won’t do you much good. Claiming you stole something that does not exist, still wont get you off the hook of claiming that you have a secret description of the GHE which is so secret that you are not going to tell anyone what it is!
Not terribly bright, bumbling bobby, not terribly bright at all.
You are definitely no mental giant, thats obvious.
Carry on.
Still laughing at you Swenson, a lot.
The oceans warm the world.
The tropical ocean is the heat engine of the world.
Dry desert can have ground temperatures of 70 C and they aren’t heating the world. Warm tropical ocean aren’t hot like dry desert sands and ocean surface temperature is not significantly warmer then air above it.
But it heats the entire planet.
UHI is real.
I live in a suburban area with houses on a ~1000m2 ground mostly.
My energy use is in the low end around 12MWh a year for the house.
It means 1,4W/m2 in average.
It converts to 0.5 more celcius than without my energy use.
You could make the same calculation for a countrys energi use and divide with area.
In that way the whole USA could be 0.1 to 0.5 degrees higher than it would be without any energy use. E.g. very rural.
On the other way the temperature with the UHI is in fact the land temperature, so the whole diskussion is about finding some sort of “real climate” signal in the temperature. A climate signal that is hidden in all other effects than just the CO2.
Surely the scientific way to do this, would be to set up multiple weather stations around a city.
Maybe on the compass points, every mile, or so, up to 10 miles out.
Measure temperatures & wind directions.
I am reminded of Steven McIntyres 2007 crushing analysis of Tom Peterson’s 2003 paper on UHI. In a very simple way, McIntyre destroyed the analysis made by Peterson and showed how significantly UHI has infected our temperature histories.
See for yourself. https://climateaudit.org/2007/08/04/1859/
Annus Horribilis
In B.C., there were 373 active wildfires on Monday, with 110 considered out of control, according to Sarah Budd, an information officer with the BC Wildfire Service. Of those, 23 were considered fires of note, meaning they were highly visible or had the potential to impact people, communities or critical infrastructure.
Ms. Budd said forests in the province’s northern half have sustained repeated lightning strikes over the past 15 days, which have fed the flames.
A reconnaissance team with the Canadian Armed Forces arrived in Prince George, B.C., and on Monday worked with the BC Wildfire Service to co-ordinate firefighting deployment details.
B.C.’s coroner issued a public safety bulletin on Monday after confirming that a nine-year-old boy from 100 Mile House, in the province’s interior, had died from a medical condition aggravated by wildfire smoke.
Long term you should try to avoid rawdogging the wildfire smoke and use either a mask outside or air filter of any variety inside. This shit is not healthy over the long term but it’s here to stay.
https://imgur.com/a/Wiu9DZv
Sickos like Ark actually hope for more suffering and deaths. In his perverted mind, the worse the catastrophe, the more he believes his cult nonsense is validated.
Sick.
ark…”This shit is not healthy over the long term but its here to stay”.
***
You are emotionally out of control, just like your alarmist brethern. Why not call Greta Thunberg so you two can have a good cry together.
It’s summer in BC, we have forest fires in summer, get over it. Some years are worse than others.
We have been inundated recently with alarmist dogma about droughts in Europe. Turns out the worst drought by far was in 1921.
Roy Spencer
Did you publish in any thread the list of all the GHCN stations which you used, with in addition the population factor (0-100%) you obtained for each station?
Strong monsoon in India driven by strong south polar vortex in southern Indian Ocean.
https://i.ibb.co/dDLrhgz/mimictpw-indo-latest.gif
There have been several alarmist posts about the wildfire situation in Canada, especially BC. Ken posted an article the other day that revealed the record for wildfires in BC is 1938.
The 1930s were by far the warmest years in Canada and the US and still holds the record for the number of heat waves.
We must have had early global warming in BC [/sark off]
swenson re Death Valley…
We have a similar situation much farther north in BC, Canada. Along the coast, where moisture laden clouds approach from the Pacific, they tend to dump their moisture on the ocean side, leaving the inland side drier.
Where there are more mountain ranges inland, the process gets repeated and the non-ocean side of the mountain develops a desert climate.
The perennially hottest spot in Canada is Lytton, BC. The climate there is not particularly desert-like but as one progresses up the Thompson River canyon it becomes progressively more arid till the cactus and sagebrush become the primary vegetation.
Apparently Lytton is so hot because it is located in a canyon where the heat accumulates. However, Vancouver, which is on the coast, and generally much cooler, has issues with smog, especially in rush hour over major arteries. Most of that smog will be CO2, so why is it not heating Vancouver to record temperatures?
https://en.wikipedia.org/wiki/Lytton,_British_Columbia
There’s a good picture on this site of the terrain, with two people in it. The pic can be expanded to screen size. This location, Ashcroft BC, is about 150 miles NE of Vancouver, which is in a rain forest climate.
https://ashcroftbc.ca/trails/
An interesting locale…
https://en.wikipedia.org/wiki/Walhachin
This is typical of the area…
https://tinyurl.com/yx2xz4bj
Over the last 50 years the Earth has received more energy from the Sun than at any other time during the past 500 years. That probably accounts for a lot of the heating if correct.
‘Total Solar Irradiance during the Last Five Centuries’
The Astrophysical Journal, 937:84, 2022 October 1
https://arxiv.org/abs/2209.10115
You must be totally insane and dishonest to deny what happens this year in Canada.
From Reuters
” So far in 2023, more than 100,000 sq km of land has burned and still counting.
Thats more land than any other fire season since 1990, the earliest for which data is available. And the season is barely halfway through. These have been some of the fastest-moving fires in the countrys history.
Quebec
43,500 sq km
The majority of land burned is in Quebec, where fires are still burning from last years fire season.
This is unusual. On average, in the 10-year period up to 2022, Quebec ranked sixth among Canada’s provinces and territories for area burned, according to CIFFC data.
Alberta
17,300 sq km
Alberta’s fire season exploded in early May, before vegetation had a chance to start growing again after the winter.
The average area graphic is followed by a shape representing the land area burned by fires so far this year. The area is so far that it stretches outside the window screen.
So far in 2023, more than 101,800 square kilometers of land has burned and still counting.
Thats more land than any other fire season since 1990, the earliest for which data is available. And the season is barely halfway through. These have been some of the fastest-moving fires in the countrys history.
As the reader scrolls down the page, the area is broken up by province.
Quebec
43,500 sq km
The majority of land burned is in Quebec, where fires are still burning from last years fire season. This is unusual. On average, in the 10-year period up to 2022, Quebec ranked sixth among Canada’s provinces and territories for area burned, according to CIFFC data.
Alberta
17,300 sq km
Alberta’s fire season exploded in early May, before vegetation had a chance to start growing again after the winter.
British Columbia
12,900 sq km
British Columbia has been battling its biggest-ever wildfire, the Donnie Creek fire in the north-east, since early May and the blaze now occupies an area larger than the province of Prince Edward Island.
Wildfire activity is ramping up across the rest of the province due to widespread drought, hot weather and frequent lightning storms.
Northwest Territories
9,500 sq km
The Northwest Territories, like much of Canada, are experiencing an unusually hot, dry summer and are unable to call on firefighters from other provinces and territories because those crews are already deployed elsewhere.
Saskatchewan
9,200 sq km
Hot weather caused a rapid spring snowmelt across Saskatchewan and much of Canada’s prairies, leaving conditions ripe for wildfires to spread quickly.
Ontario
3,900 sq km
Manitoba
900 sq km
Yukon
700 sq km ”
*
Does that matter if Canada experienced such amounts of burnt forests some decades, centuries or millenia ago?
Who denies what happens is by no means better than all the alarmists who see CAGW behind every unusual weather event.
” The 1930s were by far the warmest years in Canada and the US… ”
That is, as usual, the typical signature of the incompetent guys who don’t have a clue about which of the different temperatures made the 1930 the warmest, and… by how much!
This utter nonsense began with the incompetent Steven Goddard nearly two decades ago.
I therefore repeat how temperature averages and maxima differ for CONUS, with an analysis of over 8,000 GHCN daily stations with at least 30 years of activity (only absolute temperatures, above all no ‘pairwise homogenization algorithm’ at work).
1. Top 10 in a descending sort
TAVG
2022 7 26.01 (C)
1980 7 25.79
2011 7 25.69
2006 7 25.68
2012 7 25.65
2020 7 25.64
1998 7 25.61
1936 7 25.60
2011 8 25.56
2018 7 25.54
Only one of ten months in the 1930s, only at position 8, versus 7 in the 2000s!
TMAX
1936 7 32.90 (C)
1934 7 32.79
1980 7 32.68
1901 7 32.64
1931 7 32.57
1930 7 32.40
1954 7 32.28
1937 8 32.27
1910 7 32.15
2022 7 32.14
Five of ten in the 1930s, and two atop, versus only one in the 2000s!
*
Strange month: July 1980!
*
But… now, look at how much warmer the 1930s were in reality:
https://drive.google.com/file/d/1WCsTI2zwfmw3FrxN7sn8GvCQurC1XOVJ/view
This graph shows, for TAVG and TMAX, the monthly differences between absolute temperature and the respective mean over 1900-2022.
The difference is, as so often, simply ridiculous.
*
Why are some TMAX graphs for CONUS so different on some blogs, despite still ‘heavy in use’ today?
Answer:
– the graphs were made over 25 years ago
thus
– with far less stations with contemporary AND historical data than today
– with far less accurate time series processing
and hence
– best suited for the ‘Skeptic’s.
One of the ‘best’ sources of such 100 % deprecated graphs is a regular WUWT climate denial poster, nicknamed ‘Tom Abbott’.
*
Of course: it is very well possible to show the 1930’s temperature in a much more ‘pleasant’ way:
https://drive.google.com/file/d/1a2Zike4y2GgZ5NdRqdElapLcEJiQiyVZ/view
But this is a graph constructed out of summing up for each year the days in which each station had its warmest day between 1900 and 2022.
*
Problems with my ‘unsupported graphs’, Robertson?
What about learning how to make them by your own?
But you never will learn that.
50 years ago, we saw in the bars, playing late at night on a flipper
” It’s more fun to compete! ”
Today, Robertson’s slogan instead is called
” It’s more fun to discredit! ”
Yeah.
Where is ren Palmowski with his eternal Coolista alarmism?
Let’s support him efficiently with a reference to the winter that visits the European Alps in July, with a few centimeters of snow over 2000 meters!
-4 C at the weather station Zugspitze (2900 meters altitude).
Incredible, unprecedented, wooaaaah :–)
I wouldn’t be surprised if Gosselin’s TricksZone posts at WUWT about it.
Once again, Bindebil is complaining about imaginary posts that nobody made
Oh the stalking dachshund is here again.
Let us tell him that maybe this time Gosselin’s TricksZone exceptionally didn’t post about snow in the Alps in July, the dirty trickster and permanent liar ‘P. Gosselin’ nonetheless was brazen enough to post the inverse of what happens in Germany since years:
https://wattsupwiththat.com/2023/07/29/meteorologist-no-need-to-worry-about-drought-in-germanyenough-water-in-the-ground/
But the gullible TricksZone follower Eben of course believes everything what Gosselin posts.
Alas, GHCN station data don’t begin to cover adequately the marine environment on a planet whose surface is more than 71% water. When century-long station records from island and coastal locations are proportionately sampled, the discrepancy in trend becomes becomes even more starkly evident than that shown here between wilderness and urban locations. So much so that the 20th century global minimum shifts from the early years to 1976–three years before the advent of satellite sensing.