
 Home/Blog
I’m not a statistician, and I am hoping someone out there can tell me where I’m wrong in the assertion represented by the above title. Or, if you know someone expert in statistics, please forward this post to them.
In regression analysis we use statistics to estimate the strength of the relationship between two variables, say X and Y.
Standard least-squares linear regression estimates the strength of the relationship (regression slope “m”) in the equation:
Y = mX + b, where b is the Y-intercept.
In the simplest case of Y = X, we can put in a set of normally distributed random numbers for X in Excel, and the relationship looks like this:
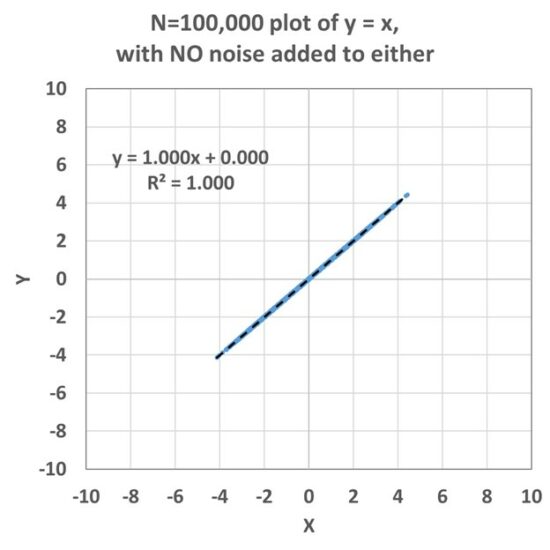
Now, in the real world, our measurements are typically noisy, with a variety of errors in measurement, or variations not due, directly or indirectly, to correlated behavior between X and Y. Importantly, standard least squares regression estimation assumes all of these errors are in Y, and not in X. This issue is seldom addressed by people doing regression analysis.
If we next add an error component to the Y variations, we get this:
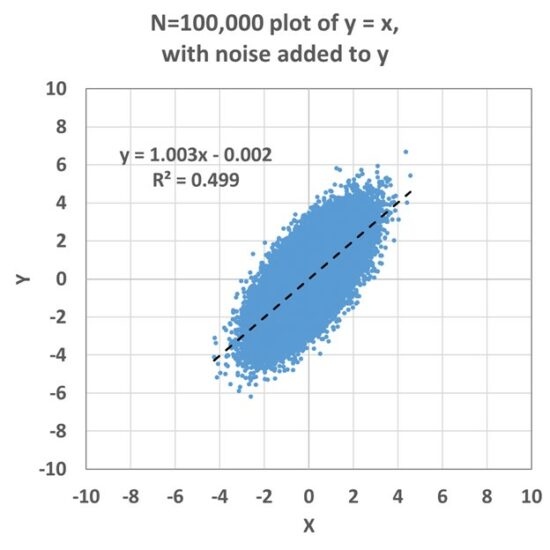
In this case, a fairly accurate regression coefficient is obtained (1.003 vs. the true value of 1.000), and if you do many simulations with different noise seeds, you will find the diagnosed slope averages out to 1.000.
But, if there is also noise in the X variable, a low bias in the regression coefficient appears, and this is called “regression attenuation” or “regression dilution”:
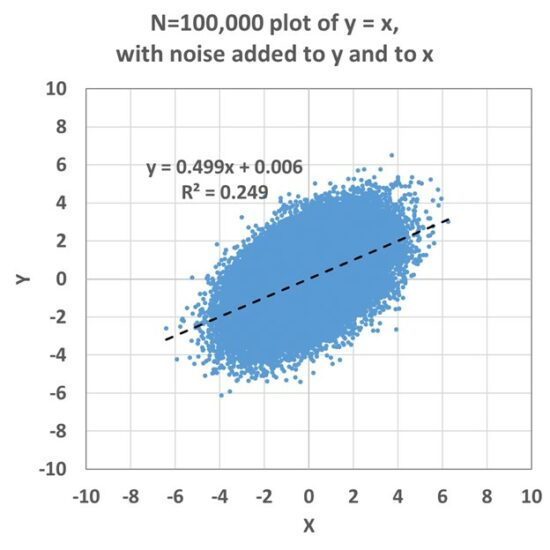
This becomes a problem in practical applications because it means that the strength of a relationship diagnosed through regression will be underestimated to the extent that there are errors (or noise) in the X variable. This issue has been described (and “errors in variables” methods for treatment have been advanced) most widely in the medical literature, say in quantifying the relationship between human sodium levels and high blood pressure or heart disease. But the problem will exist in any field of research to the extent that the X measurements are noisy.
One can vary the relative amounts of noise in X and in Y to see just how much the regression slope is reduced. When this is done, the following relationship emerges, where the vertical axis is the regression attenuation coefficient (the ratio of the diagnosed slope to the true slope) and the horizontal axis is how much relative noise is in the X variations:
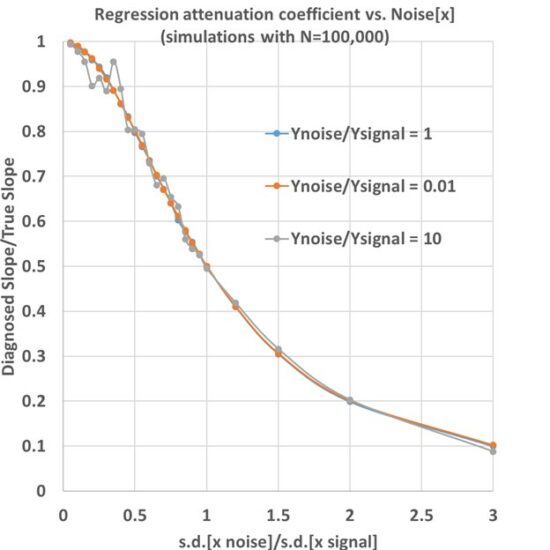
What you see here is that if you know how much of the X variations are due to noise/errors, then you know how much of a low bias you have in the diagnosed regression coefficient. For example, if noise in X is 20% the size of the signals in X, the underestimate of the regression coefficient is only 4%. But if the noise is the same size as the signal, then the regression slope is underestimated by about 50%.
Noise in Y Doesn’t Matter
But what the 3 different colored curves show is that for Y noise levels ranging from 1% of the Y signal, to 10 times the Y signal (a factor of 1,000 range in the Y noise), there is no effect on the regression slope (except to make its estimate more noisy when the Y noise is very large).
There is a commonly used technique for estimating the regression slope called Deming regression, and it assumes a known ratio between noise in Y versus noise in X. But I don’t see how the noise in Y has any impact on regression attenuation. All one needs is an estimate of the relative amount of noise in X, and then the regression attenuation follows the above curve(s).
Anyway, I hope someone can point out errors in what I have described, and why Deming regression should be used even though my analysis suggests regression attenuation has no dependence on errors in Y.
Why Am I Asking?
This impacts our analysis of the urban heat island (UHI) where we have hundreds of thousands of station pairs where we are relating their temperature difference to their difference in population density. At very low population densities, the correlation coefficients become very small (less than 0.1, so R2 less than 0.01), yet the regression coefficients are quite large, and — apparently — virtually unaffected by attenuation, because virtually all of the noise is in the temperature differences (Y) and not the population difference data (X).


Ross McKitrick has responded to my email to him on this subject, and it turns out he has one paper published, and another soon to be published, on this subject. Pretty technical. He claims that climate researchers using climate model output are actually getting over-inflated regression relationships by using “errors-in-variables” regression models that make improper assumptions regarding the source of “noise” in climate model data.
Deming regression uses paired measurements (Xi, Yi) and their errors (εi, δi).
It assumes that the errors in both X and Y are normally distributed, and the ratio of their variances is constant (λ = V(ε)/V(δ)). It also assumes a linear relationship between X and Y.
While Ordinary Linear Regression (OLS) minimizes the vertical distances between observed values of Y and the regression line, Deming regression minimizes the perpendicular distances between data points and the regression line.
OLS> vs Deming Regression Model
Deming’s method was first published in 1948. I suspect that climate researchers have heard of it by now, no?
https://towardsdatascience.com/biased-model-coefficients-part-1-2722128b9e1c
I just read through most of the responses to this issue and I can’t help think that the problem is in choosing the X variable. In this case where you are relating some measured quantity (Y) versus some variable measuring urban effect (X) which in this case is population size, the problem is how well does population size measure that urban effect. Not very well as population size is a rather poor correlate of the urban effect simply because cities of equal size do not necessarily share similar characteristics that contribute to the urban effect. Hence the variance in X is so large leading to a potential attenuation effect. Furthermore, it also seems unlikely that the variance in X is constant over population size leading to further variance in X. What you need to do is find a better measurement of the urban effect. Perhaps a measurement of some sort of albedo effect although I suspect there may be many ways to find a better X variable.
The Excel fit is minimizing y residuals, not x residuals.
So it is confused when x has big errors and gives an erroneous fit.
It seems from your final paragraph that the problem is the way temperature is being measured and not necessarily the urban density. It seems to me it could be the physical location, such as the difference between a park setting or store front, or it could be a problem with the shielding of the instrument to avoid the effects of direct sunlight, etc.
This impacts our analysis of the urban heat island (UHI) where we have hundreds of thousands of station pairs where we are relating their temperature difference to their difference in population density.
you probably need to revist your thinking about density as Oke did in later years, realizing it was dimensionally wrong. and could never be used in a proper regression.
further, consider how density estimates are made in EVERY population dataset.
compare accurate counts like us census with estimates. bottom line population is useless because human bodies dont cause uhi.
consider airports which typically are assigned 0 population, and industrial sites like mining operations in australia which have 0 population.
Steven, population of what? Just people or farms animals as they give off enough heat.
If urban heat islands include any man made source of heat that include indirect sources such as farms then it be even more difficult to resolve.
I do wonder if instead of thermometer readings whether thermal images could be used instead.
Thermal imaging won’t tell you much, in all probability. An example of possible error might be geologic hot-spots, apparently chaotic both as to location and intensity, as well as size.
Another might be biomass accumulation, either as a result of human activities – cattle etc., or more subtle – subterranean termites or other insects. The termite biomass is estimated to be at least equal to that of humans. Is there a known relationship between humans and termites?
All a bit tricky, I would suggest.
Totally agree that it is tricky, but surely with thousands of sites around the world it should be possible to find some ideal scenarios. Of course it will take time but would be worth while. One of the issues that makes it easier in North America & Europe is that population density quickly reduces away from towns & cities, often over a short distance. Can’t say the same about the uk.
Dr Roy Spencer & Co have done marvellous research that helps refine one of the more misleading areas, but of course more research is needed.
“population is useless because human bodies dont cause uhi”
Are you saying that ‘human’ caused warmth does not leak into the atmosphere?
I doubt that our body heat is contributing significantly to the global energy budget. We are only releasing by respiration energy earlier trapped by photosynthesis.
EM,
Doubts are fine, but experimental results either confirm or contradict assumptions – which are what doubts are!
It’s a fact that humans give off heat. It’s a fact that thermometers are designed to respond to heat. Generally, a thermometer will show an internal human temperature of around 37 C, as will an appropriately calibrated IR thermometer pointed at, say, your forehead.
You may claim that the heat produced by eight billion humans through converting hydrocarbons to water and carbon dioxide is insignificant, but in freezing temperatures at night, human heat production can prevent death, as in a snow cave, igloo, or sleeping bag. Quite significant.
Heat from the sun is absent, so comparisons with solar input are irrelevant.
Measurements will settle your doubts, but I doubt anyone has actually performed such measurements. I doubt that you can describe the GHE.
Ah, many doubts, few resolutions.
“Its a fact that humans give off heat…
Ah, many doubts, few resolutions.”
So why not provide some resolutions? As a Fermi problem this is easy. As an order of magnitude estimate …
A person eats ~2E3 kcal/day.
There are ~4E3 J/kcal
Thats ~ 1E7 J/day
There are ~ 1E5 s/day
That’s ~100 W per person.
There are ~20 people/km^2 (averaged over the whole earth)
That’s ~5000 W/km^2 from people
That’s ~0.005 W/m^2 from people.
So yes, even 8,000,000,000 people is insignificant in terms of earth’s over all energy flows. (And if people weren’t consuming the plants, other animals or bacteria would, so it is a net zero contribution.
For individual cities, population densities can be ~1000x higher, or ~5 W/m^2. Then it is a significant local energy source. Basically, the plants (and animals) we eat collect solar energy from farmlands and deliver it cities.
Of course, all of these are approximations, but they do give order of magnitude estimates, that anyone here should be able to do.
Entropic Man, the heat added to the environment by sedentary people in the UK is 6.8GW and much higher than that when any movement is involved.
Now add I pets, farm animals etc and heat added will only increase. So your assumption is not based on any evidence that can be found by heating/service engineers who need to rightsize heating & cooling equipment for the built environment.
Add to that climate science hasn’t established that the GHE is greater than 8 to 10C.
they have a whole lot of explaining to do.
Entropic man says:
I doubt that our body heat is contributing significantly to the global energy budget. We are only releasing by respiration energy earlier trapped by photosynthesis.
——————————-
gee now all you need to do is realize that all co2 does is rerelease energy previously trapped by another molecule too.
i sense we are making some progress.
Who said that body heat was the main component?
I don’t know. Who did?
Quick bit of googling and an amusing fact that seems to have escaped you. The proportion of cattle to people seems to be increasing as more people aspire to middle class meat eaters. Heat energy given off by cows is 1400 watt so cattle farms near weather stations could also add to the global warming data.
1:10 people:cattle spread out across the world may not be a lot but in condensed areas might be noticeable. So rather than urban heat index there might need to be cattle heat index.
If you look at the closed form equation for the slope in the linear regression model, it is easy to see the difference between noise in x and noise in y.
The denominator contains just two summations depending only on x: Sum(x_i^2) and (Sum(x_i))^2. If you add symmetric noise e_i to the x_i, the second sum will not change on average, but the first will pick up a term like Sum(e_i^2).
Adding symmetric noise terms to the y_i in the numerator will cancel in the limit.
Your plot is “in spirit” 1/(1 + e^2)
Thank you.
You’re welcome
To answer your question, the attenuation can be expressed in several different equivalent forms, one of which only depends on the noise in the x variable. But most of the time you don’t know the noise of a variable because you don’t know the underlying “true” (latent, i.e., unobserved) variable. You may, e.g., have an estimate of the ratio of the noise in x vs. noise in y and one can also express the attenuation in terms of that ratio. It is true that if the noise in x is much smaller than the noise in y, the attenuation is weaker (i.e., the regression coefficient is closer to the true proportionality constant), but the attenuation, when expressed in terms of the ratio, also depends on the correlation of the two variables. When the correlation is very small, the attenuation can be large _and_ tends to be difficult to estimate from data, i.e., the uncertainty in the estimated true proportionality coefficient is large. Feel free to contact me for more details.
2u2 thx for the explanation which I had overlooked.
Years ago I had to measure the flow of a fluid over an obstacle using a simple instrument that had to be held parallel to the flow. Of course I got distracted and took all measurements aligned in the same plain. As the great philosopher Homer said “doh!!”
I then tried to calibrate the instrument to see if I could work back to the velocity reading I should have made. Interestingly, I found that not only was it impossible but also other readings from more competent people were also likely to be wrong.
In chaotic system I doubt any removal of noise/bad data will be reliable.
If fitting y = mx +b, and most of the noise is in x, then should be fitting x = (1/m)y + c.
A LS fit to this will minimize the x residuals, and gives a correct slope 1/m.
Least squares is sensitive to outliers.
nate…the question is, how is the line fitted to the data?
Think about it. You have a set of x,y data points plotted on an x – y axis. How do you fit a line to the data? You could eyeball it then determine the slope of the line drawn, which would be in error. But you can’t arbitrarily declare the line without some manipulations behind the scenes.
As far as I understand, regression techniques do the same, by averaging the plotted points in an algorithm. Of course, you could start with a guessed line slope then refine it to get a more accurate slope.
What if you have so many data points that it is impractical to average them?
The magnificent outlier sensitivity of linear estimates based on Ordinary Least Squares
Months ago I compared, for the UAH 6.0 LT anomaly Globe time series, the linear estimates of
– the source itself
– its simple 13 month running mean (SRM)
– its cascaded triple (C3RM) resp. quintuple (C5RM) 13 month running means (with window sizes according to Vaughan Pratt’s numbers)
for the months Dec 1978 – May 2023.
*
The Pratt numbers and associated window sizes:
C3RM: 1.2067, 1.5478 -> 13 / 11 / 8
C5RM: 1.0832, 1.2343, 1.4352, 1.6757 -> 13 / 12 / 11 / 9 / 8
The linear estimates of all series were computed wrt the active window of the C5RM, in C/decade, as it is the smallest one:
Source: 0.143 +- 0.007
SRM: 0.144 +- 0.005
C3RM: 0.144 +- 0.004
C5RM: 0.143 +- 0.004
These estimates show that despite increasingly eliminating outliers present in the source, the simple running mean and the two cascaded running means nevertheless show nearly the same trend as this source.
Eliminating outliers (wherever strong deviations of a mean are viewed as such) may be a wishful task; but it does not necessarily have an influence on the computation of linear estimates based on Ordinary Least Squares.
*
When now computing, instead of linear estimates, the coefficients of e.g. a third order polynomial mean, you obtain indeed numbers differing a little bit more.
An evaluation of the coefficients in ‘y = ax^3 + bx^2 +cx + d’ for the source and the running means over the 484 months of C5RM’s active window (Mar 1981 – Jun 2021) gives the following temperature increases during this period:
Source: 0.745 (C)
SRM: 0.731
C3RM: 0.723
C5RM: 0.720
*
Finally, when comparing these numbers to those obtained from linear estimates for the same period
Source: 0.578 (C)
SRM: 0.581
C3RM: 0.579
C5RM: 0.577
you suddenly discover that there must be some nice little acceleration in UAH’s data.
*
I would enjoy commenters like Mark B or bdgwx doing the same job and confirming/informing the numbers above.
Why not show a graphic?
https://drive.google.com/file/d/1wM0EFv5ZlMCpG3L4BsiYNP_ZEfPkbPxb/view
I just quote what the literature says. Least squares is sensitive to outliers.
“Because of the extreme sensitivity of least square, a single outlier in a large sample is sufficient to deviate the regression fit totally as its breakdown point is 1/n which tends to zero with the increase in sample size n”
https://www.mathworks.com/help/stats/robust-regression-reduce-outlier-effects.html
“Note Least squares regression is not resistant to the presence of outliers.”
https://www.researchgate.net/post/Why_do_estimation_techniques_based_on_least_square_approach_fail_in_the_presence_of_outliers
Blinny still thinks that SRM are a valid statistical technique.
It was 100% predictable: ‘RLH’ alias Blindsley H00d is unable to technically contradict my results:
Source: 0.143 +- 0.007
SRM: 0.144 +- 0.005
C3RM: 0.144 +- 0.004
C5RM: 0.143 +- 0.004
Results which clearly show that – contrary to what Blindsley H00d always claims: not just the SRMs, the simple running means but the cascaded ones as well – have almost exactly the same linear estimates as these poor sources, all thoroughly contaminated by terrible outliers.
*
Instead of a valid, convincing contradiction, Blindsley H00d, as always, resorts to unnecessary appeals to authority as well as insinuations and lies like
” Blinny still thinks that SRM are a valid statistical technique. ”
I never claimed such a nonsense but have always said and repeat that simple running means are a very good tool to show, within a community of laypersons, the essence of sometimes very cryptic, disparate time series – without however scraping away details relevant to their comparison, like e.g. here:
https://drive.google.com/file/d/12ulz1gkkkAD4S5Y_sHIufqLeuXZm0HmO/view
*
Only overly opinionated persons like Blindsley H00d would argue that these many, ever-fading bumps – which perfectly signal an escape from a large glacial isostatic rebound zone – are nothing more than troubling ripples and distortions that need to be entirely eliminated.
*
And since Blindsley H00d says he is a highly qualified IT specialist with a master’s degree, it will certainly not be difficult for him at all to create for us, out of this trivial data source
https://www.psmsl.org/data/obtaining/rlr.monthly.data/rlr_monthly.zip
the same graphic as above – but of course with impressing cascaded running means, instead of these simple-minded SRMs, which he always disapproves of and even pursues mercilessly for purely ideological reasons.
He very probably never has ever used any cascaded running mean as input data, and merely proudly, endlessly shows them on his blog.
*
No need for any further comment: Blindlsey H00d is always right and never has ever admitted being wrong (some small lexical mistakes excepted).
“simple running means are a very good tool” which contain various distortions such that someone claimed that he wouldn’t wish them on his worst enemy.
Care to predict what a C3RunningMedian trend is for 12 months periods of the UAH Data?
As always, Blindsley H00d:
Stop talking, arguing, asking others for what you yourself should do.
Start working on your ‘C3RunningMedian trend for 13 months periods of the UAH Data’, and present the results on this blog.
I repeat: 13 months, Blindsley H00d.
As do the scientists you discredit because they use simple 13 month running means, like Roy Spencer or… the Belgian SILSO team.
Why 13 months when a year has only 12 months?
You can think of doing linear regression on running averages as linear regression on the original data plus a term equal to (running average minus original). Then see my comment above. The “noise” term here is not explicitly generated from a symmetric PDF, but for the UAH data will to a great extent cancel in the Sum(y_i) terms (plot it and see) since the dominant signal is oscillating.
It makes no sense to me to fit a cubic polynomial to the data. If you want to show “acceleration” use a quadratic and show the statistical significance of “b”. Or take the log and fit with linear regression for an exponential growth model.
Mark S
” It makes no sense to me to fit a cubic polynomial to the data. ”
You are of course right.
But often enough, cubic splines follow their data source better than quadratic ones, and that was for me layman the reason to use them.
I see that for example when looking at SILSO’s monthly Sun Spot Number data and looking for a projection into the near future.
Neither second let alone fourth order polynomials look good to me, but third order gives a good result.
This has nothing to do with math. Just layman’s gut feeling :–)
Higher-order polynomial interpolation is more accurate if the data is smooth (in the mathematical sense).
Higher-order polynomial extrapolation is a very dangerous game. The higher order terms will always dominate once the extrapolation window is long enough and then quickly head toward + or – infinity.
I had students do a project to predict the Dow Jones index one day in the future using extrapolation and interpolation (the latter under the fantasy scenario that they knew what the index would be the day after tomorrow, but not tomorrow). It is a useful exercise in futility.
Mark S
Thanks for your interest.
” It is a useful exercise in futility. ”
At least 100% agree, but…
I never intentionally use polynomial fits (beginning with the first degree) to predict anything.
I use them only for the comparison of existing data, e.g.
https://drive.google.com/file/d/1y6S_ZM1KZElr7Kfz42UCQHa-MX5WWUYv/view
to understand how much for example cascaded running means really differ from the simpler ones, by evaluating the polynomial equation coefficients provided by the spreadsheet calculator, and comparing the amazingly similar results.
*
It’s nice however to look at what these polynomials do when you extend their scope beyond existing data, like here:
https://drive.google.com/file/d/1Q2EolgfxZCASl3YJwnL9rLH-4MNMIs8P/view
The red 3rd order poly is not so very far from McIntosh/Leamon’s prediction based on complex evaluations of the Hale cycles :–)
Just for fun!
Bindidon says… “you suddenly discover that there must be some nice little acceleration in UAHs data.”
Now break down the UAH data and you’ll find out why.
‘… break down… ‘
Sounds a bit cryptic to me. Could you explain?
Break the data down into segments. Compare the segments and you’ll see why you detected an acceleration.
Nothing against sound skep~ticism!
But ‘Break the data down into segments’ is typical pse~udo~skep~ticism, reminding me how people broke global surface time series into segments and computed their local trend.
That’s the cheap escalator trick.
It’s also ‘reasoning’ like the Robertson guy who (indirectly, without naming him of course) discredits Roy Spencer’s trends and claims the trend is only an artificial calculation. What a load of nonsense.
You must analyze time series as a whole, and compare for example the (currently tiniest) difference between linear and quadratic fit.
Anything that can be used for good, can also be used for evil.
If you don’t like segmenting data, then that’s alright. Do what works for you.
Not a mathematician, but it seems that the sd(Y) terms cancel out when the equation for the correlation coefficient ‘r’ is put into the equation for the OLS slope:
The OLS slope is r * (sd(Y)/sd(x))
And r is COV(X,Y) / (sd(X) * sd(Y))
Where r is the correlation coefficient.
?
I would like to see statisticians stop using the word noise in statistics since it is misleading. The word noise, used more correctly in electronics circuits, is a reference to an unwanted signal. Where in statistics is a data signal unwanted? It has to mean the data is in error to some degree.
Of course, the various filters and estimations used can introduce noise due to the inaccuracy they can introduce. Remember, when you do a least squares fit, you are estimating, and the error produced could be regarded as noise. However, it used to be called an error, not noise.
In Roy’s straight-line X-Y example there can be no noise because X = Y and produces a straight line. However, in the other example with a multitude of data points though which a trend line has been drawn, there is no longer an accurate x – y relationship. It is an estimate, no matter how well the trend line represents the average of the data.
A I understand regression, it is simply a numerical method of finding an average for a set of data points as opposed to eyeballing a line through the plotted points. The thing I don’t like about it is number-crunching blindly without understand the meaning of the results.
“Where in statistics is a data signal unwanted?”
When you mix 2 signals together.
Do you mean averaging the signals statistically? If so, any error produced is human error and not an error in the data.
Is that what noise means, human error due to the statistical methods employed?
You asked “Where in statistics is a data signal unwanted?”. I replied with an example.
“The word noise, used more correctly in electronics circuits, is a reference to an unwanted signal. ”
Which is exactly what we have here. There is a ‘wanted signal’ for how population impacts temperature. Then there are MYRIAD ‘unwanted signals’ that ALSO impact temperature (El Nino, volcanoes, CO2 …)
… and please don’t forget the absolutely unwanted signal that results from processing the data :–(
Ha ha, you’re closer to the truth than you realize.
Ho ho, here is someone who may be underestimating that anyone who processes data every day inevitably learns to understand that :–))
Tim…the difference is that we are adding the noise with our analytical tools then claiming it is noise in the data. We need to make it clear that such noise is human-induced error and not an error in the measurements that produced the data.
The noise in electrical circuits is incidental and very natural. Shot noise is produced by collisions between free electrons and atomic and other particles like electrons in the conductor. EMI noise could be noise introduced by fluorescent light EM radiation or by sparking brushes in the commutator of an electric motor.
“adding the noise with our analytical tools then claiming it is noise in the data.”
I would say there is plenty of natural ‘noise’ in climate data, too. ‘Our analytic tools’ introduce small amounts of noise relative to day to day weather changes.
tim f…”I would say there is plenty of natural noise in climate data…”
***
If you re talking about data from NOAA, GISS, Had-crut, or BoM, that’s true. It’s full of fudged data. But UAH data is clean, straight from the sat telemetry. UAH does not need to fudge the data because the sat scanners cover 95% of the entire planetary surface whereas thermometers cover, on average, about 1 thermometer per 100,000 square kilometres.
If you take a reading from a thermometer in the field, say in a Stevenson screen, there is always a built in error to the reading taken by human eyes, but it can be stated with an error margin with confidence. However, if you take two reading per day and average them as a high and a low, then you introduce error that can vary day to day depending on the range of high and low. In other words, how accurate is the average claimed?
Now take that kind of error and spread it over NOAA’s 1500 thermometers to measure the planet’s solid surface and you get an essentially unknown global average.
I don’t think we are talking about such errors with regression, we are talking about errors built into the regression algorithm that creates an even deeper error. That’s a basic problem with statistical methods, understanding the context in which the data was produced and how the statistical method employed applies to it.
Another problem with such methods is the bs factor. Gallop polls claim, using a sample of a huge population in comparison that they can predict an outcome, they they can claim a confidence level of 90% or higher that the results are correct. They may have that degree of accuracy based on the math applied but whether that outcome represents the huge population is another matter.
Sample size is everything in statistics and claiming a 90% confidence level based on a sample size of 1000 from a population six of 40 millions is not only absurd it is is hysterically laughable.
Gordon, the “natural noise” is “weather”.
Things like data analysis by NOAA, GISS, Had-crut, or BoM would actually tend to REDUCE noise. The very word “homogenize” tells you the data is smoothed using other nearby stations. This would mean less noise in the resulting temperature records.
“claiming a 90% confidence level based on a sample size of 1000 from a population six of 40 millions is not only absurd it is is hysterically laughable.”
Sample size is NOT the problem. An accurate, random sample of 1000 from 40 thousand or 40 million or 40 billion is sufficient to draw statistically significant conclusions.
The issue is not sample size, but “accurate” and “random”. If you don’t get a true random sample, that can badly skew the results (eg “Dewey Beats Truman”). If people lie or hang up on Gallop so that they get incorrect data, that can badly skew the results. THOSE are the potential problems, NOT sample size per se.
tim…”Things like data analysis by NOAA, GISS, Had-crut, or BoM would actually tend to REDUCE noise. The very word homogenize tells you the data is smoothed using other nearby stations. This would mean less noise in the resulting temperature records.
***
I’ll give you this, you are very loyal to the cheaters at NOAA, GISS, Had-crut, and Bom. Before they homogenize, in a climate model, they interpolate. That means they synthesize temperatures that were not measured, based on measured temperatures at locations up to 1200 km away. That is cheating right there. Then they homogenize manufactured temperatures with real temperatures to make temperatures look even, not to hide errors.
—
“Sample size is NOT the problem. An accurate, random sample of 1000 from 40 thousand or 40 million or 40 billion is sufficient to draw statistically significant conclusions”.
***
If you truly believe that, your understanding of statistical methods is seriously flawed.
After a class in probability and statistics I cornered the prof and asked him about gallops polls, whether they were accurate with such a small sample size. His reply was “Oh, no you don’t, you explain to me first why you think they are inaccurate”. I told him the sample size was way too small for the population, and he agreed.
Unlike others, and to his credit, he did not try to defend the nefarious methods and insinuations offered by polling companies, that their results have a 95% confidence level, based on a sample size of 1000 for a population of 38 million.
Gallop polls are a perfect example of Mark Twain’s claim that there are three kinds of lies: Lies, damned lies, and statistics.
Oh, I agree that the sample size is pretty small. They have to balance better statistics vs higher costs (and slower turn-around time). But they explain that there are statistical uncertainties in the results, and these can be large. Its not their fault per se that people don’t pay attention and/or don’t understand statistics. (But there might be fault with the media for not being up front about it).
The pure statistics are pretty cut and dried. You need to understand the binomial distribution (and maybe the hypergeometric distribution if you REALLY want to dig into details about sample) 1000 out of 10,000 instead of 1000 out of 10,000,000).
The far bigger problem — as I pointed out before — is getting an accurate and random sample. If you do a phone poll, you only get people with phones. And further, you only get people with phones who are willing to answer a pollster. If you do a poll on the street, you only get people who are on that street in that city at that time. And maybe those people lie. THESE sorts of errors are far more troublesome than the purely statistical errors.
Exactly, Tim Folkerts
And we see once more how clueless Robertson is with regard to a difficult engineering discipline like data processing, for example extracting such unwanted signals out of the data of ten thousands of weather stations.
” Multiple linear regression? What’s that? A new CO2 effect accelerator? ”
No wonder when we recall his stubborn, perverse claim that NOAA for example would still use only 1500 stations worldwide these days (was has been true in 2010 for a few weeks).
In my native tongue we say in such incurable cases ‘Plus bête tu meurs.’
binny…”for example extracting such unwanted signals out of the data of ten thousands of weather stations…”
***
There would be no unwanted signal if scientists used a slide rule or an abacus to compute the averages. The errors come into it when they use new fangled algorithms, over which they have no control, and which they cannot verify as they go along, as would a good scientist, that add noise due to their averaging methods.
The output would improve dramatically if they measured temps every hour, or more frequently, rather than taking two temps a day and averaging them.
“At very low population densities, the correlation coefficients become very small…. yet the regression coefficients are quite large, and apparently virtually unaffected by attenuation”
Biologists use(d?) Reduced Major Axis regression (RMA) when there is error in the X variable and a quick stab at coming up with the RMA slope was to divide the OLS slope by the correlation coefficient (r)
So it might just be that the low population communities have, for example, more of the things actually cause this warming (maybe more outbuildings per person or perhaps more hard standing per person).
RMA minimises the area of triangles between the datapoints and the regression line (whereas Demming type regressions work on minimising the length of right angle lines between the the regression line and the datapoints).
RMA has some nice features… the slope of the regression of X on Y is the inverse of Y on X. It was also known as geometric mean regression.
For an overview see:
https://www.palass.org/publications/newsletter/palaeomath-101/palaeomath-part-1-prospectus-regression-i
If you want to give it a whirl with a bit of your dataset there is a nice free standalone .exe program called PAST (that does lots of other stats). Under Model->Linear-> Bivariate regression thereare radio buttons that allow you to switch between various regression methods and compare thier slopes and plots. It has spreadsheet data entry too. Just highlight the two columns (using shift) and click through to Bivariate regression:
https://www.nhm.uio.no/english/research/resources/past/
It has an online help file , so click on the ‘help’ tab.
If there is a ‘defect’ with RMA it is that totally uncorrelated variables have a regression slope of 1.
Thank you too.
Instead of arguing over this stuff, let’s discuss the actual science. We can start with Ocean Acidification and move on to changes in the Atlantic Meridional Overturning Circulation.
How any of you can do that?
Without meaning to sound like a doomsayer, I suppose I will.
A previous commenter, “Anon for a reason”, mentioned a difficulty with data collection where fluid dynamics is Involved.
There are published studies which show that separating “errors” from normal chaotic processes is not easy – if possible at all.
A deterministic chaotic system does not require external influences to exhibit chaotic behaviour involving strange attractors. Curve fitting merely imposes human desires upon data, writing off anything that does not fit with preconceived notions as “errors”. Bad move. Ignoring what appears to be the naturally chaotic nature of universal physical laws will not bend nature to your will.
Nothing wrong with observing, though. Tycho Brahe was an incredible observer, capable of unprecedented accuracy, for his time, even though his ideas about what he observed turned out to be erroneous, to say the least. Kepler used Tycho’s records to develop Kepler’s Laws, etc.
Maybe Dr Spencer will show something that hasn’t been noticed before. Nothing wrong with that.
I was curious about this result, and after a little investigation, I have one insight (that I think is valuable). There is an important distinction between uncertainty in the measurements themselves, and variations intrinsic in the system being measured.
Let me use an analogy. Suppose you want statistical information about the density of several object of varying sizes, so you measure volume (x) and mass (y) and do a regression fit.
* if you can accurately measure the volume but not the mass, you don’t need “regression attenuation” because the error is in y
* if you can accurately measure the mass but not the volume, you DO need “regression attenuation” because the error is in x.
* if you can accurately measure the volume and the mass, but you have objects of varying composition (and varying actual density), then you again do not need “regression attenuation”.
All of these will lead to scatter in the plotted results, but they would require different corrections for “regression attenuation”. (And of course, all three could be contributing at once.)
So much of the issue would come down to what you think is causing the variations you see.
* If you think the variations are due to how well you know the temperatures, you do NOT need “regression attenuation”.
* If you think the variations are due to how well you know populations, you DO need “regression attenuation”.
* If you think the variations are due to the system itself (which frankly seems like it would be a large part of the variation), again you do NOT need “regression attenuation”.
I think you misunderstand regression attenuation.
Regression attenuation is a statistical phenomenon that occurs when there is measurement error in one or both of the variables used in a regression analysis. This measurement error can lead to underestimation or “attenuation” of the true relationship between the variables.
Attenuation bias is never a good thing.
I think you misunderstand what I said.
“Regression attenuation is a statistical phenomenon that occurs when there is measurement error in one or both of the variables used in a regression analysis.”
Actually, it just occurs with the ‘x’ variable. When there is measurement uncertainty in x (eg, volume, eg population), then the slope is ‘diluted’. When there is measurement uncertainty in y (eg, mass, eg temperature), then the slope is not ‘diluted’.
“Attenuation bias is never a good thing.”
Right. I don’t think I implied it was ‘good’. Just that it can be present.
You did say “…you DO need ‘regression attenuation’.”
I must have misapprehended your meaning. My bad.
P.s.: when the dependent variable (Y) is measured with error, it can also result in attenuation bias. In this case, the relationship between the variables may appear weaker than it truly is.
As you were.
More specifically, I meant you do need TO TAKE INTO ACCOUNT regression attenuation when there is noise/uncertainty in the x data.
Also, simply “being weaker” (smaller R^2) is not “regression attenuation”.
Noise in the y signal reduces R^2 but leaves the slope the same.
Noise in the x signal reduces R^2 AND reduces the slope.
Do not confuse the correlation coefficient with the regression coefficient. They serve slightly different purposes and have distinct characteristics.
The strength or weakness of the regression coefficient refers to how much change in the dependent variable is caused by a one-unit change in the independent variable.
The correlation coefficient indicates the strength and direction of the relationship between the two variables but does not provide specific information about the size of the effect or causation.
That is about all there is to say on this topic, no?
Why all the silence on the size of the ozone hole?
Last year there were a number of warnings issued about the ozone situation being unusually bad and the risk of skin cancer.
They have claimed that the Montreal Protocol has saved 2,000,000 people a year from skin cancer.
Yet this year the ozone appears even worse and dead silence about it.
“Why all the silence on the size of the ozone hole?”
ummm … maybe because this is a thread about statistical details about UHI. Look for threads about ozone holes if you want to discuss ozone holes.
Tim..it’s related. This blog is largely about the allegation that a trace gas can cause catastrophic warming. The ozone layer theory falls into the same category of pseudo-science.
Oh no. Not the ozone layer …
Hunga Tonga put a lot of water vapor into the stratosphere. Water vapor does destroy ozone.
Too, the magnetic field is weakening so more of the higher energy waveparticles from the sun are getting through and bombarding the ozone to pieces.
Not much more to say … it doesn’t suit the narrative of the green agenda where tis only humans what destroys the ozone layer … hence the silence.
Dead silence? Only for those who don’t want to hear.
It’s easy to recognize pse-udo-skep-ti-cal people: they prefer to guess, to argue about things done wrong instead of looking for information.
https://www.space.com/ozone-hole-antarctica-three-times-size-of-brazil
https://www.esa.int/Applications/Observing_the_Earth/Copernicus/Sentinel-5P/Ozone_hole_goes_large_again
https://atmosphere.copernicus.eu/cams-data-show-one-largest-antarctic-ozone-holes-record-august
https://ozonewatch.gsfc.nasa.gov/
*
That the absence of ozone is not healthy is known to all those who have eyes and ears and… use them.
Thanks for those arcane references Bin.
Thats a great chart from copernicus.eu Its interesting that both 2021 and 2022 were hitting record ozone hole sizes frequently.
The UN was claiming victory on this just recently and not exactly telling people that record levels were occurring and to be especially wary.
Didn’t you find any mainstream press on this? I was searching for duck and cover warnings and saw none for this year though they had some in New Zealand last year.
Of course the UN will not mention it as the Montreal protocol was the so-called successful foundation that some of the AGW manipulation is based on. I do wonder how much of the ipcc work is based on poor science. Especially when other research is ignored to an excessive level.
its a grift.
re: kerry emmanuel to richard lindzen. its good for science! (i.e. the scientists), works also for government institutions (real or quasi), ngo’s, lobbyists, and globalists.
Sometimes you can get sad of this strange blog scanner which lets pass any nonsense but blocks answers to it.
https://drive.google.com/file/d/155tIvnUgIQF2FWObmTYVlx0feEiIUun_/view
Ooops?! Wrong place for this comment.
Hunter boy, I can imagine how you were ‘searching for duck and cover warnings’.
I just need to recall for example how you
– discredited scientists who computed the lunar spin’s period though being absolutely unable to understand what they did;
– argued that Roy Spencer in persona would have claimed that data gridding would increase temperatures.
OMG.
Bin, you didn’t find any duck and cover ozone either? whats with all the bogus claims about stuff you wrongly claim about me?
are you suggesting you have an excuse for not finding any duck and cover stories designed to warn the public and I don’t.
you must have a severe case of derangement syndrome over anybody who doesn’t worship your daddy.
” … about stuff you wrongly claim about me? ”
Wrongly?
Maybe YOU ‘forget’ what you wrote on this blog, but… I don’t, Hunter boy.
binny…”I just need to recall for example how you
discredited scientists who computed the lunar spins period though being absolutely unable to understand what they did;”
***
No scientist has calculated a lunar spin period, never mind ‘the’ lunar spin period. Your hero, Meyer, specialized in charting the Moon’s position in its orbit, which has nothing to do with local rotation. You have yet to post one scientist who has proved the Moon rotates about a local axis, most of them having talked about libration, not spin.
Cassini provided no proof, nor did Lagrange or LaPlace. All you have done is wave your arms and make silly claims.
However, another good scientist, Tesla, provided proof that the Moon cannot rotate on a local axis.
Prove that an ozone level in the stratosphere which is a tiny fraction of the atmosphere as a whole, can block dangerous UV. In particular, tell it to the people worldwide who have developed skin cancer from the UV that ozone has allegedly blocked.
Spend a day in the Summer sun without a hat or sunscreen. Look at yourself in the mirror in the evening.
You remind me of a cartoon I saw recently.
First picture.
A tourist is standing by a lake as a warden warns him to beware of crocodiles.
Second picture.
The tourist says “Crocodiles are a myth spread by the tourism industry to make money. Show me a scientific paper to prove that crocodiles are dangerous.”
Third picture.
The tourist is being eaten by a crocodile.
ent…you seem to be agreeing with me. I think UV causes sunburns and cancer and if the ozone layer is blocking it, why is that so?
Sometimes you can get sad of this strange blog scanner which lets pass any nonsense but blocks answers to it.
https://drive.google.com/file/d/155tIvnUgIQF2FWObmTYVlx0feEiIUun_/view
Still no evidence that Meyer computed a lunar spin, whatever that means. I suppose they are referring to a local rotation. Nor LaGrange.
Roy has likely installed a nonsense filter, hence the failure of your post to get through.
binny, in a fit of early onset dementia, claimed I made the following statement….” Multiple linear regression? Whats that? A new CO2 effect accelerator?
***
I have never posted such a statement and there is no such statement in the current thread, never mind from me.
No one claimed you did, Robertson.
It just 100% fits your usual narrative: the 360-degree den~ial of everything.
Time dilation and other results of Einstein’s theory of relativity (some of which were even hinted at by… Newton in his Opticks treatise), lunar spin (which Newton 100% agreed with), GHE, the actual consequences of COVID19, slight global warming (visible even in UAH, the series with the smallest temperature increase per unit of time), etc. etc. etc.
*
Anyone who believes in Robertson’s garbage deserves it.
The very best thing would be if more and more readers on this blog suspected that you don’t believe in anything what you write.
Thanks for the opportunity to elucidate.
“Time dilation and other results of Einsteins theory of relativity (some of which were even hinted at by Newton in his Opticks treatise),”
***
I don’t recall Newton talking about the nonsense produce by Einstein. Newton was a real scientist who did his own experiments whereas Einstein did most of his work in his mind via thought experiments. In doing that, he confused time with a real, physical phenomenon.
I don’t recall Einstein making any breakthrough observations like mass, gravitational force, laws of motion, etc. All Einstein produced were obfuscated thought experiments that make little sense upon closer examination.
—
“lunar spin (which Newton 100% agreed with)”
***
Correction, the translator thought he agreed. Newton apparently did not since he declared that…
1)the moon moves with a linear motion, which is…
2)bent into an orbital curve by gravity, and…
3)the same side of the Moon always faces the Earth.
He was obviously describing curvilinear translation without local rotation.
—
“GHE, the actual consequences of COVID19”
***
No need to comment on GHE, the trapped IR on which the theory is based has no effect in a real greenhouse. Re covid, only a fraction of 1% of any population was affected. Even at that, the numbers were inflated by faulty reporting that intentionally confused deaths due to covid with deaths from other illnesses, or simple old age. Most people who died of covid had faulty immune systems.
—
“…slight global warming (visible even in UAH, the series with the smallest temperature increase per unit of time)…”
***
I have never denied warming, I have denied the popular anthropogenic cause of it. I have also questioned the methods used to derive a global average.
The Supreme Court of Canadas Reality Check on Trudeaus Climate Impact Act
– 21 hours ago
https://wattsupwiththat.com/2023/10/15/the-supreme-court-of-canadas-reality-check-on-trudeaus-climate-impact-act/
“In a recent ruling that sent shockwaves through the corridors of Canadian power, the Supreme Court of Canada delivered a blow to Prime Minister Justin Trudeaus environmental aspirations. The court found significant portions of the federal governments Impact Assessment Act (IAA) unconstitutional, siding with provinces like Alberta that have long argued against what they saw as federal overreach into areas of provincial jurisdiction.”
Good deal!!! Trudeau is Canada’s equivalent to Biden so we need to vote both out in the next election. Last time I looked, he was mired at 32% of the popular vote but I have since read that the Tory leader Poilievre is ahead of him. That can only mean Trudeau has sunk even lower.
EVEN THE REPUBLICAN SQUISHES ARE BAILING ON THEM: Huntsman family, longtime Penn supporters, will halt donations to unrecognizable University. In an email to Magill obtained by The Daily Pennsylvanian, Huntsman a former University trustee, governor of Utah, and United States ambassador said that the Huntsman Foundation will close its checkbook on future donations to Penn. Huntsman, whose family has donated tens of millions to Penn over the course of three generations, wrote that the University had become almost unrecognizable due to administrators response to antisemitism.
Posted at 11:21 pm by Glenn Reynolds
https://instapundit.com/
Powering AI could use as much electricity as a small country
https://tallbloke.wordpress.com/
“The definition of a small country could change to not so small quite quickly. When so-called net zero climate policies are threatening to make electricity supplies more restricted and unreliable, the added effect of AI demand could become significant. This is on top of the issue with data centres the BBC recently reported that Data centres use almost a fifth of Irish electricity.”
Maybe they should move it to Iceland.
Gordon Robertson wrote: “Prove that an ozone level in the stratosphere which is a tiny fraction of the atmosphere as a whole, can block dangerous UV.”
This is how the Ozone layer works:
1/ Aβsοrρτiοn of UV radiation: O3 + UV-B or UV-C radiation => O2 + O
2/ Ozone regeneration: O + O2 => O3
These are the monitoring data for this important life sustaining processes:
NASA Ozone Watch: Images, data, and information for atmospheric ozone
A,
You really don’t know what you are talking about, do you?
You have it precisely back to front. Maybe you could explain your assertion that O + O2 => O3. Does this happen all by itself, or is some form of magic involved? Maybe you could expand your assertion, and look less foolish? Do you think that some energy might be involved – possibly sufficiently energetic UV photons?
Dream on.
Sure, but first, answer me this. A horse, a cow, and a deer all eat the same stuff – grass. Yet a deer sh!ts little pellets, while a cow turns out a flat patty, but a horse produces clumps. Why do you suppose that is?
A,
Do you have your own gibberish generator, or do you borrow Willard’s?
Both seem equally capable of producing irrelevant shit.
Carry on.
“Why do you suppose that is?”
Because they are 3 different animals/species.
Congratulations. Assuming it is a purely scientific interest of yours, it is something that most of us would not have thought about. If it is related to some other interest, you have my sympathy.
“most of us would not have thought about”
Only if you are dumb.
RLH…Tim S is trying to tell you that he does not like to think too deeply or to see the humourous side of things.
ark…your formula does not explain how ozone, at about 4 ppmv can block all dangerous solar radiation of the UV kind. Obviously, even a far more dense atmosphere near the surface does not block a significant amount of solar radiation, even though clouds, with larger droplets of water, can.
I fear this ozone hole scare is nothing more than our current scare that a trace gas can cause catastrophic effects on global warming/climate change. You can get a burn in summer even on a cludy day, so if UV can get through thick clud, how does ozone block it at 4 ppmv?
Gordon Robertson wrote:
“ark…your formula does not explain how ozone, at about 4 ppmv can block all dangerous solar radiation of the UV kind. Obviously, even a far more dense atmosphere near the surface does not block a significant amount of solar radiation, even though clouds, with larger droplets of water, can.”
1/ You give me too much credit. The first theory for the origin of the ozone layer was proposed in 1930 and the elucidation of the chemistry behind the ozone formation and depletion was awarded the Nobel prize in chemistry 1995.
2/ The Sun emits a wide range of electromagnetic radiation, and this is distributed across various wavelengths. UV radiation is one part of this spectrum, and it accounts for a relatively small fraction of the total solar energy received by the Earth. All radiation below 300 nm is aβsorβed by the stratospheric ozone layer, thus shielding life from mutagenic short UV radiation. See below…
Spectral distribution of the sun’s radiation outside the atmosphere and at sea level
ark…”UV radiation is one part of this spectrum…”
***
You should b questioning this stuff rather than buying into it. You learn through challenges, not through agreement.
UV is the most powerful radiation from the Sun and it’s the one ozone is supposed to block. Obviously, based on the number of skin cancer victims we have each year, it doesn’t do a very good job.
Since the ozone hole is over Antarctica, and Antarctica gets very little solar radiation, I doubt that any people sun-bathing in Antarctica [/sarc off] will be affected by UV coming through the hole. Antarctica is pointing the wrong way to receive much direct EM. Apparently no one is worried about UV elsewhere since legislation to ban freon et al is aimed at the ozone hole.
I am calling bs on your claim that all radiation below 300 nm is absorbed by the stratosphere. If someone won a Nobel for claiming that, he/she should be required to turn in the Nobel and do 50 pushups.
As I pointed put before, the density of the atmosphere at sea level cannot stop UV from causing skin cancer, how is a trivial amount of ozone going to do it?
Gordon, you should be questioning this stuff before spouting off.
Solar UV varies from 400 nm down to ~ 100 um, and different wavelengths are affected differently by the atmosphere. You seem to be treating UV-A, UV-B, and UV-C as if they all caused the same damage and are all absorbed by ozone the same.
Read wikipedia for a quick intro, or do more research on your own.
https://en.wikipedia.org/wiki/Ultraviolet
Short answer effectively all UV below 280 um is absorbed. And very little from 280 – 300 gets through. It is the UV above ~ 310 nm that gets thru and does most of the damage to skin.
Robertson never reads anything.
Like all Pse~udo-skep~tics, he just scans documents for the presence of what he dislikes or the absence of what he expects.
And above all: Wiki is a good source only in the rare cases where it fits his egomaniacal narrative.
Difference between me and you, Binny, is that I think my way through issues whereas you are content to accept what you are told by authority figures.
tim…I don’t need to read anything to get it that ozone at about 4 ppmv is not blocking a lot of anything. The UV that causes skin cancer is getting through and causing skin cancer.
A good check would be to see how much the numbers of skin cancer cases/deaths have changed since the Draconian laws were brought in to outlaw the use of fluorocarbons. Of course, people these days are advised to use strong sun-blockers while sun-bathing or just out in the Sun. The blockers are aimed at blocking UV that ozone is claimed to block.
We are now facing the absurdity of such thinking with the anthropogenic craze. The ijits now want to block all use of oil products and any utilities that use them like gas stoves.
The claim is that UV-C is the most dangerous and is absorbed by the ozone layer. I am calling bs on that one.
“timI dont need to read anything to get it that ozone at about 4 ppmv is not blocking a lot of anything. ”
Put 4 ppm black ink in water (4 mL it 1 L) and tell me again how 4 ppm is not enough to block a lot of anything.
“The claim is that UV-C is the most dangerous and is absorbed by the ozone layer. I am calling bs on that one.”
UV-C is shortest wavelength and highest energy. Why would that NOT be the most dangerous?
“The blockers are aimed at blocking UV that ozone is claimed to block.”
Nope! Sunscreen is for the UV-A and UV-B that get through.
hmmmm … maybe you DO need to read a few things, rather than using your own ill-tuned bs detector.
“Put 4 ppm black ink in water (4 mL it 1 L) and tell me again how 4 ppm is not enough to block a lot of anything”.
***
Tim, do you seriously not get it that the atmosphere is not a liquid? It is comprised of molecules with immense relative distances between them. Drop the same amount of ink in the atmosphere and see what it does.
—
“UV-C is shortest wavelength and highest energy. Why would that NOT be the most dangerous?”
***
It’s obviously not blocked by the ozone layer. It is getting through and causing serious damage.
***
” Sunscreen is for the UV-A and UV-B that get through. ”
***
Do you believe everything advertisers tell you? If so, that might explain why you are so willing to believe anything climate alarm authority figures lay on you.
2230 /*
2231 * If the new process paused because it was
2232 * swapped out, set the stack level to the last call
3333 * to savu(u_ssav). This means that the return
2235 * actually returns from the last routine which did
2236 * the savu.
2237 *
2238 * You are not expected to understand this.
2239 */
2240 if(rp->p_flag&SSWAP) {
2241 rp->p_flag =& ~SSWAP;
2242 aretu(u.u_ssav);
2243 }
This is the famous line 2238 of Unix V6 which is part of some of the most delicate parts of the kernel, context switching.
This comment received huge publicity and just may be the most famous source code comment in computing history.
The code at 2240 is directing the process back to where it’s code is stored. Although Unix is based on the C-language, its implementation of C is archaic, dating back to the 1970s in the teletype era. A good deal of Unix apps under the hood are geared to teletypes.
If a context switch takes place, it means the code of a thread called out to another thread. Normally, that means storing the return address on the stack, a local memory area where apps can store information temporarily. The comment area marked by /*…*/ is ignored by the processor and is pertinent only to someone reading the code. It’s telling the reader what the programmer is doing.
He is telling the reader that should the new process stall, because it’s code is no longer in memory but swapped to a disk cache, then set the stack address (or depth within the stack) to the last CALL statement to the address of the function savu(u_ssav). This is a way of redirecting a ‘RET’urn statement from a CALL statement to another address.
The reason you are not supposed to understand the code is that the C-statement ‘aretu(u.u_ssav);’ at address 2242, and the statements from 2240 – 2242 are not defined here. You’d have to search through the rest of the code to see how they are defined. The programmer seems to be trying to save you the trouble.
Context switching is simply changing the focus from one process to another. It’s related to switching threads, where a thread is a code sequence representing a process.
I had a debugging app that would trace through 32-bit code but no longer works on 64-bit code. While tracing through the kernel there were occasions where I needed to do a context switch manually so breakpoints would work on a particular code section.
Processors must run, per core, in a sequential fashion. When you see many apps appear on a desktop, it appears as if they are all running, but only the code of one app can run at a time, a process called time-slicing.
Unix is a tired old language that should have been retired long ago. It dates back to the 1970s era and some of its apps run by Linux under the hood are positively archaic. Unix users whine about DOS, but DOS is light years ahead of Unix as far as clarity is concerned and ease of use. Some of the older Unix apps date back to the teletype era and have never advanced beyond it.
One of the reasons I don’t use Linux is related to the absolutely Draconian file system used by Unix under the hood. I can use a command shell and navigate fine in DOS, but in Unix, the learning curve is so steep, and so stoopid, I can’t be bothered learning it.
Files don’t have extensions so you can’t readily identify an exe file from a bat file or a txt file. There are unnecessarily strict permissions that need to be navigated and the support apps are so ancient they make little sense to me.
The annoying things is that Micro$oft are trying to move back to that basic Unix nonsense. When you first log on to Windows 10, you have to reset the system to show file extensions and hidden files. Then you have to go carefully through it to weed out all the spyware, so you can do online banking without them spying on you.
bill hunter…”Thanks for those arcane references Bin”.
***
Yes…Binny is good at arcanery, as well as chicanery.
Blinny is a Nazi. Hey, on another note, Victoria’s Secret has discovered that fat or trans women can’t sell lingerie.
I guess that depends on whether the viewer is a cross-dresser, now called a trans person, or not. Suddenly the focus has changed from sexual fantasy to gender identity, just as global warming has changed to climate change.
Hmmm!!! I wonder if there is a connection?
” Blinny is a Nazi. ”
*
You see here the perversity of Anderson, the average CONUS boy who has no problem identifying me with these murderers who were not only responsible between 1933 and 1945 for the death of
– around half a million physically or mentally disabled people;
– about half a million gypsies;
– about 1 million Germans who disagreed with the Nazi dictatorship or refused to betray Jews;
– about 6 million Jews.
but also for the death of
– about 27 million people (civilians, soldiers) in the Soviet Union.
The total number of deaths caused by the Nazi regime is estimated at around 50 million people.
*
Anyone who calls me a ‘Nazi’ on this blog – Anderson in the first place, of course – is an absolute, disgusting asshole.
I don’t want to get into this but I’d like to set the record somewhat straighter than your description. The word Nazi is short for national socialist. Not all of the German’s who supported that political ideology were hard core Nazis. Albert Speer, for one, had a humanitarian bent who tried to soften the harder core theorist ideology. In the end, when Goebbels announced he would commit suicide with his wife and children, Speer offered to raise the children to spare them. Goebbels, one of the hard core, denied his request and killed his own children.
The atrocities to which you refer were carried out by Himmler and his SS monsters, largely in secret. It should be noted that Himmler tried to have Speer killed circa 1944 for opposing his harsh policies. Also, not all Germans supported the Nazi policies but they dared not speak out because those who did ended up in the concentration camps.
I accept the excuse offered by some Nazi supporters who claimed they had no idea it was going on. German’s in a nearby village to a concentration camp were shocked when the Allies revealed it to them. They had been told something else, like they were camps to isolate sick people and they did not dare to query further.
The SS were zealots and their army divisions in the Waffen SS committed atrocities in the field. Waffen SS were also the concentration camp enforcers and before Himmler converted them to fighting units, there were running the concentration camps from about 1932 onward.
In your summary, you omitted the 6 millions Slavs who were murdered in the camps. The Russians and Slavs were treated worse than most camp denizens.
I don’t think the word Nazi is used by many today in reference to the atrocities committed by some of the Nazis. It is aimed more at people who support mindless authority that leads to deprivation of human rights. The word ‘fascist’, coined by Mussolini in Italy, has a similar connotation.
Gordon,
Blinny believes that people who disagree with his views on climate should be locked up. He is a fascist.
Blinny,
Gordon is neither a narcissist nor a psychopath. You are one, possibly the other.
And anyone naming me a fascist is for the same reason an absolute, disgusting ass~hole.
Deny it, Blinny. Deny that you said anyone who disagrees with you should be locked up. You’re no different than the Jew-hating Nazis.
SPA,
Not always locked up. He has also suggested lingering death from disease, electrocution and torture for anybody who dares to disagree with his odd ideas.
Just your average GHE cultist. Fixated on dogs and their excrement, from time to time.
Limited intellectual capacity, obviously.
Anderson
” Deny that you said anyone who disagrees with you should be locked up. ”
Tell me where I wrote such a dirty thing like you claim.
And people like you are responsible for the menat disease of people like Flynnson:
” He has also suggested lingering death from disease, electrocution and torture for anybody who dares to disagree with his odd ideas. ”
You, Anderson, are the origin of such disgusting stuff.
Binny,
So you deny ever having suggested lingering death, torture or electrocution for anybody who disagrees with your nonsense?
Here’s your description of the GHE “Increasing the amount of CO2 between the Sun and a thermometer makes the thermometer hotter.
Except where reality, rather than fantasy, is involved. Just you spouting wishful thinking, and threatening harm to anybody who disagrees.
Carry on your denials – maybe someone will believe you!
Tim Folkerts wrote:
“Short answer effectively all UV below 280 um is absorbed. And very little from 280 – 300 gets through. It is the UV above ~ 310 nm that gets thru…”
Yes, it is the perfect setup for a real-time experiment.
Example: https://imgur.com/a/XuI8toN
Typical appeal to authority. Ark accepts everything NASA claims because they are NASA. He does not stop to wonder how ozone, at about 4 ppmv, can possibly absorb all UV-C.
I’ve given my explanation above.
It can’t help your lack of education or experience in the subject.
Where is your data?
Simply saying that it can’t possibly be is not acceptable.
I do not accept your denials without plausible scientific explanation.
Where’s my data, where is the data from NASA that proves the ozone fantasy?
Seriously, life is far more fun when you are not dependent on authority figures.
so, no data.
I thought so.
“Above all, do not lie to yourself.”
Fyodor Dostoevsky.
Be sure and also explain the stratospheric temperature inversion without UV aβsorβtion.
A,
Pretty easy, given that you cannot even define temperature relative to atmospheric pressure.
Have you considered learning physics?
Good-oh, then,
It’s a great pity that you can’t say what creates ozone. Magic, perhaps?
Of course not. You are just completely clueless.
Carry on.
Sure, but first, answer me this. A horse, a cow, and a deer all eat the same stuff – grass. Yet a deer sh!ts little pellets, while a cow turns out a flat patty, but a horse produces clumps. Why do you suppose that is?
You need a new gibberish generator.
Your present one is stuck in a loop of generating gibberish about shit.
Why do you suppose that is?
[laughing at mentally defective cultist]
I’m not one to repeat myself.
I’ve given you more than enough chances to answer my question.
I will now return to ignoring your comments.
You need a new gibberish generator.
Your present one is stuck in a loop of generating gibberish about shit.
Why do you suppose that is?
[laughing at mentally defective cultist]
swenson…”[laughing at mentally defective cultist]”
***
As the French guards in the castle of Monty Python’s Holy Grail exclaimed to the English invaders, ‘I fart in your general direction’, with ‘your’ referencing climate alarmists.
test
So, I asked Gordon Robertson for his scientific explanation of how the ozone layer cannot possibly aβsorβ UV-C radiation, nor be responsible for the stratospheric temperature inversion.
His reply: is the typical evasion and obfuscation he always engages in when stumped by reality.
Gordon Robertson is nothing but a charlatan.
A,
Presumably, your comment has something to do with a supposed GHE. Would you mind describing this GHE? Does it have something to do with ozone, or CO2 or something?
You do not seem to have any idea of the mechanism by which ozone is formed, nor the mechanism responsible for ozone reverting to an oxygen molecule plus a free oxygen radical.
Why would you bother asking Gordon Robertson for a scientific explanation, when you were clearly not going to believe anything he said? It looks like you were trolling, but feel free to correct me if I am wrong.
Carry on.
I gave you the reason but you seem too obtuse to absorb it. The concentration of ozone in th stratosphere is about 4 ppmv. At the surface, CO2 is about 400 ppmv, some 400 times as strong. No scientists anywhere has ever explained how such trace gases can possibly affect the atmosphere to the extent claimed.
All the IPCC can offer re CO2 is that scientists like Tyndall and Arrhenius in the 19th century claimed it possible. Even at that, both claimed it would be a good thing. Both had lived through the tail-end of the Little Ice Age, and without central heating from fossil fuels it would have been a mighty cold world in which to survive.
The only other evidence offered by the IPCC is that it started warming in 1850, some 100 years after the Industrial Revolution began in Europe. They used proxy methods to calculate the concentration of CO2 during the Industrial era based on ice cores in Antarctica. At the same time, they completely ignored the effect of the Little Ice Age, that had its second peak during the Industrial era, driving global temperatures 1C to 2C below normal.
Naturally, the planet had to rewarm but the IPCC cannot admit that because their mandate is strictly to consider only evidence of anthropogenic warming.
Same with ozone. No one has ever proved that 4 ppmv of ozone in the atmosphere has any effect on UV. In fact, the amount of UV-C is declining rapidly in that EM frequency range because the Sun is simply not out-putting as much of it as UV-B and -C.
Look at Planck’s curve. The point is, there are some seriously stoopid scientists out there and you are equally stoopid for blindly regurgitating everything they tell you.
Charlatan, there are two lines of evidence saying you are wrong:
1/ Measured UV-C above the TOA and at sea level.
2/ The stratospheric temperature inversion.
Unless you can scientifically disprove those two sets of observations, you are full of sh!t.
Your opinion that “4 ppm cannot possibly absorb UV-C” is just that, an opinion.
Clown!
“…the amount of UV-C is declining rapidly in that EM frequency range because the Sun is simply not out-putting as much of it as UV-B and -C.”
Hahahahhahahahahahahaha!
Clown
ark…don’t call me a clown when you obviously lack the scientific background to understand what I said. Look at Planck’s curve you ijit and what I claimed is obvious.
Thanks for the good laughs!
A,
“Lines of evidence” do not “say” anything.
You have no clue, and are just trying to appear clever – but failing.
Next thing, you will be claiming that you could describe the GHE if you felt like doing so!
What a strange SkyDragon cultist you are!
swenson…”…you cant say what creates ozone”.
***
That’s a great point. Because UV interacts with oxygen molecules to produce ozone. alarmists think the ozone is trapping all the shorter wave UV. AT the peak of Everest, which pretty well marks the bottom of the stratosphere, oxygen is down to 1/3rd its concentration at sea level.
The ozone layer is claimed to be 15 – 30 km altitude, therefore it should begin about twice the height of Everest (at about 9 km altitude).
Here’s the oxygen reduction per 10,000 feet (3048 metres)…
sea level = about 22%
10,000 feet (3048 m) = 14.3%
20,000 feet (6096 m) = 9.7%
30,000 feet (9144 m) = 6.3%
At 30,000 feet it is 6.3/22 = 0.29 of the value at sea level.
The average altitude of the ozone layer is about 23 km = 23000 m = 75459 feet.
Extending this based on the oxygen reduction with altitude, which should be fairly linear, we’d get…
40,000 feet (12,192 m) = 2.1%
60,000 feet (18,288 m) = 1.68%
Percent for oxygen converts directly to ppmv as…
20.9% = 209,000 ppmv, therefore…
2.1% = 21,000 ppmv
1.68%= 16,800 ppmv
That is, at 18.288 km oxygen has a concentration of about 16,800 ppmv. At nearly the same altitude, ozone has a percentage of 0.00015% or 1.5 ppmv.
It is immediately obvious, with oxygen at about 17,000 ppmv and ozone at just 1.5 ppmv, that not a whole lot of oxygen is being converted to ozone. In fact, the claim that ozone is warming the stratosphere is ridiculous. If anything it’s the oxygen itself that is absorbing UV and warming it, if you can call a rise in temperature from -50C to -20C a warming.
Over to you, Ark. Rather than hiding behind the skirts of authority, let’s see you do some actual science and think for yourself.
How does ozone, at 1.5 ppmv, compared to oxygen at 16,800 ppmv possible have the claimed effect on UV radiation?
It worth noting for anyone who take you seriously that you have grossly misstated two concepts. You are confusing percent oxygen with partial pressure. The pressure is falling with altitude, not percent oxygen. Finally, it is not even close to linear. That is from less than a minute scanning your post. I am sure there are more errors.
ark…”This is the famous line 2238 of Unix V6 which is part of some of the most delicate parts of the kernel, context switching”.
***
Talking about laughs, why would you make such an off-topic post when you obviously have no idea what you re talking about? You sound like a script-kiddie who steals code from experienced hackers and tries to appear cool.
How do Ozone and Oxygen aβsorρtion cross sections compare: https://imgur.com/a/sQaavKg
I am not surprised that a layman cannot understand any sub-fields of physics.
It takes incredibly intense effort to comprehend any part of physics at any significant depth.
Just to give an example, about half of all university undergraduate physics majors drop out before graduation. And these are generally highly motivated and serious students with a generally good background in math and elementary physics at a good high school level.
Now consider what an insignificant fraction of the general population undergraduate physics majors are.
A,
You still do not understand the mechanisms involved in the creation of ozone, do you?
Appealing to the authority of people who share your ignorance (or are intentionally trying to misrepresent reality), won’t help.
Go on, tell me that you know more about atmospheric physics than I. Then explain your reasons, based on verifiable fact.
Off you go.
You can post all the bafflegab you want by referencing authority figures but when you cannot back it by explaining it at the atomic level or offering an argument as I provided you, then you are simply playing at science.
I gave you a detailed account of the amount of ozone available in the stratosphere, compared to the amount of oxygen, and you failed to rebut my argument. In particular, you have failed to explain how ozone at 10 ppmv as opposed to a thousand times more oxygen molecules can possibly affect UV to any degree.
Furthermore, you seem to think a person needs an advanced degree in education to understand this stuff. Faraday lacked the degrees to which you refer yet he managed to present the first in-depth, preactical study of near-field electromagnetic radiation. The ijits you support in universities would not accept his theories and practical application of the theories because he lacked the ability to present them mathematically to their level.
Maxwell came to the rescue by consulting with Faraday and managing to interpret his work into the math required. Hence, Maxwell got all the credit, while Faraday, who had laid the ground work, and did all the hard work, is minimized in history.
Same with Newton, he discovered and explained concepts like mass and its relation to force through experimentation. Along comes a wanker like Einstein and undoes all the good work of Newton by offering thought experiments in place of the hard physics of Newton. And wouldn’t you know that most of the snotbags in academia accepted the unproved rubbish of Einstein.
The irony is that all applied physics today uses the Newtonian physics while there are virtually no applications for Einstein’s theories which are based on a non-existent time that can change its length with speed.
It has gotten so ridiculous that many universities are now teaching that gravity is not a force but a space-time anomaly.
[Gordon Robertson]: Seriously, life is far more fun when you are not dependent on authority figures.
Also,
[Gordon Robertson]: …Faraday …Maxwell …Newton
A,
You still do not understand the mechanisms involved in the creation of ozone, do you?
Appealing to the authority of people who share your ignorance (or are intentionally trying to misrepresent reality), wont help.
Go on, tell me that you know more about atmospheric physics than I. Then explain your reasons, based on verifiable fact.
Off you go.
Anyone who has decades of experience in using UNIX systems gets a big laugh when reading Robertson’s utter trash about UNIX
https://www.drroyspencer.com/2023/10/regression-attenuation-only-depends-upon-the-relative-noise-in-x/#comment-1547811
This arrogant & ignorant post is typical for Robertson’s absolute lack of competence in any domain.
His blah blah about file extensions etc etc is of a stoopidity beyond the imaginable.
It shows that his programming experience is equal to zero dot zero.
Who developed complex software on such systems since the beginning of the 1980s (e.g. BSD, SCO, SunOS, AIX, HP-UX, and since 20 years LINUX), perfectly knows the value of this operating system family.
All bigger companies use UNIX servers since years because of their outstanding reliability, performance and security aspects – those who have exclusively traditional Microsoft LDAP clients partly excepted.
Robertson could start learning by looking e.g. at
https://www.ibm.com/power
but he never learns.
*
What else do you expect from a boaster who den-ies anything he either dislikes or doesn’t understand, and conversely tries to tell us nonsense like that time does not exist, or that a star like our Sun can’t bend light, or that Newton claimed our Moon wouldn’t rotate about its polar axis, etc etc?
Even the simplest things he doesn’t really understand, see e.g.
https://www.drroyspencer.com/2022/09/uah-global-temperature-update-for-august-2022-0-28-deg-c/#comment-1364980
Cela dit tout.
Binny,
It’s a great pity that you cannot describe the GHE, isn’t it?
The surface of the Moon gets far hotter than that of the Earth, due to the action of sunlight. No atmosphere, you see.
Now explain how the atmosphere actually reduces the maximum temperature of the Earth’s surface due to sunlight. Include that as part of your GHE description.
Or talk about dogs, excrement, arrogance, or any other irrelevant thing you like.
Some will no doubt appreciate your opinions.
Typical Binny reply. He blusters on, slinging ad homs and insults, while failing to supply a significant rebuttal. He fails to explain my point that Unix is archaic under the hood. Most people don’t care, they just want to look at pictures and not worry about low-level processes. Since the advent of the Linux GUI interface, many people use it and go no deeper.
I spend a good deal of time working under the hood and I have done that in Linux. I find the OS completely bizarre at that level and I have spent a good deal of time working with it. Mac/Apple systems are the same way since they use Unix but they have omitted the more archaic software still available on Linux.
The only rebuttal he offers is my comment about the insanity of listing files in a file manager without extension. An extension is usually a 3-character extension to a file that lets you know what kind of file is referenced. For example, I have the following files…
foobar1
foobar2
foobar3
foobar4
foobar5
That’s how they’d be listed in a Unix file manager. Under a DOS or NTFS system, at one time, they might be listed as…
foobar1.exe
foobar2.dll
foobar3.scr
foobar4.txt
foobar5.bat
Foobars 1,2 and 3 are executable files, meaning if you activate them they could easily contain a virus which would infect your system. Foobar3, a dll file cannot but it could contain a virus if called by an exe file. foobar4.txt is relatively harmless.
The reason a virus is not an issue on Linux is that no one bothers to write malware for such a convoluted system.
Even if the exe file is not a virus it could start an unwanted action that could write over part of the existing files on your system.
Binny is that dumb, that he would prefer to work in the dark, activating files that could destroy his system. Unix programmers would hopefully halt an exe file to warn you that’s what it is, and do you want to proceed? But why do I have to play guessing games as to what a file will do when activated?
Microsoft in recent years have reverted to the Unix style and you have to turn on the ability to have extensions.
Robertson is such a liar.
” The only rebuttal he offers is my comment about the insanity of listing files in a file manager without extension. An extension is usually a 3-character extension to a file that lets you know what kind of file is referenced. For example, I have the following files… ”
On a Linux system, only directories, executable files and shell scripts don’t have extensions for historical reasons; anyone can decide to have extensions if s/he wants, however.
All other files have of course extensions
foobar.pdf
foobar.png, .jpeg etc Picture files
foobar.py Python files
foobar.cc C++ files
foobar.c — C files
foobar.f — Fortran files
foobar.o Compiler outputs
foobar.txt usually text sources
etc etc etc.
*
It is evident that Robertson never used any UNIX system in his entire life.
*
” The reason a virus is not an issue on Linux is that no one bothers to write malware for such a convoluted system.
Even if the exe file is not a virus it could start an unwanted action that could write over part of the existing files on your system. ”
I never saw such stoopid statements.
There are millions of people worldwide who enjoy the security provided by UNIX systems, due to the fact that unlike Microsoft products, it was all the time way more difficult for invaders to manipulate executable files and add viruses to them in UBIX than it was since decades on Microsoft/Windows.
*
” Binny is that dumb, that he would prefer to work in the dark, activating files that could destroy his system. ”
Exactly that is what never happens on the UNIX systems I use since decades. Firewalls existed on UNIX systems long before they were introduced for Windows.
*
As usual, Robertson writes trash based on nothing real.
No need to further comments.
*
Who believes Robertson’s trash deserves it.
ark…”Your opinion that 4 ppm cannot possibly absorb UV-C is just that, an opinion.
Clown!”
***
Ark has a meltdown and slings insults, simply because he cannot explain his point. Mind you, the pseudo-science he is defending, known jointly as anthropogenic global warming/climate change, is based on the same pseudo-science that a trace gas in the atmosphere can not only warm it catastrophically it is also responsible solely for cooling the Earth as well via radiation to space.
A responsible scientist would say, ‘Wait a minute, that does not seem correct’. One such scientist, R. W. Wood, did that circa 1909 and he was an expert on gases like CO2. Based on his experience with gases like CO2, he reasoned that CO2 simply did not have the ability, at an even lower ppmv than it’s currently at, to create so much heat.
So, he investigated the GHE theory that is based on CO2 warming a greenhouse, and found it had nothing to do with CO2, but with the lack of ventilation in the greenhouse. In other words, it’s all components of air that are 99% oxygen and nitrogen that warm the greenhouse, not the trapping of infrared energy which CO2 can absorb.
It’s the same in the atmosphere, it warms because short wave solar heats the planet’s surface and most of that heat is transferred to air molecules in contact with the surface. The heated air then rises unimpeded like the air in a greenhouse which is impeded by the glass.
Meantime, Shula explained via the Pirani gauge, that surface radiation is 260 times less effective at cooling the surface. Of course, Lindzen had already explain that the Earth’s surface would rise to the 70C range without convection. Yet alarmists continue to peddle the pseudo-science that atmospheric warming and surface cooling are done by a trace gas.
[Gordon Robertson]: Seriously, life is far more fun when you are not dependent on authority figures.
Also,
[Gordon Robertson]: …R. W. Wood… Shula
… Lanka, Nikola Tesla, plus EM Smith aka chiefio, a blogger who spouts since over a decade a load of nonsense about GISTEMP and NOAA – and… is above all a UNIX programmer, ha ha haaah!
A,
Well, that’s informative – not!
How’s your GHE description going? Not too well?
Sad.
ark…my complaint about you is that you simply Google a subject and present what you have found as if it is gospel. You indicate little or no ability to think for yourself. Rather, you resort to the drama of a snotty-nosed teenager who has yet to understand his emotions.
When I reference Wood or Shula, I explain my understanding of their ideas and/or use them to augment my own explanation of physics. You, on the other hand, simply regurgitate what an authority figure has claimed without any indication that you understand the subject at all.
For example, when Shula introduced the Pirani gauge, I immediately got the inference between measuring heat dissipation in a vacuum and in a gas. I could have taken credit for that and ignored Shula, but keeping in the context of good science, I gave credit where credit is due. I mentioned Wood and Shula only to credit them as the originators of ideas.
After all, is that not what science is about? No one has the time to do the research that has already been done, all we have is the ability to examine it and form an opinion as to its veracity. Some of it is a no-brainer, like Newton’s f = ma. However, we were not taught in university physics classes Newton’s disclaimer, of ‘if a force can move a mass’…then f = ma. That equation is far too often interpreted as any force being able to move any mass. We know from a study of statics that is not true.
Neither were we taught in university that time is an invention of the human mind. In fact, no one touched the subject of time for the simple reason that most scientists are confused as to exactly what it is. Not one of my physics profs, he stated immediately that time was invented to keep tract of change.
TL;DR.
Neither Wood, Shula nor Newton have anything to do with the ozone layer!
A,
How would you know? You seem singularly clueless about ozone and many other things.
Do you believe in things that you cannot describe – the GHE, for example?
Carry on avoiding reality.
Gordon Robertson the reason you don’t understand any of this because you don’t know quantum mechanics.
Aβsorρtion cross section of Ozone and Oxygen https://imgur.com/a/sQaavKg
The ozone cross section is small for wavelengths above 325 nm. As we move to higher energies (shorter wavelengths), the cross section increases to a peak value at a wavelength of 255 nm, but then decreases as we move to still higher energies. To explain what is being observed we require quantum mechanics. Quantum mechanics tells us that atoms and molecules absorb energy in discrete quanta, and the sizes of the quanta are dependent upon the type of atom or molecule and its energy state.
A,
Appealing to the authority of NASA? The same people who claim the GHE is a “warm cozy blanket”?
Anybody who says “quantum mechanics tells us” is using the term incorrectly. Not only that, but your statement that “molecules absorb energy in discrete quanta” is so vague as to be useless, to say the least.
If I raise the temperature of an object from, say, 1 K to 2K, what “discrete quanta” are being absorbed? Does CO2 at 2 K emit the same “discrete quanta” as at 1002 K? That’s a gotcha – of course it doesn’t.
You do accept that radiation wavelengths emitted by a body are proportional to its temperature, do you?
Keep trying to convince anybody that you know what you are talking about.
Swenson,
Why do you keep peddling this nonsense?
“You do accept that radiation wavelengths emitted by a body are proportional to its temperature, do you?”
ark…”Quantum mechanics tells us that atoms and molecules absorb energy in discrete quanta, and the sizes of the quanta are dependent upon the type of atom or molecule and its energy state”.
***
Good grief, Ark looks up a definition of quantum theory and thinks he understands it. Is there no end to his immaturity?
For the umpteenth time, atoms and molecules do not absorb quanta per se, it is the electrons orbiting atomic nucleii that absorb, and emit quanta. That applies to molecules as well which are two or more atoms ***BONDED BY ELECTRONS***.
Try to pay attention. EM, electromagnetic energy, is comprised of an electric field orthogonal to and in phase with a magnetic field. Each quantum has a specific frequency.
When an electron transition downward to a lower energy level, it must rid itself of energy, so what kind of energy would an electron emit, with an electric field that can produce a magnetic field when it moves rapidly? Could it be electromagnetic in nature?
Duh!!! Still with me? When the same electron encounters an EM field of the proper frequency, what would happen to the electron? It gains energy from an electric field and a magnetic field of a certain frequency. The increased energy forces it out to a higher energy orbit.
Now, go away and study rather than bothering your betters with trivia.
You are not a very gracious loser, are you?
You are the epitome of the irrelevant and pointless commenter, are you?
Gongbeater.
binny…” Lanka, Nikola Tesla, plus EM Smith aka chiefio, a blogger who spouts since over a decade a load of nonsense about GISTEMP and NOAA and is above all a UNIX programmer, ha ha haaah!”
***
Once again, Binny sticks his foot squarely in his mouth. Unix is programmed in the old C-language. Unix is an operating system not a language. Unix programmers don’t program in Unix, they program in C.
Windows, on the other hand is programmed in mainly C++, an extension of C which the creator, Bjarne Stroustrup developed to extend the C-language structures into classes, which allowed for modular programming.
EM Smith, unlike Binny, actually does research on NOAA, GISS et al, something Binny fails to grasp. When an expert like Tony Heller comes along, with his special skills in quality control, and agrees with EM Smith, Binny has a meltdown.
Only a special kind of ijit can argue with NOAA’s deliberate announcement that they have slashed the number of surface stations globally to less than 1500. The confusing part is that Binny seems to be a Frenchman who is acting like a stubborn Teuton. Lot of Gaul, I’d say.
1. ” Unix is an operating system not a language. ”
Says the good guy who wrote himself on this thread above:
” Unix programmers would hopefully halt an exe file to warn you thats what it is, and do you want to proceed? But why do I have to play guessing games as to what a file will do when activated? ”
Never did Robertson professionally use any UNIX computer.
Could anyone seriously imagine this boaster sitting 30 years ago in front of a SPARC Station 10?
I’m joking of course…
*
” Unix programmers don’t program in Unix, … ”
Thanks for the precious hint, Robertson.
“… they program in C. ”
Says the good guy who has NO idea of which programming languages are available on UNIX platforms since decades – I wrote my first C++ program in 1987, and above all, in which languages the UNIX and LINUX kernels together with hundreds of tools were and are implemented.
*
” Windows, on the other hand is programmed in mainly C++… ”
Says the good guy who has NO idea in which programming languages all Microsoft operating system products were written.
From MS-DOS over Win NT, Win 1995/98/2000, XP, Vista, Win 7/8/10: all these products were mainly written in C, except a few machine-near lines in assembly and, recently, evolving parts written in C++, C#, Java, and JavaScript.
Yes, Robertson: we see that you never really used anything of all this.
All you ‘know’ is what you pick on the Internet, like this below:
*
” … an extension of C which the creator, Bjarne Stroustrup developed to extend the C-language structures into classes, which allowed for modular programming. ”
Modular programming has primarily nothing to do with classes. It came into life much earlier than languages supporting classes (the genial Norwegian language Simula-67 excepted).
You never wrote any program in any language in your entire life, Robertson.
***
2. ” Only a special kind of ijit can argue with NOAAs deliberate announcement that they have slashed the number of surface stations globally to less than 1500. ”
And once again, Robertson’s ridiculous hint on a temporary situation around 2009 due, as Robertson perfectly knows but always dissimulates, to the removal of about 4500 stations worldwide which became over time less and less manageable, as they couldn’t report their data automatically but only via telex and fax.
The most disgusting thing is that if Robertson had ever been able to be responsible for station management at NOAA (what of course he never was, isn’t and never will be), he would have taken exactly the same decision, cuz… cost reduction pressure :–)
If there is an absolute idi~o~t here, unable to view things other than through his 360 degree contrarian glasses, then that is… Robertson.
*
By the way, I’ll manage to write a few lines about EM Smith aka chiefio and his manipulation wrt Californian stations:
” When I investigated, I found California has all of 4 thermometers (assuming I read the LAT and LONG correctly and recognized the place names; someone check me on this.)
San Francisco
Santa Maria
Los Angeles
San Diego ”
No wonder that Robertson gullibly appeals to the ‘authority’ of people like Smith.
Binny,
Have you managed to improve on your humorous description of the GHE?
Or are you sticking to “Increasing the amount of CO2 between the Sun and a thermometer makes the thermometer hotter.” which is not helpful, as well as being a physical impossibility!
The world wonders.
binny…”it was all the time way more difficult for invaders to manipulate executable files and add viruses to them in UBIX than it was since decades on Microsoft/Windows”.
***
All exe files have two headers, an MZ header and a PE header. A hacker does no need to see the extension to know its an executable file, each file has built in signatures in its code. All the hacker has to do is go to certain addresses in the PE header and find out the file type, the OS version, etc.
Hacking a Unix system would be no tougher than hacking a Windows system, provide the hacker took the time to understand the difference between the two systems. Unix file permissions make no difference to a rootkit virus that has embedded itself in system code. A rootkit can bypass firewalls and any kind of malware protection. As with anything else, it acts as a trojan horse, depending on the stoopidity of the system user to initiate it on their system.
One of the biggest laughs I got in the field of reverse engineering was a code protection company bragging that their product was uncrackable. The guy who cracked it had a good sense of humour. Rather than simply claiming he’d cracked it, he released an app with the protection defeated and inserted a note that he agreed it could not be cracked.
If crackers wanted to hack Unix it would be done. No respectable hacker would bother with a system like Linux.
By using Linux you have limited yourself to a small selection of apps available to the Linux OS. I considered moving to Linux when I got peed off with Micro$oft but I could not find apps that would run on Linux that I needed. No professionals write for Linux, only masochistic weerdos who relish belonging to a community of weerdos.
Stop boasting your nonsense, Robertson, you are not talking by experience: you only paste stuff out of spurious sources.
You have NO idea about how secure all my consecutive UNIX systems have been since far over 20 years, while my Win systems (even XP) got regularly damaged because
– Microsoft was absolutely unable to finally close the hundreds of largo doors on his systems, and
– the Windows hackers were at that time faster than the Kasperskys and other BitDefenders could develop their anti-virus and firewalls.
Give it up, Robertson.
With each post you become more ridiculous and less credible.
Gordon Robertson, what you wrote here is a mishmash of Maxwellian electrodynamics and classical physics; late 19th century stuff at best. You havent even scratched the surface of the basic constructs of quantum theory.
A,
Maybe you could try to be helpful – list his errors, explain why he is wrong, and provide correction, based on experimentally supported fact.
Only joking, you are both ignorant and inept, not to say purposefully unhelpful.
I don’t blame you – you can’t even describe this imaginary GHE, so you have to try to save face by pretending you are wise and knowledgeable. Please correct me if I’m wrong.
“It doesn’t matter how beautiful your theory is, it doesn’t matter how smart you are. If it doesn’t agree with experiment, it’s wrong.” – Feynman. Bizarre speculations of the SkyDragon GHE cult variety are not even supported by reality, are they?
Off you go now, try and convince somebody even more ignorant and inept than yourself of your brilliance and wisdom!
[laughter ensues]
This discussion is mostly going over my head, but why are the trend lines at the wrong angle? In the “noise added to y” graph the correct trend line would appear to be about y=1.5x instead of 1.03x and in the “noise added to y and x” graph the correct trend line would appear to be about y=x, not y=0.499x. How were the x-values generated?