
 Home/Blog
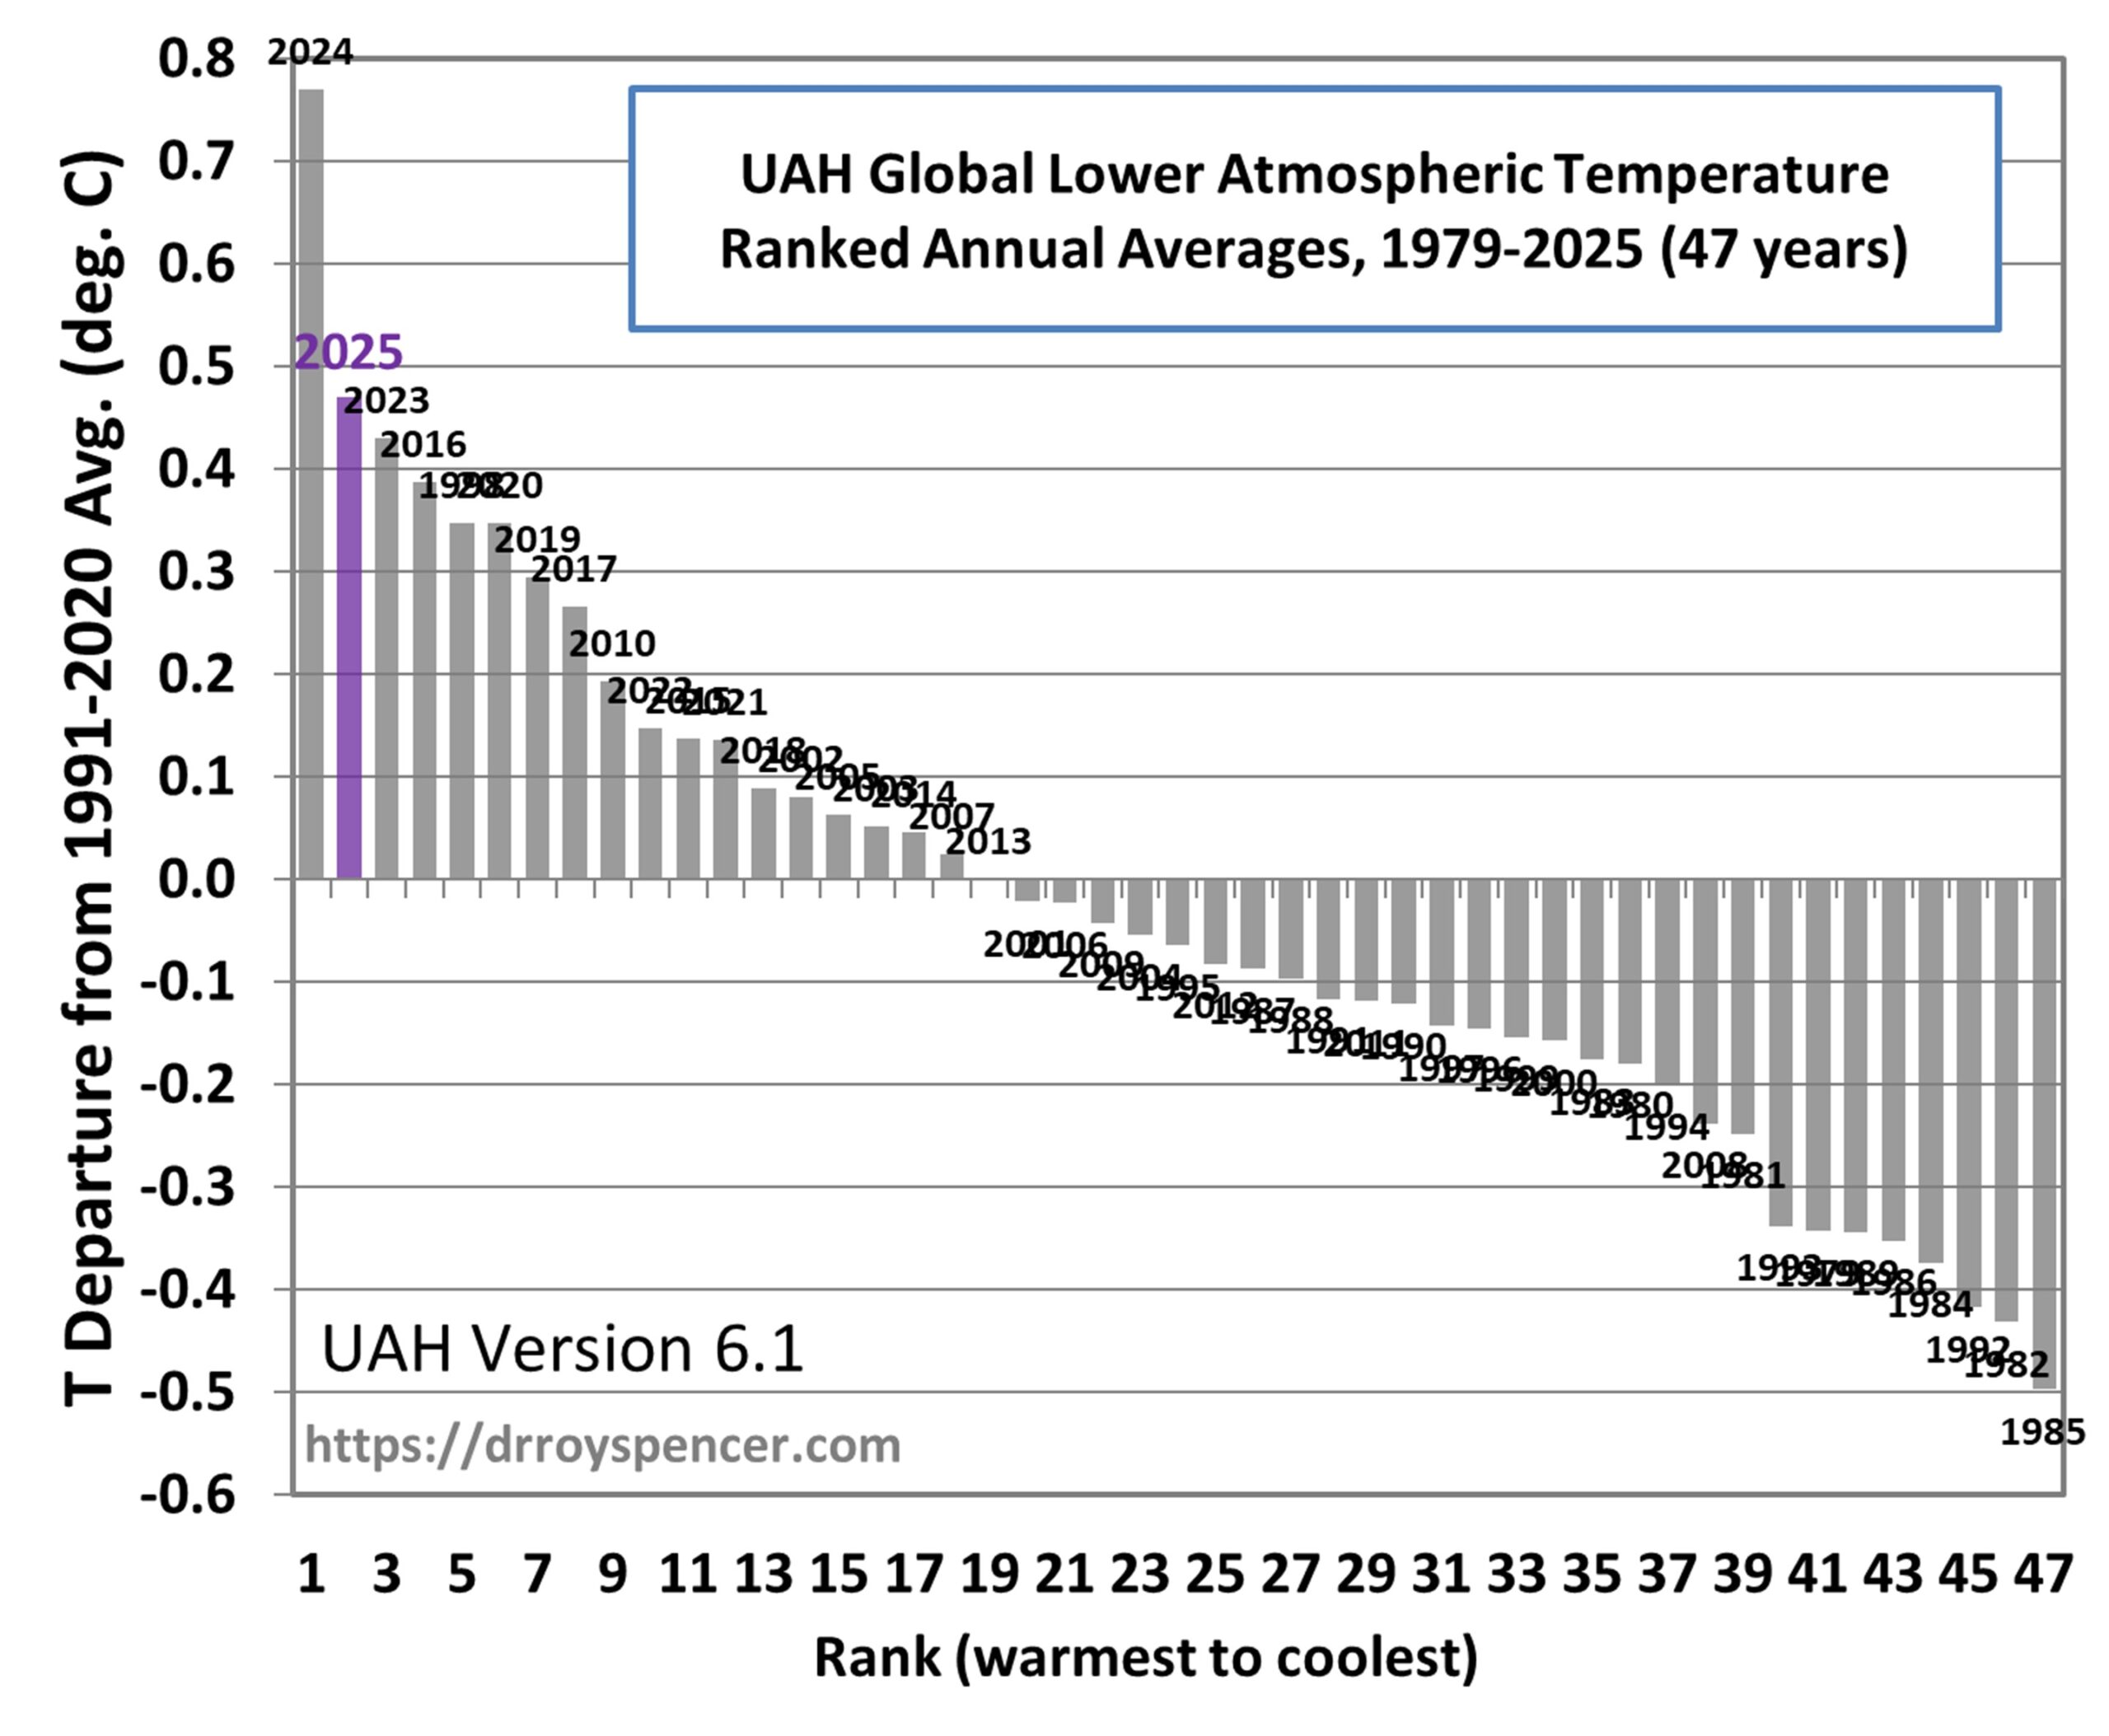
2025 was the 2nd warmest year (a distant 2nd behind 2024) in the 47-year satellite record
The Version 6.1 global average lower tropospheric temperature (LT) anomaly for December, 2025 was +0.30 deg. C departure from the 1991-2020 mean, down from the November, 2025 value of +0.43 deg. C. (In the following plot note that the 13-month centered-average trace [red curve] has now been updated after several months of not being updated).
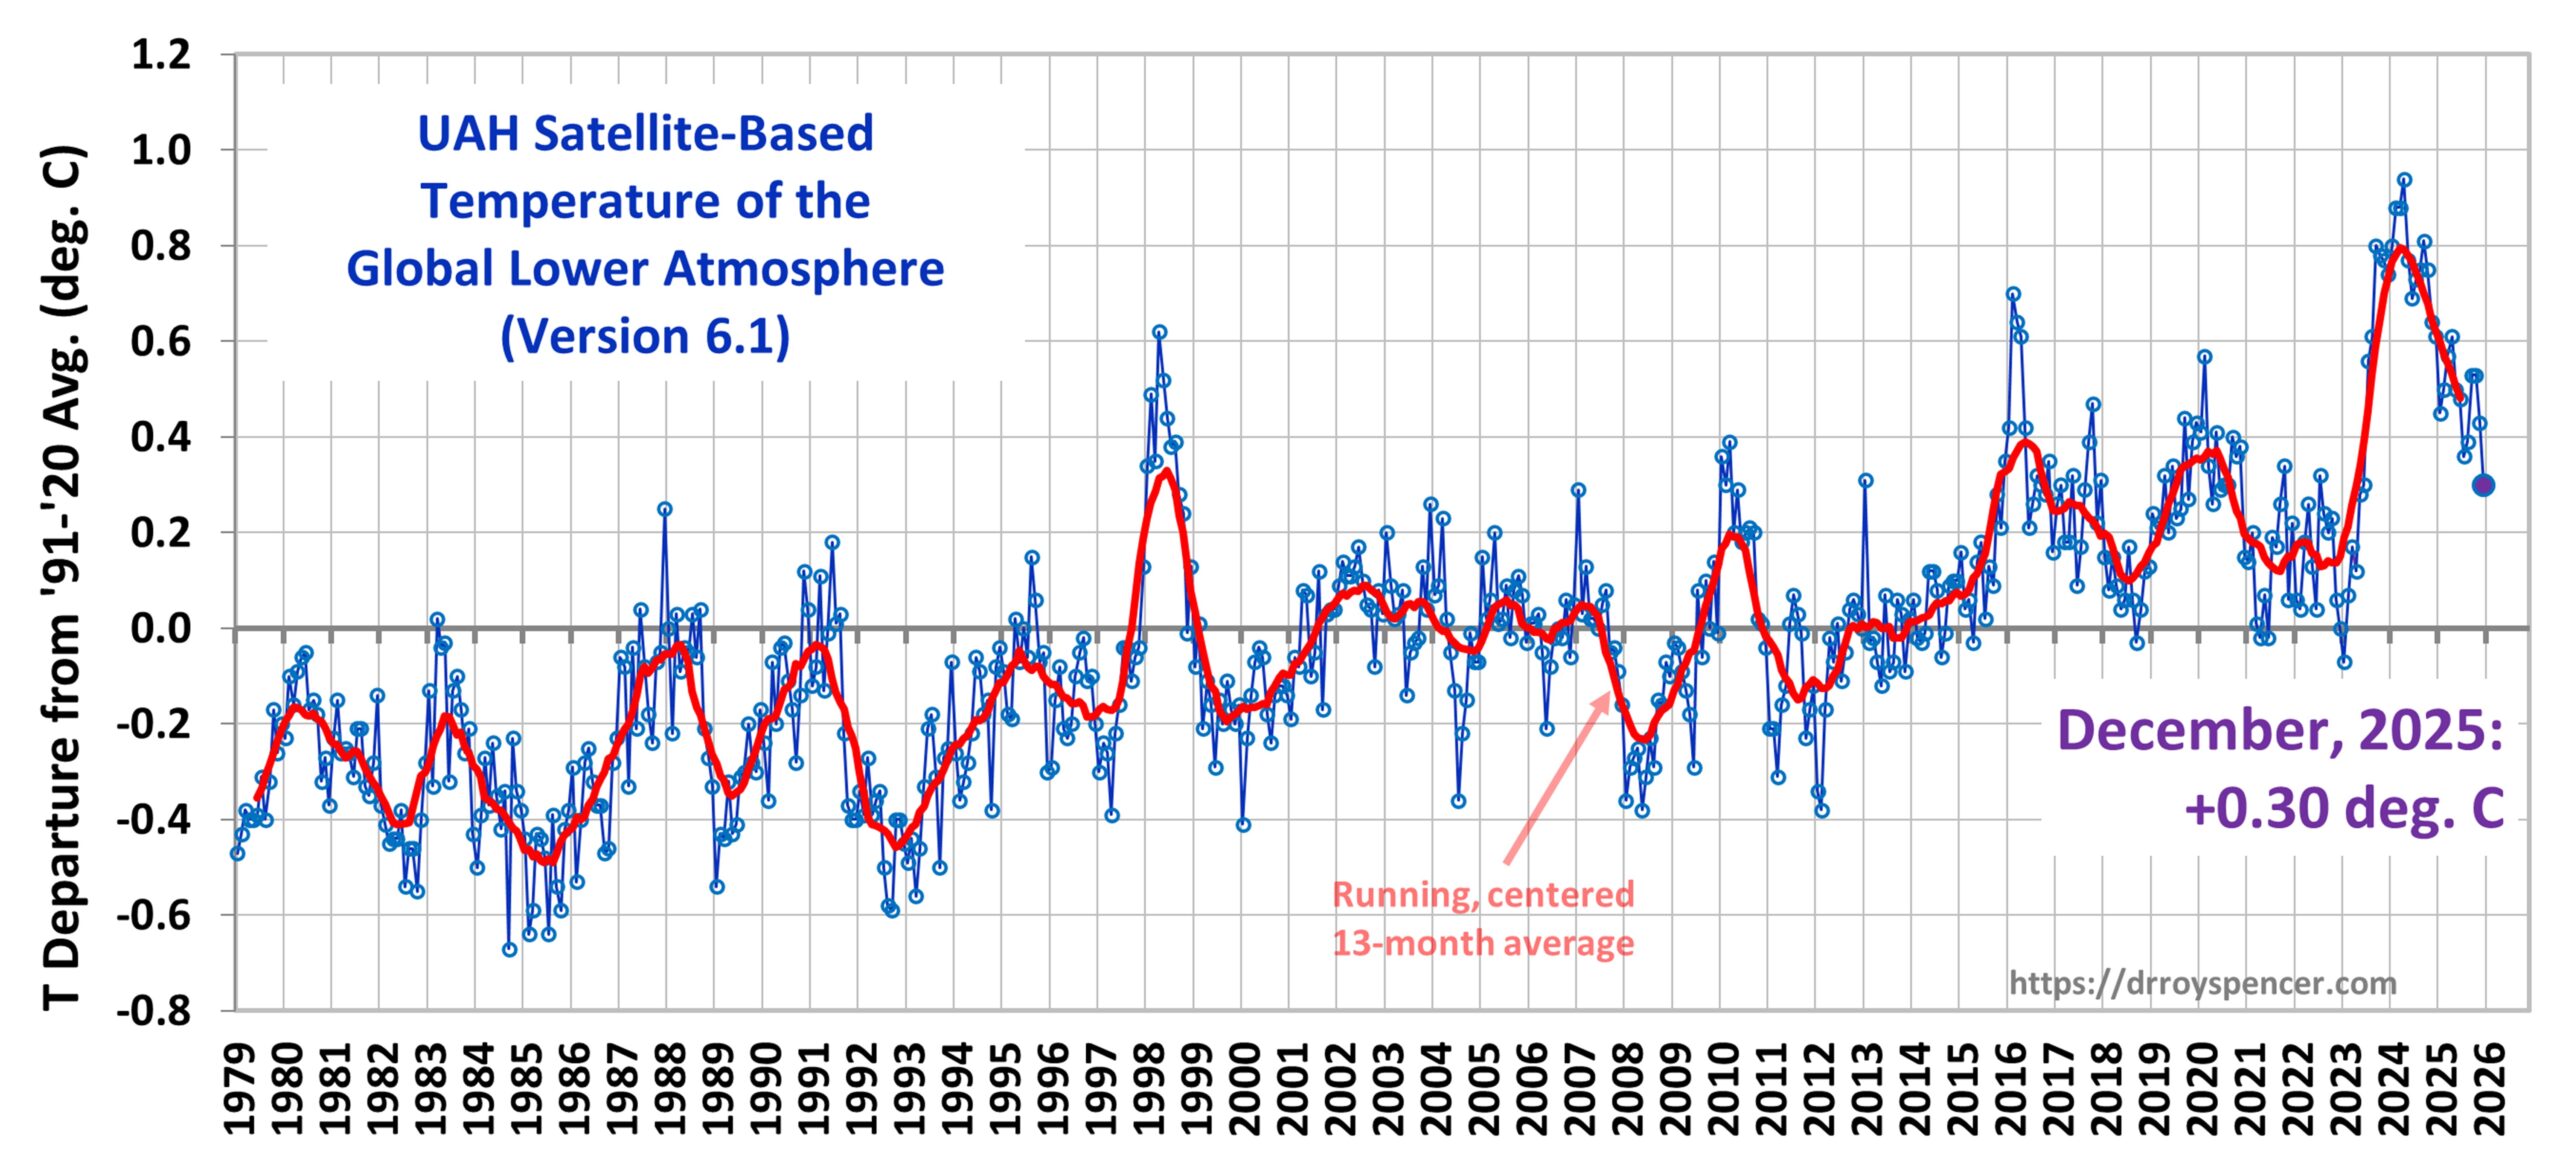
The Version 6.1 global area-averaged linear temperature trend (January 1979 through December 2025) remains at +0.16 deg/ C/decade (+0.22 C/decade over land, +0.13 C/decade over oceans).
2025 Ended the Year as a Distant 2nd Warmest Behind 2024
The following plot shows the ranking of the 47 years in the UAH satellite temperature record, from the warmest year (2024) to the coolest (1985). As can be seen, 2024 really was an anomalously warm year, more than can be attributed to El Nino alone.
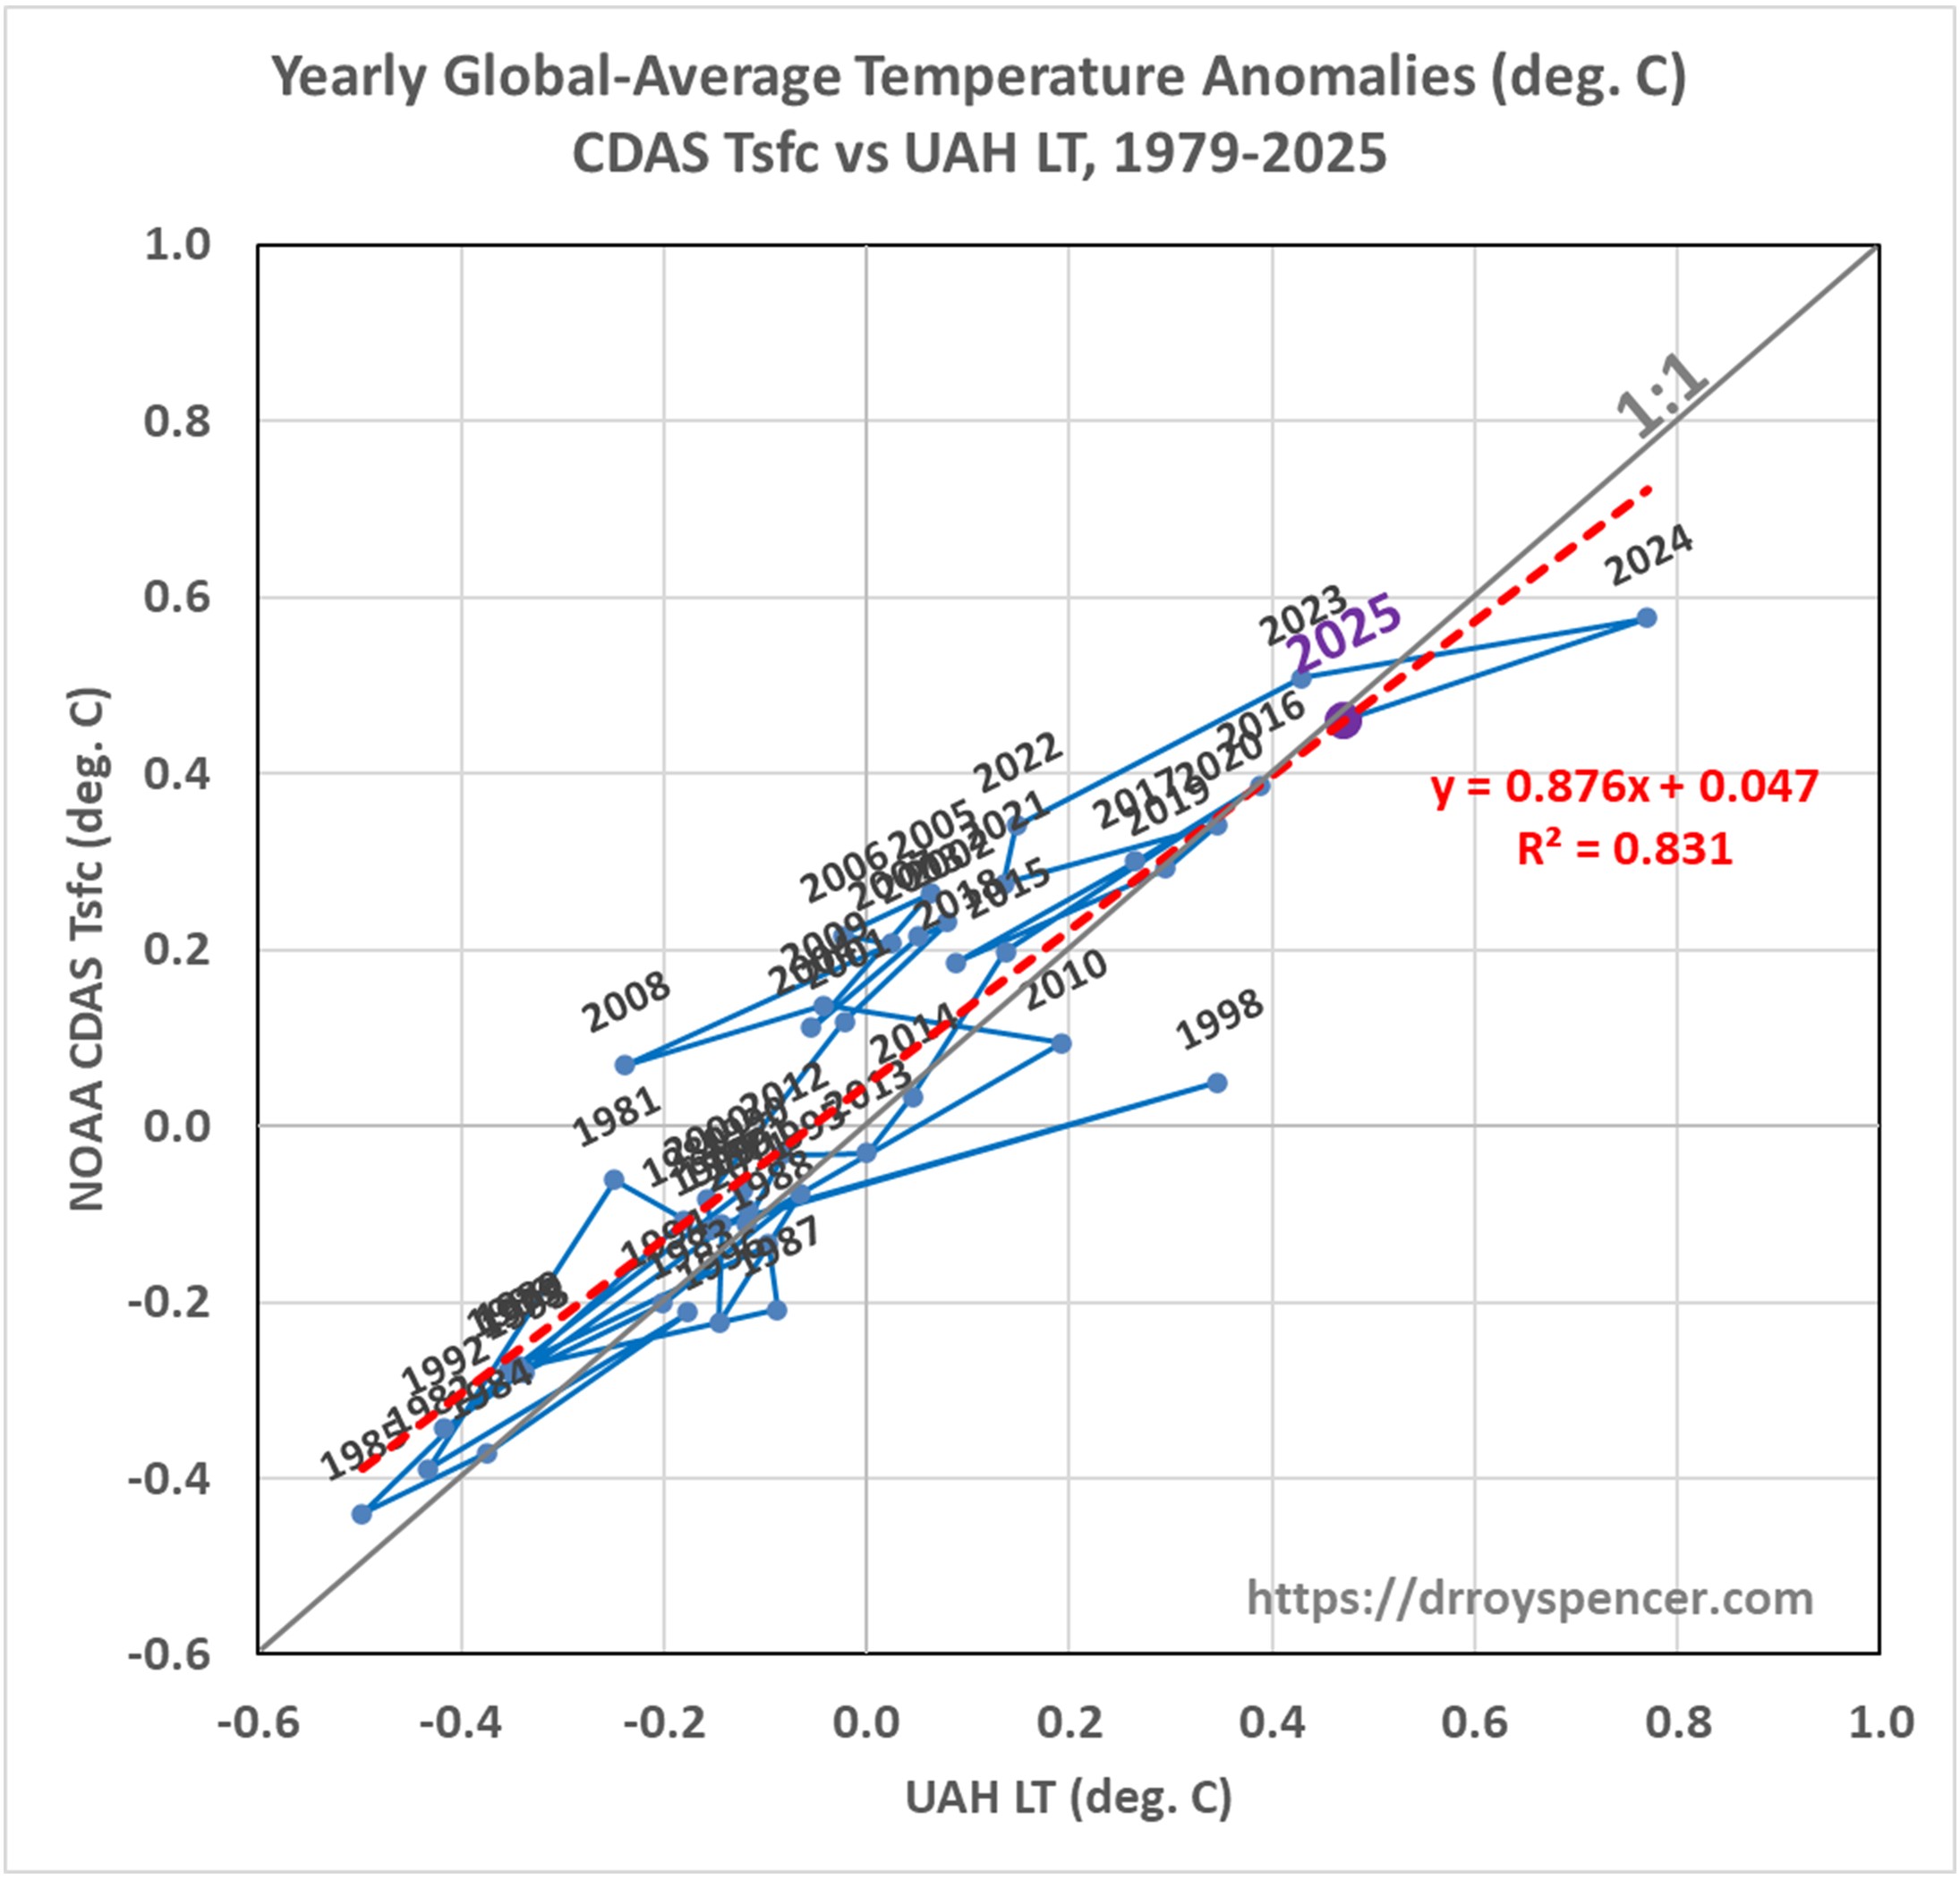
The next plot shows how our UAH LT yearly anomalies compare to those posted on the WeatherBell website (subscription required) for the surface air temperatures from NOAA’s Climate Data Assimilation System (CDAS). There is pretty good correspondence between the two datasets, with LT having warm outliers during major El Ninos (especially 1987, 1998, 2010, and 2024). This behavior is due to extra heating of the troposphere (which LT measures) during El Nino by enhanced deep moist convection in the tropics when the tropical Pacific Ocean surface warms from reduced upwelling of cold water from below, an effect exaggerated by the several-month lag of tropospheric warming behind surface warming during El Nino:
The following table lists various regional Version 6.1 LT departures from the 30-year (1991-2020) average for the last 24 months (record highs are in red).
| YEAR | MO | GLOBE | NHEM. | SHEM. | TROPIC | USA48 | ARCTIC | AUST |
| 2024 | Jan | +0.80 | +1.02 | +0.57 | +1.20 | -0.19 | +0.40 | +1.12 |
| 2024 | Feb | +0.88 | +0.94 | +0.81 | +1.16 | +1.31 | +0.85 | +1.16 |
| 2024 | Mar | +0.88 | +0.96 | +0.80 | +1.25 | +0.22 | +1.05 | +1.34 |
| 2024 | Apr | +0.94 | +1.12 | +0.76 | +1.15 | +0.86 | +0.88 | +0.54 |
| 2024 | May | +0.77 | +0.77 | +0.78 | +1.20 | +0.04 | +0.20 | +0.52 |
| 2024 | June | +0.69 | +0.78 | +0.60 | +0.85 | +1.36 | +0.63 | +0.91 |
| 2024 | July | +0.73 | +0.86 | +0.61 | +0.96 | +0.44 | +0.56 | -0.07 |
| 2024 | Aug | +0.75 | +0.81 | +0.69 | +0.74 | +0.40 | +0.88 | +1.75 |
| 2024 | Sep | +0.81 | +1.04 | +0.58 | +0.82 | +1.31 | +1.48 | +0.98 |
| 2024 | Oct | +0.75 | +0.89 | +0.60 | +0.63 | +1.89 | +0.81 | +1.09 |
| 2024 | Nov | +0.64 | +0.87 | +0.40 | +0.53 | +1.11 | +0.79 | +1.00 |
| 2024 | Dec | +0.61 | +0.75 | +0.47 | +0.52 | +1.41 | +1.12 | +1.54 |
| 2025 | Jan | +0.45 | +0.70 | +0.21 | +0.24 | -1.07 | +0.74 | +0.48 |
| 2025 | Feb | +0.50 | +0.55 | +0.45 | +0.26 | +1.03 | +2.10 | +0.87 |
| 2025 | Mar | +0.57 | +0.73 | +0.41 | +0.40 | +1.24 | +1.23 | +1.20 |
| 2025 | Apr | +0.61 | +0.76 | +0.46 | +0.36 | +0.81 | +0.85 | +1.21 |
| 2025 | May | +0.50 | +0.45 | +0.55 | +0.30 | +0.15 | +0.75 | +0.98 |
| 2025 | June | +0.48 | +0.48 | +0.47 | +0.30 | +0.80 | +0.05 | +0.39 |
| 2025 | July | +0.36 | +0.49 | +0.23 | +0.45 | +0.32 | +0.40 | +0.53 |
| 2025 | Aug | +0.39 | +0.39 | +0.39 | +0.16 | -0.06 | +0.82 | +0.11 |
| 2025 | Sep | +0.53 | +0.56 | +0.49 | +0.35 | +0.38 | +0.77 | +0.30 |
| 2025 | Oct | +0.53 | +0.52 | +0.55 | +0.24 | +1.12 | +1.42 | +1.67 |
| 2025 | Nov | +0.43 | +0.59 | +0.27 | +0.24 | +1.32 | +0.78 | +0.36 |
| 2025 | Dec | +0.30 | +0.45 | +0.15 | +0.19 | +2.10 | +0.32 | +0.38 |
The full UAH Global Temperature Report, along with the LT global gridpoint anomaly map for December, 2025 as well as a global map of the 2025 anomalies and a more detailed analysis by John Christy, should be available within the next several days here.
The monthly anomalies for various regions for the four deep layers we monitor from satellites will be available in the next several days at the following locations:


Only the 6th warmest December
1 2023 0.74
2 2024 0.61
3 2019 0.43
4 2015 0.35
5 2017 0.31
6 2025 0.30
7 2003 0.26
8 1987 0.25
9 2021 0.22
10 2016 0.16
Interesting that 1987 was so warm.
This is the first time since May 2023 that the anomaly has been below the current trend line.
The anomaly for the USA is very high. Second warmest anomaly for any month, and the warmest December.
Bellman
” The anomaly for the USA is very high. ”
Although the CFS V2 forecast for the US in January only includes land data, it can still be a meaningful hint to the previous December:
https://www.cpc.ncep.noaa.gov/products/CFSv2/imagesInd3/usT2mMonInd1.gif
A comparison with the forecast for Europe is interesting:
https://www.cpc.ncep.noaa.gov/products/CFSv2/imagesInd3/euT2mMonInd1.gif
Maybe it’s better to save them.
US
https://i.postimg.cc/SK0GX1fL/us-T2m-Mon-Ind1-050126.png
EUR
https://i.postimg.cc/qvKsdXHp/eu-T2m-Mon-Ind1-050126.png
Was 1998 warmer than 2020? I can’t tell what year is in 4th place behind 2016.
Greyhound81
I just had a look at a descending sort of the yearly averaging of UAH’s monthly LT data since Jan 1979:
2024 0.774 (C)
2025 0.472
2023 0.431
2016 0.389
2020 0.351
1998 0.348
2019 0.296
2017 0.265
2010 0.193
2022 0.148
*
You may mean the 5th place in between…
The 1877 spike continues to serve as a template. I wasn’t sure if the tail would be longer this time given the origin of the spike is different.
https://localartist.org/media/HTvAkjsaENSO2512.png
I’ve nearly finished a paper explaining why climate largely repeats after 3560 years. I hope to make it public in January.
https://localartist.org/media/NGRIPCores3500shift.png
Dr. Spencer, let me know if you’d like to see a draft copy.
I posted this comment last month, and now I see that the linked graphs have been viewed over 100 times.
I’ll re-up the graphs https://ibb.co/chfy3mmq and the accompanying follow up post for the benefit of any new lurkers.
Ark, why do you keep avoiding the issue?
https://www.drroyspencer.com/2025/12/uah-v6-1-global-temperature-update-for-november-2025-0-43-deg-c/#comment-1726504
Arkady, I am also curious about these graphs, can you accompany them with some sort of analysis and what conclusions that can be made?
Today’s entry notes that December, 2025 was +0.30 deg. C departure from the 1991-2020 mean. However, the earliest mean, covering the first 20 years of observations (1978-1999) was about 0.22 lower than the current, meaning the departures you report appear smaller because of the use of a later baseline average–otherwise Dec. 2025’s anomaly would be something like .52 Deg C.
Why raise the baseline other than to reduce the apparent anomaly?
MFA
” Why raise the baseline other than to reduce the apparent anomaly? ”
This was not the reason, even if many of those I name the pseudo-skeptics would welcome it.
The reason to the change of the reference period, first from 1979-1998 to 1981-2010 and then from 1981-2010 to 1991-2020 is manifestly the will to be in agreement with WMO’s respectively newest recommendation.
Some follow it too, e.g. JMA, the Japanese Met Agency.
Others don’t, especially NASA GISS (1951-1980), RSS (still on 1979-1998) or partly NOAA which for global time series keeps on 1901-2000.
My guess (!): this might be due to how these climate data providers construct anomalies out of historical data; the probably tend to keep as reference the period with the most available absolute data, what reduces the standard deviations and gives thus better estimates.
But it downplays and therefore misrepresents the amount and rate of change.
To remain honest, Dr. Spencer should display the original baseline as well as the later one.
” But it downplays and therefore misrepresents the amount and rate of change. ”
Not so. The reference period shifts change the anomalies but don’t significantly change the trends in the time series, even if the shifts result in obtaining the data from sources slightly differing over time (satellites, surface stations).
However, what very significantly altered the rate of change in all UAH time series has been the transition from revision 5.6 to 6.0 in 2015, with a downward change from 0.14 to 0.11 °C per decade in LT.
MFA,
You are correct that the placement of the axis affects the interpretation of the data. Well know effect. It’s why pie charts are often used to disguise the numbers or why certain colours are used to highlight the message.
People like Bindy don’t really understand this.
In a few months we may start to see negative anomalies.
Sure, Jan. But if so, not for long.
Recent 30-year baselines are traditionally used by most weather and climate data reporting organizations, and the most recent baseline is 1991-2020. But the linear trend is the most important metric if you are interested in how much warming there has been over the entire period, which I also document every month. If I wanted to “hide the incline” I’d just compute anomalies relative to the most recent 10 years rather than the 30 year baseline.
Thank you for the reply. The incline is visually obvious from the graph; what isn’t as clear is how far the anomalies have already departed from the original baseline–which tells a different, less attenuated story than variations from a floating/rising baseline. On the same front, I hope you will consider updating this 2010 post…
https://www.drroyspencer.com/global-warming-background-articles/carbon-dioxide-growth-rate-at-mauna-loa/
…to reflect the additional 15 years of collected data that to my eye show a clear acceleration in the accumulation of CO2 at Mauna Loa.
I often cite your work/this site in discussions with Climate Torporists as it is the most conservative popular outlet with legit data. Thank you for continuing it.
MFA,
The CO2 Concentration measured at Mauna Loa (and elsewhere) is accelerating, but the effect on temperature anomalies is expected to be logarithmic and CO2 concentration has been approximately linear in recent decades when plotted on a log scale.
Here’s my graphical version of global land temperature using the Berkley Earth time series with atmospheric CO2 levels on a log scale overlaid.
https://southstcafe.neocities.org/climate/bestAndCO2.png
An alternate way of looking at this is to plot the regression of log(CO2) and temperature anomaly which is an simplistic estimate of climate sensitivity.
https://southstcafe.neocities.org/climate/bestAndCO2.png
I say this is simplistic in that it presumes CO2 alone is responsible for observed warming, but in reality there are contributions from other greenhouse gases, aerosols attenuating warming, and variation in natural forcings and internal variation that are not considered.
Whoops, the correct link for the regression plot is here:
https://southstcafe.neocities.org/climate/best_land_vs_co2_doubling_long.png
Hi Mark B,
I am looking at the log CO2 charts.
What is the reason for only including land temperatures?
/David
David,
There’s two motivations behind that particular graph.
First, Berkeley Earth’s land-only is the longest running, nominally global temperature anomaly dataset available (1750-present), thus allowing a longer time period over which to illustrate the CO2-temperature correlation. Global land/ocean series including the BEST and HadCrut start in 1850.
Second, in the estimation of climate sensitivity, land temperatures respond more quickly to changes in forcing whereas ocean including ocean surface temperatures are subject to the considerable thermal inertia of the oceans. Thus the sensitivity estimate is plausibly a better estimate of equilibrium climate sensitivity rather than a transient sensitivity subject to thermal inertia.
The broad shape of the land, ocean, and land/ocean time series is the same except the magnitude of ocean (thus land/ocean) anomaly is smaller which results in a smaller calculated sensitivity, albeit one with a different meaning.
For example, here’s the regression for GISS land/ocean with CO2 since 1959, that being when the Mauna Loa CO2 record starts:
https://southstcafe.neocities.org/climate/giss_vs_co2_doubling_1959.png
Thanks Mark,
The risk of using only land-only temperatures is that the stations are subject to heat the heat island effect. Especially for those stations that have long time series.
Dr Spencer have some extensive articles about it here on the blog.
Have you taken that into account when performing the regression analysis?
Mark, you can be easily tricked by charts and graphs. For example, there has been a huge increase in ice cream production in the last 100 years. Companies like Ben & Jerry’s, Haagen-Dazs, Baskin-Robbins, and Cold Stone Creamery, didn’t even exist before 1900. So you could prepare a chart showing a link between CO2 and the increase in ice cream. Does that mean CO2 is causing more ice cream?
You have to be careful. Don’t be tricked. There are many frauds and cultists out there….
David,
For the graphics linked above, I’ve simply taken the BEST series at face value. If one were inclined to be more rigorous, they could incorporate the BEST uncertainty estimates in the analysis but my educated guess is that the issues I mentioned earlier are more significant than potential residual UHI induced bias.
I say this because the BE project was undertaken specifically to address perceived potential issues with existing temperature anomaly series including UHI induced biases.
https://berkeleyearth.org/methodology/
https://berkeley-earth-wp-offload.storage.googleapis.com/wp-content/uploads/2022/12/03232406/UHI-GIGS-1-104.pdf
My impression is that they’ve done so far more rigorously and transparently than have their remaining critics, so until and unless the counterargument becomes more robust and compelling, I’m not inclined to spend much time dwelling on it.
Well, it’s not really transparent to present the data series starting from 1750 in a line without confidence interval implying that the precision is the same over the entire timespan.
If their method is a “rigorous” as with the other temp datasets where old stations are interpolated over time and sensors mounted near heat absorbing objects it does not really hold much quality.
Also I don’t really understand why it always has to be a fixed reference period. In your regression you are indexing against 1750 which do not make sense. If the warming effect works as stated a delta value between two consecutive years would suffice.
Indexing two values with two completely different precision over 100 years apart does not make sense.
I can’t remember when the reference period was changed but it wasn’t that long ago and it was extensively explained and discussed. A bit of a slog butyou could go back through the blog entries and find that discussion. For what it’s worth I commented (recognizing that I am a complete amateur!) at the time that I thought it would make sense to keep the anomaly from the original reference period alive and accessible in some manner. But the reason for the change was explained and did seem fair and logical.
https://youtu.be/l2QjDA9QgNE
20 years ago 60 Minutes ran a segment titled Rewriting the Science, in which James Hansen spoke out about White House censorship of climate science.
The amount of CO2 in the air then was ~382ppm; it’s now ~428ppm.
So it will take 186 years to double CO2…which would give us perhaps less than 1°C. So need to worry, then.
I don’t know where I’ll be then, but I sure as hell won’t smell too good.
No, it won’t take that long, because the rate of CO2 increase is accelerating.
https://gml.noaa.gov/ccgg/trends/
Try to keep up.
MFA: The amount of plants also accelerate at the same rate. It’s a well known fact that CO2 boosts plant growth. Plants tend to use all extra CO2 they can get. The average residence time of CO2 molecule in the atmosphere is found to be 3-4 years.
MFA:
185 years, then.
I get about 120 years to double from the current level (428 ppm to 856 ppm) and about 50 years to double from preindustrial (280 ppm to 560 ppm).
This is using compound growth with 0.6% increase per year.
Obviously this depends upon the actual trajectory of future emission.
Using the trend of the last 5 years, and having it staying constant, we reach 560, double the preindustrial value, in 56 years.
It will likely takes some time to slow down from our present rate of increase.
I remember this event regarding Jim Hansen, and I was a NASA employee at the time. Hansen wanted to say whatever he wanted to congress and the press, whenever he wanted. But there are NASA rules against unilateral interactions with congress and the press. You are supposed to go through the chain of command, including the Public Affairs office. Hansen didn’t want to do that. So, since NASA is an Executive Branch agency, all the WH did was tell NASA to rein Jim in and make him follow the rules. Then Hansen went to the press (of course) claiming the WH was muzzling him.
A member of congress asked me, “How does Hansen get away with this?” The only conceivable answer was that Hansen’s alarmism helped support NASA Earth science missions, the funding for which was directly proportional to the amount of alarm over the threats of anthropogenic climate change.
I personally decided I didn’t want that kind of control over me anymore, so I resigned from NASA and joined UAH, even though I continued on as the U.S. Science Team leader for the AMSR-E instrument on Aqua for many years afterward.
If Jim didn’t like NASA rules, he should have resigned, too.
First and foremost, happy new year, and welcome to the future.
Respectfully, focusing on intent (“alarmism,” “agenda,” “seeking patronage”) rather than engaging the substantive evidentiary claims makes Hansen look like a modern day Galileo, no?
There is no publicly verified evidence that Hansen’s communications were deliberately used by NASA administrators to secure funding.
I get your overarching point about internal coordination requirements, but the specific enforcement at that time was less formal than you imply. NASA’s written policy did not strictly prohibit direct scientific communication until it was formally codified in the 2006 policy update; from the IG Report dated June 2, 2008:
Ark, Roy is likely referring to the Hatch Act.
https://en.wikipedia.org/wiki/Hatch_Act
…which is, of course, exemplary and a testament to your integrity and honesty.
Typo in the table? Dec (2025) has a 2026 year ?
yes, thanks, fixed -Roy
So…what caused the 2024 spike in the LT? If it was CO2, why wasn’t it sustained?
Can it be anything other than Hunga Tonga?
The evidence is very strong, but like everything in climate science, it is complex and there are competing theories. The best case is that there were different effects from the various gases, such that the initial effect was cooling and the long term effect was warming. This concept would explain the lag between the eruption and the sudden and strong effect in the atmosphere in early 2023.
You can find alternative ideas (post + comments) here:
https://wattsupwiththat.com/2025/12/20/scientific-report-or-legal-brief-the-hunga-tonga-assessment-and-the-anatomy-of-narrative-closure/
These spikes are frequent throughout the holocene and in the instrument record in the late 19th century, mid 20th century, and 1980-2024.
They are in time with the motions of Jupiter and Saturn operating on a 60 year pattern.
Insolation models used by NASA decades ago built the idea of longer term variations by retained heat from variations in the motions of Jupiter and Saturn leading to the idea of perhaps a linear 100,000 year cycle via the retention of heat in snow and ice and the resulting albedo effects of advances and retreats of glaciers. This brings us to longer termed cycles of the planets.
These effects are variously thought to also build up over time into a 100,000 year linear effect on earth’s eccentricity. But this is more science community myth than anything available in print as what is in print suggests strongly otherwise.
The pattern lines up with 20 and 60 year period motions of Jupiter and Saturn. This creates the major spikes and stepped warming noted in the instrument record. The physics is based on the gravitational influence on variations in earth’s speed in its annual orbit. Through half of earth’s orbit this influence changes the time earth spends in its orbit furthest and closest to the sun. Each ~450 years it moves from a warming influence to a cooling influence as it takes 900 years for jupiter and saturn close encounters to cover the entire celestial compass.
So for ~450 years earth’s travel closest to the sun move 1/2 an orbit more slowly and then the next ~450 years it moves faster. These are only approximate because the outer gas giants have an influence on the timing on longer term orbits and there may be yet to be identified space objects beyond Neptune that cause other perturbations that are too distant or too distributed to be observed regularly because they emit nor reflect significant light.
These forces create the major bumps in the temperature record that some have attributed to AMO and PDO variations in temperature that are seen in the instrument records.
In addition to the combined motions of jupiter and Saturn (20 year pattern of conjunctions each occurring about 240 degrees apart meaning over 60 year period they will line up once or twice in one half of the orbit with that pattern which half gets 2 varying once every ~450 years in a 900 year cycle. These variations created the larger bumps seen in the ice core records, like the MWP period, Roman Optimum, and the Minoan Warm Period. Likewise between the MWP and the present its responsible for the LIA.
The combined motions of Uranus and Neptune besides influencing the 60 year pattern and 900 year pattern of Jupiter and Saturn, moves slowly around the heavens over an approximate 170 year cycle via the close 2:1 orbit ratio between those two major gas giants. The effect is very small but it lasts a long time creating short term effects of ~80+years and 170+ years (also creating the conditions for the Voyager expeditions using planet gravity to cover vast distances in space for those space vehicles that NASA says occurs about once every 175 years)
It is also believed that axial motions of earth while not influencing the mean annual insolation received by earth, influences how much of that is reflected from variations in snow and ice cover.
CO2 may have some effect in that the recent peak is a good deal warmer than late 19th century effect. And in the 1940’s peak Uranus was in opposition to Neptune having a cancelling effect. But effects if CO2 still needs sorting out from these longer termed natural cycles.
Thanks for that. I feel that there are many planetary effects (on Earth) that we have yet to discover.
To what do you attribute the 45 year drop in global cloud cover (which coincides with the modern warming period)? Do you believe it is cosmic rays or, I read only yesterday, yet another effect from CO2? However, even many proponents of this theory say that the level of CO2 would have to be very high to affect cloud formation.
Since cloud cover is heavier later in the night and early in the morning while cloud burn off occurs later in the morning through the warmest parts of the day; a loss of cloud cover is consistent with an increase in annual mean global insolation due to the orbital speed effects of the shorter term Milankovic cycles.
Earlier this year I posted references to a review of Milankovic’s work that shows a orbital variation that occurs on a 20 year cycle which happens to correspond to conjunction cycle of Jupiter and Saturn. All these individual orbit cycles are influenced by other cycles not on exact short term ratios moving dates. That is why a significant modeling effort is needed to fully understand mathematically what is going on. In 1980 the 4 major planets were all left (on the cool side) of earth’s major orbital axis. From then until now Saturn, Uranus, and Neptune all moved to the right side (warm side), while Jupiter moved from the cool side an entire rotation and then into the warm side with the 4 major planets becoming most closely aligned on the warm side between mid 2023 to mid 2024. . .very close to 45 years.
If CO2 does the same then I would expect you would see above the clouds a warming sky moving closer to the temperature of the cloud tops to fulfill the GHE requirement of something above getting warmer than before. I can’t speak to that because I haven’t seen any compilation of data over long enough periods to deign what might be happening there. At least there are available ephemeris to track the planets.
Bill,
The Jovian planets are the primary drivers of the 3560-year pattern I mentioned above. While they certainly affect Earth’s orbit, they also modulate solar activity.
The effect of Jupiter-Saturn conjunctions on climate is not immediate; for 20- and 60-year conjunctions, there’s a ~15-year delay, likely a bit less a few hundred years ago. Some of this delay is likely in the Sun, but I suspect most of it comes from the delay of ocean heat integration.
Not all Jupiter-Saturn conjunctions are the same. Here’s a plot of conjunctions delayed by 15 years.
https://localartist.org/media/JupiterSaturnConnectionAMOLong.png
In the upper panel, the x-axis labels are the dates of the 60-year conjunctions (delayed by 15 years). The most recent 20-year conjunction (delayed) lines up with the 2016 El Niño event. I believe this is the start of what will be at least a 20-year cooling period which we should return to as the HT anomaly fades.
Because CO2 has absolutely nothing to do with it. !
Agreed!
Why should such a short, sudden increase be attributed to any source identified as having rather long-term effects?
Buzz,
There’s a nice article by Zeke Hausfather looking at attribution of 2024 exceptionally high temperature anomaly here:
https://www.carbonbrief.org/analysis-what-are-the-causes-of-recent-record-high-global-temperatures/
The summary attribution is shown in this figure from that article:
https://www.carbonbrief.org/wp-content/uploads/2025/12/recent-warming-7.png
CO2 isn’t responsible for the annual departures, only the background average climate over which the interannual departures sit.
CO2 isn’t alone in this function. Orbital variation changes background temps over millennia, for example. But CO2 is the dominant driver of the increasing background temps.
What’s the quote? Climate loads the odds, weather rolls the dice.
barry just keeps parroting the cult nonsense: “But CO2 is the dominant driver of the increasing background temps.”
He’s got no science, only beliefs.
Nothing new.
Robert Cutler says:
”The Jovian planets are the primary drivers of the 3560-year pattern I mentioned above. While they certainly affect Earth’s orbit, they also modulate solar activity.”
I agree. I came up with a number roughly around 3,600+ years based upon ephemeris data on conjunctions of Uranus and Neptune, very near a 2:1 orbit ratio in about 17 degree steps, between 1607BC and 1993AD.
With Jupiter and Saturn having a conjunction every 20 years in its 2.5:1 orbit ratio one could say it roughly circumnavigates the compass once every 60 years in 3 steps and then fills in that circumnavigation to within about 5 degrees once very ~900 years.
Robert Cutler says:
”The effect of Jupiter-Saturn conjunctions on climate is not immediate; for 20- and 60-year conjunctions, there’s a ~15-year delay, likely a bit less a few hundred years ago. Some of this delay is likely in the Sun, but I suspect most of it comes from the delay of ocean heat integration.”
What I did was a mean half orbit gravitational influence calculation of the Jovian planets to get an idea of what the possibilities are. And to explain the warming we have experienced from that in the past 45 years I came up with a number that seems pretty reasonable with a water feedback at the popular number. but with that number in contention there could be room for significant CO2 warming (but I am not convinced)
Robert Cutler says:
”Not all Jupiter-Saturn conjunctions are the same. Here’s a plot of conjunctions delayed by 15 years.
https://localartist.org/media/JupiterSaturnConnectionAMOLong.png”
Very good!
The shifting of the conjunctions back and forth from the cold side of the orbit to the warm side over a 900 year cycle in 60year increments is due to the shifting of the conjunctions in any particular location by about 8 degrees every 60 years.
You can take your methodology out to the 900 year and 3600 year cycles and match it almost perfectly with this ice core sample with the roughly 4:1 ratio between the J&S conjunctions and the U&N conjunctions landing them into unique alignments.
https://co2coalition.org/facts/temperatures-have-changed-for-800000-years-it-wasnt-us/
Bill, I wish it were as simple as warm and cold sides. The J-S conjunctions give us a basic 20-40-60-year patterns, but the Sun’s orbit is also involved and there are many more cycles — too many to model. For example, there are at least three 900-year cycles all having periods within a 60-year span.
> https://localartist.org/media/JupiterSaturnConnectionAMOLong.png
Let’s see.
The cycle keeps making lower highs since 1579.
The 20y conjunction is clearly non-cyclical.
Yet there’s a hockey stick after 1937.
As a famous contrarian astrologer would say: LOL!
there is no doubt that there are a huge number of influences.
but the major forces of just the 4 jovian planets give a good approximation quantitively to the relative anomalies seen the instrument temperature record. i plotted out the 4 largest warming peaks since 1860. every one had three or four jovian planets on the warm side. and both the most recent ones are the only ones that had all four.
venus is the planet with the 2nd greatest gravitation effect on earth. but its orbit period only affects earth’s orbit in one direction for less than 4 months. so it can enhance a few months but it doesn’t add up to a significant effect on mean annual global insolation.
i think other important work is related to longterm carefully calibrated solar brightness measurements and feedbacks from cloud variations. if you get those on track you should be able to show that while climate change requires adaptations as it always has there simply isn’t much of anything remaining to worry about.
there are challenges in dealing with newtons three body problem limiting long term predictions but that shouldn’t amount to much afa adaptation planning goes unless of course you put somebody like gavin newsom in charge of the planning. then you will need lead times to be 4 or 5 times longer.
i don’t understand you point about 3 900 year patterns. one 900 year jupiter and saturn alignment pattern covers 360 degrees of sky down to less than 5 degrees increments in one 900 year period. 5 degrees has a very small effect on a gravity vectors force.
Bill Hunter:
“i don’t understand you point about 3 900 year patterns. one 900 year jupiter and saturn alignment pattern covers 360 degrees of sky down to less than 5 degrees increments in one 900 year period. 5 degrees has a very small effect on a gravity vectors force.”
The Sun has it’s own orbit that interacts with the Jovian planets. The plot I showed only accounts for the interactions between Jupiter and Saturn. A faster 900-year cycle is found in the orbital motion of the Sun around the barycenter. Right now those two cycles are coming into phase with each other. ~4000 years ago they were out of phase.
The third cycle relates to Jupiter-Saturn conjunctions, but beyond establishing its period, all I can say at this point is that it may relate to the 70k-year cycle associated with glacial cycles. The 70k-year cycle can be seen in my 3- and 12-term harmonic models.
https://localartist.org/media/EPICA3term.png
https://localartist.org/media/EPICA12term.png
Robert Cutler says:
”The third cycle relates to Jupiter-Saturn conjunctions, but beyond establishing its period, all I can say at this point is that it may relate to the 70k-year cycle associated with glacial cycles. The 70k-year cycle can be seen in my 3- and 12-term harmonic models.”
I mucked around with barycenters early on and got tangle footed. Computer models have to deal with the 3 body problem but its really only a major factor for longterm predictions beyond thousands of years. Predictions of a few hundred years have been easy to handle for some time and is central to planetary mission planning and the Voyager expeditions launched in 1977. Building a computer model to redo Milankovic’s work for the glacials might be difficult but probably manageable and produce much stronger evidence beyond yeah his theory makes the most sense.
I don’t pretend that this will end the search for all factors of climate change but the association of these easily calculated cycles corresponding to ALL our climate observation data provides an order of magnitude more evidence than the popular science CO2 theory.
Further to discount the fairly easy calculable results over a few hundred years, those calling it into question will have to attack the sensitivity estimate of a 3:1. . .and with that mission accomplished.
The end result will be yes we should have some good information to aid adaptation to whatever climate change that occurs, either anthropogenic or natural. But I am convince that the natural processes that are responsible for climate change in the past up to 3C during the Holocene take considerably longer than 100 years.
Bill Hunter:
“But I am convince that the natural processes that are responsible for climate change in the past up to 3C during the Holocene take considerably longer than 100 years.”
I’m convinced that rapid warming and cooling events are solar in origin. I have more evidence than this single data point in my paper, but if you look at the left panels of this data I showed earlier (repeated below), after shifting 3560 years the termination of the Younger Dryas lines up with the 8.2ka event (6200 BC). These transitions take less than 200 years.
https://localartist.org/media/NGRIPCores3500shift.png
BTW, I use data from the JPL Horizons system.
Robert The 8.2ka event may is believed to be a northern hemisphere anomaly, possibly the draining of Lake Agassiz.
The ice core of R.B. Alley shows both the 8.2ka event and a ~7ka event as peak 3.
https://co2coalition.org/facts/temperatures-have-changed-for-800000-years-it-wasnt-us/
The dating for this is believed to be accurate to +-10%
I am going to take a wild guess that whatever effect raised the temperature so dramatically in early 2023 has now changed. Was it the Hunga-Tonga effect?
I thought that Dr Spencer attributed it to be Hunga Tonga a couple of years ago, but he now states that there was no such effect. Bill Hunter’s is plausible.
I think we will find that the super El Nino in 23-24, after several La Ninas, was the main cause of the warm spike, riding on top of the ongoing long term warming trend.
Some ocean warming cycles appeared to also play a role by warming parts of the N. hemisphere ocean significantly.
Given that 2025 was the second warmest year, it appears that are cooling from these events to a new higher plateau, similar to what happened after 1998, and 2016 El Ninos.
“Given that 2025 was the second warmest year, it appears that are cooling from these events to a new higher plateau, similar to what happened after 1998, and 2016 El Ninos.”
Yes.
https://skepticalscience.com/graphics.php?g=465
Nate, please stop trolling.
What tro.lling?
I’m shocked, shocked I say, to see that DREMT has nothing to add to these discussions, but feels the need to mark them with his piss anyway.
No, Nate, I said please stop trolling. Not “troll 100 times worse than you already were”.
Again What tro.lling?
How bout you setting the example first?
Stop tro.lling with your juvenile false accusations of tro.lling.
You’re trolling here seven days a week, Nate. Constantly. Who are you trying to kid?
Again What tro.lling?
Show us how you identify it.
In this case, it was just your usual “there’s nothing to see here” handwaving. That’s why I asked you to stop trolling in this thread. “Trolling” is a very subjective term. IMO, you’re “trolling” all the time. Obviously, you think differently. You think I’m trolling to ask you to stop trolling. OK. You express that opinion, and I’ll continue to ask you to stop trolling. Personally, I think you’re very bored this month, and just looking for a fight wherever you can, with me. Clearly I entertain you far more than anyone else.
My comment was on topic and civil. Yours not at all. Again you are trolling, and pretending there is a method to it other than trolling everyone except your allies.
Just clogging the blog.
It’s perfectly civil, and always on-topic, to politely ask you to stop trolling, Nate.
Nate, please stop trolling.
Then if I politely ask you stop posting ad-hominems, is that OK?
Politeness in your responses to me would be a welcome change, Nate.
SOLAR MINIMUM UPDATE
It’s the most magical time of the year — when estimates of last year’s global average temperature anomaly come out. Time to dust off my “last year was hot” auto-response.
https://bsky.app/profile/andrewdessler.com/post/3l7yxx4mc4b2h
Willard, please stop trolling.
According to MEI (Multivariate ENSO Index)
https://psl.noaa.gov/enso/mei/data/meiv2.data
the UAH-LT anomalies could remain low for some time due to the time lag between ENSO signals (here: La Niña) and their appearance in the LT data.
However, La Niña will not last longer if the prediction nino3+4 is correct:
https://www.cpc.ncep.noaa.gov/products/CFSv2/imagesInd3/nino34Mon.gif
Do you think the record from 2024 will be broken before the end of the decade?
¡No sé!
Unlikely.
well finally some of you guys are starting to join the dots up.
For many years I have been reading these blogs, and rarely do I see any comments or theories put Forword, as to why earth rapidly warms up about 1°C over about 16 months AND THEN rapidly cools, about 1°C during the next 2 years, (as occurred 1997 to 2000 and 2023 to 2027 my prediction)
I have observations 14 of these rapid warming cycles and rapid cooling cycles embedded in the UAH RECORDS since 1979.
THESE warming cycles coincide with high gravity anomaly periods, and the cooling cycles coincide with the following weaker gravity force periods. the strongest Planetary alinements for 174 years = 50 years of Global Warming, “just finished”.
PLANETARY ALINEMENTS such as the Earth the Sun Veins Mars Jupiter Uranus are the most powerful warming periods.
Vee shaped aliments such as the planetary positions as of 15th MAY 2024, was the strongest Alinement possible for the current 174-year planetary cycle. I forecast Rapid global cooling will now dominate most of 2026.
A new global cooling trend will dominate the next 100 years.
The Key to the recent 50 years of global warming was the recent conjunction of URANIS and Neptune
well done Bill Hunter.
Correlation alone does prove causation.
To demonstrate causation you need a credible mechanism.
Entropic, that could easily be said about the rise in Co2 that is good for the plants and the rise in global temperature.
The arguments for it being a causation is problematic to say the least.
Of course EM. The physics is gravity and the fact that a distant planet will maximally affect the speed of an object through space by alignment of the pull of gravity tangent to a point on its orbit path.
This effect is monitored astronomically and is known as an orbit perturbation. It creates a significant perturbation of an orbit to have allowed for the discovery of Neptune by first observing Neptune’s influences on Uranus, plotting the forces and vectors and then looking closely in the sector of the sky where those vectors converged. Viola Neptune was found sitting right there. The perturbation isn’t in question its known to exist by physics.
The next question is whether the perturbation affects mean annual global insolation on earth. Well that also can be figured out by physics and given an invariable source of insolation. Now we know the orbit influence correlation has a physical connection to how much radiation impinges on the earth system. Well we know that the sun gives us 7% more sunlight at perihelion than at aphelion. So you spend more time at or near perihelion vs aphelion you will be gaining more sunlight.
The only thing you have to do is 1) account for changes in solar brightness over time and 2) account for how much additional orbit time you get languishing in the various points in the orbit.
This sounds easy peasy but it requires careful calculations as you have many perturbations going on simultaneously affecting not just earth but also the other bodies in the solar system.
To figure it out how important this is its a no brainer it accounts for significant amounts of climate variation as the correlation is very strong virtually all the climate records. . .despite Al Gore spending a lot of money to convince us that we can just ignore that without producing anything scientific.
These effects cover the multi-decadal stepping of warming, the major peaks and valleys of the entire instrument record and I have matched the periods to ice core data as well.
Finally the lack of perfect ratios in orbit periods tells us the variations may occur regularly but with a lot of variations in intensity.
Anon, it might be less easy to say that the evidence is very clear that, on net, the changes going on in the atmosphere, including all the climate changes, are a risk to a lot of major production systems and to a lot of food insecure areas. So there’s definitely a reason that we that we continue to work on how to adapt to these changes.
But it’s truer than what you said:
https://www.theclimatebrink.com/p/is-co2-plant-food-why-are-we-still
Bill, the calculations for earth exact orbit is a three body problem, so you need very accurate observations and a super computer. I find it amazing that there are many who believe in a fluctuation of a trace gas will have a huge impact and yet ignore the simple inverse square law.
I think it was last Sunday that the earth was at its closest. A few million miles difference between closest & furthest points has a impact on the whole planet which is only a few thousand miles across.
Evidence.
https://davidappell.blogspot.com/2020/01/the-testable-falsifiable-science-that.html
Bill Hunter
To show that planetary influence has caused the 1.4C warming you need to show
1) How the planetary influences have changed Earth’s orbit since 1880.
2) How this has changed solar insolation.
3) That the change in insolation accounts for the change in temperature.
Please supply references which will allow us to check your calculations.
Entropic, using anything from David Appell is not credible.
Sure!y a man of your expertise would understand the inverse square law. Do you really believe that the earth follows a simple ellipse?
If you understand that the orbital path is never duplicated then you may start to understand that your simple dismissal is pure Willard.
Entropic man is now a comedian. I hope you are not trying to fool educated people. David Appell is not a credible source for anything, but neither is Gavin Schmidt. Claiming that a particular theory is false does not in any way validate your own false claim.
This is the whole problem with climate hype. The base science about the effect of increasing CO2 does not in any way validate any of the extreme claims. In fact, they cancel each other.
There have been enough claims that are already debunked. In addition, with such a diversity of wild claims, they cannot all be true at the same time. Therefore, none of them can be taken as valid. The only result is that science cannot define the present case when highly complex known and unknown interactions are involved, and it certainly does predict the future.
Entropic man is now a comedian. I hope you are not trying to fool educated people. David Appell is not a credible source for anything, but neither is Gavin Schmidt. Claiming that a particular theory is false does not in any way validate your own false claim.
This is the whole problem with climate hype. The base science about the effect of increasing CO2 does not in any way validate any of the extreme claims. In fact, they cancel each other.
There have been enough claims that are already debunked. In addition, with such a diversity of wild claims, they cannot all be true at the same time. Therefore, none of them can be taken as valid. The only result is that science cannot define the present case when highly complex known and unknown interactions are involved, and it certainly does NOT predict the future.
My apologies. There is no edit feature here, so I need to proof read before, not after posting. Here is the correct final sentence:
The only result is that science cannot define the present case when highly complex known and unknown interactions are involved, and it certainly does NOT predict the future.
Tim S,
You say:
“Claiming that a particular theory is false does not in any way validate your own false claim.”
Then immediately after, you proceed to label Appell and Schmdit as ‘not credible’ and use that label to dismiss Entropic man’s references, without addressing the substance the references provide.
If simply asserting that a claim is false does not validate your own position, then simply asserting that sources are ‘not credible’ does not invalidate theirs either.
That should say:
But immediately before
My statement is fully logical and consistent. You cannot prove a negative, or prove that pure speculation is true. The criticism directed against my statement is not logically valid. Sorry.
Tim S
I see now that I misunderstood the statement I quoted, and I apologize for that.
That said, you may want to consider how your argument comes across when you make assertions such as:
“David Appell is not a credible source for anything, but neither is Gavin Schmidt.”
without providing any justification.
Entropic man says:
”Bill Hunter
To show that planetary influence has caused the 1.4C warming you need to show”
I agree EM!
The correlation is very strong, at least an order of magnitude stronger than CO2 theory.
But causation requires careful and deliberate calculations. All I have done I have already described making shortcut calculations used by auditors to assess risk. Should I spend more time in this area because the test says substantial risk exists that this effect is capable of explaining a major piece of climate change.
A climate model centered around widely accepted Milankovic principles will require a substantial effort.
This is the reason that David Appell has zero credibility. Actually, he is reliably unreliable.
https://www.drroyspencer.com/2024/09/david-appell-awaiting-the-death-of-climate-skeptics/
[This blog received the following comment from our alarmist friend David Appell, freelance writer:
“Roy, nobody who is serious about climate change takes you seriously. You’re a denier who has made too many mistakes. No one who knows anything is going to bother commenting here–they upset you so much that all you can think to do is block them.
You long ago left the realm of science. As they say, science advances one funeral at a time. Nobody believes your time series anyway. You did that to yourself.”
As many here know, our UAH temperature dataset is used by researchers around the world, including those who believe the more alarmist narrative of anthropogenic climate change. It has been validated with global weather balloon data in multiple peer reviewed studies.]
I am shocked, shocked I say, that Tim is attacking messengers, without rebutting any of the scientific evidence they show.
And we can notice that all of the evidence comes from Gavin Schmidt.
Somehow David A has tarnished it by merely quoting Gavin discussing its significance.
Nate says:
”And we can notice that all of the evidence comes from Gavin Schmidt.
Somehow David A has tarnished it by merely quoting Gavin discussing its significance.”
You aren’t really discussing its significance Nate unless you are also quoting qualified people that hold different opinions. Tim is spot on here and you are just such a political tool you have no idea what the actual significance is.
Holy bothsidesism, Batman!
I count no more than 2 times in the UAH record where the temperature “rapidly warms up about 1C,” so your thesis is false from the start.
But I found a couple of data sets that do correlate well.
First up, the S&P 500 has plenty of high years that correlate with the peaks every few years in the UAH record.
https://www.slickcharts.com/sp500/returns
The other one, that is possibly much less related to global temperature than the stock market, is the interannual temperature oscillations in the Pacific Ocean, otherwise known as el Nino and la Nina.
https://psl.noaa.gov/enso/dashboard/img/nino34.png
Now that LOOKS to be closely correlated with the UAH peaks in the temp record, but I don’t trust the statistics of a natural system based on temperatures across a swathe of ocean.
No, I think the stock market probably has a much stronger mechanism driving global temperature swings.
Correlation is not causation.
Nobody will accept this planetary alignment nonsense without a proper mechanism.
Yep.
Entropic man,
The mechanism is called the inverse square law that affects how much energy the planet receives.
Of course go and prove the inverse square law is false. Or prove that the earth’s orbit is identical each year.
I’m not surprised that Nate is riding on your coat tail, just need Bindy to form the trio.
Ent January 6, 2026 at 6:07 AM: “Correlation alone does prove causation.”
Ent January 7, 2026 at 8:23 AM: “Correlation is not causation.”
Ent has no knowledge of science, and now he’s even confused about his own beliefs.
Clint is too ignorant to detect obvious typos.
No surprise.
“The mechanism is called the inverse square law that affects how much energy the planet receives.”
Which we all know, but tells us nothing specific for this problem.
Since Bill provides no calculations using the inverse square law to back up his assertions, nor does he link to anyone doing the calculations and confirming his notions.
I spent time finding the NASA JPL calculated Earth-sun distance, and showed them to Bill a couple of times.
Eg:
https://astropixels.com/ephemeris/perap2001.html
They show negligible changes in the Earth-sun distance (and thus insolation) on the short time scales he discusses.
He simply ignores contradictory evidence and provides none himself.
Child Nate attempts to cover for the incompetent Ent. He claims Ent made a typo, but does not correct it.
But, as usual, he gets in his obligatory insult.
Kids these days….
“obligatory insults”
You mean like “Child Nate” and “incompetent Ent”?
Child Nate, “Child Nate” and “incompetent Ent” aren’t insults, they’re reality.
If you’re insulted by reality, that should tell you something….
So you think that, in reality, I am a child?
OMG.
Just adds to list of things you are really bad at.
Nate,
Like Bindy you find a couple of numbers and think you have proved your point.
People on your side claim that a couple of watts per square meter increase will be too much. Yet the slight change in the orbit will account for this.
So do you care to reconsider your view
?
It’s even worse than that, child Nate. Not only are you a child, but you’re a child-of-the-cult. You’ve been so indoctrinated that you can no longer think for yourself, or learn.
You can’t see that in yourself, but if you had any maturity you’d be able to see it in others like Willard, Bindi, Ark, and Ball4.
And I didn’t even mention your incessant stalking of me….
Anon,
Have you found the slight change in the orbit yet?
“Fun fact: Venezuela has six million women of childbearing age. Most of them are desperate for money. If we employ them as surrogates, we could easily make 60 million more Americans in one generation, and fight poverty in the global south.” — @wylfcen, a fan of Dozing Donald
“Not only are you a child”
Thanks for confirming your irrationaliyy.
Willard, so you don’t understand the inverse square law, not really a surprise. So if you can’t understand that what hope have you got to understand the complexities of the climate.
Do the maths, how many watts per square meter difference is there between summer & winter. And what change is there each year. You might want to ask Nate & Bindy for help.
Anon,
“Like Bindy you find a couple of numbers and think you have proved your point.”
Indeed thats what we need to prove a science point. Its all about the numbers.
And I checked a century of Earth-sun distance numbers. They do not support Bill’s claims.
Where are your numbers?
Nate, please stop trolling.
DREMT, please stop pissing on long dead discussions!
No, Nate, I said please stop trolling. Not “troll 100 times worse than you already were”.
Graham D. Warner is looking for love:
https://www.youtube.com/watch?v=Nm4kwyydmeM&t=2s
Willard, please stop trolling.
Bill. How bout if we find the distance to the sun at aphelion?
Here:
https://dqydj.com/solar-distance-calculator/
At aphelion, July 5, it says the distance is:
152,097,430 km.
How bout June 30, 5 days before?
152,089,132 km
That is 8,298 km closer to the sun.
How bout July 10, 5 days after?
152,087,850 km.
That is 9,580 km closer to the sun.
Whether 5 days before or after, the changes in distance to the sun are Just about the size of the wiggle of the Earth’s position caused by the orbit of the Moon, 9340 km.
Try it yourself.
“If anyone’s gonna piss on this long dead discussion, it’s gonna be me!”, roared Nate, like a petulant child.
Get a job.
You comment here more than maybe anyone else at the moment, Nate. You get involved in every discussion, even if it’s not climate or science-related. You talk politics as if every single word you said was fact rather than just your opinion. And, it’s really boring seeing the same old names trying to “last word” every thread.
If anyone should “get a job”, it’s you.
Obviously you dont know what tro.lling is.
Here is a good example: posting purely to name someone and call them a troll.
Yeah that would be tro.lling.
Im contrast, my posts contain content relevant to the discussion. You ought to be trying to do that, or dont bother posting.
At least EM had the sense to drop out once the mechanism was described.
Being skeptical is one thing, but one cannot be skeptical of this mechanism while at the same time be sure about the effects of CO2.
The correlation of the orbit patterns of the jovian planets correspond at a rate of over 90% to timing of variations in climate with major conjoining cycles of planets when they pull or compete against one another along vectors that form what science described during the discovery of Neptune.
This cannot be ignored. . .not if you actually want to understand natural climate change. I would say you start with some basic gravitational models of the planets and if that doesn’t give you the information you need to roughly estimate the effects at least you will have a starting number and then you can incorporate it in climate models and see what you get.
I learned that approach when doing early financial models back shortly after the invention of the PC. Fact was accountants did models to check the veracity of projections, but interestingly most of the projections by entrepreneurs were done in lunch meetings on a napkin by the investors. The computer models were just there to be more convincing and/or adversarial. As Roy has been pointing out models whether on a computer or a napkin need to withstand the test of time. And the problem introduced by the one time most likely cause of natural climate change point directly at making current climate models even less dependable.
Nate just can’t stop trolling. Everyone who’s ever had any long discussions with him all seem to come to the same conclusions about him.
Ad-hominems, the favorite tool of a troll.
We observe that ALL of your posts this month are that. You must be so proud.
Nate’s wrong again.
Typo in table last row, first column should read 2025 vs 2026 for December.
Typo in Table, first column, last row, should read 2025 vs 2026.
b.nice
“Because CO2 has absolutely nothing to do with it. !”
So, apparently, generations of scientists have wasted a century studying a gas that “has absolutely nothing to do with climate,” even as modern weather models depend on the very radiative transfer theory that links CO2 to temperature.
Eldrosion, please stop trolling.
More alarmism…
Parkinson’s is the Canary in the Coal Mine Warning Us That Our Environment is Sick. https://www.ru.nl/en/donders-institute/news/bas-bloem-parkinsons-is-the-canary-in-the-coal-mine-warning-us-that-our-environment-is-sick
TL;DR
If only we had a dedicated public Agency tasked with evaluating Environmental risks on the basis of scientific evidence rather than political convenience, and Protecting us from said risks.
Arkady, please stop trolling.
Happy October 98th
https://www.tiktok.com/@weatherchris/video/7592312748533419319?_r=1&_t=ZP-92rFylTgZd1
BREAKING
ClimateWorkingGroup.com
Another Donald win!
Willard: Thank you for the link. I bookmarked it. I hope the site opens soon despite of legal battles. According to news articles the DOE Climate Working Group has been disbanded, but it is still working independently.
“True science is never settled”.
-Stephen Hawking
Then you might also bookmark this other resource, Max:
https://interactive.carbonbrief.org/doe-factcheck/index.html
Do you think the DOE will publish the thousands of comments they requested before they promote the assessment they ordered from the group they disbanded?
“Renee Nicole Good and pronouns in her bio and leaves behind a lesbian partner and a child from a previous marriage” – Jesse Waters
A propos Watters
” Fox News host Jesse Watters says the US should bomb the UN over Trump’s broken escalator ”
https://www.independent.co.uk/tv/news/trump-escalator-un-bomb-us-jesse-watters-video-b2832888.html
Willard: Your link contains arguments like this:
Dr David Lobell, associate professor, Stanford University:
…The direct benefits of CO2 are widely acknowledged and nothing new. But we know that elevated CO2 leads to climate changes…
Do we really now that? If so, then where is the proof? Or is it something that is “settled” by alarmists? Somebody should fact check that page you linked. It’s a flood of junk like that.
Yes, Max. We do:
https://www.drroyspencer.com/2026/01/uah-v6-1-global-temperature-update-for-december-2025-0-30-deg-c/#comment-1727705
“Harvard law professor Alan Dershowitz was around Epstein frequently. Dershowitz was so comfortable with the sex that was going on that on one occasion he observed me in sexual activity with Epstein.” — Virginia Giuffre
Willard: So you don’t have any proof that support your CO2 theory.
Here are some studies that explain why decrease of clouds leads to global warming:
1. Jyrki Kauppinen, Pekka Malmi: Major feedback factors and effects of the cloud cover and the relative humidity on the climate
https://arxiv.org/pdf/1812.11547
2. Jyrki Kauppinen, Jorma Heinonen, Pekka Malmi: Influence of Relative Humidity and Clouds on the Global Mean Surface Temperature
https://journals.sagepub.com/doi/10.1260/0958-305X.25.2.389
3. J. Kauppinen, J. Heinonen, and P. Malmi: Major portions in climate change; physical approach
https://arxiv.org/pdf/2304.01245
4. Jyrki Kauppinen, Pekka Malmi: No reliable studies of climate change without Henry’s Law and a new thermometer for the global temperature
https://arxiv.org/pdf/2304.01245v2
5. Jyrki Kauppinen, Pekka Malmi: Major Portion of the Increased Atmospheric Concentration of Carbon Dioxide Emitted by the Oceans
https://www.researchgate.net/publication/393188182_Major_Portion_of_the_Increased_Atmospheric_Concentration_of_Carbon_Dioxide_Emitted_by_the_Oceans
6. J. Kauppinen, P. Malmi: No experimental evidence for the significant anthropogenic climate change
https://ar5iv.labs.arxiv.org/html/1907.00165
All from the same outlier group?
Nobody else?
So you have no idea about proof and theory, Max:
https://gasera.fi/blog/how-gasera-gas-analyzers-can-help-reduce-greenhouse-gas-ghg-ch4-n2oemissions/
“I don’t need international law…there is one thing. My own morality. My own mind. It’s the only thing that can stop me.” — Dozing Donald
Nate: Emeritus professor Jyrki Kauppinen and his group has studied climate change for years with their own money. He is now retired from the Department of Physics and Astronomy in University of Turku, Finland. He originally had some patents and a company that was specialized in molecular spectroscopy.
Unfortunately research paper no. 2 is not freely available, but you can translate this page with Google:
https://ilmastorealismia.blogspot.com/2014/04/vedenkierron-vaihtelu-ilmaston.html
There is an interesting formula that can predict climate change in future, but also in the past! Something IPCC can’t do.
ΔT = RΔQ – RGΔØ(p-pe)/Ø
In fig.3 red line represents measured mean temperature and blue line is calculated with above mentioned formula.
Do we need expensive supercomputers when we can use this simple mathematical formula?
Max,
In every field of science they get outlier theories. Until their theory is confirmed by others and tested by others making measurements, they remain outliers.
Better to read review articles that review many papers on a topic.
“can predict climate change in future, but also in the past! Something IPCC can’t do.”
Not sure what you mean by that? The current models do succeed in replicating the last several decades of climate.
https://www.realclimate.org/index.php/climate-model-projections-compared-to-observations/
Max: you are adding an interesting data point to the phenomenon that, in scientific parlance, we call “going emeritus”.
You also added a data point to 793:
https://xkcd.com/793/
“They came up with a new word — ‘affordability.'” — Dozing Donald, reminding us that there was no grammar school on Epstein’s Island.
Debate not your thing,i take it?
On the contrary, Ian.
“But Debate Me” is one of my favorite Bingo squares:
https://climateball.net/but-debate-me/
Have you tried to click on the link ClimateWorkingGroup.com, and where can we found the comments submitted to Roy and his crew?
I get your point, not a fan of disrespecting people,even if you disagree with them. so no disrespect was meant,
All good, Ian.
“That’s fine, dude, I’m not mad at you” – Renee Good, right after the ICE agent says “[expletive] [expletive]” and murders her.
So you have bunch of different scenarios and afterwards you choose the best match.
I thought I had a non-working website you tried to excuse by blaming those you like to blame, Max.
If you’re looking for cherrypicked contrarian crap:
https://ilmastorealismia.blogspot.com/2014/04/vedenkierron-vaihtelu-ilmaston.html
Cf. fig 5-6
“I think we’re going to see those deportation numbers ramp up as we get more and more people online working for ICE, going door to door” — James Donald Bowman, proudly displaying a shirt that may have been silver.
Willard: Figures 3, 4 and 5 proof in 3 different ways that Kauppinen’s math formula really works!
Fig. 6 is done by the blogger, not Kauppinen, so I can’t comment on that.
That’s not a knife, Max. Here’s a knife:
https://judithcurry.com/2012/12/04/multidecadal-climate-to-within-a-millikelvin/
The only thing your guru proves is that he’s stuck on “But RCPs”.
Check Roy’s more recent post for something less problematic.
“If I have to create stories… That’s what I’m going to do.” — James David Hamel, defending his false claims against otters.
Willard: My advice to you and other believers:
1) Draw a hockey stick as high and steep as possible.
2) Adjust the scale of y-axis to match the hockey stick.
3) Say a prayer “I believe in IPCC…”
You need a bigger knife, Willard. Instead of Crocodile Dundee’s knife you should try Rambo’s survival knife with compass. You may need it when IPCC’s tipping point is reached, doomsday comes and the sky falls on your head.
Max: my pro-tip for you, and you alone –
Stop trying to poison my sub-threads with irrelevant crap. Every time you do it, it comes at a price you can’t afford.
Stop pretending you know anything about how science works. You don’t. So every time you do you just look like a fool.
Finally, beware of the rhetorical tricks you are trying to pull. It might turn against you. Witness your silly quote, about a platitude. Now it has turned into the monthly theme.
“In the shadows of Dirty Donald’s mass deportation blitz, a lethal pattern has emerged. Since July, immigration agents have shot at least six people behind the wheel of a vehicle (two of them fatal, including Wednesday’s shooting). In each instance, the playbook is the same: the agent claims self-defense, asserting they “feared for their life” as a vehicle was “weaponized” against them.” — Mike Fox
Willard, please stop trolling.
” Minnesota Law Enforcement Blocked From FBI’s Probe of Fatal ICE Shooting
State officials said the FBI reversed course on a joint investigation of Renee Nicole Good’s death. ”
Sounds suspiciously like the dictatorial behavior of Putin in Russia, Xi in China, or Khamenei in Iran.
Thanks to The Apprentice… dictator!
That headline is rather misleading. They are not “blocked” from investigating, they made a decision to withdraw. Here is the official statement in part:
“Later that afternoon, the FBI informed the BCA that the U.S. Attorney’s Office had reversed course: the investigation would now be led solely by the FBI, and the BCA would no longer have access to the case materials, scene evidence or investigative interviews necessary to complete a thorough and independent investigation”
This is a logical step given the fact that Minnesota is a declared “sanctuary sate” in defiance of Federal immigration law. As such, the state is openly hostile to ICE, and openly supportive of the protestors. They are free to conduct their own investigation based on evidence they gather on their own. They will not have access to investigative material obtained by the FBI.
A report will be issued at some point mostly likely by the Justice Department which oversees the FBI. The free press will have the opportunity to review, question, and conduct their own investigations.
ICE is a legally sanctioned agency that enforces Federal Law within the US legal system. Unlike many countries in Europe, the US justice system does not operate like the Inquisition. Defendants have full Constitutional Rights within the justice system. This includes undocumented residents.
Part of the tragedy is that these 2 women were laughing and having fun interfering with armed federal law enforcement agents. The agents who are employees, that do not make policy, were attempting to carry out their assignment. Obviously, they were not having fun.
The investigation will not matter to the local officials, or the local jury pool. This agent will be persecuted and prosecuted for a split second decision at a moment of high stress. Actually, I think all three gun shots occurred in less than a second.
How many can claim they have had the experienced of a car being driven directly at them at short range? How many with police training cam claim they would have responded differently? Many of you without police training will say that he should have just jumped out of the way. That is the way I see it as well, but I was not there.
Tim S
Can’t answer your questions but one I will ask you. Why would someone walk in front of a running vehicle when you do not know the person and you are confronting them. I have read this is totally against procedure and you cannot claim self defense if you put yourself in a dangerous position. If the ICE agent is not charged he should be removed from ICE as being incompetent to put himself in a dangerous position.
Good question, Norman, however it’s only hypothetical. All the forensic teams from investigative and news outlets published analysis that shows beyond doubt that Renee’s murderer wasn’t in the path of the vehicle.
Either our Ivy Leaguer is a tool or a fool, propagating a lie.
-It appeared that he had time to step back, well out of the path of the vehicle.
-He did not. Instead he used that time to unholster his gun and fire, THEN fired two more for good measure.
-Video from his POV showed her turning tbe steering wheel away from him.
-Policy forbids firing at vehicles just to stop a suspect fleeing a scene.
It never ceases to amaze me that the media and people in general want to engage in propaganda based on their internal biases. Very few are interested in being objective and viewing the whole story in context. Those of us who are exposed to different sources of media can clearly see that the media offer 2 very different versions of the event. One side shows “clear evidence” of a murder, while the other claims “inherent immunity”. Worse yet, are the responses to my comment here that are completely detached from what I wrote.
Let’s try that again:
“This agent will be persecuted and prosecuted for a split second decision at a moment of high stress. Actually, I think all three gun shots occurred in less than a second.”
“Many of you without police training will say that he should have just jumped out of the way. That is the way I see it as well, but I was not there [and I do not have police training].”
For those who honestly do not know, law enforcement are constantly at the firing range being trained and tested. My understanding is that they must demonstrate the ability to place 3 rounds on target in rapid succession. If they fail, they lose their job. They are not trained to wait to see what happened to the first round, take a break, and then think about it. They shoot fast and they shoot to kill, or not at all.
This the video that shows the events leading up to the shooting, and why an agent would walk in front of the car as she is backing up.
https://x.com/GrageDustin/status/2010037103665787019
Nobody in their right mind should click on an X link:
“We’ve analysed this video of the shooting of Renee Nicole Good yesterday in Minneapolis frame-by-frame to highlight the positioning of the gun and phone in the ICE agent’s hands.”
https://bsky.app/profile/bellingcat.com/post/3mbwmvgypqc2x
At least if “in their right mind” doesn’t designate reactionary cranks.
“Have you not learned from the past few days?” — ICE jackboot to an unarmed woman.
“It never ceases to amaze me that the media and people in general want to engage in propaganda based on their internal biases. Very few are interested in being objective and viewing the whole story in context.”
The problem is how the government is continuing to gaslight the public based on their deeply partisan biases.
DHS Head Kristi Noem just went on CNN interviewed by Jake Tapper, and doubled down on her initial pre-judgement that the woman was intentially trying to kill the agent. And thus he acted corrrectly and in self-defense.
Again and again, she asserted that videos supported her pre-judgement and denied that there was any ambiguity. Jake Tapper tried repeatedly to ask her why she doesnt wait for the investigation to be done, and eached time she failed to answer, and repeated here claims, and blamed the left and the media.
Asked why only the FBI would investigate, rather than jointly with State investigators, she falsely claimed this was normal.
The problem is that the Bondi Justice Dept and FBI under Patel have become intruments of partisan goals.
Thus there is every reason to expect that the investigation will be yet another partisan exercise with a predetermined outcome.
Here is that revealing interview.
https://www.cnn.com/2026/01/11/politics/video/kristi-noem-renee-good-killing-interview-digvid
Bindy, as you are the one who loves socialism tell us which colour shirt you would have worn during the 1930. I bet it would have been brown.
You might like:
Though neighbors told the Daily Mail that [Renee Good’s murderer] is a hardcore MAGA supporter, social media posts reveal he also has foreign-born in-laws.
His 38-year-old wife, whose doctor parents live in the Philippines, married him in August 2012 according to posts on her Instagram page.
Her first picture with Ross on the social media account was posted two months earlier.
In July 2013, when the couple lived around El Paso, Texas, Ross’s wife posted a picture posing next to a US Border Patrol helicopter.
She also shared photos of baking recipes from a Spanish-language cookbook.
One neighbor at Ross’s 10-house cul-de-sac told the Daily Mail that until recently Ross had been flying pro-Dozing-Donald flags and a ‘Don’t Tread On Me’ Gadsden Flag, an emblem of the Make America Great Again movement.
On Thursday afternoon there was no sign of Ross, his wife, or the flags.
‘I think he’s in the military. He has a military license plate,’ one neighbor said. ‘He had a don’t tread on me flag, and Dozing-Donald/Vance stickers up during the election.
‘The wife is polite, very nice, very outgoing, while he’s very reserved. They have a couple of kids.’
https://www.dailymail.co.uk/news/article-15447739/ICE-shooter-Filipina-wife-father-Minneapolis.html
The govt, particularly Vance and ICE-Barbie, have been absurdly gaslighting the public over this.
Pre-juding the investigation. Slandering the victim:
Apparently this was ‘an act of domestic terrorism’.
Apparently she was “a deranged leftist’ and “part of a larger, sinister left-wing movement”
And apparently she most definitely “weaponized her vehicle” to “ram” an agent.
Apparently agent was previously dragged and injured by a vehicle, and thus his instantaneous shooting of the driver in this instance was deemed a reasonable action…
Oh, and the agent has “absolute immunity”.
It didn’t take long for the cult kids to take over this latest UAH results post. As usual, they grab any news story they believe will make Trump look bad. They suffer from extreme TDS.
They never understand this issues — see their nonsense about tariffs from months ago. They were sure Trump was going to ruin the US economy. But, he’s corrected most of the trade imbalances other US Presidents let happen. The kids likely had never heard the word “tariff”!
As to this latest issue, the kids obviously have no clue about the concept of “officer safety”. “Officer safety” is a legal group of policies and procedures that allow law enforcement officers more protection in dealing with the public. In simple terms, a citizen must obey any legal order from a LEO. If the citizen feels he is being treated unfairly, he can go to court. He can NOT fight a LEO on the street. Typically, battery on a LEO is a felony. And in this particular situation, a moving vehicle is considered a “deadly weapon”.
Don’t expect the cult kids to understand any of this….
Hey Puffman, riddle me this:
Suppose you’re terrified by a very dangerous queer poet.
Before you decide to murder her, do you:
(a) drop your phone and start to panic or
(b) film the whole thing to lulz with your MAGA buddies while they flount another constitutional right by trying to steal state money?
“Housing shortage – otters to blame” — Letter sticker, German Reich, 1938.
Willard: This is what happened:
1. The wife have parked the car in the middle of the street obstructing the flow of traffic.
2. The wife sits in her SUV, while her wife is outside the vehicle holding her cellphone up to agent’s face.
3. The wife says: “You wanna come at us? You wanna come at us? I say go get yourself some lunch, big boy.”
4. The wife tries to get in the car but the passenger side door is locked.
5. The wife is asked to come out of the car.
6. The wife then weaponized her vehicle and put the pedal to the metal hitting the agent.
7. The wife is shot 3 times in the head by the agent in rapid
succession.
Reading: “Dead Poets Society” by N.H. Kleinbaum (ISBN 9781401308773)
There is ample video of this incident. The driver said she wasn’t angry at the agents. Seemed mild enough. She waved a car to go through in front of her. Agents jumped out of another car just after, told her to get the f**k out of the car, she backed up to make room to drive away, agents approached the car, she turned right while an agent was near her left front fender. He wasn’t run over, and she wasn’t trying to hit him, just get away. He was possibly grazed by the front corner of the car as it began to accelerate, remained on his feet and shot her three times. Now she is dead.
There are numerous angles from numerous phones taking footage. Looks like murder, not self defence. Agents also prevented a physician from attending the woman, claiming they had their own present. She was not attended by medicos for 6 minutes. The officer who shot her strolled away from the car in no hurry and after walking 20 feet or so, motioned for someone to call an ambulance. No one rushed to the car after she’d been shot. The agents didn’t seem much to care about what had happened.
When a LEO is pointing a rifle at you yet you still threaten, that’s called “suicide by cop”.
At least she wasn’t able to hurt anyone before she departed.
And now an ICE has removed the personal computer of Renee Good’s murderer from his home.
“I’ll dedicate my next arrest to you” — the same agent, after dangerously boxing in an ICE watch volunteer with his truck, on Dec 8.
Sure officers orders need to be followed. They dont get to dole out instant capital punishment for that.
Thankfully, they do not have ‘abssolute immunity’ as Vance claimed
Suicide is a leading cause of death in cults. Unfortunately, they often kill others in the process, as with suicide bombers and the 9/11 suicide murderers.
Hey Puffman, riddle me this –
WSJ investigation: In the past 6 months ICE agents have fired at vehicles 13 times, leading to:
* 8 people shot
* 5 of which were U.S. citizens
* 2 died
* no victims drew a weapon
The playbook: Agents box in a vehicle, block attempts to flee, then fire
https://www.wsj.com/us-news/videos-show-how-ice-vehicle-stops-can-escalate-to-shootings-caf17601
Trump admin says: don’t believe your eyes and ears, believe only what we tell you.
And some here will oblige.
“When a LEO is pointing a rifle at you yet you still threaten”
Trying to leave is the opposite of threatening.
US conservatives – mainly, MAGA – drink weapons-grade Kool-Aid these days,
As I stated, “Don’t expect the cult kids to understand any of this….”
Hey Puffman, riddle me this –
Why are federal agents gunning down Americans in the streets?
https://www.noahpinion.blog/cp/184220785
If you can’t convince Great Replacement theoreticians, tough luck.
“In short, our federal government can usually kill, kidnap, abuse, and lie about us with impunity.” — Ken White
Willard, please stop trolling.
“David” wrote: “Arkady, I am also curious about these graphs, can you accompany them with some sort of analysis and what conclusions that can be made?”
The figure (https://ibb.co/chfy3mmq) is reproduced from Petty’s 2006 book titled A First Course in Atmospheric Radiation. Pages 225-226.
The graphs show Earth’s outgoing thermal radiation emission spectra measured by NASA’s Nimbus-4 satellite in 1970. The global-scale molecular spectroscopy measurements were taken with the Infrared Interferometer Spectrometer (IRIS).
These figures support a qualitative and semi-quantitative analysis of outgoing infrared spectral radiance. A fully quantitative energy-budget analysis requires the underlying numerical spectra, since the physically relevant quantity, outgoing flux, is obtained by integrating radiance over wavelength and solid angle. Values inferred directly from plotted curves can illustrate scale and structure but are not suitable for precise flux calculations.
The dips at specific wavelengths match known molecular a b s o r p t i o n bands (CO2, water vapor, ozone) and show that Earth’s heat escapes to space in a spectrally selective way governed by atmospheric composition. This observation directly underpins radiative-transfer physics and the greenhouse effect. The fact that despite different surface temperatures and climates, the same molecular a b s o r p t i o n features appear everywhere, demonstrates that the controlling physics is atmospheric composition rather than local surface conditions.
The scientific conclusion is straightforward: The measurements show that outgoing infrared radiance is strongly wavelength-dependent because of molecular a b s o r p t i o n, which determines how much thermal energy ultimately escapes to space.
Wrong again, Ark. Those are NOT “Earth’s outgoing thermal radiation emission spectra”. You keep avoiding reality:
https://www.drroyspencer.com/2025/12/uah-v6-1-global-temperature-update-for-november-2025-0-43-deg-c/#comment-1726504
And if you actually believe they “underpin” the bogus GHE, you need to show how that happens. Believes ain’t science….
https://www.drroyspencer.com/2025/12/uah-v6-1-global-temperature-update-for-november-2025-0-43-deg-c/#comment-1727695
You are incorrect.
Ark is usually incorrect, child Nate. But I suspect you don’t even understand the discussion, as usual.
That be you.
It is spectral radiance, which shows how the emitted flux varies with wavelength. This is exactly what we need to see that GHG like CO2 remove large amounts of outgoing flux in their respective abs,orption wavelength bands.
Arkady, thank you for that explantaion of those charts and their significance.
But I don’t agree with that the scientific conclusion is straightforward.
As you also point out, there needs to be done a proper integration and flux calculation in order to know “how much thermal energy ultimately escapes to space”. These charts do not show CO2s impact on the total energy flow and subsequently surface temperature.
David,
Arkady’s claim was “The measurements show that outgoing infrared radiance is strongly wavelength-dependent because of molecular absorption”. Clearly it is wavelength-dependent because the curves do not follow one of the fixed temperature lines that would be expected from a black body radiator. Also, we can see that, for example, the dip around 15 um is consistent with what we’d expect from the known spectral properties of greenhouse gases, mostly H20 and CO2 in that band. Thus the induction “because of molecular absorption” is supported.
You’ve changed the claim to “CO2’s impact on the total energy flow” which is obviously something we’re interested in, but wasn’t what was originally claimed.
That is, he’s provided qualitative support for the mechanism of climate change due to greenhouse gases, but not a quantification of that.
“David” at 3:56 AM.
First and foremost, these figures were originally posted to address the specific claim raised here.
Your subsequent questions broaden the scope to interpretation of the full spectra, which necessarily requires additional context and explanation. I welcome that opportunity since these data originate from the pioneering Nimbus-era measurements that underpin modern understanding of atmospheric radiative transfer.
That said, I’ll address your exceptions to my replies.
“But I don’t agree with that the scientific conclusion is straightforward. ”
Whether you agree that the scientific conclusion is straightforward or not, depends on your level of familiarity with the principles of molecular spectroscopy as applied to atmospheric infrared emission. There is voluminous accumulated knowledge of the laboratory measured molecular spectra of CO2 but, Nimbus was the first global-scale experiment.
The Nimbus program launched 7 meteorological satellites from 1964 to 1978. I re-posted the charts recorded by the 4th Nimbus mission.
“As you also point out, there needs to be done a proper integration and flux calculation in order to know “how much thermal energy ultimately escapes to space”.”
Here’s how you can get the specific Nimbus data from NASA:
Presently, we have the CERES data for the quantitative determination of how much thermal energy ultimately escapes to space. Also available to all interested researchers here: https://ceres.larc.nasa.gov/
“These charts do not show CO2s impact on the total energy flow and subsequently surface temperature.”
These charts provide direct observational evidence of the mechanism by which CO2 influences surface temperature, albeit qualitatively as I said. The explanation is as follows:
1/ CO2’s impact is conspicuous around the 15μm band where the outgoing radiance is substantially lower than surface-controlled emission in the ~8-12μm atmospheric window.
2/ Because the quantity governing Earth’s energy balance is the outgoing infrared flux, which is obtained by integrating radiance over wavelength and solid angle, the suppressed radiance in the CO2 band represents a reduction in the total infrared energy escaping to space relative to a hypothetical atmosphere without CO2.
3/ To restore radiative equilibrium, this reduced outgoing infrared flux must be compensated elsewhere, which in practice requires an increase in surface and lower-atmosphere temperature, raising radiance in more transparent spectral regions, particularly the atmospheric window.
In short, these observed spectra show that CO2 selectively restricts infrared energy loss to space, and basic radiative balance therefore requires a warmer surface to compensate.
This is all very basic really.
Arkady, yes it is obvious that CO2 does something to impact radiance in that wavelength band, but that it “requires a warmer surface to compensate” is not basic or clear at all. Could you show how it impacts surface temperature and by how much?
Mark B, we would expect completely different properties from H2O vs. CO2 where H20 is able to condensate and which gives reflective properties. Therefore the “molecular absorption” cannot account for 100% of the observed effect, and again it is an effect on radiance,
“David” at 3:42 AM.
Yes, see Petty’s 2006 book titled A First Course in Atmospheric Radiation, chapters 1-9.
I could point you to many other sources but Petty is the best I have found.
If you prefer to get your education from blogs, you can search Dr Spencer’s blog where he has addressed the gaps in your knowledge many times over the years.
Thank you for your attention to this matter. Do svidaniya.
Arkady, thank you for the tip on the literature.
You are correct that I have knowledge gaps in this area. I am however familiar with statistical modeling and I am sure that the modelers of climate models are using the data which is the source to the chart you provided, and are also aware of the mechanisms of atmospheric radiation described in the book. But they still fail to produce surface temp predicting models that perform well over time, so there is reason to believe that theory and reality are not aligning well. At least those mechanisms that they try represent with their models.
And now you left the discussion, so the question remains. Nice chart though.
Do svidaniya.
“yes it is obvious that CO2 does something to impact radiance in that wavelength band, but that it “requires a warmer surface to compensate” is not basic or clear at all.”
The “something” it does is attenuate the energy flow out of the system in specific spectral bands.
If greenhouse gases attenuate the energy flowing out of a system relative to the system absent the greenhouse gas, the energy in the system must be higher to reach the equivalent level of energy leaving the system.
Qualitatively, understanding the greenhouse effect is pretty basic. Quantifying the effect is much more difficult.
Mark B,
There is obviously a lot of processes going on in the atmosphere that affect the energy flowing through it, but the critical question is by how much.
If I put my hand outside the window while I am driving my car, the friction against the bypassing air is going to increase and the car will slow down. And if I only put my hand out while going uphill, it is going to seem as I can slow down the car significantly by just putting my hand out. I can produce a graph that shows what the hand does with the airflow around the car in that spot, and it is going to be significant changes there.
“. . . but the critical question is by how much.”
Of course it is, but that’s not the question you asked.
The consensus estimate for equilibrium climate sensitivity per the most recent IPCC report is 2.5-4 C with a most likely value around 3 C per doubling of CO2.
This is largely based on the Sherwood etal evaluation of estimates based on paleoclimate data, empirical estimates, and modeling:
https://agupubs.onlinelibrary.wiley.com/doi/10.1029/2019RG000678
And more recent progress discussed here:
https://acp.copernicus.org/articles/24/2679/2024/
Mark B,
Are you referring to transient climate response or the effective climate sensitivity?
Has it occurred to any of you Americans that it is a bad idea to have a police force which is allowed to kill civilians at will?
Did you watch the video where the same guy was involved in a similar Minnesota case last summer, where he was dragged by a weaponized car and hospitalized. He should have killed that driver also.
It¨s a dangerous job to be an ICE agent these days and serve your country. It is a bad idea to allow civilians protest violently and use their cars as weapons against law enforcement officers.
Sounds great, Max, until its YOUR sister, mother, or wife in the line of fire of such an individual who is locked and loaded and has a hair trigger, due to his PTSD from a previous incident.
Nate: Me and my family believe in democracy and not in rioting. In US it’s much more likely to be shot by gangsters and drug dealers.
I think the whole episode was planned by those two lesbians. They left their kid to daycare and came to harass ICE agents. The femme blocked the traffic with her car and sat there innocently, while the butch harassed the agent. But it didn’t go as planned, did it?
It’s not about race or skin color. Also white people are deported if they are illegally in the US. One white woman came to the US from Scandinavia for a short holiday 20 years ago, but she never left and her visa expired. She lived in a luxury home somewhere in California. When she harassed her neighbor, her papers were checked and she was deported immediately by ICE. MAWA people (Make America Weak Again) hate Donald Trump and democracy.
Max has very strong words against Jan 6 rioters:
“They have tried to erase what I did” with the pardons and other attempts to play down the violent attack, Gonell said. “I lost my career, my health, and I’ve been trying to get my life back.”
https://apnews.com/article/capitol-riot-police-trump-jan-6-congress-34fb3cfeeb21a746c53760bb0f1df37d
But but but but two lesbians!
“There was some bully pulpit intimidation going on” – Thomas Massie
Max.
You clearly have no empathy for ‘others’. Only when bad stuff happens to you and yours will you begin to get it…maybe.
Many people are outraged by the over-reach of the Feds into their communities, as well as their harsh tactics.
At worst she should have been arrested for civil disobedience. You know, like the kind when the black woman rode in the ‘white only’ section of the bus, etc.
In any case, she was finally complying by removing her car when she was shot.
This was so unnecessary.
If the guy can’t deal humanely with people in situations like this, and just goes instantly for his for gun, for whatever reason, he should not be doing that job.
The facts get clouded by spin from both sides, so let’s break it down. The 2 women where intentionally trying to interfere with law enforcement. That is clear. The car was backing up when the agent walked in front. At this point, he is effectively walking behind a moving car in reverse. She was obviously fleeing arrest with the guy reaching inside to open the door. She was probably distracted by the guy reaching inside, and did not know the other guy was in front. If she did, that is clearly an assault and his ability to jump to the side does not erase that. Otherwise, it was a dumb mistake. The whole thing lasted for about 2 to 3 seconds. The action to draw and fire three rounds in rapid succession seems like a reflex action. That is how they are trained to react to a threat. There was no time for a decision sequence. It was a reaction. In retrospect, he should not have moved in front, and should have been ready to step aside. They had her face on camera and the car license plate. She would have been arrested very soon. The shooting was a mistake in any case, but there is a big question about criminal intent with both the agent and the women.
Reasonable assessment, except omitting that from his POV, on his camera video, it is clear she is turning her wheel away from him as she begins to drive forward, and not at high speed.
“That is how they are trained to react to a threat.”
If so, then that policy obviously needs to be revised. It won’t be.
More facts:
https://www.cnn.com/2026/01/09/us/video/ice-agents-cellphone-footage-raises-new-questions-invs
“[ICE thugs] break-checked other motorists in an attempt to force accidents that agents could then use as justification for deploying force” — Judge Ellis, in the Chicago ICE thugs case
“Did you watch the video where the same guy was involved in a similar Minnesota case last summer, where he was dragged by a weaponized car and hospitalized.”
He fired shots into the passenger side window, after he was clear of the car, as well as his first sot into the windscreen.
Perhaps his experience earlier experience traumatised him and he reacted with lethal force as a result.
Whatever the case, there was absolutely no reason to keep shooting into the passenger window. There was no need to kill the woman driving a very slow moving car at the time she was shot.
The officers with the guy who shot her drove him and their vehicles away from the scene a minute or two afterwards, instead of keeping the cars stationed to maintain the crime scene for investigation, and keeping themselves present to give on scene accounts of what happened. They also prevented a physician from tending to the woman who was shot.
These actions were not those of professional law enforcement officers. The federal government murdered a US citizen on the street in full view of many people. It was filmed from many angles, so there’s no excuse not to see what is plain.
barry, please stop trolling.
Bill Hunter, Anon for a reason.
I did a quick back of the envelope calculation.
To raise the average temperature of the Eargh by 1.4 C by adjusting its orbit would require an extra 27W/m^2 of solar insolation.
That would require Eargh’s orbital radius to decrease by 1 million miles which would make the year 360 days instead of 365.
Surely we would have noticed.
EM, I don’t know whose theory you think you are disproving but its not mine.
Let me explain a couple of things.
1) As you should know we have an elliptical orbit. Perihelion is the point in the ellipse where earth is closest to the sun and aphelion is the point in the ellipse where earth is furthest from the sun.
The earth accelerates and goes faster when traveling from aphelion to perihelion and travels slower when traveling from perihelion to aphelion. The net difference for the entire orbit wrt to mean distance from the sun is nil.
Now Jupiter will always exert an influence on two sides of the orbit at points virtually opposite one another. Thus since the earth is traveling in opposite directions at these points there will be no change in the orbit time because on one side of the orbit Jupiter is speeding up earth and when earth travels to the other side Jupiter is slowing earth down. Again no overall annual effect, no shorter of a year but yes the ellipticity of the orbit changes and the time closest to the sun changes over the course of a year via the speed effects.
2) Work with something I have been able to work with. The entire industrial age surface temperature record has many problems with coverage. Only in the satellite era has coverage included the entire globe. So I have been working with the last 45 years since 1980 where it has warmed about .7C. Also there is feedback all the forcing does not need to come from the orbit. There are scientists out there, the most alarmist, saying feedbacks can be up to 12:1. Near as I can tell feedback started out as a plug figure. Today its estimated as a factor on assumed forcing from CO2 by many or extrapolated from assumptions about short term changes in a changing world.
“but yes the ellipticity of the orbit changes and the time closest to the sun changes over the course of a year via the speed effects.”
How much? It is not enough to say that the orbit changes.
You have yet to show us a calculation by you or anyone else calculating how MUCH it changes.
And the available data on ellipticity (E-S distance at aphelion and perihelion) show negligible changes in the last century.
Nate, I already went over that with you months ago. 5 more days in the warmest half of the orbit. And your reply was that was caused by the moon, which of course would not change the fact that there was 5 more days in the warmest half of the orbit.
This shifts over lengthy periods of time. I just looked at the change over 43 years.
“And your reply was that was caused by the moon, which of course would not change the fact that there was 5 more days in the warmest half of the orbit.”
You just don’t get it.
As I explained several times, and NASA, who provided the data, clearly explained, the Moon’s effect is an ARTIFACT, which causes an error in the measurement of the orbital parameters.
The Moon and Earth circle around their barycenter. This causes a 29 day, wiggle of 9400 km, around the barycenter as it smoothly orbits the sun.
There are not actually 5 days added to the orbit of the Moon-Earth barycenter around the sun.
1)The 9400 km wiggle is insignificant compared to the 150 million km (1.5e8 km) distance from the Sun.
2) the % change in insolation due to this would be 100%*(9400/1.5e8)^2 = 4×10^-7 %. Negligible.
3)It is averaged out every 29 days.
4)This has nothing to do with Jupiter.
Nate says:
As I explained several times, and NASA, who provided the data, clearly explained, the Moon’s effect is an ARTIFACT, which causes an error in the measurement of the orbital parameters.
The Moon and Earth circle around their barycenter. This causes a 29 day, wiggle of 9400 km, around the barycenter as it smoothly orbits the sun.
There are not actually 5 days added to the orbit of the Moon-Earth barycenter around the sun.
———
As I explained to EM there is not 5 days added to the orbit. Its a difference in speed the earth travels at through portions of the orbut up to 1/2 the orbit. Now you are rambling about something completely different that may in fact be caused by the moon. But you stuck your foot in the quicksand when you claimed no 5 day differences. You are wrong you can see the 5 day difference using US Naval Observatory data as a change in the differences between half orbits via the date crossing perihelion and aphelion and the speed difference from aphelion to perihelion being 5 days slower than from perihelion to aphelion.
The official observer data verifies this 5 day difference between 1980/81 and 2023/24.
The data from NASA that we discussed was about changes in time of aphelion and perihelion due to the Moons orbit. Do you not remember?
“you are wrong you can see the 5 day difference using US Naval Observatory data as a change in the differences between half orbits via the date crossing perihelion and aphelion and the speed difference from aphelion to perihelion being 5 days slower than from perihelion”
Indeed the data we discussed was from the Naval Observatory, not NASA, and THEY explained that changes were caused by the Moon.
https://aa.usno.navy.mil/faq/apsides
“Why do times of Earth at perihelion and aphelion vary in date more than other phenomena such as the start of the seasons?
It is actually due to the presence of the Moon.”
Not Jupiter.
Nate says:
”The data from NASA that we discussed was about changes in time of aphelion and perihelion due to the Moons orbit. Do you not remember?”
LOL! How does that comport the fact that the data says there was a ~5 day difference and you said: There are not actually 5 days added to the orbit . . . (because) 1)The 9400 km wiggle (by the moon) is insignificant.
The earth travels 12,870,000 million km in 5 days! [s]that’s just a little bit different than a 9,400 km wiggle.[/s]
Your argument here makes no sense at all.
The USNO, and all the available facts, tell us this effect
-is caused by the Moon.
-is not caused by Jupiter
-has negligible effect on insolation reaching Earth.
Undoubtedly you will keep doubling down on your unsupported claim anyway.
“The earth travels 12,870,000 million km in 5 days! [s]that’s just a little bit different than a 9,400 km wiggle.”
Sure but in what direction at the aphelion?
Hint: not toward or away from the sun. The movement toward or away from the sun, at aphelion, is much much smaller.
Thus the 9400 km wiggle is significant enough to change the date of Earth actually reaching its farthest distance from the sun.
This will likely again be beyond your comprehension.
Nate says:
”The earth travels 12,870,000 million km in 5 days! [s]that’s just a little bit different than a 9,400 km wiggle.”
Sure but in what direction at the aphelion?
Hint: not toward or away from the sun. The movement toward or away from the sun, at aphelion, is much much smaller.
Thus the 9400 km wiggle is significant enough to change the date of Earth actually reaching its farthest distance from the sun.
——————
gotcha! You believe the earth and moon traveling at 536,250km/hr does 436 loop d loops with a diameter of 9400km due to 13 orbits of the moon in order to change its arrival dates at the ends of the major axis.
You need to post your sources Nate. That makes no sense at all.
See next posts for facts related to the discovery of Neptune via observations of orbit displacement by Neptune on Uranus’ orbit.
The facts are this Nate.
Distance at Noted Configuration (1800/1850): In configurations where the Sun-Uranus-Neptune angle was 90° (a point where Neptune’s tug is directed tangentially to Uranus’s orbit and produces a high displacement visible from Earth), the two planets were separated by a distance of 25.4 AU.
(as I said the max displacement occurs when the planet pull is tangent to the earth’s orbit and where the solar gravity effect on the displacement is nil a line through the earth and sun is 90degrees to that tangent line.
This stuff has been known now for 190 years.
Jupiter has 18.5 times the mass of Neptune
Jupiter would be 5.77 times closer to earth at maximum displacement than Neptune was to Uranus
In 1835: A deviation of 30 arcseconds was recorded between the calculated and observed orbit of Uranus. This and other observations noted about these displacements over a period of years provided information leading to the discovery of Neptune.
30 arcseconds displacement indicated a deviation of about 400,000km
Now you are trying to tell me Neptune moved Uranus 400,000km and Jupiter which is almost 6 times closer to earth with 18.5 times the mass can’t move earth 9400km which only the moon can do.
You are some piece of work Nate.
“gotcha! You believe the earth and moon traveling at 536,250km/hr does 436 loop d loops with a diameter of 9400km due to 13 orbits of the moon in order to change its arrival dates at the ends of the major axis.”
Gobbledegook, with no rebuttal of what I explained above.
As expected, you could not comprehend the simple geometry of the Earth’s path at aphelion, nor the explanation given by me and the US Naval Observatory.
Sorry, it is implausible that you know better about the USNO data than the USNO.
This effect has nothing to do with Jupiter, Sorry.
To keep claiming it does, without showing evidence or calculation, and ignoring the available evidence and calculations, is pure Astrology.
“Now you are trying to tell me Neptune moved Uranus 400,000km and Jupiter which is almost 6 times closer to earth with 18.5 times the mass can’t move earth 9400km which only the moon can do.”
Still no calculation or data for Earth from you. Where are they?
The available data for Earth-sun distance do not agree your speculations.
Nate wrongly claims:
“Now you are trying to tell me Neptune moved Uranus 400,000km and Jupiter which is almost 6 times closer to earth with 18.5 times the mass can’t move earth 9400km which only the moon can do.”
Still no calculation or data for Earth from you. Where are they?
—————–
Its not my calculations or observations Nate. I wasn’t alive in 1835. And you still have not produced your calculations or supporting observations.
As I said I am not surprised that the moon in 14 days can move the earth 9400km out of its standard solar orbit path. But you are lacking calculations or any source of your claim that USNO has established that the jovian planets don’t do the same on a larger scale. . . .because it would be stupid for them to do that in light that science accepted that it happened 190 years ago.
Here are more details on that discovery in the first half of the 19th century:
”The deviation of Uranus’s orbit was a crucial observation that led to the discovery of the planet Neptune. The observed 30 arcsecond deviation in 1835 (which grew to about 70 arcseconds by 1840) was a key piece of evidence, as the actual position of Uranus was drifting from its predicted path based on Newtonian mechanics.
Hypothesis: Astronomers John Couch Adams and Urbain Le Verrier independently hypothesized that the gravitational pull of an unknown, more distant planet was causing these irregularities.
Prediction: They used mathematics to calculate the potential position and mass of this unseen body.
Discovery: Working from Le Verrier’s calculations, astronomer Johann Gottfried Galle and his assistant Heinrich Louis d’Arrest discovered Neptune in September 1846, very close to the predicted location.
The existence of Neptune was thus predicted using mathematics before it was visually observed through a telescope.”
You can keep trying to deny this but its notable what a hypocrite you are demanding evidence when I am giving it to you and you not producing a shred of evidence to make the claim the jovian planets have a negligible effect. Your anonymous claimed to be USNO source has no name, we don’t know if he was the director or the janitor, you have produced no calculations, no names, no papers, nor even a specific claim limiting the mean annual global insolation of jovian planet effects I have physically described consistent with Newtonian physics and scientific excerpts.
Put up or shut up.
This discussion was about your claim that the changes in the dates of aphelion or perihelion of up to 5 days in USNO data had something to with Jupiter.
I’ve made it clear, and the USNO made it clear that this is caused by the Moon.
Therefore there is no need to bring Jupiter or Neptune into it at all!
And you still have not provided data or calculation to show that Jupiter has caused these 5 day changes to Earth’s aphelion or perihelion.
All we get is handwaving.
Now we can expect more.
Where is it made clear Nate and by whom and what did they base their opinion on? You continue to refuse to disclose your sources.
There is no way mathematically lunar motions could slow earth’s speed such that there was a 5 day delay in the earth reaching perihelion by five days. If you disagree stop stomping your foot like a 3 year old and show the math of how that could happen.
Worse for your argument here Nate is that even if the moon could slow the speed of earth through perihelion that much and then in the second half of the orbit speed it through aphelion, then reducing the cooling period by 5 days in a wash, rinse, and repeat pattern for multiple earth orbits it would result in the exact same additional insolation I have been discussing and all you are arguing about is which object does it.
And that of course makes your entire argument irrelevant to whether orbit perturbations affect climate change.
So if you are intent on finding the culprit versus acknowledging the climate change effect. . .provide a mathematically based argument specifically identifying the culprit.
I really don’t know what the contributions of each object is. I just know the total result for one set of object motions in total in one specific period of time because the data has been recorded as occurring from multiple sources. I then looked at similar planet configurations and see they correspond to the number of planets involved, the sizes and proximity of those planets, and the climate response over the entire course of the instrument record and matching that to the 10 most significant climate events since 1850 and find a consistent match.
Posted in wrong thread
https://www.drroyspencer.com/2026/01/uah-v6-1-global-temperature-update-for-december-2025-0-30-deg-c/#comment-1729043
Nate you have managed to not comprehend a single point I have made.
I am talking about orbital perturbation by the jovian planets which is part of Milankovic’s 100,000 cycle that changes the intensity of sunlight allegedly by 23% from perihelion to aphelion at its maximum. Currently the difference is only 7%.
Several problems with your response:
1) Your solar distance calculator is a standard calculator based upon an estimate of the current ellipticity of the orbit. That means it doesn’t change the length of the orbital axis over time.
the calculator will only accept 4 digits but it shows zero change in the distance to the sun in the year 9999. What you want is a sophisticated calculator that mirrors the Milankovic theory but apparently NOBODY is working on one.
2) You provided a calculation on how the distance changed over 5 days before, at, and after aphelion. That isn’t caused by the moon or the planets Nate. Thats just the change that occurs in the ”standard” elliptical orbit. You are completely lost here.
3) The change I am talking about isn’t even distance to the sun, though, I have acknowledged that if the speed of earth changes the distance to the sun will also change. EM understands that, apparently you don’t. What I have been discussing is that if the earth moves more slowly through perihelion and faster through aphelion that will cause the earth to gain more intense sunlight for 5 days leaving less time of exposure to less intense sunlight.
4) According to Hays etal, 1977, the change in ellipticity of the orbit is due to planetary influences and that this is not a linear change that has been suggested by warmist propagandists. That suggests that the difference in sunlight could be in any given year depending upon the placement of the planets be anywhere between 1.2% and 23% while only statistically hitting the full range once every 100,000 years. To suggest that the change is linear is to ignore the science that believes it caused by planet perturbations which vary over time depending upon where all the vectors of gravity add up to, which is of course near its maximum when they are all pulling in the same direction.
5) One cannot use a calculator for this without a planetary perturbation model and even then it might be the case that significant unknown influencers could exist. There is a demand for this to be done and it is clearly shown by the longterm variations seen in climate in both the instrument records and it the ice core records.
“You provided a calculation on how the distance changed over 5 days before, at, and after aphelion. That isn’t caused by the moon or the planets Nate. Thats just the change that occurs in the ”standard” elliptical orbit. You are completely”
Again you are working very hard to not understand the geometry here.
You talked about the 12 million Km travelled by the Earth per day.
Im showing you that is not relevant. Of relevance is how much the distance to the SUN changes in 5 days. At Aphelion, the calculator clearly shows that distance changes by only ~ 9 km.
The Moon’s effect is to move the Earth toward or away from the sun by a comparable distance.
Thus the Moons effect is enough to change the date of reaching the farthest distance from the sun, which defines Aphelion.
And the USNO explained it correctly as caused by the Moon.
No need to bring Jupiter into it to explain the USNO data.
Again I am not disputing that over thousands of years there are Milankovitch cycles cause by the Jovian planets.
Which is an entirely different astronomical effect on a much longer time scale.
I have explained it now several times. That should be sufficient.
Nate says:
”Again you are working very hard to not understand the geometry here.
You talked about the 12 million Km travelled by the Earth per day.
Im showing you that is not relevant. Of relevance is how much the distance to the SUN changes in 5 days. At Aphelion, the calculator clearly shows that distance changes by only ~ 9 km.”
LOL! you are so totally indoctrinated you are shooting from the hip. The only reason I noted how that the earth moves over 12million km in x days(I thought I said 5 days but I am not going to go back and check) is to point out there is no way that a lunar wiggle of 9400km earth barycenter radius of 4700km motion can cause the earth to be 12million km behind schedule in crossing perihelion. 4700km yes, 12 millionkm no.
Here is a brief narrative in answer to a Google AI question about how Neptune was found to affect the orbit of Uranus.
https://tinyurl.com/56yeba2b
It goes on to talk briefly about the same effects being part of what was once considered to be a puzzle about the Jupiter and Saturn ”great inequality”. Here it is mentioned as an approximate 883 cycle where the two planets take turns being ahead and behind one another meaning one drifts further from the sun while the other drifts closer and that it switches once approximately every 443 years.
This is consistent with the likelihood of Jupiter and saturn combined in this dance influences earth’s orbit as well and the pattern seen in the Alley icecore where 10 temperature peaks occur in ~9000 years (uh. . .~8,830 years) provides a pretty robust correlation.
I don’t see the mention that the Uranus/Neptune orbital dance repeats itself once every ~3,600 years but that’s easy to verify with an ephemeris.
The source explicitly calls this dance the cause of orbital
https://co2coalition.org/facts/temperatures-have-changed-for-800000-years-it-wasnt-us/
Enjoy!
You are still missing the point, after it was explained in very simple terms several times, and now seem to have eyes and ears covered.
Gbye, Bill.
LOL!
This is an interesting read on the scientific basis of orbit perturbation.
In the first half of the 19th century scientists were able to mathematically plot the location of a disturbing planet from the effects that were occurring on the orbit of the disturbed planet to a significant degree.
These capabilities lay out the relatively easy task of building a solar system model that would provide the basic influences of the planets upon one another. Its going to suffer some inaccuracy because there are unknown influences from asteroids and comets and even possibly a large planet outside of the solar system that remains hypothesized because of disturbances not yet resolved for the outer planets.
The timing of climate events match to a tee almost all the major natural climate impacts in history with 1c to 3c climate events occurring over just a few centuries and less.
Of course we were sold on the idea that CO2 was going to accelerate us to far beyond anything natural. Al Gore’s film was used to deny the temperature changes actually seen in the temperature records. Models have never been able to show the 1940’s climate optimum, which is the largest warming event other than the current one in the industrial age. Meaning obviously a major climatic event in our recent history has never been explained. But its in perfect timing with solar system planet positions that are consistent over 10,000 years with the only major exception being the 8.2kyr event.
So this link here is a Google AI compilation that incorporates known orbit perturbation effects, a science that has been virtually totally ignored over the past 45 years. . .conveniently since the National Academy of Sciences during the Carter administration gave a mild endorsement filled with caveats to the CO2 disaster hypothesis.
Its worth a read and relatively short but it was too scary for Nate so he is outta this thread.
https://tinyurl.com/56yeba2b
“These capabilities lay out the relatively easy task of building a solar system model that would provide the basic influences of the planets upon one another.”
Its easy, so go ahead.
Enough talk, lets see some calculations.
Its relatively easy to calculate for say NASA who has access to the computing resources and the programming expertise.
The point is and always has been that this represents a large hole in the climate change narrative that even google ai can’t find an consistent answer for.
the question is how much additional sunlight results from orbit perturbations and temporary changes in ellipticity. This effect is believed to vary earth’s sunlight from 1.2% to 23% over time.
If you don’t start calculating the maximum acceleration and deceleration effects on earth by other bodies in the solar system such as noted in the link I provided you can’t say anything about anthropogenic climate change as you have left the obvious natural climate change science completely unfunded.
That means the government has had 3 sheets to the wind on this topic for 50 years. And the public gets to watch this incompetence from a front row seat.
Bill,
One can get the earth/sun range time series from here:
https://ssd.jpl.nasa.gov/horizons/app.html#/
No calculations necessary.
Also no apparent correlation with observed global warming.
thanks Mark, this will be helpful for tightening down some of my calculations based on ephemeris.
Its still the case there is that ~5 day difference in sunlight in additional time travel near the sun.
Unfortunately Horizon doesn’t appear to give velocity changes in the orbit so that will require some significant work to find optimal values from the app where you can only get one moment at a time.
But it does help by noting a difference in distance to the sun from one date to another such that you can look at year over year changes in solar distance. I need to find a good source of exactly what is in the database as they say they rely on both observations and models to fill in the gaps on observations. Hopefully the solar distance calculations are well observed but the troublesome issue for me is why isn’t that knowledge being wide spread since quite a few astrometeorologist skeptics over the years have made a big deal about this. Originally I dismissed them until I found the data connection which was only recently.
Entropic, where did you get 27w/m^2 raises the temperament 1.4C
Stefan-Boltzmann equation.
Entropic Man, please stop trolling.
To show these deluded MAGAmaniacs what unbelievable lies their Trump’ing boy idol is ready to tell:
” Asked about the F.B.I.’s refusal to share evidence with state officials in Minnesota after an ICE agent shot and killed a woman in Minneapolis, Trump veered into promoting his lie that the 2020 election was stolen from him to justify his hostility to the state.
“I won Minnesota three times, and I didn’t get credit for it,” Trump said.
That is false. Trump did not win Minnesota in 2016, 2020 or 2024. ”
2016
https://www.nytimes.com/elections/2016/results/president
2020
https://www.nytimes.com/interactive/2020/11/03/us/elections/results-president.html
2024
https://www.nytimes.com/interactive/2024/11/05/us/elections/results-president.html
*
No wonder that the Trump’ing boy’s administration is rewriting the brute force Jan 6 2021 riot as a ‘peaceful protest’.
The whole world is laughing loud at such an incredible lie.
Bindi, as usual, you don’t understand the issue.
Trump claims the 2020 election was invalid. There is now a lot of evidence to support that.
But, to call that a “lie”, you support it with the election results that are claimed to be fraud!
Maybe you will understand when you grow up….
“There is now a lot of evidence to support that.”
No, there is just slightly more of the conspiracy theory rubbish that dozens of courts presided over by Dem and repub appointed judges threw out several years ago.
Poor MAGA doesn’t see the mountains of trash that they used to believe was evidence and later shown to be trash. This might give them context to see the new trash for what it is.
No, 2020 stolen election is an article of faith endlessly waiting for proof.
Yep, he didn’t win from the counting of votes. The problem is Minnesota like several other states doesn’t require ID to vote. To register all you need is a utility bill. So you can vote but you may not be able to get on an airplane. That’s why they are so upset at Ice. . .they are losing a lot of votes.
5 months of a small La Nina and the temperature responds 5 months later???
In this case we could hope to see at least a little continuing drop in temps over the next 6 months?
Tropospheric global temps always respond several months after the ENSO changes in the equatorial Pacific.
tim s….”The facts get clouded by spin from both sides, so let’s break it down. The 2 women where intentionally trying to interfere with law enforcement. That is clear. The car was backing up when the agent walked in front. At this point, he is effectively walking behind a moving car in reverse. She was obviously fleeing arrest with the guy reaching inside to open the door. She was probably distracted by the guy reaching inside, and did not know the other guy was in front. If she did, that is clearly an assault and his ability to jump to the side does not erase that. Otherwise, it was a dumb mistake. The whole thing lasted for about 2 to 3 seconds. The action to draw and fire three rounds in rapid succession seems like a reflex action. That is how they are trained to react to a threat. There was no time for a decision sequence. It was a reaction”.
***
Tim your lack of logic is transferred to a far more serious situation.
Most murders are done in a moment of severe emotion. The ICE agent has no excuse for his inappropriate reaction.
The Minneapolis mayor put it appropriately…there have been only two murders by gun in the city last year and one of them was by an ICE agent.
1) ICE is not a law enforcement agency per se. Their job is essentially border patrol. Putting them in cities to harass US citizens puts them far outside the area for which they are trained.
They are trained only to intercept illegal aliens trying to enter the US. They have zero training in dealing with US citizens in US cities.
I watched them on TV throw an elderly white woman to the ground and beat her. They were masked, and how anyone in the US, or anywhere, can justify such brutality is unimaginable.
In other words, they had no business harassing this woman, even if he was impeding them, which is her right as a US citizen to protest their action and presence in her city. It may be regarded as civil disobedience but the context was not illegal aliens trying to sneak across the US border. This was a US citizen protesting ICE presence in her city and for that alone she was murdered.
The US was built on civil disobedience!!!
Border patrol is what ICE is trained for, not murdering an innocent woman in cold blood, shooting her in the back, nowhere near the border, as she tried to drive away.
2)re training. A former Homeland Security Agent was interviewed in Canada on CBC television. He was aghast at the actions of ICE, claiming vehemently that neither ICE nor any law enforcement are trained to handle that situation as they did. He emphasized that no law enforcement agent would allow himself/herself to be placed in the front or rear of manned vehicle.
He emphasized that ICE is being used inappropriately, if not illegally, to raid US cities. Such a usage puts them on unfamiliar grounds, both physically and legally.
Homeland Security leader Kristi Noem is now being considered for impeachment for her biased approach to this case.
3)Without waiting to hear the facts, the Trump admin tarred this innocent woman as a subversive, then claimed the agents were justified in murdering her. They have since taken steps to remove any other law enforcement agency from investigating, leaving it in the hands solely of the FBI.
I am waiting to see if the great US will step up and restore the constitution and law to their country. The cop who lead to the death of Floyd is now in jail and I think the same fate should face the ICE agent who murdered the girl.
Thank you for the compliment. I only read a few words, but it was enough. Everyone agrees that you have a perfect track record of being wrong about everything. Your only purpose here is to be wrong and get a reaction from people.
Please make a lengthy reply. It will fulfill your mission to waste time and nobody will read it.
I did not expect you to read my reply since your comprehension level is that of child raised on TV. I did expect you to understand that the lady in question was brutally murdered.
I have seen Republican after Republican fail to grasp that a woman with children is now dead for no apparent reason. Do you guys lack the ability to feel anything, to feel compassion, and to empathize with her and her family? You are regarding her as if she was a Ted Bundy or one of the hijackers who bombed the Trade Centres.
She was simply a defiant young woman who stood up to ICE in a non-violent manner and they murdered her for it. She represents the United States that Trump is trying to make great again but his vision does not include brave young people who exercise their duty to stand up to tyranny.
Gordon: At least HR companies that hire those professional protestors make good profit whenever there is a “No kings” day or crowd of people gather to harass ICE agents. Georg Soros and Reid Hoffman have deep pockets. During Trump’s first presidency Soros payed $15 per hour to protestors who damaged private property and looted shops.
On this issue Gordon Robertson is correct. There was no justificaton for her death. There is already a ruling out that you can’t stand in front of a car and use it as an ecuse for self-defense. There are other examples of ICE reckless behavior.
It’s interesting how the cult kids try to pervert reality, just as they do with science. Gordon claims she was a “lady”, some kind of ideal mother, with no intent to mess up anything.
Norman claims there was “no justification for her death”. So if someone points a gun at a cop, the cop can’t shoot because maybe the guy was just kidding!
For those fools like Norman who want to join with Gordon, here is the rest of the quote. Just like Nate and the rest of you propaganda merchants, I am sick of people taking things out of context and then claiming things I did not state, or in this case to directly contradict what did state. The only polite words I can use are that you people are the lowest form of humanity, if you even qualify.
Here is my direct statement that was edited by Gordon so he could make lies about me:
In retrospect, he should not have moved in front, and should have been ready to step aside. They had her face on camera and the car license plate. She would have been arrested very soon. The shooting was a mistake in any case, but there is a big question about criminal intent with both the agent and the women.
“there is a big question about criminal intent with both the agent and the women” is the slimiest thing you ever said, Ivy Leaguer.
And you specialize in it.
“Triggered much?” — Greg Bovino, in response to “you guys killed an American citizen.
Let’s review. My claim is that biased partisans are engaging in propaganda and drawing conclusions before the facts are known. Intelligent people ask questions because that is the most basic investigative technique. Dummies get drawn into false narratives the way sheep get herded by dogs.
The most important observation is that there is an inverse relationship between intelligence and early conclusions. For those who do not understand the concept of an inverse (Willard probably), it is the most dimwitted people who form the most strongly held early conclusions, and the most intelligent who wait for the facts to unfold.
Tim, I applaud that you’ve tried to be objective about this issue, and not simply knee-jerk accept the government’s gaslighting, as others like Clint and Max do.
Now you need to work on your condescension. Your notion that your views are the only valid ones presented here.
For example, Gordon made some unusually good points here.
“She was simply a defiant young woman who stood up to ICE in a non-violent manner ”
As did Norman. As did I. As did others.
“Norman claims there was “no justification for her death”. So if someone points a gun at a cop…”
Our resident arbiter of who is deluded invents a gun in the hands of the killed woman.
Gordon,
She wasn’t much of a mum was she. Believing that she could stalk federal agents, impeded them in the duty etc
Perhaps in that state they are so used to lived experience over facts might have contributed to death.
In the USA 60 people per day are killed, only 2 or 3 by the law.
There are more pressing issues than some fool dying.
Masks off for one resident goons.
Here’s the document:
https://www.dhs.gov/sites/default/files/publications/mgmt/law-enforcement/mgmt-dir_044-05-department-policy-on-the-use-of-force.pdf
They better read it properly, for there might be an exam.
“No: 30%” — the number of hardcore troglodytes who don’t think Good’s murderer should face criminal charges.
Willard: This could be a great movie starring two suicidal lesbians, like Thelma and Louise, living in a platonic relationship, because we don’t want film to be R-rated. In this film women are Good and ICE agent is a bad “big boy”.
Max: you definitely should not beg so many questions before acting like a jerk.
“One homeland, one people, one heritage. Remember who you are, American.” — Dozing Donald’s administration, never failing to say the quiet bit out loud:
https://www.pbs.org/newshour/show/trump-administration-posts-echo-rhetoric-linked-to-extremist-groups
Willard, please stop trolling.
Fed Chair Jerome Powell, on him being investigated by Justice Dept.
“The threat of criminal charges is a consequence of the Federal Reserve setting interest rates based on our best assessment of what will serve the public, rather than following the preferences of the president,” Mr. Powell added. “This is about whether the Fed will be able to continue to set interest rates based on evidence and economic conditions — or whether instead monetary policy will be directed by political pressure or intimidation.”
Trump said “I don’t know anything about it, but he’s certainly not very good at the Fed, and he’s not very good at building buildings”
Must be just a ‘coincidence’ that he wants Powell to be gone!
Our in-house asset manager might appreciate the following graphic that recalls what happened with inflation in Turkey when their own dictator tried to cook the books:
https://bsky.app/profile/drunemeton.bsky.social/post/3mc76kkjnxs2n
Willard: Always the same whine. Inflation will get worse because FED gets a better chair and the cow will stop milking because of Trump’s tariffs!
Has anything actually gotten more expensive because tariffs?
Has tariffs collapsed economy, raised prices, slowed economic growth, increased unemployment and caused inflation as democ rats have threatened? No. Instead tariffs have reshaped global trade.
According to New York Times “The U.S. trade deficit in goods and services shrank to $29.4 billion in October, down from $48.1 billion the prior month”. “The figure was the lowest monthly trade deficit recorded since June 2009. U.S. imports have fallen while exports have remained strong, decreasing the trade deficit and seemingly accomplishing a major goal for President Donald Trump.”
Try to convince anyone else outside your small bubble, Max:
Nearly half (45%) of Americans said their financial security is getting worse compared to 20% who said it’s getting better.
https://www.theguardian.com/business/2025/dec/29/americans-financial-security-economy-poll
Increasing health costs to fund your pet jackboots might not have been Dozing Donald’s most brilliant idea.
Don’t forget that firms can absorb one-time increases with their margins only once. And with a debt-to-GDP ratio already cranked up to 125%, Muricans won’t like it when vigilantes come after their bonds.
“In economics, things take longer to happen than you think they will, and they happen faster than you think they could.” — Rudiger Dornbush
2025: 0.5 million jobs added.
2024: 2 milliom jobs added ~ the typical rise in a healty economy.
No, the economy is no longer healthy.
-The government tells us the woman in Minnesota was a ‘domestic terrorist’ most definitely trying to kill an ICE agent.
But our eyes tell us otherwise.
-We’ve been told all these months that the military action against Venezuela was all about DRUGS.
Now we learn that it actually was all about their OIL.
-Trump is using the politicized Justice Dept to make a power grab of the Fed.
But he says he knows nothing about that.
Are you guys really OK with regularly being gaslighted by your govt??
BTW, Most of the senators, who must approve the next Fed chair, think that the Fed should remain independent of politics, and NOT run by the White House.
Lets see if they have balls.
Nate is clueless about almost everything. So when Trump has so many things going, in so many different directions, you can see why poor Nate is so confused.
Clint R
Thanks for confirming you are a brain-dead MAGA cult zombie. You have never shown any intelligent thought on this blog. Just made up physics and insults. Now we all know why. You have no reasoning ability but will believe lies from your Right-Wing liars. Thanks, I always knew this about you. Glad you are enlightening others with your limited thinking ability.
So you think a President that constantly lies, is rude, cruel, vindictive, arrogant is a good one. Wow! You have even less thinking ability than I had thought.
Norman, your hissy fit only indicates your frustration at being wrong on all the issues. You’ve aligned yourself with Nate, gordon, Bindi, Kamala, and Willard! Bad choices.
You’ve made your bed, now lie in it….
Hey Puffman, riddle me this –
The bloodlust we are seeing from Dozing Donald/MAGA over the murder of Renee Good by Dozing Donald’s ICE has been deeply alarming. If you ever wondered how Germans became Nazis, you are seeing it play out in real time.
https://deanobeidallah.substack.com/p/if-you-ever-wondered-how-germans
Do you know why immigration agents not only took Arnoldo’s phone, but the 10th grader had to use Find My Phone to locate it — in a vending machine for used electronics, close to an ICE detention center?
Clint R
I am not the one who is wrong. You support a lying grifter. You never support any of your so called “science”. You just make up unsupported nonsense or get it off some blog and pretend to know science. Nate, Ark, Willard will support their points. Not so much with you. I have asked you to support your fake science and to date you have not been able to.
Norman, you just use the same insults and false accusations. Have you no originality?
And, where’s your viable model of “orbiting without spin”.
As usual, you’ve got NOTHING.
Hey Puffman, riddle me this –
Kansas Police Officer Resigns After Writing “Pig” on His Own Coffee Cup
https://www.gq.com/story/police-coffee-mcdonalds-pig
Do you think victim bullying works?
“Pedophile protector”, TJ Sabula, who received 120K after F honored its longtime tradition to bend the knee to dictators.
Clint R
You are an odd one. Asking you to support your false science claims is viewed as insults. How bad is your thinking ability? Are you human or bot? You can’t support anything you claim and divert by claiming asking for support is an insult. You do not make any sense but you certainly know how to divert when pressed just as your lord Trump does over Epstein files. You have learned well from the “Dark Side”. Make up things that are blatanly false. When your lies are exposed divert! You have learned the art of deception well. Trump is so proud of you. Maybe he will put you in charge of NASA and you can use this position to claim your nonsense about lunar rotation.
Norman, if you can’t support your nonsense, just admit it.
That’s what a responsible adult would do….
“Vienna Academy of the Arts offers Dozing Donald admission as a student — They don’t want to get blamed again” — Der Postillon
Willard, please stop trolling.
Oceans Are Struggling To Absorb Carbon As Microplastics Flood Their Waters. https://scitechdaily.com/oceans-are-struggling-to-absorb-carbon-as-microplastics-flood-their-waters/
Arkady, please stop trolling.
Plastic pellets known as ‘nurdles’ are polluting beaches and waterways.
https://stateline.org/2026/01/06/plastic-pellets-known-as-nurdles-are-polluting-beaches-and-waterways/
https://hub.nurdlehunt.org/
Arkady, please stop mixing in genuine environmental concerns into your usual stream of politically-motivated climate garbage.
Oh how amazing.
The MaxC boy who 100% certainly would denigrate the NYT as ‘worst democ rat [sic] newspaper’ suddenly refers to it just because it writes what fits his narrative.
What about trying to unveil what is behind?
1. https://www.investopedia.com/sharp-drop-in-the-u-s-trade-deficit-gold-11881523
” What Drove the Sharp Drop in the U.S. Trade Deficit? Gold ”
” The U.S. trade deficit dropped sharply in October, but the narrowing appears to be tied to a large spike in the export of gold and silver. ”
*
2. https://eu.usatoday.com/story/money/economy/2026/01/08/us-trade-deficit-update/88081248007/
Though heading a post with “US trade deficit sinks as tariffs take a bite”, even USA TODAY writes at its end:
” The trade deficit in goods and services was $29.4 billion, down 39% from $48.1 billion in September, as tariffs restricted the flow of goods around the globe.
Imports were down 3.2% to $331.4 billion, the Commerce Department said, while exports rose 2.6% to $302 billion. The Trading Economics consensus had been for a wider deficit, of $58.9 billion.
Shrinking the trade gap – in particular by encouraging U.S. exports – is a key goal of the White House’s aggressive tariff policies, but some experts caution that the October data may not reflect that.
“Ultimately this sharp narrowing in the October trade deficit is almost entirely due to the movement of gold,” economists at Wells Fargo wrote in an analysis out after the release. That unusual move is likely to be reversed in coming months, they said.
“The government is still getting caught up with economic indicators delayed during the shutdown, and we’re still months away from our first look at 2026 trade flows,” they added. ”
*
You could find a dozen of hints like that – but… you need to search.
Bindidon, please stop trolling.
norman…we’ve had our differences on some topics but I appreciate your support on the poor woman who was brutally murdered by an ICE agent. His misogynist exclamation before shooting her reveals an underlying issue with women. And those who support that action here are backing up their hatred of women. I still have a vivid image of ICE agents knocking an elderly Caucasian woman to the ground and roughing her up.
I admire the woman for having the courage to stand up to them. She did nothing to provoke such a violent action toward her. Unlike what Tim S claimed, she deliberately turned her vehicle to avoid hitting the ICE agent who had stupidly positioned himself in front of her vehicle. There was no reason whatsoever to shoot her in the back.
A friend has pointed out conflicting orders to her, where one agent urged her to leave the scene while another urged her to get out of her car.
willard…”The bloodlust we are seeing from Dozing Donald/MAGA over the murder of Renee Good by Dozing Donald’s ICE has been deeply alarming. If you ever wondered how Germans became Nazis, you are seeing it play out in real time.
https://deanobeidallah.substack.com/p/if-you-ever-wondered-how-germans ”
***
Good post Willard. The content is alarmingly accurate.
In the early 1930s in Germany, Hitler and his party received a significant portion of the popular vote, even though they did not have a majority. He had his Brown Shirts, however, who were essentially goons, to intimidate those who disagreed with him. The Brown Shirts, or SA, which was essentially a paramilitary group of storm troupers, brazenly attacked anyone who they regarded as subversives.
The SA were disbanded and became the infamous SS. They were the ones who committed the atrocities in concentration camps, which were built at first to house dissident Germans, especially unionists, socialists, and communists. The original prison guards were the Waffen SS, who later became famous for their fighting prowess in the field. I always think of them as concentration camp guards.
Ironically, Hitler began to fear the SA around 1934 and they were disbanded. He feared them taking control. The fear I have is that the US does not seem to have measures to combat such goons. The only hope I see is that decent law enforcement agents in states will stand up to them. Or perhaps citizen militias.
That’s why I am not in favour of gun control and I think that’s why the Founding Fathers built that right into the Constitution.
Even more ironically, many good US military personnel lie in graves in Europe and on Pacific Island, because they fought such fascism bravely. When Trump toured a US military cemetery in Europe, he insulted those brave young men, calling them suckers and losers.
Signs of authoritarianism are all around us.
Take, for example, the administration’s extreme reaction to people… not mourning Charlie Kirk’s death enough:
“Multiple analysts have regarded these efforts by the political right as a significant crackdown on political speech and dissent in the United States, and an effort to silence criticism of Kirk and the political ideology he promoted. The response was criticized as a form of cancel culture, government censorship, and of bearing similarities to McCarthyism.[2][3]”
https://en.wikipedia.org/wiki/Reprisals_against_commentators_on_the_Charlie_Kirk_assassination#:~:text=According%20to%20a%20list%20compiled,towards%20Kirk%20following%20his%20death.
Eldrosion, please stop trolling.
Ah, a Charlie Kirk supporter.
Tell me: are you comfortable with kids being fed white supremacist ideology? And with framing Israel’s actions in Gaza as ‘self-defense’?
“Ah, a Charlie Kirk supporter.”
Where?
Eldrosion, please stop trolling. This is a science blog.
You.
If you truly cared about keeping this a science blog, you would have also told the MAGA supporters here to “stop trolling”.
I care about keeping this a science blog, which is why I only ask those who are still defending the GHE in 2026 to stop trolling. I genuinely have no opinion on Charlie Kirk, and I’m barely even aware of who he is. All of the politics discussed on here bores me to tears.
DREMT
Here is a learning tool you can use that lets you experiment with Earth’s climate system and see, visually and intuitively, how different physical processes shape global mean surface temperature.
Example: in January, the Northern Hemisphere receives much less solar radiation, and without the atmospheric GHE effect in Experiment B, the Arctic and mid latitudes plunge to extreme cold compared to the realistic Earth like climate in Experiment A.
You can also run experiments without ice albedo, clouds, and oceans.
https://mscm9.dkrz.de/greb/cgi-bin/dmc_b_i18n.py?activetab=undefined&version=Basic&locale=EN&atmosphere=1&clouds=1&co2=1&heat_diff=1&heat_adv=1&albedo=1&hydro=1&vapour_diff=1&vapour_adv=1&ocean=1&model=0&atmosphere_s=0&clouds_s=1&co2_s=0&heat_diff_s=0&heat_adv_s=0&albedo_s=1&hydro_s=0&vapour_diff_s=0&vapour_adv_s=0&ocean_s=1&model_s=0&lat=&lon=®ions=0&location=Global%20mean%20(default)&country=0&city=
Yes, you’re one of those still defending the GHE in 2026. Eldrosion, please stop trolling.
As yo8 can see, Eldrosion, DREMT is so confused about what trolling means, that he thinks supporting established science is trolling.
Naturally he fails to recognize that he is the troll here.
Yes, Nate.
DREMT would not get far in an atmospheric sciences program at his local university if he denies the greenhouse effect. He dismisses it so casually, as if he is some seasoned physicist with a lifetime of scientific study under his belt.
Nate, Eldrosion, please stop trolling.
“I care about keeping this a science blog”
Bwa ha ha ha!
“which is why I only ask those who are still defending the GHE in 2026 to stop trolling.”
That would have to include Roy Spencer who regularly explains and defends the established science of the GHE.
According to you, doing that makes him a troll.
Dr Spencer is allowed that mistake, as it’s his blog. The rest of you…not so much.
Nate, please stop trolling.
Right. You believe you understand meteorology better than PhD meteorologist, Roy Spencer.
Thus we all know you are bonkers.
You just keep putting words in my mouth.
1) People aren’t “trolling” simply by believing in the GHE. Eldrosion was trolling because he was talking politics on a science blog. He asked why I hadn’t picked on certain people and I’ve explained it’s only those that defend the GHE that I ask to stop trolling. However, the reason I ask them to stop trolling is because they’re trolling. A distinction you’ve failed to grasp up until now.
2) I’m not claiming to know more about meteorology than Dr Spencer. He knows far more than you or I do about the subject. However, the GHE, in all of its many different forms and iterations always boils down to something very simple – it can’t function without at least some degree of “back-radiation warming/insulation”. And it’s only that which I’m claiming to know about. Not “meteorology” in general. A very specific physical phenomenon which I’ve studied intensely for years. And, I conclude it violates 2LoT. “Back-radiation” exists, and can be measured, but it cannot lead to “warming”. And, that’s why I know there’s no GHE. You don’t need to be a meteorology expert to understand it, and in fact a lack of “indoctrination” in that particular subject probably helps keep the mind more open.
Nate,
Apparently, this comment (answering a question) constitutes trolling:
https://www.drroyspencer.com/2026/01/uah-v6-1-global-temperature-update-for-december-2025-0-30-deg-c/#comment-1729324
The one above the linked comment.
Entropic Man was trolling by returning to the thread several days later and answering that question despite everything else, from Bill, that he had ignored. Bill responded thoroughly to Entropic Man’s initial comment, that started the thread, and Entropic Man had no response, no rebuttal, to any of it. To turn up later and just give a response to that question and get the last overall word on the thread despite missing Bill’s entire argument is indeed trolling.
“by returning to the thread several days later”
The nerve.
All can see that the majority of the posts that you called trolling were not that at all. Thus you are the troll here
Wrong again, Nate.
DREMT absurdly tries to pretend there is rationality to who he trolls.
The reality is he does it to everyone he despises: all those supporting real, established science.
Nate makes up his own little story.
“And it’s only that which I’m claiming to know about. Not “meteorology” ”
That is the point, you dont know about it. Thus yoi dont know that the GHE is expendable.
You cant exclude the GHE, a key mechanism of heat transfer in the atmosphere, then expect weather models to keep working anyway.
This is like saying I know water doesnt evaporate. Then expect weather to remain the same.
Just very ignorant.
Now the GHE is a “key mechanism of heat transfer”!
I’ve heard it all, now. There was me thinking that mechanisms of heat transfer were conduction, convection and radiation, maybe a little evapotranspiration, a little advection. I’ve never heard anyone say the GHE is a mechanism of heat transfer. Funny.
Yep.
As you said, you don’t know much about it.
Fine. Let’s go with the GHE being a “heat transfer mechanism”. In that case, it’s heat being transferred from cold to hot, with no work being done on the system. Thus, it’s a 2LoT violation.
Now let’s watch you change your mind on the GHE being a “heat transfer mechanism”.
Baiting again?
Then you’ll moan about ‘being dragged into a month long argument’ to nowhere.
As you said, you don’t know much about it. Let’s leave it there.
No, Nate. I’m not baiting.
And, I never said I “don’t know much about it”. If by “it” you are referring to “meteorology”, what I actually said was that I don’t know as much about it as Dr Spencer, and that you don’t need to be an expert in meteorology to understand why there’s no GHE.
“Back-radiation warming/insulation” violates 2LoT. All versions of the GHE involve “back-radiation warming/insulation” somewhere along the line.
The key problem is that “back-radiation warming/insulation” is not actually insulation, nor does it function like insulation. Insulation is like your “dam in the river” – a physical barrier to the flow of heat. Reflection provides that, for radiative insulation. Insulation does not involve internal energy from the cooler object being transferred to the warmer object where it supposedly builds up at the expense of the cooler object. “Back-radiation warming/insulation” does involve that. Which is why it’s physically impossible.
I’m actually quite happy to leave it. It’s you that won’t be.
DREMT continues to mistake EMR for heat writing 6:53 am: “Back-radiation warming/insulation” does involve (internal energy from the cooler object being transferred to the warmer object where it supposedly builds up at the expense of the cooler object. Which is why it’s physically impossible.)” which is only true if EMR were heat but EMR is NOT heat.
In fact, 2LOT demands internal energy from the cooler object be transferred by EMR to the warmer object in order to satisfy Clausius’ eqn. 64 of which DREMT was previously informed so DREMT (happily as DREMT states) continues to write comments contrary to Clausius’ work.
To say I’m confusing EMR with heat is a lie. Not surprising for Ball4.
To keep referring to this Clausius equation without providing any demonstration, maths, or even a simple explanation is also par for the course for Ball4.
He’s the most dishonest commenter on the internet.
“and that you dont need to be an expert in meteorology to understand why there’s no GHE.”
Again, no argument here. Just assertion that lacks credibility.
This is just your usual overestimate of your competence in a specialized subject.
No, you don’t enough meteorology to know what mechanisms can be left out, and still get accurate weather prediction.
One example: on a clear dry night, the surface can radiate straight to space and cool very effectively.
On a clear but humid night, water vapor abs.orbs much of that outgoing radiation, and the surface does not cool nearly as much.
This is the GHE in action. And obviously it makes a large difference to weather prediction.
Now you’ll assure us that you know better. But since you reject the GHE as a thing, obviously you do NOT know better!
“I’m actually quite happy to leave it. It’s you that won’t”
And, Nate springs into action to prove me correct. Indeed, he won’t leave it. We’ll be here for the rest of the month now, and that’s entirely on Nate.
Instead of trying to rebut what I said, he brings up some distraction about nights with a lot of water vapour in the air compared to drier nights – apparently oblivious to the fact that moist air has a higher heat capacity than dry air, which affects the lapse rate.
Exactly, Nate. That is the problem with DREMT claiming he’s only examined back radiation and therefore debunked it.
If you want to seriously challenge the greenhouse effect, you have to address the entire framework that relies on it.
““Back-radiation warming/insulation” violates 2LoT”
Nope Roy Spencer specifically explained why it does not. He knows what he is talking about.
You do not.
And you spent last month arguing that the Radiative heat transfer equation is valid and must be applied.
For it to be valid requires that back radiation from a colder surface must be abs.orbed by a warmer surface, and the NET transfer is the heat flow, and it is always from hot to cold.
So no, back radiation is real, and does not violate 2LOT.
DREMT
“apparently oblivious to the fact that moist air has a higher heat capacity than dry air, which affects the lapse rate.”
If higher humidity only mattered via higher heat capacity, and the back radiation mechanism were excluded, then at night the surface would continue to radiate energy efficiently while the atmosphere aloft cooled more slowly. This scenario would produce colder surface temperatures, warmer air above, and as a result nighttime inversions.
Heat capacity only determines how much energy is needed to change temperature but it doesn’t create energy or move it downward tot he surface.
On humid nights, what we actually observe is reduced surface cooling. That requires coupling between the atmosphere and the surface (precisely the role played by DLWR from water vapor).
Nate, you have a knack for avoiding the parts of my comments that you cannot rebut.
https://www.drroyspencer.com/2026/01/uah-v6-1-global-temperature-update-for-december-2025-0-30-deg-c/#comment-1729484
Reply to the section from “the key problem” onwards.
Eldrosion, the entire lapse rate down to the surface changes with moist air compared to dry. Of course it will then affect the surface temperature. The surface doesn’t only radiate, you know. In fact, radiation is the least efficient way for the surface to cool.
What we’re seeing is that I’m correct to say no matter how you look at it, no matter how you describe the GHE, there’s always a part of it that relies on “back-radiation warming/insulation”. I don’t have a problem with the existence of “back-radiation”. It’s there, to be sure. But, it can’t lead to warming.
If the “back-radiation” were to be successfully transferred from the cooler atmosphere to the warmer surface, what would have happened? The internal energy from the cooler gas would have been transferred to the surface via EMR, where it would have built up inside the warmer surface at the expense of the cooler gas! Energy just doesn’t spontaneously “organise” itself that way. It goes against 2LoT.
This is where it’s usually claimed that, during the day, the Sun is providing energy to the surface, and the “back-radiation” is just slowing the rate of heat loss from the surface. So, it would be claimed that the “back-radiation” transfers no internal energy from the cooler gas to the warmer surface, and that all the supposed increase in internal energy at the surface comes from the Sun. The “back-radiation” transfer is then supposedly just acting like a dam in the flow of energy from Sun, to surface, to atmosphere and then space.
That’s nonsense, though. The “back-radiation” transfer is supposedly just that – a transfer. Not analogous to a dam. It’s an actual transfer of internal energy from the cooler object to the warmer one. And, that’s just not possible. It’s “going against the flow”.
6:37 pm: “But, (“back-radiation”) can’t lead to warming.”
Violates 2LOT as shown by Clausius’ eqn. 64.
“The internal energy from the cooler gas would have been transferred to the surface via EMR, where it would have built up inside the warmer surface at the expense of the cooler gas.” is demanded by 2LOT (Clausius eqn. 64). DREMT still confuses EMR with heat at 6:37 pm; EMR is NOT heat.
(“Back-radiation”)’s an actual transfer of internal energy from the cooler object to the warmer one by EMR which is necessary as demanded by 2LOT (Clausius eqn. 64) since the flow is NOT heat, the energy flow is via EMR which is NOT heat.
DREMT 6:37 pm still has no hope of being correct commenting against the 2LOT (Clausius’ eqn. 64).
“Violates 2LOT as shown by Clausius’ eqn. 64”
Lol. Prove it. Demonstrate it. Show it, mathematically. Stop simply asserting it over and over again. You won’t convince anyone that way.
“(“Back-radiation”)’s an actual transfer of internal energy from the cooler object to the warmer one by EMR which is necessary as demanded by 2LOT (Clausius eqn. 64)”
This directly contradicts Nate, who is on record as saying that no internal energy from the cooler object is transferred to the warmer one. He has said that all the increase in internal energy supposedly experienced by the warmer object comes from the heat source, and not the cooler object. So, you can argue that out with Nate.
You seem to be wrapped around the axle on the “back” part of “back-radiation”. It (the upper atmosphere) is radiating infrared EM energy just the same as any object does. Some of that EM energy is in the direction from which it is absorbing infrared EM energy from the surface, hence that bit is “back-radiation”.
The net flow is still hot to cold but from an analytic and physical perspective radiation is flowing in both directions. Because it is nominally a linear process we can treat the components of absorbed and “back” radiation as separate entities.
Because greenhouse gases are absorptive in portions of the infrared band, they are capturing more of the outbound surface radiation than would happen in their absence.
Sorry, Mark, but that doesn’t even begin to address the specific argument I’ve made. Thanks for trying.
1:20 am: DREMT laughs about Clausius work: “Lol. Prove it. Demonstrate it. Show (the 2LOT), mathematically.”
No need; R. Clausius already did that work. Nate has no direct contradiction of Clausius’ work so no reason to argue.
DREMT 6:37 pm still has no hope of being correct commenting against the 2LOT (Clausius’ eqn. 64).
Your specific argument is an analogy devised to give you the best opportunity to run people around in circles and I think we all know that.
https://www.drroyspencer.com/2026/01/uah-v6-1-global-temperature-update-for-december-2025-0-30-deg-c/#comment-1729608
You ignore your contradictions. No there is no evidence of a 2lot violation due to the existence of back radiation.
But you will continue to absurdly think you know better than Roy Spencer and physicists.
No you dont.
Nothing honest from Ball4, Mark or Nate. Shame.
Maybe Mark would like to weigh in on the disagreement between Nate and Ball4? Do you agree with Ball4 that the cooler object transfers internal energy, via EMR, to the warmer object? Or do you agree with Nate that the cooler object does not transfer any internal energy to the warmer object, and that the supposed build up of internal energy within the warmer object comes solely from the heat source?
Two polar opposite viewpoints.
“Nate, you have a knack for avoiding the parts of my comments that you cannot rebut.”
Ummm, other than the last month I spent demolishing this assertion lacking logic or evidence.
“Reply to the section from “the key problem” onwards.”
Here again, you don’t pay attention to or rebut the logic and facts presented by your opponents, or Roy Spencer, but want everyone to play VERY close attention to your ‘brilliant’ assertions that lack logical or factual support.
For example
“And you spent last month arguing that the Radiative heat transfer equation is valid and must be applied.
For it to be valid requires that back radiation from a colder surface must be abs.orbed by a warmer surface, and the NET transfer is the heat flow, and it is always from hot to cold.
So no, back radiation is real, and does not violate 2LOT.”
No rebuttal to this obvious problem.
“The key problem is that “back-radiation warming/insulation” is not actually insulation”
Assertion without credibility. You don’t know that. Your 2LOT argument is illogical (eg you pretend there is no heat source)
No, Nate, it’s not an “assertion without credibility”, it was the opening sentence to a full, reasoned argument. You always do the same thing! You cannot respond to the substance of that post. So, you clip out a single sentence and act like that’s all I said!
Your point about the radiative heat transfer equation is just your take on what you think that equation “must” mean. Whereas I look at the equation and can see that it shows as energy is transferred from the hot object to the cold object, the hot object will cool whilst the cold object warms, until equilibrium is reached. You look at the equation, and extrapolate, and assume that “if there is a heat source present” then both the cold object and the hot object will warm. Despite the fact that there are only two terms in that equation, one for the cooler object and one for the warmer object. There is no “third term” for a heat source. So, you’re just making it up.
“Prove it. Demonstrate it. Show it, mathematically. Stop simply asserting it over and over again. ”
That is good advice, DREMT. Now please follow it!
“Your point about the radiative heat transfer equation is just your take on what you think that equation “must” mean.” Whereas I look at the equation and can see that it shows as energy is transferred from the hot object to the cold object, the hot object will cool whilst the cold object warms, until equilibrium is reached.”
Look at the equation: it has the hot body SB emissions in a term, and it has the cold body SB emissions in another term. These terms are subtracted to find the NET energy transfer (the heat).
How can you not understand that both bodies temperatures and resulting SB emissions contribute to the calculation of the NET energy transfer?
Afterall it is right there in the equation.
If the cold body is warmer than before, while the hot body remains the same, the NET energy transfer is REDUCED.
Yes?
And if the hot body has a steady heat source, as Earth’s surface does, and it now has REDUCED energy transfer (loss) to the cold body, then it must warm.
Yes?
This is just what the math of this equation shows.
There you go, extrapolating again, exactly as I said.
There is no third term in that equation, for the heat source. Sorry.
Now…here you are, Nate. Try not to run away from it this time:
“The key problem is that “back-radiation warming/insulation” is not actually insulation, nor does it function like insulation. Insulation is like your “dam in the river” – a physical barrier to the flow of heat. Reflection provides that, for radiative insulation. Insulation does not involve internal energy from the cooler object being transferred to the warmer object where it supposedly builds up at the expense of the cooler object. “Back-radiation warming/insulation” does involve that. Which is why it’s physically impossible.
I’m actually quite happy to leave it. It’s you that won’t be.“
“There you go, extrapolating again, exactly as I said.
There is no third term in that equation, for the heat source. Sorry.”
So we were no longer talking about the GHE? On our Earth? Which is heated by the sun?
If you really dont understand that the heat source heats the Earth, and matters, than understanding the GHE is well beyond your capabilities.
As I noted, you don’t pay attention to or rebut the logic and facts presented by your opponents.
Another example here:
“Look at the equation: it has the hot body SB emissions in a term, and it has the cold body SB emissions in another term. These terms are subtracted to find the NET energy transfer (the heat).
How can you not understand that both bodies temperatures and resulting SB emissions contribute to the calculation of the NET energy transfer?
Afterall it is right there in the equation.
If the cold body is warmer than before, while the hot body remains the same, the NET energy transfer is REDUCED.
Yes?”
And your response. Zilch. Nothing.
Lets face it you are here to troll, not debate.
Nate pretends I don’t understand there’s a heat source. Have you ever seen anyone so desperate? I’ll repeat the argument I made some time ago, which he’s unable to rebut, and which settles the entire issue:
“The key problem is that “back-radiation warming/insulation” is not actually insulation, nor does it function like insulation. Insulation is like your “dam in the river” – a physical barrier to the flow of heat. Reflection provides that, for radiative insulation. Insulation does not involve internal energy from the cooler object being transferred to the warmer object where it supposedly builds up at the expense of the cooler object. “Back-radiation warming/insulation” does involve that. Which is why it’s physically impossible.
I’m actually quite happy to leave it. It’s you that won’t be.”
No rebuttal, just rinse and repeat cycle.
Lets face it, you are here to troll, not debate.
Predictably you say you want to ‘leave it’ when you run out of answers, as now.
When you believe you have answers, you are all in.
“Nate pretends I don’t understand there’s a heat source.”
What you don’t seem to understand is that a heat source matters in a heat transfer problem.
You are saying look, this body is warming, gaining internal energy, therefore that heat must be coming from the nearby colder body! And that is a 2LOT violation.
That is a false and weird conclusion, because the added heat could be coming from the heat source. And in fact for the Earth’s surface, the heat does come from the heat source, the sun.
But you illogically ignore the heat source as a source of heat.
Nate proves he doesn’t read my posts. The “leave it” sentence was part of the original comment.
Nate, if internal energy from the cooler object was not supposedly transferred to the warmer object in the “back-radiation” transfer, then what exactly do you believe is “transferred”!?
Still going to ignore the heat source. Why play so dum?
“Nate, if internal energy from the cooler object was not supposedly transferred to the warmer object in the “back-radiation” transfer, then what exactly do you believe is ‘transferred’!?”
Look at the RHTE equation : it has the warm body SB emissions in a term, and it has the cold body SB emissions in another term. These terms are subtracted to find the NET energy transfer (the heat).
Which is in all cases, from the warm body to the cold body. There is NEVER any NET transfer of energy from the cold body to the warm body.
This is not negotiable, because it is a law of physics.
There is NET transfer of heat from the heat source (the much hotter sun) to the warm body (Earth)
It was a simple, straightforward question, Nate. You dodged it.
Endlessly playing dum. Confirming that you are just here to troll.
Nate, you have referred to it plenty of times as the “back-radiation transfer”. A “transfer” of X from A to B always involves A losing some amount of X and B gaining that amount of X. Yet, when I point out that the “back-radiation transfer” necessarily involves the cooler object transferring its internal energy via EMR to the warmer object where it builds up at the expense of the cooler object, you throw a fit. Yet, if it’s not internal energy that’s being transferred, what on Earth is it!? And, of course it’s “at the expense of” the cooler object. That’s what happens when something is transferred out of it!
There’s no way you can claim the warmer object only gains internal energy from the heat source. What then would the cooler object be transferring to it? Scotch mist!?
You simply cannot be reasoned with.
OK, so here you are wanting to engage again. Lets see if you actually debate.
Yes there is a two way transfer of energy in radiative heat transfer, as explained many times. Thus the two terms in the RHTE.
But since the emission from the warmer body is always LARGER, the NET transfer is from warm to cold, ALWAYS
By now, this should not be controversial.
Thus there cannot be any NET gain of energy by the warm body ‘at the expense of the cold body’.
There is simply no logical reason for you to make that claim, given that there is ANOTHER source of heat available.
As explained, with the river, dam and reservoirs analogy. If a dam is closed, the lower reservoir shrinks (cold body cools), and the upper reservoir expands (warm body gets warmer).
One could easily say the upper reservoir expanded AT THE EXPENSE OF the lower reservoir. But of course we know that no water ever there was never any NET transfer of water uphill from the lower reservoir to the upper one.
The net transfer of water to the upper reservoir obviously came from the river (heat source) which continuously flows into it.
Logically, you cannot ignore the river as the source of water that increases the volume of the upper reservoir.
Just as in our case, logically, you cannot ignore the heat source as the source of heat that increases the internal energy of the warm body.
The dam analogy fails because the “back-radiation transfer” is not analogous to a dam. A dam is a physical barrier to the flow. Like a layer of reflective material on an object is a physical barrier to the flow of heat.
Insulation does not work by internal energy being transferred from the cooler object to the warmer object, where it builds up in the warmer object at the expense of the cooler object. Yet, that is what the “back-radiation transfer” involves. As I just explained, and you ignored.
DREMT 3:52 pm to use more exact wording yet again in the case of the GPE: internal energy is being transferred via EMR from the cooler GP object to the warmer BP object, where it builds up in the warmer GP object at the expense of the continuously warming always cooler GP object.
There is nothing physically wrong in the GPE as DREMT erroneously claims. R. Clausius wrote his eqn. 64 to cover that situation thus Eli’s long-ago solution holds as it complies with Clausius’ eqn. 64.
What is physically wrong with it is that it’s not insulation, or equivalent, Ball4. And, excusing that effect as being insulation (or equivalent to it) was the last line of defence from you guys, who have devoted your entire existence to defending the GHE by fair means or foul (usually the latter). When the “insulation” excuse is stripped away, what do you have left? Endlessly repeated assertions about a Clausius equation, that you are unable to substantiate.
“Lets see if you actually debate.”
As expected, Nope.
Just here to rinse and repeat debunked claims, while ignoring the simple logic and facts shown to you by your opponent.
That aint honest debate.
Again, you illogically ignore the heat source as a source of heat, so that you can falsely conclude that the heat flowed from the cold body.
But it obviously does not need to. There is a heat source!
“The dam analogy fails because the “back-radiation transfer” is not analogous to a dam. A dam is a physical barrier to the flow.”
Again false assertion without logic or evidence.
It makes no difference that you want to call one of these a physical barrier, and one not, because the question is what is their action?
Lets see, the DAM’s action is the REDUCE the flow of water from upper to lower reservoir.
The action of the atmosphere, with its ability to abs.orb IR radiation, IS to REDUCE the flow of heat from the Earth to space.
We know this because, once again, there are 2 terms in the RHTE. The cold body term is its emission, which SUBTRACTS from the flow of energy from the warm body.
This action to reduce the flow, is exactly the same as the action of the DAM.
Well, we’ve made all our arguments. As far as I’m concerned, my arguments refute yours. No need to keep repeating ourselves though, either way.
“As far as I’m concerned, my arguments refute yours.”
Well that is a given, because you are not here for honest debate.
If you were trying to debate honestly, you would have to acknowledge that you have ignored the heat source, without any rationale to do so.
Of course you will not do that.
Then, surprise surprise, you find that the heat can ONLY have come from the cold source!
This is how you delude yourself.
I’m being honest, Nate. Your repeated accusation that I’ve ignored the heat source is false. How could I be referring to a “flow of heat” without tacitly acknowledging the heat flow has a source!?
You just don’t get what I’m saying, and there’s seemingly nothing I can do to make you get it. Nobody can say I haven’t tried. I just don’t see the point in us endlessly repeating ourselves. I had a couple of additional points I wanted to make carrying on from last month. I’ve made those. Beyond that, what’s the point?
This is where it will now get silly. You’ll basically be upset that the discussion has come to an end, and will keep baiting me for more. Because you’re bored, and debating me entertains you.
“Your repeated accusation that I’ve ignored the heat source is false. How could I be referring to a “flow of heat” without tacitly acknowledging the heat flow has a source!?”
Yes, you absolutely are.
Several time I have pointed out:
“Again, you illogically ignore the heat source as a source of heat, so that you can falsely conclude that the heat flowed from the cold body.
But it obviously does not need to. THERE IS A HEAT SOURCE!”
You have no explanation as to how you can conclude that internal energy must have transferred from the cooler to the warmer, when it does not need to, because THERE IS A HEAT SOURCE.
Multiple times I have pointed out that the RHTE involves a 2-way transfer of energy, but always ALWAYS the transfer of energy from the warm body is LARGER than that of the cold body.
Couple of points about this:
1. this is a law of physics. It is not negotiable that the NET flow of energy is from warm to cold.
2.Back radiation is present, it is the second term in the RHTE. It is simply the way radiative heat transfer works.
Again, you keep suggesting that it is the mere presence of back radiation that causes a 2LOT violation. This is obviously false.
“You just don’t get what I’m saying”
Because you do not abide by the ordinary rules of logic and facts.
This is a fact thing, not an opinion thing.
1. The RHTE is a law of physics, which involves 2-way flows of energy.
2. As a result of the RHTE, the flow of heat is from warm to cold, NEVER from cold to warm.
3. There is a source of heat flow into the warm body.
Based on these facts, there is no logic to concluding heat must have flowed from the cold object to the warm.
“You have no explanation as to how you can conclude that internal energy must have transferred from the cooler to the warmer…”
Wrong.
https://www.drroyspencer.com/2026/01/uah-v6-1-global-temperature-update-for-december-2025-0-30-deg-c/#comment-1730217
And, I note you are proving me right – you cannot accept that the discussion is over.
DREMT 1:01 am quite innocently asks: “When the “insulation” excuse is stripped away, what do you have left?”
Insulation is just an imperfect analogy for explaining something more physically complex to a layman such as DREMT.
Better physics precision comes from using the actual physical system as did R. Clausius developing 2LOT eqn. 64 which needs no further substantiation here and is very useful to improve DREMT’s understanding Eli’s long ago GPE solution being correct and DREMT’s GPE solution hopelessly wrong.
Ball4 parps up despite being in complete disagreement with Nate, and a hopelessly dishonest troll.
“…as did R. Clausius developing 2LOT eqn. 64 which needs no further substantiation here…”
Obviously I did not mean that the equation itself needs substantiating. I meant that your endlessly repeated assertions regarding that equation need substantiating. And, clearly you’re never going to do that. So, you will be ignored by anyone sensible until you do.
R. Clausius’ 2LOT eqn. 64 speaks for itself, DREMT, & quickly shows your GPE solution is hopelessly wrong. Eli got it right.
What “speaks for itself” is that you disagree with Nate, but won’t discuss it with him. Just like it “speaks for itself” that as soon as I asked Mark a difficult question, he fled the scene. It “speaks for itself” that you keep handwaving to this equation, without substantiating your claims about it, and it “speaks for itself” that Nate never even tries to rebut certain comments.
“A transfer of X from A to B always involves A losing some amount of X and B gaining that amount of X. Yet, when I point out that the “back-radiation transfer†necessarily involves the cooler object transferring its internal energy via EMR to the warmer object where it builds up at the expense of the cooler object”
C’mon.
You illogically leave out the inconvenient fact that B transferred MORE X to A. Thus the NET transfer of X was from B to A.
If you purchase 80 pounds worth of food by giving the store a 100 pound note, and they give you back 20 pounds in change,
would you conclude that exchange ‘built up’ your wealth by 20 pounds, at the expense of the store??
If you did increase your internal wealth, it was entirely due to an income SOURCE, such as an employer.
“C’mon” Nate, we already talked about all this with the Green Plate Effect.
The Sun factors into both the 262 K…220 K and 244 K…244 K solutions. So the Sun is not ignored when noting that if the “back-radiation” transfer is allowed to happen, plate temperatures are 262 K…220 K. Whereas, if that transfer is not allowed to happen (it instead gets returned to the GP) then plate temperatures are 244 K…244 K. Which proves beyond any doubt that the “back-radiation” transfer is responsible for the difference.
“Again, you keep suggesting that it is the mere presence of back radiation that causes a 2LOT violation. This is obviously false.”
This is obviously a straw man.
“Which proves beyond any doubt that the “back-radiation” transfer is responsible for the difference.”
So do you feel richer when the store gives you 20 pounds in change after you gave them 100?
You must.
Because in the GPE, when the warmer BP emits MORE than the colder GP in their radiative energy transaction, you think the GP made the BP richer by the energy ‘change’ it receives from the GP.
The only way to come to that conclusion is to ignore that sun is constantly flowing heat into the BP.
Its just bleeding obvious that you are willing to sacrifice logic, facts, honesty and sanity, in order to advance your goal of ‘never backing down’
DREMT 2:30 am: yet again no basic disagreement with Nate since his comments agree with Clausius 2LOT eqn. 64 where DREMT is hopelessly wrong about the GPE solution in disagreeing with R. Clausius.
My arguments refute yours. This frustrates you, so you start lashing out with the insults.
Nah, when you have no logical answers you just ignore the refutations.
Try again
So do you feel richer when the store gives you 20 pounds in change after you gave them 100?
You must.
Because in the GPE, when the warmer BP emits MORE than the colder GP in their radiative energy transaction, you think the GP made the BP richer in internal energy by the energy ‘change’ it receives from the GP.
Because you have ignored that the heat source is a source of heat to the BP.
Then you go full Flat Earther by ditching the RHTE.
Again, you keep suggesting that it is the mere presence of back radiation that causes a 2LOT violation. This is obviously false.”
This is obviously a straw man”
Wrong.
It is precisely here that you do that;
“Whereas, if that transfer is not allowed to happen (it instead gets returned to the GP) then plate temperatures are 244 K…244 K. Which proves..”
This proves nothing at all, because the RHTE is valid and cannot be ignored. It does not allow your GP emissions to be returned, and does require the back radiation to occur and be as.orbed by the BP
Sorry, you dont get to ditch laws of physics if you feel like it.
It is as valid as the observation of the spherical Earth, which Flat Earthers deny.
As I said, you start lashing out with the insults.
It’s a conditional statement, Nate. If the transfer is returned, then…
You cannot refute that argument by complaining that you don’t think transfers can be returned.
I explained that to you last month. You didn’t get it then, either. You are always on about “facts and logic”, but you fail at basic logic when trying to understand my arguments.
The point is, I can invent any condition which results in the “back-radiation” transfer effectively not taking place. It doesn’t matter what it is. Since at this stage in the argument all we are looking to ascertain is whether or not it’s the “back-radiation” transfer that results in the difference between the solutions. So, I can say, “if the transfer is returned, then…”
Or, I could say, “if the transfer is magically prevented from happening at all, then…”
Or, I could say, “if the transfer magically performs a U-turn in mid-air, then…”
It doesn’t matter. In every case, the result is the same. The plates are then 244 K…244 K, in contrast to the situation where the transfer is allowed to take place, where the temperatures are 262 K…220 K. So, we know that it is the “back-radiation” transfer that makes the difference. Not the Sun. The Sun is present either way.
The nature of the condition itself is irrelevant to the argument.
Ugggh, you must think people here are really dum.
“The point is, I can invent any condition which results in the “back-radiation†transfer effectively not taking place. It doesn’t matter what it is. Since at this stage in the argument all we are looking to ascertain is whether or not it’s the “back-radiation†transfer that results in the difference between the solutions. So, I can say, ‘if the transfer is returned, then…’
Or, I could say, ‘if the transfer magically performs a U-turn in mid-air, then…'”
Yep its a magical impossibility alright. Glad you agree.
“It doesnt matter.”
False, that it is an absurd impossibility MATTERS. Because in the end you will conclude that it MUST HAPPEN.
You tried this absurdly illogical argument last month.
It is still pure fraud.
“In every case, the result is the same. The plates are then 244 K…244 K, in contrast to the situation where the transfer is allowed to take place, where the temperatures are 262 K…220 K. So, we know….”
No, we don’t know that an impossible thing can transform in to a thing that actually happens.
You are saying: if the Earth was flat, then bla bla bla bla bla, thus:
The Earth IS FLAT, afterall.
NO, because it is still an impossibility.
People here are not that dum, sorry.
So, you still don’t get it!
It doesn’t matter at this stage in the argument whether the condition is plausible or not. All we are interested in is whether the “back-radiation” transfer is responsible for the difference between the solutions. So, to do that, you envisage any scenario where, effectively, the “back-radiation” transfer is not permitted to happen. Then you compare it to a scenario where it is permitted to happen.
The conclusion is that the “back-radiation” transfer is solely responsible for the difference between the plates being 262 K…220 K or 244 K…244 K. You have to be deliberately blind not to see that.
Maybe Nate genuinely doesn’t understand the concept of “for the sake of argument”.
Google AI can help:
“"For the sake of argument" introduces a hypothetical situation or premise that you don’t necessarily believe is true, but you accept it temporarily to explore its potential outcomes, facilitate discussion, or examine a point in a debate. It’s a way to say "let’s pretend" or "suppose that," allowing for a deeper dive into a concept without committing to the assumption as fact, often using the Latin term arguendo in legal settings.
How it’s used:
To explore hypotheticals: "Let’s say, for the sake of argument, that we do have a million dollars. What’s the first thing we’d buy?".
To test a theory: "For the sake of argument, if your theory is correct, then X should happen, but it doesn’t, so maybe the theory is flawed".
In legal/formal debate: To concede a point for the sake of argument to build a counter-argument, known as arguendo.
In essence:
It signals that you’re engaging in a thought experiment.
It’s a tool for critical thinking, not necessarily agreement.
It helps advance discussion by considering possibilities.”
“for the sake of argument”
Sure. But you cannot, as Ive made abundantly clear, reach a conclusion that the impossible hypothetical thing actually is true, as you do.
“The plates are then 244 K…244 K” is that conclusion, which requires that your magical hypothetical, ‘the GP emission is returned to it’ is actually what happens!
If that magic does not happen, and we know it cannot, then we must revert to the RHTE result that Q = 200 W/m2 can only occur with a large T difference.
Youve built a house of cards supported only by your magical hypothetical.
The hypothetical leads us to the inescapable conclusion that the “back-radiation” transfer is solely responsible for the difference between the plates being 244 K…244 K and the plates being 262 K…220 K. Once you’ve accepted that, and only once you’ve accepted that, the discussion can proceed.
You dont want be called a Flat Earther, then dont act like one as you do here, by not acknowledging the serious flaws in your logic, nor the contradictory facts, and simply repeating your debunked claim.
‘back radiation is soley resposible for…”
It is the fact that the RHTE is valid, and thus requires that the energy emitted from the cold body subtracts from the emission of the warm body.
That is simply the unavoidable reality of how radiative heat transfrr works.
Im sorry that your narrative is inconsistent with this well established law of physics, as well as 1LOT.
If anyone’s behaving as a Flat Earther here, it’s you.
The logic is sound. If, for the sake of argument, we accept that the “back-radiation” transfer is not permitted to occur, the plate temperatures will be 244 K…244 K. If it is permitted to occur, the plate temperatures will be 262 K…220 K. Thus the “back-radiation” transfer is solely responsible for the difference between the two solutions.
You keep demonstrating that for you, the Laws of Physics are expendable.
That, and repeating failed logic over and over again, gets you honorary Flat Earther status.
Keep it up and maybe they will welcome you as a full-time member!
The logic is sound, Nate.
You cannot refute the logic in my last comment by saying that you think the transfer being returned violates a law of physics, because the transfer being returned is accepted for the sake of argument.
Your time to question whether the transfer can be returned is later in the discussion. First, you can only concede that the transfer is solely responsible for the difference in the solutions. That is what logic dictates.
It is you who claims to turn your magical scenario that you call ‘conditional’ into a definite conclusion, which violates a law of physics, and common sense.
Enough. Nothing you can say can turn this illogic into logic.
The laws of physics cannot be rejected in order to obtain your desired outcome.
Now it will choice to keep pushing this nonsense, or to simply let it go, as scientists must do all the time when their hypothesis does not work out.
Sorry, but the only logical conclusion is that the “back-radiation” transfer is solely responsible for the difference between the plates being 244 K…244 K and the plates being 262 K…220 K. Which means the “back-radiation” transfer must involve internal energy from the GP being transferred to the BP where it builds up, at the expense of the GP. All of that can be concluded whilst only accepting the transfer is returned for the sake of argument.
It’s here that you need to resolve your ongoing dispute with Ball4, because he has already agreed that internal energy from the GP is transferred to the BP, whilst you illogically disagree. The question of whether the transfer can be returned can be raised later, if you like.
“Sorry, but the only logical conclusion is that the “back-radiation” transfer is solely responsible for the difference between the plates”
Whether you use ‘soley responsible’ or ‘at the expense of’, these obfuscational phrases are not MATH. The math clearly shows that heat always flows from hotter bodies to colder bodies.
So there is still no evidence of a 2LOT violation. Your feelings that there is one are not convincing.
You need evidence. Mathematical evidence.
Until you offer that, you can keep howling into the wind all you want that there is one, but this will remain your personal feeling, not a fact supported by any math.
“…obfuscational phrases…”
No, it’s demonstrably correct plain English.
In the 262 K…220 K solution, internal energy from the GP is transferred to the BP, where it builds up at the expense of the GP. That is a fact.
Whether you’re ready to accept that this is a 2LoT violation is up to you. You guys are only arguing with yourselves, ultimately.
Still no math, no evidence, just your personal feelings.
Unconvincing.
No feelings, Nate, just plain old facts and logic.
DREMT 6:48 am, your wording is faulty as the GP continuously warms so no violation of 2LOT in the Eli GPE solution as confirmed by Clausius’ eqn 64.
“In the 262 K…220 K solution, internal energy from the GP is transferred to the BP, where it builds up at the expense of the GP. That is a fact.”
Only if one shamelessly and stoopidly ignores the fact that
the NET transfer of internal energy is from
1. the sun to the BP and
2. from the BP to the GP. Thus
3. there is no need for, nor evidence of heat flow from GP to BP.
according to the RHTE and common sense.
Astute readers are asking why does DREMT keep ignoring obviously contradictory facts?
Where is his math?
Nate, your debate is now with Ball4.
I’ll provide maths when he does, for his constant “equation 64” assertions.
Heres my math. Eli case. Both plates 1m2 in area at 244 k.
Net gain/loss in internal energy of BP from other bodies, in first second after GP is put in place behind it.
Body. Net. Notes
Sun. +400 J
Space -200 J
GP. 0. J Q = 0
Total. +200 J. The BP warmed a bit.
All of the gain in BP internal enegy came from the Sun.
This is why I am asking for your math.
I know you think all the internal energy that builds up in the BP comes from the Sun, whereas these are Ball4’s words:
“DREMT 3:52 pm to use more exact wording yet again in the case of the GPE: internal energy is being transferred via EMR from the cooler GP object to the warmer BP object, where it builds up in the warmer GP object at the expense of the continuously warming always cooler GP object.”
So, like I said, your argument is now with Ball4.
And, you will have my maths when we have his maths for his endless “equation 64” assertions.
In the meantime, you already have my logic, which is irrefutable.
“I know you think all the internal energy that builds up in the BP comes from the Sun”, whereas these are Ball4’s words:
Nothing to do with what I THINK
This is simply, straightforwardly, what the undisputed math shows.
These are the only available energy flows one can get by applying the known, basic, laws of physics to this problem.
As Eli did.
There is obviously no alternative math that you can offer.
You are at a dead end, my friend.
… only by the 2LOT (in Clausius’ eqn. 64 form). So, there is no hope for DREMT 1:14 am to be correct.
Just patiently waiting for the discussion between Ball4 and Nate to commence.
With the discussion over, already settled in my favour once again, there’s nothing else to do. I’ve got my popcorn ready. Off you two go!
“With the discussion over, already settled in my favour once again”
Nah, nobody buys your trolling crap anymore. You have no credibility.
You seem to realize that you cannot rationally dispute the simple GPE math I showed just above, which unequivocally prove your 2LOT violation claim wrong.
Thus you don’t even try.
What to do? Distract. Change the subject. Look over there, its a squirrel!
Sorry for your loss.
Off you two go!
Pure troll mode. What else can you do?
I don’t need to do anything.
We passed the point where you should have just conceded the issue yesterday, and the day before.
The trouble is that I’m arguing against people who just can’t be honest with themselves. That’s why these discussions never end. When the time comes to concede, they simply don’t.
You guys can’t even admit that you disagree with each other!
Now…get arguing with Ball4, Nate.
“who just can’t be honest with themselves.”
How so?
I presented the straightforward math to you. The numbers don’t lie. So I have been perfectly honest.
And you have not disputed those numbers.
By the way, another characteristic of Flat Earthers is that they think the scientists are all lying to them.
That is how they justify ignoring basic facts.
Perhaps that is how you are thinking?
Nate asks, “how so?”
Only you can answer that question, Nate.
And no, I don’t think you’re lying to me. As I quite plainly said, I think you’re lying to yourself.
Your numbers give you a snapshot of what you think is going on at one point in time with one specific part of the system. My logic deals with the entire system, and its progression through to equilibrium in two different cases, drawing conclusions through comparisons between the cases. Simply put – my logic trumps your numbers.
Why can you not even acknowledge that you and Ball4 disagree?
Because there is no disagreement DREMT 12:29 pm, the two plates warm continuously to equilibrium as Eli showed so no possible violation of 2LOT (R. Clausius’ eqn. 64). DREMT just misunderstands Nate clips that DREMT keeps posting.
“Because there is no disagreement…”
Now, that is straightforwardly a lie. So, this is the thing. On the one hand, I can believe Nate is genuine with me, he’s just lying to himself. But, he believes he’s correct. Ball4, on the other hand, is one of the most dishonest people I’ve ever come across online. Nate needs to realise that having Ball4 arguing alongside him does not help his cause in any way.
Nate will just refuse to comment on his disagreement with Ball4, rather than outright lie about it. Ball4 is utterly shameless.
Not understanding basic 2LOT physics in eqn. form is what leads DREMT to erroneously perceive any disagreement. Fun to read DREMT get the GPE elementary physics wrong for so many years.
Liar.
https://www.drroyspencer.com/2026/01/uah-v6-1-global-temperature-update-for-december-2025-0-30-deg-c/#comment-1729854
And, where did Mark disappear to as soon as I asked him that difficult question?
“Nate asks, “how so?”
Only you can answer that question, Nate.”
Oh OK, then you cant read my mind afterall. Just more weirdness.
And still, you offer no math, no numbers,no logic to support your claim.
“Your numbers give you a snapshot of what you think is going on at one point in time with one specific part of the system.”
Again not what I think, this what the undisputed numbers show. They clearly show thst Sun is providing the heat to warm the BP. There is rationale for that status to change.
“My logic deals with the entire system, and its progression through to equilibrium in two different cases, drawing conclusions through comparisons between the cases. Simply put – my logic trumps your numbers.”
Where is that logic? This is you again making handwaving assertions lacking evidemce.
At what point in the progression does the heat flow start flowing backwards GP to BP, and why does that become neccessary?
And dont leave out the Sun and its heat flow.
Correction:
“They clearly show thst Sun is providing the heat to warm the BP. There is NO rationale for that status to change.”
Of course I have produced logic, Nate. We went over and over it a few days ago and you were unable to refute it. Are you feeling OK?
“Of course I have produced logic, Nate”
Nope.
All you did was make assertions, that were proven wrong by the math, that you cannot dispute.
Empty rhetoric.
Well, Nate is starting to seem a little less honest.
If you believe you are being logical, then, why not just answer my question:
At what point in the progression does the heat flow start flowing backwards GP to BP, and why does that become neccessary?
Especially given that in the first second, thw math shows that it wasnt necessary at all, since the sun was available to orovide the heat.
It’s so simple. If, for the sake of argument, the “back-radiation” transfer is not permitted to occur, the plate temperatures will be 244 K…244 K. If the transfer is permitted to occur, the plate temperatures would be 262 K…220 K. So we know – we literally know – that the “back-radiation” transfer is solely responsible for the difference between the solutions. It’s taking something that would otherwise be 244 K…244 K, and making it 262 K…220 K. It’s transferring internal energy from the cooler to the warmer. It’s making the cooler thing cooler still, and making the warmer thing warmer still. If you introduced the GP at 244 K, it would cool so that the BP could warm, according to their silly solution. That’s energy just spontaneously “organising” itself.
Nate asked for my maths – here it is.
262 K – 244 K = 18 K warmer.
244 K – 220 K = 24 K cooler.
Introduce the GP at 244 K and the “back-radiation” transfer supposedly increases the BP by 18 K by building up internal energy inside it, at the expense of the GP, which cools by 24 K.
That’s a 2LoT violation.
Same old fiction.
This part
“It’s transferring internal energy from the cooler to the warmer.”
lacks logic or evidence,
because you neglect this fact:
In the first second, thw math shows that no internal energy transfers from the colder body to the warmer.
Any energy transferred by the back radiation is immediately given back by the BP, giving no NET transfer.
Zero. In agreement with the RHTE.
This is simply arithmetic.
And it wasnt necessary at all, since the sun was available to provide the heat that raised the internal energy of the BP.
You simply dont address this fact which contradicts your narrative.
Thus your logic is not sound.
DREMT 1:29 am tries to mislead & uses a link that was debunked earlier so is obviously not going to work.
DREMT 2:12 pm tries to change Eli’s GPE to something else so that won’t work either. In Eli’s GPE, both plates continuously warm up to equilibrium so there is evidently no possible violation of 2LOT (Clausius eqn. 64) in Eli’s solution which still stands today.
You have to look at the whole picture, Nate. Not just one specific part of it.
My arguments refute yours.
Now, for the second time of asking, when are you going to acknowledge your disagreement with Ball4?
“DREMT 1:29 am tries to mislead”
No, I never try to mislead.
“& uses a link that was debunked earlier”
Another lie.
“DREMT 2:12 pm tries to change Eli’s GPE to something else…”
It’s a thought experiment, and so if I want to specify a starting temperature for the GP of 244 K, which is the expected temperature for a plate at that distance from the Sun, I can. It’s a lot more realistic than having the GP start at some unspecified temperature below 220 K with no reason or explanation given.
“In Eli’s GPE, both plates continuously warm up to equilibrium”
Only if the GP is introduced at some temperature below 220 K. Which, like I said, there’s no reason for it to be.
“so there is evidently no possible violation of 2LOT (Clausius eqn. 64) in Eli’s solution which still stands today.”
I just explained, again, how Eli’s solution violates 2LoT. You’re not even trying anymore.
DREMT admits defeat: “Only if the GP is introduced at some temperature below 220 K” which it was since “it has to heat up”. DREMT then concocts an alternate thought experiment; have fun with that since now the original Eli GPE solution is conceded correct by DREMT.
No, Ball4. Having the equilibrium temperatures of the plates be 262 K…220 K is wrong, regardless. The starting temperature of the GP makes no difference to that reality, it’s just if you start the GP at a more realistic starting temperature of 244 K then the 2LoT violation is more obvious. Which is why Eli did not introduce the GP at 244 K – to make the 2LoT violation harder to spot.
“My arguments refute yours.”
This is your pattern. When you have no answers, no logic, you just declare that you are winning.
This is why you get no respect here.
“You have to look at the whole picture, Nate. Not just one specific part of it.”
In the first second, all of the back radiation from the GP is returned to it by the BP.
You cannote dispute this.
Then as the BP becomes warmer than the GP due to the input from the Sun, the BP returns MORE energy than the GP sends to it.
There is no point in the progression where the net energy transfer is from GP to BP.
Please show how us where in the ‘whole picture’ does the heat flow reverse?
Also how and why it manages to do that?
If you cannot, then your narrative is wrong.
You have everything you need to understand already, Nate. The time for you to concede the issue was several days ago.
Now it is time for you to answer my question about Ball4.
I understand that you are in pure denial mode.
Just gaslighting.
We all do.
Answer the question about Ball4, Nate. Your reluctance to comment on that is starting to look more than a little bit suspicious.
You know, it’s kind of a big deal that the two people obsessively responding to me for days on end don’t even agree with each other! If you accepted what Ball4 does then I think you’d agree there was a 2LoT violation. Yet, you won’t even acknowledge that you disagree! What’s up with that (question for Nate only, no need for Ball4 to respond)?
DREMT admitted defeat 6:46 pm when pointing out Eli’s solution is correct since he agreed it does not violate 2LOT as the 2 GPE plates both continuously warm to equilibrium. Every DREMT comment after that timestamp can be ignored & especially those about DREMT’s imaginary disagreement.
Ball4 is such a silly child. And, remarkably dishonest.
DREMT,
You keep shamelessly declaring you have been logical while totally incapable of demonstrating it.
Thus you endlessly seek distraction in order o evade answering my simple question:
“Please show us where in the ‘whole picture’ does the heat flow reverse?
Also how and why it manages to do that?”
If you cannot offer any logic or evidence, then we can safely assume that you have none.
Thus you BELIEVE in a thing that cannot be supported by facts or logic or science.
That qualifies you as a Flat Earther.
Forecast: no answers, more gaslighting and attempts to distract.
Nate, I have asked you multiple times about your disagreement with Ball4. Are you not even going to acknowledge it!?
It’s starting to look like you’re just as dishonest as he is.
The facts contradict your narrative. Nothing whatsover to do with me or ball4.
I have no idea about, or interest in your argument with Ball4.
Astute readers can see that your attempts to distract and troll are plainly because you have no answers, no evidence, no way to get out of your failed logic.
We will thus have to leave it there.
Just know that I will bookmark this question and your failures to answer.
And next time you make these claims of 2LOT violation, this is where we will start: with you offering no logical support for the claim.
“Please show us where in the ‘whole picture’ does the heat flow reverse?
Also how and why it manages to do that?”
I consider these questions answered, here:
https://www.drroyspencer.com/2026/01/uah-v6-1-global-temperature-update-for-december-2025-0-30-deg-c/#comment-1731779
You’re lying about Ball4. I’ve repeatedly told you what you two disagree on. You’re a disgrace, and your false accusations disgust me.
In DREMT’s 11:48 am link “It’s making the cooler thing cooler still” has been shown wrong by DREMT admitting the GP continuously warms to equilibrium in this thread so DREMT has debunked his own link; so there is no possible 2LOT violation in the original GPE solution.
Clearly DREMT doesn’t know what he’s writing about.
Nope. Nothing in there addresses this:
“In the first second, all of the back radiation from the GP is returned to it by the BP.
You cannote dispute this.
Then as the BP becomes warmer than the GP due to the input from the Sun, the BP returns MORE energy than the GP sends to it.
There is no point in the progression where the net energy transfer is from GP to BP.”
“Please show us where in the ‘whole picture’ does the heat flow reverse?
Also how and why it manages to do that?”
To claim that you have answered ANY of this is obviously a lie.
You cannot dispute the logic presented in the linked comment. The best either of you can do is clip a single sentence from the entire text and take it out of context.
And, you still disagree with each other, and neither of you has the integrity to admit it!
Then you personally attack me.
I will repeat – you are looking at a snapshot in time from one section of the system. You are not looking at the bigger picture. To look at the bigger picture, follow the text from the linked comment. And yes, it answers all your queries, and no, I am not lying or gaslighting.
3:52 pm: correctly whole DREMT link context set up naturally per Clausius’ eqn. 64…
It’s so simple. If, for the sake of argument, the radiation transfer between plates is not naturally permitted to occur, the plate temperatures will be BP 244 K…whatever initial GP K. If the transfer is permitted to occur, the plate temperatures will be 262 K…220 K at system equilibrium. So, we know – we literally know – that the natural radiation transfer is solely responsible for the difference between the solutions. Radiation is taking something that would otherwise be 244 K…whatever initial K, and making BP 262 K…220 K GP at equilibrium. Radiation is transferring internal energy from the cooler to the warmer naturally. Radiation is adding thermodynamic internal energy naturally making the cooler thing warmer still, AND making the warmer thing warmer still in the original GPE. If you introduced the GP at 244 K newly concocted, it would have to cool to comply with 2LOT (Clausius eqn. 64) increasing universe entropy so that the BP could warm, according to 1LOT and 2LOT. That’s energy not just spontaneously “organising” itself but being transferred by radiation in a vacuum always…ALWAYS increasing universe entropy to system thermodynamic equilibrium.
Nate asked for (DREMT) maths – here it is.
262 K – 244 K = 18 K warmer.
244 K – 220 K = 24 K cooler. DREMT shows can do arithmetic.
Introduce the GP at 244 K (DREMT’s newly concocted thought experiment) and the newly added radiation transfer from GP increases the BP thermodynamic internal energy thus its temperature by 18 K at equilibrium therefore complying with 2LOT to increase universe entropy in the process (Clausius eqn. 64) by building up internal energy inside BP, and by 2LOT increasing universe entropy GP has to cool by 24 K at equilibrium since a cooling process also increases universe entropy (see Clausius’ eqn. 64) due to the peculiarity of 2LOT.
No 2LOT violation in DREMT’s newly concocted thought experiment. DREMT has just learned (or should have just learned) that a cooling process for the GP also increases universe entropy. (No guarantees implied against a typo in this comment…).
Ball4, it doesn’t matter what temperature you introduce the GP at – if the “back-radiation” transfer (transfer from GP to BP) is not permitted to occur, the plate temperatures will be 244 K…244 K at equilibrium. Correct that mistake first, before looking at the rest of your drivel.
“…if the “back-radiation” transfer (transfer from GP to BP) is not permitted to occur,…”
If, on the other hand, “back-radiation” does occur then all the sudden, the math works, satellite insulation techniques that have been used for 70 years work, and two centuries of radiative thermodynamic physics aren’t falsified some dude trolling the internet.
So there’s that.
Trolling is an odd thing. Since the objective from the troll’s perspective is continue the “debate” there’s no motivation to budge from a clearly idiotic position because “winning” is defined solely by persistence. Since you can’t lose, there’s really no down side except for being an anonymous idiot on the internet.
Mark, you’re misunderstanding the argument. “Back-radiation” occurs. There’s no doubt about it.
You disappeared when I asked you a key question. Now you have returned, but have failed to provide an answer. Instead, you have falsely accused me of trolling.
Looks like there’s not going to be anything honest from you.
“You cannot dispute the logic presented in the linked comment. The best either of you can do is clip a single sentence from the entire text and take it out of context.”
False. I rebutted it immediately after your post.
https://www.drroyspencer.com/2026/01/uah-v6-1-global-temperature-update-for-december-2025-0-30-deg-c/#comment-1731790
And you had no response.
Then I repeated it, and you just falsely claim that you dealt with it.
You didn’t.
You have a fact problem. The facts contradict your claims. So you simply ignore those facts. And pretend they don’t matter.
But they most certainly do matter.
The facts are that the BP returns any energy sent to it by the GP. This is simple, undeniable arithmetic.
I illustrated this in the first second, when the plates are at the same temperature. The fluxes of the plates perfectly cancel.
After that, as we approach equilibrium in Eli’s solution, the BP is warmer than the GP, as you agree.
If it is warmer than the GP, then it returns to the GP MORE than the GP emitted, according to the RHTE.
Thus, logically, there is NO point in the progression when the GP is emitting MORE to the BP than it receives from the BP.
Yet this is your repeated assertion.
Clearly the facts contradict your assertion.
To continue to pretend your assertion as unrefuted, is simply dishonest.
It has been refuted.
Get over it. Move on.
No, Nate. The comment you link to is where you “clip a single sentence from the entire text and take it out of context”, as I already said. Doing so is not a rebuttal to the logic I presented. You have no rebuttal to that logic.
Now, Ball4 just said the following:
“Introduce the GP at 244 K (DREMT’s newly concocted thought experiment) and the newly added radiation transfer from GP increases the BP thermodynamic internal energy thus its temperature by 18 K at equilibrium therefore complying with 2LOT to increase universe entropy in the process (Clausius eqn. 64) by building up internal energy inside BP, and by 2LOT increasing universe entropy GP has to cool by 24 K at equilibrium since a cooling process also increases universe entropy (see Clausius’ eqn. 64) due to the peculiarity of 2LOT.“
He’s basically saying that internal energy is transferred from the GP to the BP, where it builds up at the expense of the GP. I know you don’t agree with that. Will you now have an attack of integrity, and debate that with him?
Meanwhile, the discussion has moved downthread:
https://www.drroyspencer.com/2026/01/uah-v6-1-global-temperature-update-for-december-2025-0-30-deg-c/#comment-1732574
So, take it down there if you want to continue.
“Trolling is an odd thing. Since the objective from the troll’s perspective is continue the ‘debate’ there’s no motivation to budge from a clearly idiotic position because “winning” is defined solely by persistence.”
Yep. And he makes that clear.
“No, Nate. The comment you link to is where you “clip a single sentence from the entire text and take it out of context”, as I already said.”
Not at all. The sentence I rebut is your key claim.
“It’s transferring internal energy from the cooler to the warmer.”
It stands on its own.
It is either right or wrong.
The mathematical facts I showed makes it crystal clear that it is mathematically impossible.
Thst means its wrong. That means it doesnt matter what verbiage is around it. Its still wrong.
Feel free to point out some brilliance in that post that rebuts these facts:
“The facts are that the BP returns any energy sent to it by the GP. This is simple, undeniable arithmetic.
I illustrated this in the first second, when the plates are at the same temperature. The fluxes of the plates perfectly cancel.
After that, as we approach equilibrium in Eli’s solution, the BP is warmer than the GP, as you agree.
If it is warmer than the GP, then it returns to the GP MORE than the GP emitted, according to the RHTE.
Thus, logically, there is NO point in the progression when the GP is emitting MORE to the BP than it receives from the BP.”
I know you wont find anything. But you will keep arguing anyway. Since that is the point.
“Not at all. The sentence I rebut is your key claim.
“It’s transferring internal energy from the cooler to the warmer.”
It stands on its own.
It is either right or wrong…”
…and, Ball4 agrees that it’s right. So go argue with him. Down-thread. We’re finished up here.
Nope, Ball4 cant help you with your narrative being contradicted by facts.
Your logical failures are all yours. Own them.
Down-thread your trolling starts over, as if this discussion never took place.
You never learn, and that enables endless argument, which is the goal of a troll.
Own it.
All wrong, Nate. You cannot point out any flaws in the logic I presented. Your repeated “facts” only involve one part of the system at one point in time. I keep telling you that you need to look at the big picture, but you don’t listen. The logic I have presented involves all the energy flows throughout the entire system, going through to equilibrium, in two different scenarios which are separated only by the absence or presence of the “back-radiation” transfer. That’s the starting point for the chain of logic.
I don’t need Ball4’s help, but you might. That’s why I keep mentioning that you disagree. Perhaps he can get through to you where I can’t.
And no, the debate never ends simply because you will not concede, even though you should have done multiple times over, by now. You are responsible for the never-ending debates. All I do is respond when somebody responds to me, or mentions me. I have no particular interest in speaking to you, personally.
“Your repeated “facts” only involve one part of the system at one point in time.”
FALSE and dishonest.
Again, as I explained, and you ignored:
“I illustrated this in the first second, when the plates are at the same temperature. The fluxes of the plates perfectly cancel.
After that, as we approach equilibrium in Eli’s solution, the BP is warmer than the GP, as you agree.
If it is warmer than the GP, then it returns to the GP MORE than the GP emitted, according to the RHTE.
Thus, logically, there is NO point in the progression when the GP is emitting MORE to the BP than it receives from the BP.”
“I keep telling you that you need to look at the big picture, but you don’t listen. The logic I have presented involves all the energy flows throughout the entire system, going through to equilibrium”
Thats great. Why dont you actually do that, as I did? Look at all the energy flows at various times? At any moment in time?
No you don’t do that. You only assert that you KNOW there MUST BE a net transfer from colder to warmer, based on you IGNORING the heat flow from the sun, for the billionth time.
That takes real effort, intentional ignorance.
The sun is providing 400 J each second to the BP throughout the process. And the BP is losing less than 400 J to the GP and space, throughout the process, until equilibrium.
Thus it is idiotic to suggest that the energy gained by the BP must have come from the GP!
There is no logic or evidence for it.
Are we seriously going to have the same discussion in two places in the comments at once? Jesus wept.
Look, in order to know what the plate temperatures are with or without the “back-radiation” transfer, it is necessary to understand and track all the energy flows throughout the system up until equilibrium in either case.
That’s all I need to say in response to your entire essay.
“It is necessary to understand and track all the energy flows throughout the system up until equilibrium in either case.”
Then you admit you have simply jumped to a conclusion without doing that. Youve done no accounting at any time in the process to demonstrate what you claim.
I call that progress.
Ive show uou that immediately after yhe GP arrives, the flows dont support your narrative.
Then i argued that at all times after, the BP is warmer than the GP, and I know you get that. And thus at times after, the BP sends MORE energy to the GP.
Can you dispute that? And I dont mean simply repeating your conclusion.
“Then you admit you have simply jumped to a conclusion without doing that.“
No, Nate. Wrong. I admit no such thing, because that isn’t the case. The rest of your comment falls apart accordingly.
Look at the diagram Clint linked to in the discussion down-thread. It includes all the energy flows, including the flow from the Sun. If you mentally remove the “back-radiation” arrow, and the opposing arrow that is returned from the BP to the GP, you will be left with one single arrow from the BP to the GP. That would be the situation where the “back-radiation” transfer was not allowed to proceed. The temperatures would of course be 244 K…244 K, since the two arrows you mentally removed simply cancel each other out.
I assume you don’t dispute the case where the “back-radiation” transfer is allowed to proceed.
“No, Nate. Wrong. I admit no such thing, because that isn’t the case.”
You “It is necessary to understand and track all the energy flows throughout the system up until equilibrium in either case.”
Did you track energy flows at any time? No.
None.
My statement is true. You dont have any idea about the flows yet claim to KNOW all about them.
When you lie as often as you do, you end up contradicting yourself.
“Did you track energy flows at any time?”
Yes, Nate. I’ve just explained it to you.
I understand the Green Plate Effect inside and out. If you don’t dispute that the plate temperatures would be 244 K…244 K with no “back-radiation” transfer, then you should just keep quiet. Stop accusing me of lying.
False. You simply asserted that you know what the flows were, based on no facts, just faulty assumptions.
Thats how you decide things.
But the facts of what the flows actually were, dont agree with you.
What to do? Ignore them.
Flat Earthers like your approach!
You have lost all credibility.
Nate, I just explained it to you, in two places amongst the comments at the same time. Here is the other explanation:
https://www.drroyspencer.com/2026/01/uah-v6-1-global-temperature-update-for-december-2025-0-30-deg-c/#comment-1732775
I have no idea what your problem is.
You explained that I should look again at the fantasy 3 arrow diagram and assert:
“It includes all the energy flows, including the flow from the Sun. If you mentally remove the “back-radiation” arrow, and the opposing arrow that is returned from the BP to the GP, you will be left with one single arrow from the BP to the GP. That would be the situation where the “back-radiation” transfer was not allowed to proceed.”
None of that is an accurate description of Elis solution, which as you must know by now, has two arrows, which cancel, and thus demonstrate that NO net energy transfer occurs.
If you were actually trying to do an honest accounting of the energy flows in Elis solution, you would need to acknowledge that that the arrows and numbers attached to them (that you know) do not show any heat transfer from cold to warm happening.
Thus you are unable to demonstrate a 2LOT violation.
So instead you obfuscate and talk not at all about the flows in Elis solution.
What I said to you proves that when the “back-radiation” transfer is not permitted to occur, the plate temperatures are 244 K…244 K. Do you need me to walk you through that, or can you work that out for yourself?
That is point 1), in the points 1) – 7):
https://www.drroyspencer.com/2026/01/uah-v6-1-global-temperature-update-for-december-2025-0-30-deg-c/#comment-1732629
Points 1) – 5), taken together, are the proof of a 2LoT violation in Eli’s solution.
You seem to be asking for an accounting of Eli’s solution, but that is already known. That is point 2).
Say there was a switch, which could turn on the “back-radiation” transfer, or turn it off. With the switch off, the plate temperatures are 244 K…244 K. With the switch on, and the “back-radiation” transfer allowed to proceed to completion, the plate temperatures are 262 K…220 K. The only difference is the presence or absence of that “back-radiation” transfer. Thus we know, no matter how you try to fool yourself, Nate, that the “back-radiation” transfer is solely responsible for the difference between the plate temperatures being 244 K…244 K or 262 K…220 K. So, we know that the “back-radiation” transfer builds up internal energy in the warm object at the expense of the cooler object.
You had another chance to do an honest accounting to find actual evidence of NET energy being transferred from cold to warm.
But no. Nothing is provided. Zilch.
Are we doing a Fact-free-February? Or is it a Fully-fallacious-February?
Whichever, you are not offering facts to support your fallacious claim.
Instead you provide, for the umpteenth time, debunked, failed logic:
“Thus we know, no matter how you try to fool yourself, Nate, that the “back-radiation” transfer is solely responsible for the difference between the plate temperatures being 244 K…244 K or 262 K…220 K. So, we know that the “back-radiation” transfer builds up internal energy in the warm object at the expense of the cooler object.”
No. No. NO. The second sentence does not follow logically from the first sentence. We do not know that at all.
Because you do not consider the alternative option. The one consistent with physics.
Which is that the back-radiation produces a REDUCTION in net energy transfer from warm body to cold body. NOT a reversal of the net energy flow.
That reduction in energy loss, together with the energy gain from the sun, is the cause of the build-up in internal energy in the warmer object.
And that reduction of energy transfer to the cooler body together with its ongoing energy loss to space, results in its cooling.
And no laws of physics are violated in this ordinary heat transfer scenario.
Now we can expect you will continue to play very dum and ‘not understand’ this simple, factual, logical accounting.
Wait….so, now you accept that the “back-radiation” transfer is solely responsible for the difference between the plate temperatures being 244 K…244 K or 262 K…220 K, but somehow you can’t see that this means the “back-radiation” transfer builds up internal energy in the warmer object at the expense of the cooler object!?
“…the back-radiation produces a REDUCTION in net energy transfer from warm body to cold body. NOT a reversal of the net energy flow. That reduction in energy loss, together with the energy gain from the sun, is the cause of the build-up in internal energy in the warmer object.”
Nate focuses on one half of the system, ignoring the cooling of the GP.
“And that reduction of energy transfer to the cooler body together with its ongoing energy loss to space, results in its cooling”
Then Nate focuses on the other half of the system, ignoring the warming of the BP. What Nate fails to do is look at the big picture, the whole system, and realise that the “back-radiation” transfer is building up internal energy in the warmer object at the expense of the cooler object. Lol. You can understand his confusion, but it does try your patience after a while.
Also:
https://www.drroyspencer.com/2026/01/uah-v6-1-global-temperature-update-for-december-2025-0-30-deg-c/#comment-1730217
“Then Nate focuses on the other half of the system”
All you do is tell me what I did, with no rebuttal of what I said.
Then repeat the same logic, that has just been plainly proven to be faulty!
Shameless.
You need to deal with your faulty logic:
“The second sentence does not follow logically from the first sentence. We do not know that at all.
Because you do not consider the alternative option. The one consistent with physics.”
And again you provide no numrical evidence to support your narrative, just faulty logic.
Now continue to play very dum.
Or are you actually just that dum? Its a toss up.
Nate…the second sentence does follow from the first sentence. You emphatically saying it does not, is not convincing to anyone.
It comes to something when you are in denial of simple logic!
“now you accept that the “back-radiation” transfer is solely responsible for the difference between the plate temperatures being 244 K…244 K or 262 K…220 K”
No, not at all.
Putting the GP, a blackbody, in place behind the BP blocked the radiative heat loss of the BP directly to space.
As a result, the sun was able to warm it until a new higher temperature equilibrium was reached.
Analysis of that new plate configuration requires application of the RHTE, which can be mathematically described as a 2 way exchange of energy.
Shamelessly dishonest.
You leave out this part:
“Because you do not consider the alternative option. The one consistent with physics.”
Nate, you’re still not getting it.
The GP is already there. The switch is off, so there is no “back-radiation” transfer from GP to BP – but it’s still there, receiving 200 W/m^2 from the BP, and emitting 200 W/m^2 to space. Both plates are 244 K. Then, you turn on the switch, and the GP begins radiating from the side facing the BP. If the transfer is allowed to proceed to completion, the plates end up at 262 K…220 K, and that is all due to the “back-radiation” transfer. It is quite literally the only change that was made.
“The GP is already there. The switch is off, so there is no “back-radiation” transfer from GP to BP – but it’s still there, receiving 200 W/m^2 from the BP, and emitting 200 W/m^2 to space. Both plates are 244 K. Then, you turn on the switch, and the GP begins radiating from the side facing the BP”
I see. You want the plate to be already there, so you make a magical plate with a switch. The switch off makes it non-existent plate with no properties.
IOW it is effectively not even there.
So lets just stop that silliness and go back to the real situation that we have been discussing, with the GP brought in @ 244 K.
All real black plates are opaque to radiation and radiate according to their temperature.
And the GP is opaque and radiates. That is a given aspect of the GPE problem.
It is not negotiable. We all have to live with it.
Putting an opaque black plate @ 244K behind the BP, stops the radiation from the BP from going direct to a very cold space, and instead returns the 200 W emitted by the plate on that side right back to the BP.
These are the facts we all have to live with. Even you.
That means that the total heat loss from the plate suddenly drops from 400 W to 200 W.
Again these are the numbers that we all have to live with, even you. Because the SB law is valid. And Kirchhoffs law is valid. Because blackbody plates abs.orb all radiant energy that they receive.
But the BP is still receiving 400 W of heat from the sun. Its haining 400 J each second, and losing 200 J each second.
Thus it clearly must warm. This is again, non-negotiable. We all have to live within our budget. Even you.
But there is no problem here. The energy gain clearly came from the sun. The GP’s role was to REDUCE the heat loss of the BP by cutting off its direct access to the extreme cold of space (the GP is opaque).
There is never any NET transfer of heat (net energy) from the GP to the BP. Thus no 2LOT violation can be happening here.
Again these are the facts that we all, even you DREMT. have to live with.
To suggest that a reduction in heat loss in the presence of heat source, which is as bloody normal as a human putting on a winter coat, is somehow a violation of the laws of physics is simply absurd.
To interpret a reduction in heat loss as a reversal of heat flow is BS, nonsense, absurd.
It is not credible.
Obviously you are going to again wildly hand wave, suggest magical plates exist, and repeat thoroughly debunked ill-logic, but no one here finds any of that convincing.
Because you have to live with the same facts as we all do.
It’s a thought experiment, so if I want the GP not to radiate from one side, temporarily, I can do that. All I’m doing is explaining points 1) and 2) to you in a way that you can understand. We are isolating the effect of the “back-radiation” transfer. So, all talk of “NET” is unnecessary obfuscation. We’re talking about the effect of a single transfer. That effect has been logically proven to be the build up of internal energy in the warmer object at the expense of the cooler object. Everything else is just you lying to yourself.
10:59 am: “That effect has been logically proven to be the build up of internal energy in the warmer object at the expense of the cooler object.”
No, wrong wording DREMT since the cooler GP object continuously warms to equilibrium after introduction in Eli’s GPE which is NOT a violation of 2LOT (eqn. 64) as DREMT imagines.
The wording I used is correct, as explained.
Since you’ve returned out of nowhere, having deliberately disappeared at a difficult moment for you, I assume you’re here to argue with Nate, over your disagreement. Anything else will prove your dishonesty, once again.
As predicted. Magic plates. Handwaving. Ill-logic.
The BP, all on its own, is continually gaining 400 J per second from the sun. Not debatable.
If its at a steady temperature, 244 K, then it must be losing 400 J each second. To space.
That is its heat loss. Not debatable.
Now, by putting the GP at 244K, a passive object, in its path, it suddenly is now losing only 200 J per second.
Because there is no longer a direct line of sight between it and a very cold space on one side.
It is now getting MORE from the sun than its losing, so it warms.
You keep wanting desperately to interpret what is plainly, physically, mathematically, a REDUCTION in heat loss, as a REVERSAL of heat flow.
That is not logical. Not factual.
Yes, the GP loses energy, but only to space, none to the BP.
You can keep calling it “ill-logic”, Nate, but the one thing you can’t do is refute it.
Try to focus.
We’re looking to isolate the effect of the “back-radiation” transfer. The only way to do that is to compare the equilibrium temperatures of the plates when it does not occur, with the equilibrium temperatures of the plates when it is allowed to proceed to completion.
That has been done.
The results are in.
Sorry that you don’t like the results, but that’s not really my problem.
Yes the results are in. The BP heat loss is reduced. Not reversed.
To declare that it is reversed is false, a lie. You offer no evidence for that.
No evidence means you are wrong.
Sorry.
Your wording is wrong DREMT as you’ve simply copied from somewhere else in a different application. See eqn. 64 for proof that there is no violation of 2LOT in Eli’s GPE and derive your wording consistent with the 2LOT eqn.
“You can keep calling it “ill-logic”, Nate, but the one thing you can’t do is refute it.”
I did. A bunch of times.
I showed very specifically why what you call logic, is not logical.
A reduction in heat loss is not a reversal of heat flow. This is mathematical fact.
And astute readers can see that you have not refuted this, nor even addressed it.
Gee when are you going to prove with actual math, actual numbers, that your repeated claims are true?
Astute readers, by now, can rightly conclude that you are just spreading manure.
Ball4 proves his dishonesty, as expected.
“A reduction in heat loss is not a reversal of heat flow”
Nate’s only looking at one half of the picture, again. Thinking only of the BP and ignoring the cooling of the GP. When looking at the entire system, and focusing only on the difference made by the “back-radiation” transfer, the inescapable conclusion is that the “back-radiation” transfer builds up internal energy in the warmer object at the expense of the cooler object.
It may just be that Nate’s simply not intelligent enough to get it. Or, maybe his programming runs too deep. No problem, I’m sure astute readers will understand. That’s all that matters.
Astute readers know DREMT is wrong having copied some wording that doesn’t apply to GPE since it’s perfectly ok for the GP to warm continuously to equilibrium, see eqn 64.
Proven liar and notorious climate troll Ball4 keeps on with his arguments by repeated assertion.
https://www.drroyspencer.com/2026/01/uah-v6-1-global-temperature-update-for-december-2025-0-30-deg-c/#comment-1732629
To assist in understanding points 1) – 5), we can consider there to be a switch which can turn on or off the “back-radiation” transfer.
The GP is already there, in place behind the BP. The switch is off, so there is no “back-radiation” transfer from GP to BP – but it’s still there, receiving 200 W/m^2 from the BP, and emitting 200 W/m^2 to space. Both plates are 244 K. Then, you turn on the switch, and the GP begins radiating from the side facing the BP. If the transfer is allowed to proceed to completion, the plates end up at 262 K…220 K, and that is all due to the “back-radiation” transfer. It is quite literally the only change that was made.
So, we know that the “back-radiation” transfer increases the temperature of the BP, and decreases the temperature of the GP, in Eli’s solution.
So, we know that the “back-radiation” transfer builds up internal energy in the warmer object at the expense of the cooler object.
This message will be repeated, once per day, until it is the last word on this thread.
“A reduction in heat loss is not a reversal of heat flow”
Good job quoting what your failure is.
“Nate’s only looking at one half of the picture, again.”
False. Ive discussed the reasons for the cooling of the GP many times! The reasons are the same. The heat loss that was going to the GP, and is now reduced
It continues to lise energy to space, now without full replacement.
” Thinking only of the BP and ignoring the cooling of the GP. When looking at the entire” transfer, the inescapable conclusion is that the “ system, and focusing only on the difference made by the “back-radiation” transfer builds up internal energy in the warmer object at the expense of the cooler object.”
Notice nothing in there deals with your problem: a reduction in heat loss is not a reversal of heat flow.
”
It may just be that Nate’s simply not intelligent enough”
Flat Earthers say the same thing.
” focusing only on the difference made by the “back-radiation”
Yes we understand that is what you are trying to do, so you can blame it, and only it for the BP warming, and call it a 2LOT violation.
But elsewhwere you insist that you understand that back radiation is real and must happen. You have to live with it.
By focussing on one element, YOU then miss the big picture.
The big picture has in it:
1. A steady heat source input to BP
2. An opaque GP broyght in, that blocks the path for the BP to emit heat to space.
3. Thus A reduction in heat loss output from BP.
4. 1 combined with 3 results in BP warming
5. The GP steadily losing heat to space.
6. The heat loss of BP to GP is 0.
7. 5 combined with 6, the GP cools.
It is not logical to ignore these events, and cherry pick one thing and treat it as if it is happening in isolation.
Now we expect you to continue to do just that.
Notice how Nate fails to quote from, or respond to, my 4:52 AM comment…because he cannot refute it.
Instead, as usual, he repeats his error of looking at only one half of the picture, and ignoring the cooling of the GP, and then he looks at the other half of the picture, ignoring the warming of the BP! He can’t quite just put the whole thing together and see that the “back-radiation” transfer builds up internal energy in the warmer object at the expense of the cooler object. Shame. So, he gets frustrated, and starts lashing out.
“When looking at the entire transfer, the inescapable conclusion is that the system, and focusing only on the difference made by the “back-radiation” transfer builds up internal energy in the warmer object at the expense of the cooler object.”
You are reaching new heights of self-contradiction, captured in this one sentence.
You stress that I need to look at the big piture. The entire transfer.
To do that I need to FOCUS on only one element, the ‘back radiation’.
By focussing on one element, you enable yourself to neglect the rest of the system!
And entirely miss what is happening
That the heat source is providing the heat that builds up the internal energy in the BP.
Not the cold GP.
It is breathtaking.
Nate is now misquoting me! Unbelievable.
DREMT 4:52 am still gets thermodynamics wrong: “So, we know that the “back-radiation” (radiative) transfer increases the temperature of the BP, and decreases the temperature of the GP, in Eli’s solution.”
No DREMT, humorously you always miss the GP continuously warms to equilibrium once it is introduced in Eli’s GPE; that’s not a violation of 2LOT (eqn. 64) in any way. Entertaining to read DREMT repeatedly expose his science failures.
“Instead, as usual, he repeats his error of looking at only one half of the picture, and ignoring the cooling of the GP, and then he looks at the other half of the picture, ignoring the warming of the BP! He can’t quite just put the whole thing together”
Absurdly FALSE. I look at the whole picture. YOU look at one part only.
Nothing at all in there addresses your repeated falure:
Which is obvious: You mistake a REDUCTION in heat loss with a REVERSAL of heat flow.
You are just presenting yourself as a stubborn old fool.
Keep it up.
“No DREMT, humorously you always miss the GP continuously warms to equilibrium once it is introduced in Eli’s GPE…”
…I don’t miss a thing. Eli obviously tried to hide the 2LoT violation by introducing his GP at some unspecified temperature below 220 K. Have it introduced at 244 K, a more realistic starting temperature for a plate at that distance from the Sun, and Eli’s solution would have it dropping in temperature.
Notice how Nate deliberately avoids discussing the fact he misquoted me, and still does not quote from or respond to my 4:52 AM comment, which he cannot refute. Now, he’s confused himself by believing that I’m not seeing the big picture, just because I’ve pointed out that we’re trying to isolate the effect of the “back-radiation” transfer. To isolate the effect of that transfer, you need to look at the bigger picture, not just look at one half of the system at a time, as he does.
He’ll never get it. Oh well.
“To isolate the effect of that transfer, you need to look at the bigger picture, not just look at one half of the system at a time, as he does.”
Just pouring gobbledegook on top of a dog pile.
It just stinks.
Sure 10:37 am, GP then continuously cools to equilibrium in DREMT’s restatement of Eli’s GPE since a cooling process also increases universe entropy as you’ve been told for no violation of 2LOT (see eqn. 64). Entertaining to read DREMT keep exposing his failures of thermo. science.
“Eli obviously tried to hide the 2LoT violation by introducing his GP at some unspecified temperature below 220 K.”
Again, the scientists must be lying to you. Flat Earthers agree!
The other possibility, that the scientists know what they are talking about, and it is you are misunderstanding, shall never never be contemplated.
Sorry guys…as much as I enjoy your feeble attempts at cyber-bullying, I decided to share this with more people:
https://www.drroyspencer.com/2026/02/uah-v6-1-global-temperature-update-for-january-2026-0-35-deg-c/#comment-1733263
Yep, now more people can see that you are quite bonkers.
Nate’s gaslighting intensifies.
anon…”She wasn’t much of a mum was she. Believing that she could stalk federal agents, impeded them in the duty etc”
***
Come on, man, she was just mouthing them off. Since when is murder a justification for a woman being sassy.
In a recent altercation, a guy was in the face of an ICE agent goon, who looked the part, and you could see the goon twitching, trying to decide whether or not to pull his gun. Fortunately, another ICE agent pulled him away. Why could they not have done that with the young woman?
Kristi Noem, the head of Homeland Security, who I regard as being far more dangerous to democracy, had her written off as a subversive without a single fact. They are currently investigating the murdered woman as such, which I regard as a politically-motivated cover up. Meantime, there is talk of impeaching Noem for her callous disregard for the office and its mandate.
The facts are clear, based on the video we all saw, including you hopefully. She did absolutely nothing, by the standard of US democracy, that justified her being brutally murdered.
If there is any justice, the ICE agent will be prosecuted for murder. You simply cannot kill someone in a democracy because you disagree with them or their actions, unless that action threatens the agent. That cannot be claimed here because the woman’s vehicle had already cleared and passed the agent when he foolishly decided to shoot her from behind.
I have stated in a previous post, that ICE was out of their jurisdiction and their mandate in accosting this young woman. They had no business confronting her, they should have called a local police officer to intervene. They had her license number, all they had to do was report it to local authorities.
The city is now suing the Feds for having ICE there and acting as they did.
“If there is any justice, the ICE agent will be prosecuted for murder.”
Nope. The No-Justice Dept decided there will be not even be any investigation of the agent’s action.
Trump has lost Joe Rogan, and his many young white male listeners.
Sympathising with the anti-ICE protests:
“You don’t want militarized people in the streets just roaming around, snatching up people — many of which turn out to be U.S. citizens that just don’t have their papers on them,”
“Are we really gonna be the Gestapo, ‘Where’s your papers?’ Is that what we’ve come to?”
Nate, please stop trolling.
I can see you are not interested in this topic. Then there is no need for you to post here.
That is how the internet works. Really how all human interactions work.
With exception of trolls..
No, Nate, I said “please stop trolling”.
And still, failing to recognize that posting purely to make ad-hominem attacks on someone, is the essence of trolling.
Just for once, stop trolling.
You’re still not getting it, Nate. Please stop trolling.
https://arxiv.org/pdf/2511.21840
HITRAN2024 is finally here!
The long-awaited methane update has been released. Marking a genuinely consequential advance for atmospheric spectroscopy, this release substantially elevates the fidelity of radiative transfer calculations and satellite retrievals.
For those working on methane monitoring, climate attribution, and planetary atmospheres, this update is a foundational upgrade that will quietly but decisively improve results across the field.
Arkady, please stop trolling.
It’s interesting to watch the cult kids band together to support this woman that attempted to harm the LEO. His body cam video clearly shows her driving into him. She was shot from the front, not from behind as gordon claims. Truth and reality has little meaning to the cultists.
Hey Puffman, riddle me this –
https://icelist.is/
Do you think our Ivy Leaguer will “both side” DoJ’s memo according to which it deemed “unnecessary” to conclude whether seizing Maduro violated law?
“that attempted to harm the LEO. His body cam video clearly shows her driving into him”
You’ve been successfully gaslighted.
She was clearly not acting in a threatening way AT ALL.
HIS cellphone cam (he had no bodycam) clearly shows her turning the wheel of the car away from him, at 44 s in his video.
https://www.bbc.com/news/articles/cz7yv4524gqo
She was driving at slow speed, he had plenty of time to get well out of the way.
Judging from this bullet hole, he was to the side of the vehicle when he fired.
https://www.baltimoresun.com/wp-content/uploads/2026/01/AP26007639272103.jpg?w=525
Our resident arbiter of who is deluded now invents bodycam footage that has not been released, if there even is any.
What we do see from many images is that he was not knocked over, and was able to get off shots into the passenger side window as the car swung AWAY from him. We see him walking casually to and away from the vehicle he just murdered the driver of.
Which shows Trump’s flat out lie that she ran him over to be flat out false.
The agent’s phone footage is what we have, which is pointed upward at the time of the alleged grazing he got from the car.
Trump and MAGA are so addled with lies they wouldn’t see the truth if it shot them to death through a car window.
barry, please stop trolling.
” His body cam video clearly shows her driving into him. ”
When you are dumb and perverse enough to exclusively look at official sources like this:
https://en.wikipedia.org/wiki/File:Killing_of_Renee_Good_DHS_agent_perspective.webm
there is no wonder that you then only can write things which have nothing to do with the reality, let alone with the truth.
Clint R should have a look at this source (which he probably might dismiss as ‘fake’- I wouldn’t wonder):
https://www.nytimes.com/video/us/100000010631041/minneapolis-ice-shooting-video.html
*
It is absolutely clear from the little emphasis window drawn around her car’s front-left wheel that Renee Good never has had the intention to endanger the brute force killer who deliberately shot her dead without any reason other than his full lack of self-control.
Quite the opposite is true: she visibly turned right with her car to avoid him.
*
Moreover, just a few hours after Renee Good was shot dead by the ICE agent, the Trumping boy wrote on his ‘Truth’ channel about her that she was ‘very disorderly, obstructing and resisting, who then violently, willfully, and viciously ran over the ICE Officer, who seems to have shot her in self-defense’.
That alone was a bunch of disgusting lies, but it is not my point here.
My point is that a few days later, the very same Trumping boy suddenly ‘suggested’ that Renee Good’s ‘highly disrespectful’ attitude toward law enforcement played a role in her fatal shooting by an ICE agent!
Aside from the fact that even in harsh dictatorships like Russia, Belarus, or China, one is not shot dead simply for behaving disrespectfully towards even a secret police officer, the Trumping boy’s choice of words should make it clear that he himself no longer believed the false claim that Renee Good tried to attack the ICE agent with her car.
*
The fact that Minnesota’s Bureau of Criminal Apprehension (BCA) said the FBI had initially agreed to a joint investigation with state officials, but then reversed course and denied the state access to materials and evidence: that already stinks a lot.
But when we read that furthermore that Justice Dept. experts on police shootings have been left out of the Minneapolis shooting probe: that is definitely too much.
It reminds me so many discussions I had with people aged like me, who got told from their parents about what happened in Germany between 1928 and 1933.
*
But maybe people like Clint R and some other strange guys infesting this blog with their fascist thoughts don’t have any problem if under the Trumping boy and his hench(wo)men, the US slowly move into an authoritarian dictatorship.
Even that video clearly shows her driving toward him. She was shot from the front, not from behind as gordon claims. Truth, and reality, has little meaning to the cultists.
Even more interesting is none of these “concerned” kids supported the female killed by Capitol Police, years ago. She was an Air Force Veteran, with no lethal weapon. But the Leftists didn’t support her because she too decent.
Her family got about $5 million in a settlement.
Clint R
” Even that video clearly shows her driving toward him. ”
You are a disgusting liar. Nothing new to me, however.
Bindi, when you cult kids call me names, like “disgusting liar”, “lying dog”, “Nazi”, or some such, just proves how immature and empty you all are. Which proves me right.
And, I really like being right!
You ARE a liar, Clint R, and you are NOT right.
But… I never would call you a ‘Nazi’; it is in fact rather your good friend-in-denial Stephen Paul Anderson who calls ME so.
Keep proving me right, Bindi.
I can take it.
Hey, Puffman, riddle me this –
The city of Minneapolis said a 6-month-old infant and a juvenile were hospitalized Wednesday night after federal agents reportedly fired tear gas at a vehicle.
According to the city, the Minneapolis Fire Department was called to the 600 block of 23rd Avenue North at 9:20 p.m. for a medical emergency.
https://kstp.com/kstp-news/top-news/tear-gas-deployed-by-federal-agents-reportedly-hospitalized-a-6-month-old-infant-and-juvenile/
How will you be able to flip this?
“Love has never been a popular movement. And no one’s ever wanted, really, to be free. The world is held together, really it is held together, by the love and the passion of a very few people. Otherwise, of course, you can despair. Walk down the street of any city, any afternoon, and look around you. What you’ve got to remember is what you’re looking at is also you. Everyone you’re looking at is also you. You could be that person. You could be that monster, you could be that cop. And you have to decide, in yourself, not to be.” — James Baldwin
“Even more interesting is none of these “concerned” kids supported the female killed by Capitol Police, years ago. She was an Air Force Veteran, with no lethal weapon. But the Leftists didn’t support her because she too decent.”
Gee, a right winger denying the right to shoot someone who is violently breaking into your house?
Or the right of a bank guard to shoot someone violently breaking into his bank.
In this case, the ‘house’ is full of Congress people, who the cops are there to protect.
Interesting double standard you apply there.
Nate, please stop trolling.
I’m not exactly known for praising Robertson: His constant pseudoscientific arguments and lies get on my nerves (and not just mine).
But today I’ll make an exception: I applaud his upright stance on the brutal murder of Renee Good, which is reminiscent of fascist dictatorships, not of a nation we thought would uphold democratic principles.
Bindidon: Those brainwashed far-left protestors are like members of Stasi, the infamous secret police of East Germany. They collect information like agent’s name, address, family members, friends, etc. Then they start to persistently harass those agents especially with malicious intent. These paid violent protesters are criminals. You don’t step on the pedal when you have officers surrounding your vehicle and especially if you have one right in front of your car.
MaxC
You don’t have the least clue about was the STASI has been.
I live in Germany since 50 years, spent decades in Western Berlin and live since 2000 50 km south of Berlin.
My lady’s family is spread around Berlin, and we visited many of these people between 1980 and 1989 (the Wall’s breakdown); we were perfectly informed about the political terror installed by the Eastgerman regime as a smaller but perfect copy of the USSR’s KGB.
*
Here is the top of the English Wiki page
https://en.wikipedia.org/wiki/Stasi
which can inform you about STASI and how disgusting you are when comparing people in the US who get sad of being invaded, threatened by what is becoming a kínd of US secret police.
*
” The Ministry for State Security (German: Ministerium für Staatssicherheit, abbreviated MfS), commonly known as the Stasi (an abbreviation of Staatssicherheit), was the intelligence service and secret police of East Germany (the German Democratic Republic) from 1950 to 1990. It was one of the most repressive police organisations in the world, infiltrating almost every aspect of life in East Germany, using torture, intimidation, and a vast network of informants to crush dissent.
The function of the Stasi in East Germany resembled that of the KGB in the Soviet Union, in that it served to maintain state authority and the position of the ruling party, in this case the Socialist Unity Party of Germany (SED). This was accomplished primarily through the use of tens of thousands of civilian informants called unofficial collaborators, who contributed to the arrest of approximately 250,000 people in the GDR alone. It also had a large elite paramilitary force, the Felix Dzerzhinsky Guards Regiment, that served as its armed wing. Known as “the shield and the sword of the party”, the Stasi locked up opponents of the regime. Officers tortured prisoners by isolating them, depriving them of sleep and using psychological tricks such as threatening to arrest relatives. ”
*
You are such a a ridiculous, useful idiot, behaving like ultra far right people at WUWT, who insulted me a decade ago as a GESTAPO guy just because I oppoosed my technical knowledge to their polemical ignorance.
*
What you apparently don#t want to see is that not the people protesting against ICE are the violent people: the ICE guys are the violent people who remind me the brutality of secret police all around the world.
*
I wouldn#t wonder if you too were a walthy, far right thinking person who has nothing against ICE brutally arresting anf threatening immigrants.
*
I also never will forget the Spanish Guardia Civil henchmen who terrified the population in Spain during Franco’s dictature till 1975. I have been there, MaxC; were YOU?
*
Finally, my personal impression is that you have no idea of
– what a dictatorship really is
let alone
– how it begins to exist and subsist.
You might like:
ICE unleashes ONSLAUGHT of flash bang grenades and chemical ammunition at unarmed Minneapolis protesters in WAR-LIKE attack. Several protesters struck. Our reporter
@zdroberts.bsky.social struck in the head.
“I got hit in the head really bad.” LIVE NOW
https://bsky.app/profile/statuscoupnews.bsky.social/post/3mcgmkpcbnk2a
You might also like:
Four Oglala Lakota men kidnapped by ICE in Minneapolis have finally been located. One of them was released but the other 3 are being held at Fort Snelling, a former concentration camp used to imprison Native people incl. the Dakota 38 during Dakota Wars.
https://ictnews.org/news/north-central-bureau/four-oglala-detainees-located-three-still-in-ice-custody/
ICE abducted and injured (bruised cheek) a 1-year old who is the daughter of a US citizen detained as part of a Kavanaugh Stop.
https://abc7.com/post/federal-agents-allegedly-drive-off-baby-car-father-detained-cypress-park-raid/18140560/
Dozing Donald:
https://bsky.app/profile/atrupar.com/post/3mcfuvabfbb2f
“Even Chavez was elected democratically, but he used democracy against democracy in order to remain in power. That’s not really the intent of democracy.” — Carlos Gimenez
Willard: Instead of bullets and pepper spray, ICE should use non-lethal sonic weapons like LRAD. American forces used LRAD successfully in Venezuela and wiped out hundreds of fighters without losing a single soldier. This technology is mainly used for crowd-control purposes.
Max,
Instead of pushing Puffman’s DARVO, you should have tried to support our Ivy Leaguer’s bothsidesism:
https://www.thenation.com/article/society/minneapolis-ice-shooting-renee-good/
This will remain your most memorable contribution to this blog. So perhaps you should try to come back under another sock puppet? It worked so well for Puffman.
All this not to release the Epstein file.
Meanwhile, have some special accomplishment tokens:
https://bsky.app/profile/zooples.bsky.social/post/3mcgwwbl7gk2f
“It was not Hitler or Himmler who abducted me, beat me, and shot my family. It was the shoemaker, the milkman, the neighbor, who received an uniform and believed they were the master race.” — Karl Stojka, Auschwitz survivor.
MaxC
You are maybe an avid viewer of NewsMax, where nothing has to be supported and everything they claim is true? What is your evidence of “paid violent protesters and criminals”?
That you can support the current tactics of ICE as acceptable shows you do not understand the USA system at all. From what I see the nasty tactics of ICE agents (I have watched many videos) is the only thing provoking protests. Decent US citizens that are watching our Nation turn into a Fascist Authoritarian Government with armed guards using terror tactics to keep any dissent quiet. Either you are a Russian Troll or a sad human! You should be protesting this horrid ICE tactic yourself if you care about the health of the USA!!
The trio of Willard, Norman, and Bindi gang up on MaxC. But I doubt MaxC is concerned as three times zero is still zero.
Hey Puffman, riddle me this –
Former Senate Republican Leader Mitch McConnell (Ky.) warned in a speech on the Senate floor Wednesday that Dozing Donald’s talk of seizing Greenland by force threatens to “incinerate” the nation’s long-standing ties with NATO allies.
https://thehill.com/homenews/senate/5689375-mitch-mcconnell-trump-greenland-threat/
How many clowns can your bandwagon fit, two and a half?
“KEEP PROTESTING – TAKE OVER YOUR INSTITUTIONS!!!” – Dozing Donald
Willard: Greenland is a Danish overseas colony. Greenland belongs to inuits, so let them decide. If Trump pays 100.000 dollars per head as promised, it may help to make the right decision. Anyway, there should not be colonies in the 21st century.
Max,
I’ll raise you Puorto Rico and all the other Murican territories, so you’re once again overplaying your hand.
Here’s where this is going:
https://www.toptradersunplugged.com/podcast/when-capitalism-reboots-and-crashes-again-ft-mark-blyth/
Angrynomics has already been tried. It failed so hard millions of people died.
You’re just a sucker who defends the concentration of power.
” Anyway, there should not be colonies in the 21st century.”
Such as Puerto Rico? Guam? US Virgin Islands? You would add Greenland to those?
I assume you would also agree that there should not be military agression, or threats of it, to take other countries’ territory (Greenland), or natural resources (Venezuelan oil) in the 21st century.
It is shocking that in the 21st century, many European countries are just now sending some troops to Greenland to discourage the United States from threatening it.
Is this strange MaxC guy stupid, naive or brazen?
No idea.
Maybe he has a look at
https://www.youtube.com/watch?v=G4N3r16NWuY
and then reads the comments written by people having watched this video.
*
Here is what we read about Greenlanders’ meaning about the Trumping boy’s megalomaniacal idiocy:
” Between Greenland’s icebergs and the Northern Lights, the atmosphere is anything but idyllic: US President Donald Trump’s repeated demands that Greenland become part of the United States have thrust the island into the global spotlight. Trump’s recent announcement that they are “about to do something to the island, whether they like it or not” has put the inhabitants on high alert.
“Make America go away”
The message from the people is clear: a sale is out of the question. Many Greenlanders fear that a US takeover could jeopardize their rights as an indigenous people. Their cultural identity is at stake.
Despite the Greenlanders’ difficult relationship with Denmark—the island was formerly a Danish colony—a large portion of the now largely autonomous country also does not want to be part of the US. ”
*
The US and its current dictator will invade Greenland whether the US people (except the MAGA idiots of course) like it or not.
*
MaxC’s 100,000 dollar nonsense is of such a stupidity…
Bindidon:
> MaxC’s 100,000 dollar nonsense is of such a stupidity…
That would be less than 6000 millions of dollars. That is pocket money for the US. Nonsense or not, it may work.
FREE Kalâtdlit Nunât aka FREE Greenland!
Bindy, is this yet another area that you think you have all the Answers?
There are a number of people of Greenland who would prefer USA to the EU.
It also depends if the USA wants a decent military base to protect USA, Greenland, Iceland, and Europe from the Russians.
Oh the propaganda runs deep in this one.
“Max” is pre-defending a military takeover of Greenland by selling the soft-shoe per capita “purchase.”
Come on, Max, tell me I’ve got you all wrong. Say out loud that you think the US taking Greenland vby force would be a criminal act of international aggression.
Then we might take your notions of buying the country from the citizens (????) as being something more serious than one of various fig-leaf nothingburgers to justify US right to take Greenland by any means.
Because of the US just decided to take the country militarily, you’d go along with that, wouldn’t you?
Tell me if i’m right about that, please? Make a clear statement, I challenge you.
Bindi, Nate, Willard, barry, Norman, and all the other cult kids, are so far behind it’s not even funny. Their TDS has them running in circles. Trump is playing 12th Dimensional Chess and the cult kids can’t even learn to play checkers. Trump wins before they figure out the game has started.
Just like with Maduro….
Clint R
Most certainly you are as deluded by Trump’s constant lies as you are self-deluded in thinking your nonsense science is in any way valid. You can’t understand insulating effect and your limited thought process cannot understand how the Moon rotating on its axis once per lunar orbit keeps the same side of the Moon facing Earth. But the Sun knows it rotates once around 28 days. Hence 14 days of light and 14 days of night. No one can convince you of your ignorance. But you are quite the child brain. You have never grown up.
Norman, I can see you are suffering from cognitive decline. I hear they have some new medications now that are very effective. You should consult a specialist.
Get help.
Hey Puffman, riddle me this –
Tired: Committing fraud, getting a pardon by Dozing Donald
Wired: Committing fraud again, getting a pardon by Dozing Donald again
https://bsky.app/profile/jeisinger.bsky.social/post/3mckrk4mqxc2e
Did you know that in 1943 Knut Hamsun sent his Nobel medal to Joseph Goebbels as a token of his admiration?
” Bindy, is this yet another area that you think you have all the Answers? ”
Again a post from QAnon which shows thew level of his ignorance and stupidity.
QAnon apparently is one of these incompetent BREXIT fans who all hate the EU.
*
” There are a number of people of Greenland who would prefer USA to the EU. ”
Show us numbers instead of your thoughts. From what I have read in six different newspapers, at best 8% of the Greenlanders would accept to become Second Class Americans like Alaskians and Puerto Rico people.
*
” It also depends if the USA wants a decent military base to protect USA, Greenland, Iceland, and Europe from the Russians. ”
Completely dumb stuff: Denmark and the USA signed in 1951 a widespread military cooperation including the possibility for the US to install an arbitrary number of bases.
During the Cold War, over 20 were active; now, only Pittuffik aka Thule still is.
According to the cooperation statements, the US could restart all their military bases at any moment.
The Trumping boy has no interest at all to protect anything let alone anyone: all he wants is to show he is the greatest president of all times inside and even outside the US.
*
Do you know how many of the REP voting Americans are strictly against Greenland’s occupation through US?
Bindy Brownshirt, I thought you promised me that you weren’t going to read my post. So yet again you prove that you don’t have any connection with the truth.
QAnon insults me as ‘Bindy Brownshirt’.
That’s the very best.
Brownshirts are – regarless whether in the US, UK, Netherlands, France, Germany, Italy, Spain – everywhere the same ultra far right people who still today openly or secretly admire Hitler, Mussolini, Franco etc, hate democracy and love all authoritarian regimes.
I have nothing in common with such pack.
But when I look at how QAnon posts about e.g. Renee Good’s killing by the ICE ‘agent’, I understand that he must have much in common with German neofascists who all admire both the Trumping boy and Putin.
Bindy Brownshirt,
Socialism has been refined into communism, fascism, and national socialism workers party, and in the UK in to new Labour.
Nothing to do with individualism which is something I respect. The socialist parties listed above are all to do with groups, not individuals.
You might have noticed it is the democrats in the USA that are pushing the extreme version of climate change. They like you seem to want very selective adherence to science, and at other times totally ignore even the basic basic facts of biological science. Look at who founded Jim crow laws, kkk and trail of tears.
There are many issues about the Climate Change scenarios that you lot push and totally ignore that is the problem.
Ignoring urban heat island and orbital shift is blinkered
Max clearly not up to the clear and honest challenge.
barry, please stop trolling.
Stock market at record highs today.
And there is also this:
https://www.youtube.com/shorts/FILdeZECZUU
Stock markets hit record highs under numerous presidents dozens and hundreds of times. 66 times in 2021 alone.
You might as well say summer happened during Trump’s presidency and give him a tick for it.
You really are a colossal eejit.
If you want to check the pulse of the economy you look at a raft of indicators, job growth and cost of living being front-runners.
Explanation for cult kids: Stock market hit record highs even after all the dire predictions about tariffs from the incompetents.
Reality strikes again….
Hey Puffman, riddle me this –
nazis.us
Why are you confusing stock markets with economies, and which part of “the more money you print and the less you tax the rich, the more stonks go up” you do not get?
“ICE agents, get out now because historically, this ends with you hanging from a lamppost and your body paraded through the streets.” — Matt Nelson
The stock market hit record highs during 2020, when the rest of the economy was in recession due to COVID.
The stock market is not a good indicator of broader economic health, you hopeless, feckless shill.
Furthermore, Trump backed away from the ridiculous ‘reciprocal’ tariffs and other high tariff threats, which would have increased the burden on Americans purchase power. Predictions about these enormous tariffs – which you defended – didn’t eventuate.
The moronic MAGA cult dutifully about-faces whenever Trump flips, or courts reject his plans, protesting that it was always his brilliant plan all along. Talk about a cult.
barry, maybe this will help:
https://www.drroyspencer.com/2026/01/uah-v6-1-global-temperature-update-for-december-2025-0-30-deg-c/#comment-1729108
Hey Puffman, riddle me this –
Charity says superrich 4,000 times more likely to hold political power than others, and own all social media companies, in report released to coincide with the opening of the WEF’s annual meeting in Davos.
https://www.aljazeera.com/news/2026/1/19/billionaires-have-more-money-and-political-power-than-ever-oxfam-says
Do you think you’ll get richer if the absurdly rich gets absurdly richer?
“If we let you see your clients, we would have to let all the attorneys see their clients, and imagine the chaos” — An ICE agent, who may not have passed his Constitution 101 course.
Willard, please stop trolling.
“When you think of it, we shouldn’t even have an election.” — Dozing Donald
Willard, please stop trolling.
https://www.foxcarolina.com/2026/01/15/greenville-county-schools-confirms-measles-case-elementary-school-2-schools-exposed/
[Readers should be aware that the following commenter is director of a WWF-funded climate change advocacy program in India. So, his connection to Canada is being misrepresented. -Roy]
Like all the best Americans, I’m Canadian, and while I have lived abroad for most of my life, I still hew faithfully to our folkways, which is why I’d like to start this comment by apologizing.
Trump’s sales pitch to morons was “America is so strong, why do we let all these foreign nations walk all over us,” completely misunderstanding how all the systems he is ripping up existed for America to walk all over other nations.
Folly (stupidity) is a more dangerous enemy to the good than evil. One can protest against evil; it can be unmasked and, if need be, prevented by force. Evil always carries the seeds of its own destruction, as it makes people, at the least, uncomfortable. Against folly we have no defence. Neither protests nor force can touch it; reasoning is no use; facts that contradict personal prejudices can simply be disbelieved; indeed, the fool can counter by criticizing them, and if they are undeniable, they can just be pushed aside as trivial exceptions. So the fool, as distinct from the scoundrel, is completely self-satisfied; in fact, he can easily become dangerous, as it does not take much to make him aggressive. A fool must therefore be treated more cautiously than a scoundrel; we shall never again try to convince a fool by reason, for it is both useless and dangerous.
Arkady: I loved your fictive story. Hope you like this sequel to your story:
Then I woke up when a kamikaze drone exploded near the bunker I was sleeping in. We came from America to Russia in search for a better life. FSB said we are foreign agents and sent my wife and kids to Siberia and I was sent to Ukraine. They say I have 24 hours to live. In the US we had a large seaside house in California and I had my own multi million dollar business. People said I have no future in the States. Russia’s and China’s diverse and multipolar world is an alternative to US/NATO hegemony and the basis of the New World Order. In the morning there will be another meat wave against Ukrainian front. Tell my wife I love her very much.
“FSB said we are foreign agents and sent my wife and kids to Siberia ”
Sounds a lot like
US citizen says
“Masked ICE agents grabbed and handcuffed my wife, threw her forcibly into a truck, said she was illegal, took her away to a concentration camp in Florida, or Louisiana, or Guatemala, I don’t know which.”
Nate, please stop trolling.
anon…”Bindy Brownshirt,
Socialism has been refined into communism, fascism, and national socialism workers party, and in the UK in to new Labour.
Nothing to do with individualism which is something I respect. The socialist parties listed above are all to do with groups, not individuals”.
***
Here again, I agree with Binny. The brownshirts were right wing goons used by Hitler to force his policies on the German public. In the end, as they got braver and braver, he had to disband them, forming the SS, a military version who were far more dangerous. However, they were lead by goons like Himmler. who was fanatically devoted to Hitler.
No true socialist would have such views. The ICE goons are Trump’s version of Hitler’s Brownshirts. There is no good reason why border agents should be wearing combat fatigues and masks. And there is zero reason why they need to manhandle old women and murder harmless women driving cars.
The origin of Left and Right wing in politics had nothing to do with socialist, communists, and capitalists. It referred to the French assemblies pre revolution where the status quo sat on the right and the revolutionaries on the left.
Ergo, the Left is a reference to revolutionaries. Since the US was formed on the same kind of revolution, not to mention civil disobedience, It stands to reason you Yanks are all a load of Left wingers.
Seams to me you Yanks have turned into a load of wusses, especially those of you who support Trump. In the day, US citizens would have kicked his sorry butt out of there.
I urge you to do some proper research on the real meaning of socialism. It’s about a revolt in the working class against right-wing zealots who were severely oppressing them. I doubt my urging will do any good since you sound idealistically devoted to your distorted views.
Your definition of socialism is wrong. Socialism began as a workers’ movement in Europe several decades before Marx produced his manifesto with Engels. Marx refused to call his movement socialism, so where do people get off referring to his work as such? True socialism has always worked within the framework of democracy and the reason is obvious. Workers benefit under democracy and would be oppressed under a fascism.
The basis of early workers’ movement via unions relied on civil disobedience. Company owners resorted to brutality and murder to force them back to work but the workers prevailed through bravery and their need for change. Today, we are benefiting from better wages and conditions, pensions, unemployment insurance, Medicare, worker’s compensation, and womens’ rights.
No capitalist would ever have willingly offered such benefits, they had to be dragged screaming into it. The question arises as to why most capitalists in the era of Marx were so mean spirited and black-hearted that they would force children into coal mines.
Those are the people you are supporting.
Communism as defined by Marx is an extreme left wing of socialism. He advocated the overthrow of right-wing governments but his vision was a democratic society after the despots were deposed. It should be noted that any country claiming to have imposed communism had never considered a democratic form of communism. Those countries claiming to be communists states were nothing more than fascists using the name to cover their despotic tendencies.
I don’t agree with any of Marxs’ vision or the views of rabid mobs who incorrectly call themselves socialists. I also disagree with the methods being employed by Trump, who is thumbing his nose at the US Constitution and the US Court. Anyone who supports him in this would have gladly and blindly supported Hitler in Germany during the 1930s.
Your definition of socialism clearly came from right-wingers trying to discredit it. The USSR called themselves socialists but only to give the incorrect impression that they were a workers’ movement. Ironically, Mao considered a form of democratic socialism as an intermediate step.
Any country that has claimed a communist state were being facetious at best. They were actually the types who as a small minority, tried to impose their views on others. We still have those clowns around today, on both sides of the political spectrum. Those pushing climate change theory are of that ilk as are those trying to allow men into womens’ washrooms and onto womens’ sports teams.
I agree with you re the Democrats who lost to Trump because they were pushing the Woke culture. Trump calls them left wingers and he is wrong, they are the politically-correct. Ironically, he is practicing the same kind of medicine by forcing his limited views on the US public.
The current Labour government in the UK is not even a socialist government. I cannot stand the gutlessness of the current leader, Starmer. He is as gutless as Neville Chamberlain, who talked a good talk while Hitler ran over Czechoslovakia and Poland.
Here in Canada. the socialist governments in Manitoba and BC have sold out to special interest groups. Not a socialist bone in their bodies, having abandoned the working man to University poofters and their fairy tale universe.
gordon can’t face reality. So he just clogs the blog with his ongoing nonsense.
The modern Left is nothing more than a cult. It’s no longer Right vs. Left. It’s Right vs. Wrong.
https://www.youtube.com/watch?v=0ow8YcuJwM0
Gordon Robertson
I tend to agree with the points you posted. I totally disagree with Clint R who wants an Authoritarian system. He thinks he will not be affected. Germans FAFO what happens when you think you can do anything you want and not have to face consequences. USA MAGA (people like Clint R that worship Trump) is not itelligent enough to learn hard lessons from History! Thankfully a couple Republicans are telling him NO! On Greenland. Clint R llacks the thought process to see this.
Norman, you have to make up nonsense about me because you’re ignorant of science.
Clint R
Since you bring it up, what science am I ignorant of? I know you have no valid support for any of your claims. I support all my claims with valid science. Do you know what your counter-comment is to my valid supporting evidence “a link Norman does not understand”
Not a really good response as it fails completely in any type of intellectual ability on your part to critique or point out any flaws in my posts (except fat-finger spelling errors). If you were a valid science person you would support your claims but you are not able to. You would also give detailed science of what is wrong with my supporting evidence and how it does not confirm by statements but all you know how to do (not just with me but others) “a link they do not understand”. Why do you think this makes your posts seem intelligent. I think 90% of the posters here do not think you are a credible poster in any field of science. You have one supporter who does not know science DREMT. Not sure about many others. You will have zero percent scientists supporting you. Email a college professor in physics and explain to him why he is wrong in knowing the Moon spins on its axis once per orbit. If you fail with one try others. See if you find any educated people who support your childish claims. You won’t find even one. DREMT is not a University Professor.
I do have a science degree though, Norman. So you can keep on saying I don’t “know science” but you would be wrong. I know it, love it, support it and can’t stand to think what will happen to it once it’s universally accepted and understood that there was never any GHE. The public’s faith in science will be forever tainted. Shame. But, that’s what happens when you let politics interfere with science.
Norman, as with all you cult kids, you can’t support your false beliefs. For example, you have no viable model of “orbiting without spin”.
You kids can’t understand that insults, false accusations, and endless rambling ain’t science.
Hey Puffman, riddle me this –
Third immigrant detainee at facility in El Paso has died, ICE says
https://www.nbcnews.com/news/us-news/third-immigrant-detainee-facility-el-paso-died-ice-says-rcna254783
Would you call someone you locked someone a detainee, and if they died would you say it’s just death?
Some might argue it’s rather kidnap and murder.
“Ukrainian intel services sent false strategic info to US intel services…and observed that the information has been relayed to ZZs and was used by ZZ forces.” — LCI
” I do have a science degree though, Norman. ”
No one with a degree in technical science would ever deny the findings of centuries-old astronomy, or support the denial as you do regarding Clint R’s stupidities, fake Mod.
You belong to all those who deny all this knowledge, stubbornly arguing against it with your simple-minded MOTL/MOTR blah blah, quite like would 7 year old children.
*
I’m a simple engineer, but have understood how e.g. Tobias Mayer did his work nealy 3 centuries ago; and even if I hadn’t, I would have trusted great science men like Euler, Lagrange and Gauss who of course perfectly were aware of the quality of Mayer’s proof.
Years ago I tried to explain Mayer’s path to his proof on this blog, but I earned at best dumb ‘ball-on-a-string’ pseudoscience en retour.
Well, I do have that qualification, regardless of what you think.
And the moon issue, ironically enough, was never even really about the moon. It’s simply about what “orbital motion” is…so that of course affects all orbiting objects, not just the moon. We could just have easily argued over whether the Earth orbits and rotates 366.25 times per orbit on its own internal axis, or whether it orbits and rotates 365.25 times. It’s the exact same argument, either way!
But, you have to actually understand the moon issue to get that, and very few “Spinners” (if any) truly do.
Norman makes a bunch of claims he can’t support, then runs. Willard finds an unrelated news story. Bindi mentions a bunch of people that he can’t understand.
The cult has no viable model of “orbiting without spin”. The cult can’t support their false belief that ice cubes can boil water. And now their latest nonsense claims a glass of water, and an entire ocean both at the same temperature, will have the same thermal energy!
Kids these days….
Hey Puffman, riddle me this –
Research contradicts Dozing Donald’s claim that foreigners are footing the bill, and could weaken his hand in the dispute over Greenland
https://www.wsj.com/economy/trade/americans-are-the-ones-paying-for-tariffs-study-finds-e254ed2e
Are you BTFD this morning?
“If it’s not out in full, we’ll sue your ass off.” — Karoline Leavitt, threatening CBS over its Dozing Donald interview.
Willard, please stop trolling.
Gordon,
As you know everything about history, could you answer this simple questions;
Who created the kkk?
Who instigated the trail of tears
Who have over the last 5 years have been pushing the cancellation of anyone who disagreed with government on anything that to do with climate, viruses etc.
anon…I don’t want to make an enemy of you since I think we have agreed on the issues of global warming. Ergo, I am not taking shots at you and your beliefs, I am simply trying to reveal extra information for you. Of course, it’s up to you whether or not you are willing to allow it in.
Re your point about the KKK, it was started by southern rebels as a terrorist organization following their defeat in the Civil War. The trail of tears began early in the US experience as a country to deal with violent indigenous tribes. Although it may seem brutal with hindsight, in the same era you could be lynched for stealing a horse.
I think both sides were equally to blame but that fact has been skewed by modernists via hindsight. I don’t buy into the modern Indigenous whine about how the White Man stole their land. The history is far different than the modern distortion and both sides are equally guilty of indiscretions.
In summary. I have no interest in propaganda or conspiracy theories. We seem to think we in the West have the correct stories about history but in many cases we are being fed pure bs.
I definitely don’t know a lot about history, the difference is that I have read widely on it. I did not limit by reading to right-wing versions or the left-wing versions, however. You have the same opportunity as I have enjoyed to read with an open mind.
I have been highly critical of the Stalinist Russia regime and of Mao’s regime in China and its modern version. I have even been highly critical of democratic socialist regimes like that in the UK and even here in Canada. Many have regarded a socialist government as an excuse to goof off and that has never been right in my eyes. If I work for someone, I give a fair days work for a fair wage. Even when I was underpaid I gave more than I got.
I have read on both Stalin and Mao, but more on Mao since he interested me as a person. He began as a university student studying arts and engaged in protests against his own government making him a marked man. In his days, they would shoot you or jail you for protesting and his girlfriend was captured and executed as a protestor. That enraged Mao and I don’t blame him in the least.
Later, he led hundreds of thousands of like-minded protesters into the remote hills of China to save them from severe persecution. As part of that so-called Long March, he instituted policies of equality between men and women. That was likely the beginning of his communist feeling but it is important to understand that it had nothing to do with politics. He simply believed in equality and looking after people.
Stalin, on the other hand, was a cruel SOB who treated Russian citizens brutally for no known reason. The gulags he instituted appear to be manned by political dissidents as a means of cheap labour. Of course, a political dissident in those days could be anyone fingered by informants.
Mao did not start out as a communist and he pondered the benefits against the downside. One of his glaring weaknesses was his idea that Stalin was an honourable man leading an honourable revolt in Russia. When emissaries returned from Russia, revealing the horrors of the Stalin regime, he refused to believe them. Ergo, Mao had a seriously faulty role model.
My point is that Western right-wing sources have painted him in the same picture with Stalin. They point to the purges conducted by Mao. When he was asked about them, he replied frankly, ‘What else could I have done’?
We simply don’t get it in the West that China was facing a massive problem with corruption. They had long-established warlords, each with his own fiefdom, and they were openly resisting change in China that would relieve them of that power. China was quickly becoming a lawless state and Mao was faced with massive decisions. His solution was a massive crackdown.
In the West, we have never experienced such conditions, especially with such a large population. Our roots are in a well-established European democracy, which factions in Germany tried to overturn twice in half a century. Therefore, when we judge China, both from Mao’s version and the current version, we fail to understand the immensity of the problem.
Remember that even though the USSR and China had despotic regimes, both countries contributed immensely to the overthrow of Nazi Germany and Japan. We could literally not have won WW II without them. Although the brave US Marines fought valiantly in the Pacific theatre, they could do it because a massive amount of Japan’s troops were engaged in Burma, where the Chinese helped immensely.
Although the US under Roosevelt poured immense amounts of money, material, and leadership into China, they were stymied by a right-wing goof, Chiang Kai Shek, who hoarded the material and wealth, depriving his country of needed material to defend itself. He also stymied the efforts of Stilwell to organize the Chinese forces into a fighting unit. Mao was not the problem, it was a right-winger from whom Mao and his forces were fleeing.
Mind you, the US contributed immensely as well by supplying munitions and leaders like Stilwell, as did the UK with leaders like Bill Slim. Had the combined forces not weakened the Japanese initiative and defeated it, life would have been a lot more hazardous for the US marines in the Pacific Islands.
Gordon,
It is true we share common ground, and in my book no one becomes an enemy for simply holding a different opinion or knowing a different set of facts.
The democrats in the USA have been the source of a lot of hardship and division throughout history. Kkk was founded by them, they were also the worst of the plantation owners, actively push fraud and more authoritarian policies.
To find common ground between Mao, Stalin, and the worst European leaders of last century you only have to look at their early politics. The Italian was the editor of the socialist magazine before refining his views. In Germany the clue was in the name of the workers party. Stalin & Mao were communists which again is a refined form of socialism.
Stalin & AH had a pact that lasted years before AH paranoia destroyed it. You would not have a willing pact like that if there wasn’t common ground.
Look at academia with the vast majority with socialists views. Just look at the quality of climate research that is more to do with certain social engineering ideals rather than hard fact.
Anon,
Since you’re showing that your pseudo is for Q-related reasons:
– Why stock market returns higher under Democratic presidents?
Hint: it’s more than 400 bp.
– The wealthiest 10% Muricans owns how much of the stock market?
Hint: it’s more than 90%.
– How many billionaires don’t have a college degree?
Hint: the same proportion of Muricans identifies as MAGA.
– What is the Southern Strategy?
Hint: it’s one of the reasons white racists shifted to the GOP.
– Are we not coming more and more, day by day, to making the statement “I am white,” the one fundamental tenet of our practical morality?
Hint: that’s a WEB Dubois quote.
Willard,
Which side wanted the banks to loan money to people who could pay back the interest on the loan let alone the whole amount
This was one of the largest causes of the 2008 banking collapse.
I have never said, not will I, that any side in politics is beyond reproach. Can you say the same about the democrats?
Willard,
Which side wanted the banks to loan money to people who could not pay back the interest on the loan let alone the whole amount. The main culprit became president
This was one of the largest causes of the 2008 banking collapse.
I have never said, not will I, that any side in politics is beyond reproach or doesn’t have some good ideas. Can you say the sam?
Anon for Q-related reasons,
Which Murican president annexed the most territories, and from which party?
Hint: he was also a big fan of tariffs, some of which were responsible for the Great Recession.
Which Murican president is actually seeking to destroy the Basel III framework, which has been introduced to prevent another GFC?
Hint: he’s also deregulating the AI and the BTC industries as we speak.
When was created the first residential mortgage-backed security?
Hint: Glass–Steagall was still in effect.
Who appointed the guy who created the loophole in Glass–Steagall that would cause its demise, even if he argued for keeping it when the Bush administrated wanted to repeal it?
Hint: he was replaced by a libertarian freak who worshiped Ayn Rand.
What step 4 of the contrarian tango?
I’ll give you that one: it’s Cheap Bargaining.
Willard, please stop trolling.
Good news from Putin, the Trumping boy’s very best friend
” LIVE, war in Ukraine: 600,000 people have temporarily left Kyiv due to Russian airstrikes that have cut off the capital’s electricity and heating.
The evacuation order was issued on January 9, following a series of Russian bombings of Ukrainian energy infrastructure. “The temperature is nearing -20°C, and Putin is using this to break resistance, plunge everyone into depression, and create tension in society,” denounced the mayor of the Ukrainian capital. “
Bindidon, please stop trolling.
” To Their Shock, Cubans in Florida Are Being Deported in Record Numbers
Cubans had long benefited from legal privileges unavailable to immigrants from other countries. President Trump has changed that. ”
NYT
Don’t expect to find such info on NYP…
Bindidon, please stop trolling.
A comment by ‘Morty’, posted on New York Post‘s article:
https://nypost.com/2026/01/20/business/trumps-fed-chair-decision-could-come-next-week-says-treasury-secretary-scott-bessent/
*
” Things that Trump is destroying:
– Democracy
– The rule of law
– Respect for law enforcement
– The evidence of his crimes
– The White House
– Social Security
– NATO
– Scientific research
– Higher education
– The careers of civil servants
– Freedom of the press
– Free speech
– The facts of American history
– Social Security
– Pride in our country
– Public health
– America’s reputation
– Common decency
– The Kennedy Center
– Public support for the arts
– Any agency that helps people
– National parks
– Friendship among Americans
– Unity among the American states
– The moral fabric of the nation
– Impartial news media
– Military honor
– Separation of church and state
– Trust in government
– The economy
– The stability of the banking system
– The value of the U.S. dollar
– The tourism industry
– The restaurant industry
– Harmony in the workplace
– Predictable conditions for investors
– Trade relations with Canada and Mexico
– Retirement plans
– Hope for the future
– Peace of mind
– Data security
– The lives of impoverished children in foreign countries
– Immigrant families
– The environment
– Medical privacy ”
*
Only die-hard MAGAmaniacal Trumpistas who suffer severely from the Trump addiction syndrome would disagree.
I noticed Bindi has stopped trying to fake a knowledge of science. Like several others in his cult, he’s realized he doesn’t know crap about science, so he’s sticking with his political beliefs.
Hey Puffman, riddle me this –
The EU Could Decimate US Oil and Gas
https://www.youtube.com/watch?v=1YzrPsm_c-c
Have you BTFD today?
“I feel as though the weapon I built is coming to kill me and my people,” she said.” – A Somali show owner who voted for the Leopards Ate My Face party
binny…your list is ample ground for impeachment. It’s up to Republicans in the short term to grow a pair and step up in Congress and the Senate.
Bindidon: Things that Trump is destroying:
– Woke
– DEI (diversity, equity and inclusion)
– Digital Equity Act
– LGBTQ+
– Trans
– Gender ideology
– Males in women’s sport
– Other official languages but English
– Gulf of Mexico
Just to name a few.
“LGBTQ+
– Trans”
Why do you think homophobia or transphobia is justified? Sexual orientation is not a choice. It is a natural part of who someone is, just like your own.
How does a consensual relationship between two men or women affect your life in any way?
It’s about perversion, Eldro. It’s NOT just a “relationship”.
Hey Puffman, riddle me this –
How Trump Has Used the Presidency to Make at Least $1.4 B
https://archive.ph/WgoMk
Have you guessed that TACO would happen this morning?
“Bro, do it. Do something. Just stop chickening out. I’m just tired of the idle threats… Please pull the trigger. Please kill them, Mr. President. Please just kill them.” — Nick Fuentes, whose audience consists of young GOP staffers and ICE goons
Hey Puffman, riddle me this –
How Trump Has Used the Presidency to Make at Least $1.4B
https://www.nytimes.com/interactive/2026/01/20/opinion/editorials/trump-wealth-crypto-graft.html
Have you guessed that TACO would happen this morning?
“Bro, do it. Do something. Just stop chickening out. I’m just tired of the idle threats… Please pull the trigger. Please kill them, Mr. President. Please just kill them.” — Nick Fuentes, whose audience consists of young GOP staffers and ICE goons
How so?
Trump was asked about LGB and he was supportive saying that although LGB is not his choice it is up to the individuals. The TQ2S………… Is about forcing others what to say. Compelled speech is abhorrent to those who like free speech. It really is not that difficult to understand.
People routinely call doctors “Dr.” and married women “Mrs.” without calling it compelled speech. These are socially recognized titles that reflect how people identify and are recognized by others.
Using a transgender person’s pronouns fits the same category. Treating that as uniquely coercive suggests the issue is not free speech, but discomfort with the group itself.
Eldrosion: That has no influence on me, but it’s harmful to teach this kind of BS to small children in public schools. That is the problem, not sexual perversions.
“teach small children”
That men marry women isn’t kept secret from children. Why should the fact that men marry men or women marry women be kept secret, when these are ordinary events in our society.
No one is describing to small children what any of these married people do in the bedroom.
I got sex Ed in 8th grade. Probably similar today.
Nate: Same-sex couples have stolen the word “marriage”, so union between a man and a woman is now called “real marriage” or “genuine marriage.
Max,
Most people understand what marriage means for couples. No different for gay couples.
Live and let live.
Religions, OTOH, have different notions on what marriage means.
My mother married my father and had 5 kids. then the Catholic church absurdly ruled that the marriage ‘never existed’ so that my father could marry a Catholic woman.
anon…appreciate your open-mindedness. Some of my best friends have been right-wingers and our friendships were based on agreeing to disagree.
[Anon}”Hint: he was replaced by a libertarian freak who worshiped Ayn Rand”.
***
Are we talking about Neil Peart, the late and great drummer for Rush? Much of his writing for Rush was based on Ayn Rand. Don’t think he was a Libertarian though. I saw Peart once with Buddy Rich, and Peart held his own.
BTW…never cared much for Rush, the lyrics or the singing. Geddy Lee was more of a screecher than a singer.
As if the world needed another reason to hate Rush.
Here’s a good write-up on Alan:
https://www.theawl.com/2011/04/when-alan-met-ayn-atlas-shrugged-and-our-tanked-economy/
Willard, please stop trolling.
binny…the thing you need to recognize is that the current escalation in Russian strikes in Kyiv came only after the Ukraine began firing long range missiles and drones into Russia. We in the West supplied those long-range missiles and drones.
I mean, what was Zelensky thinking about? Did he seriously think they could beat Russia, a super-power with nuclear weapons let alone not having the Russians retaliate? He had to know they were only irritating them to the point they changed their focus to Kyiv from the Donbass region?
https://www.youtube.com/watch?v=qciVozNtCDM
The link is to an excellent video by political scientist John Mearsheimer, who is a renowned authority on the Ukraine situation. There is a lengthy introduction by someone else and I advise fast forwarding through it. Mearsheimer presents fact after fact, including statements from Putin dating back to 2008, that support his arguments that Russia had no intention of taking over the Ukraine but were goaded into it by US and EU intervention in Ukraine aimed at drawing it into NATO.
In the video, Biden is the culprit, based on his xenophobic dislike of anything Russian. Zelensky was voted into power in 2019 based on a pledge to mend fences with Putin. Instead, he about-faced and joined Biden in countering Putin. That’s what started the war.
Before I say more, I want to offer a disclaimer. Whereas it may appear that I am siding with Russia over the current situation in the Ukraine, I am not. I am trying to be objective about the situation and to be aware of the situation in both countries.
I do care about the plight of Ukrainians trapped in this dire situation. However, after watching Oliver Stone’s Ukraine On Fire video, my eyes were opened to the chaos, past and present, that is Ukraine. I am sure most Ukrainians are good and decent people but that is spoiled by a minority of Ukrainian nationalists who still maintain an identity to White Supremacy and WWII Nazism.
The Ukraine is far from being the innocent democracy portrayed by Western media. Since their incorporation circa 1990, they have been perennially at the top of the list of corrupt European countries. I am making no claim that Russia is any better, my only concern is for the 18 million Russians trapped in the Donbass region and at the mercy of Ukrainian nationalists.
It’s like us here in Canada purposely antagonizing Trump to the point he tries to invade Canada. We currently find ourselves in such a situation. We need to do the right thing and support European nations in Greenland by sending soldiers, even as a token. You can bet, the moment we do, Trump will ramp up his sabre rattling re annexing Canada.
In fact, much of his MO right now is taken directly from Putin and Hitler. Unfortunately, Trump has mistaken Putin’s aggression for outright imperialism, and admires him for it.
It’s pretty clear to me that Moscow had no intention of taking over the Ukraine. Their focus thus far has been limited to the Donbass where 18 million native Russians live. The unrest in the region was related to the 2014 ouster of a pro-Russian Ukrainian president whose appointment had been sanctioned as fair by the rest of the world.
The initial reaction of Russia to the 2014 coup, which we in the Western democracies ignored and sanctioned, and the EU and US abetted, was to take Crimea. It was ceded to the Ukraine, as a soviet, not a country, by Khrushchev, a Ukrainian himself. The Ukraine was created by the USSR as a soviet circa 1920. The area existed loosely as a region but had never been a political entity per se.
I think the formation of the Ukraine as a country circa 1990 was very poorly thought out. Other countries like Estonia, Lithuania, and Latvia apparently have similar situations where native Russians are being ostracized. Why do these countries still live in the dark ages where such intolerance runs rampant?
It took another 8 years of harassment of the 18 million Russian community in the Donbass for Russia to invade. I am not disputing whether Russia had a right or not to invade, I am only pointing to the utter stupidity of Ukrainian authorities in mishandling the situation with the native Russians.
I know you disagree, but there has always been an apparent hatred of Russians in the Ukraine by Ukrainian nationalists, who are more White Supremacists than lovers of democracy. Those clowns harass anyone who is not pure Ukrainian by birth. They are armed and dangerous, and until something is done about them, there will never be peace in the Ukraine.
Gordon: Why are you spreading false propaganda? Those lies are straight from Bloodymir Putin’s playbook. I didn’t expect to run into Putinists here.
Max, Gordon is right about the corruption, and the hostilities to Russians living in Ukraine. Which is not surprising due to the USSR history and it’s disintegration.
The media is not always being honest about the Ukraine Russian war. It does seem at times that they are really trying to o provoke Putin.
The truth is out there somewhere.
How uber right-wingers started the climate hoax. Nothing to do with the Left.
https://blog.friendsofscience.org/2022/07/20/margaret-thatcher-and-the-rise-of-the-climate-ruse/
Margaret Thatcher, the uber right-winger who destroyed Britain’s working class way of life, was the culprit behind the climate change hoax. She vehemently wanted to destroy Britain’s coal mining industry as a means to rid herself of the coal mining unions. Her means of destroying the unions through police brutality would have made Hitler proud.
Next time someone tries to tell you it was the Left behind the hoax tell them to ‘get away you silly *******’.
Sorry gordon, but you’ve confused yourself again.
Thatcher was concerned about coal as a real pollutant. That was before scrubbers were developed. The ash from coal-fired power plants was a definite problem. It caused air pollution, acid-rain, and “global cooling”. With the implementation of scrubbers, coal-fired plants became so much cleaner they were no longer a problem.
But the concern was perverted to a fear of CO2. Later, Thatcher saw how the Left was perverting the issue and wrote about it in her book “Statecraft”.
Gordon,
I live in the UK, and our internal view was that the unions held the country to ransom. Three day week, dead not being buried, garbage not being collected…. All endorsed by the Labour government of the day. The general election gave the Conservatives and the prime minister Maggie Thatcher the mandate to reduce the union power, which she did. Yes it was heavy handed, on both sides. It was nothing to do with climate.
PM Thatcher was a chemist by training so would have understood the concepts being promoted at the time. Remember at the time there was acid rain that was being seen as an environmental disaster. PM Thatcher, was not a Fabian but pro individual choice so what ever her motive at the time it was probably good intentions. The path to hell is paved…
The media is biased.
Trump’s currently speaking at Davos. The room is so silent for Trump’s lie-fest that you could hear someone fart.
We are witnessing something rare in human history: Abdication by the leader of the global order.
We have seen empires fall and civilizations crumble. But we’ve almost never seen a people renounce their leadership of the world, all at once, in full public view. That is what has happened in the 366 days since January 20, 2025.
We are about to see the free world stop referring to the great unraveling as a Trump problem. They will soon understand that it is an America problem.
The molten core problem at the heart of the situation: The president is deranged. Trump’s imperialism is about grandiosity. Because Trump is derangedly grandiose.
Nobody who has read his message to the Norwegian prime minister in which he links his derangedly grandiose demands for Greenland to the Nobel Committee’s decision not to award him the Nobel Peace Prize can doubt his derangement:
At this point, if Trump just drops his pants and shits on the stage I won’t even be surprised.
You cult kids know are as ignorant about politics as you are about science.
Hey Puffman, riddle me this –
Trump’s pardons forgive financial crimes that came with hundreds of millions in punishments
https://www.nbcnews.com/politics/trump-administration/trumps-pardons-forgive-financial-crimes-came-hundreds-millions-punishm-rcna248277
Did you know that Jayden Scott missed his “crusade on Minneapolis” not because has was assaulted as he proclaimed, but because he spent the weekend in a Michigan jail serving a seven-day sentence for contempt in a child support case?
“The Gestapo was a secret police force. No warrants. No courts. No lawyers. And no appeals. People vanished in the night, not because they broke the law, but because the law no longer meant anything. The knock on the door was the sentence.” — Chris McDaniel, failing to realize he just described ICE modus operandi.
Clint R
YOU: “You cult kids know are as ignorant about politics as you are about science.”
Yes indeed you are completely correct description of who you are. You are in the MAGA cult completely and unable to think on your own.
You are completely ignorant of politics and science and blindly believe all the lies this current Administration is peddling. Yes indeed you do know yourself quite well.
Willard and Norman prove me right, again. They were a little late this time, but understand, they’re only kids….
MAGAs think he’s a genius. They don’t have the education or the intellect to understand basic high school level concepts, so when smart people talk, they don’t understand a word.
Then they listen to Trump, they listen to this buffoon utter gibberish and they don’t understand a single word, and in their dim little minds that means Trump must be really smart, because to them it’s all the same thing.
Okay. Yeah. It’s a cult… https://www.amazon.com/Cult-Trump-Leading-Explains-President/dp/1982127333
Ark, you hate Trump because of your Leftism and TDS. You can’t find anything good about Trump, just as you can’t find anything bad about Biden/Harris. You hate reality.
You hate science because of your Leftism and ignorance of the basics. You can’t find anything wrong with the CO2 nonsense, yet you believe the physics I present is wrong.
You’re basically the same as Biden, gordon, barry, Willard, Nate, and a few others — your cult brothers….
Puffman always had a thing for dictators.
“Sometimes you need a dictator!” — Dozing Donald, underselling that he’s also a crook.
Clint can’t ever find anything bad about Trump.
Does Trump often lie? No, no, never says Clint.
Because to him, he is the infallible Dear Leader.
Naturally, he doesnt think this is a problem.
Wrong again, child Nate.
Like many responsible adults, I don’t like about 20% of what Trump says. But, he’s so far ahead of Kamala it’s not even funny.
Your false accusations are why I don’t waste much time with you any more. Take some time off from stalking me, and grow up.
20%? like MOST Americans?
Current polls show that only 40% approve of Trump’s performance as President.
https://www.natesilver.net/p/trump-approval-ratings-nate-silver-bulletin
Watching Trump’s speech in Davos felt like seeing life imitate art.
The Magic Mountain. Thomas Mann. 1924.
P.S.: Mann was a REAL Nobel Prize winner.
Arkady, please stop trolling.
The liberal media were making a big deal of the down stock market on Tuesday. For the record, I was not very happy that Trump was screwing things up again. Today is a different story, but media coverage is dishonest as usual. CBS News has a headline: Trump backs off from Tariff threat. Although technically correct, it is highly misleading. The true headline is: Trump secures framework agreement from NATO. Once again, the genus “negotiator in chief” scores a big win. Stock markets are back up again. Overnight futures are up so far.
I need to comment on some nonsense here about the stock market. The markets benefit everyone. For example, Musk owns something like 12% of Tesla, so it was popular for some fools to bash Tesla. The fact is that the other 88% is mostly the general public. Another myth is the notion that the “billionaires” own too much of everything. I have a stock fund that invests in the “Magnificent Seven”. The fund is up over 30% average per year over the last 3 years. I almost doubled my money over that period. The “billionaires” own only a small portion of those companies. More to the point is the fact that if you are in a well managed pension plan or 401k plan, you benefit as well.
The obscenely misguided Socialist desire for a wealth tax would actually be a tax on the general public. These people do not hold large amounts of cash. They hold stocks. If they are taxed on their wealth, they will have to sell large amounts of stock which makes the value go down for everyone. For every stock sold, there must be a buyer. Capitalism makes everyone wealthy, but some more than others. Socialism is fair — it makes everyone equally poor.
No, CBS was accurate in their headline. Walking back a self created risk isn’t a big win, lol.
Apparently, this is the kind of ‘wins’ MAGAs are proud of.
I guess I need to clearly mark all sarcasm as such. The clue is here: “For the record, I was not very happy that Trump was screwing things up again.”
Genius? Really? How about crude but effective. The point is that the markets are back and the US economy remains strong even if the liberal media are disappointed.
My other concern is that Trump is getting more confused and more tired looking. How much sleep can you get on a flight to Europe? Someone at some time needs to tell him to sit down and shut up. His rambling speeches are not useful.
Tim S: As Willard often says: “Another Donald win!”
It looks like Greenland will be divided between Denmark and the US. There are 56.000 people living in Greenland and most of them live in small settlements in the west and south coast. It’s easy to draw a border line around settlements with more than 3000 people. The rest is mostly uninhabited and will be part of the US.
But Greenland is not enough for Trump. Trump and NATO chief Rutte have talked about a much larger Arctic area that contains northern parts of Canada and Scandinavia!
” The point is that the markets are back and the US economy remains strong even if the liberal media are disappointed.”
Not according to the polls or job numbers.
0.5 million jobs added last year. Well below normal, and the 2 million added in 2024.
“It’s easy to draw a border line around settlements with more than 3000 people. The rest is mostly uninhabited and will be part of the US.”
Delusional talk from Max, suckered by the pure gaslighting from Trump.
“Leaders of Denmark and Greenland insisted Thursday that the island’s sovereignty was non-negotiable”
“NATO spokesperson Allison Hart said the alliance’s secretary general, Mark Rutte, did not propose any ‘compromise to sovereignty’ in discussions with Trump.”
https://apnews.com/article/denmark-greenland-trump-arctic-security-nato-d74c0ffcf1db904a2a9c3b2c5c5b8d03
“Once again, the genus “negotiator in chief” scores a big win.”
Uhh..not really. He is not getting Greenland for the US.
And the access to Greenland for bases was already there.
NATO was already working on a plan for Greenland’s defense and resource protection. They simply told Donald about it.
And he had to go with threats of possible military action and destabilization of NATO again, making the US a pariah and untrustworthy as a partner on the world stage.
Which has meant everybody finding new allies and trading partners.
To gain nothing.
He uses this maximalist threats approach to negotiating constantly with allies and some adversaries.
But with Russia, not at all. Why?
Try this:
I guess I need to clearly mark all sarcasm as such. The clue is here: “For the record, I was not very happy that Trump was screwing things up again.”
Genius? Really? How about crude but effective. The point is that the markets are back and the US economy remains strong even if the liberal media are disappointed.
You often tell us you don’t like Trump while then defending his actions.
This post was thus unrecognizable as sarcasm.
Nate, please stop trolling.
F*k off, troll.
Calm down, Nate. There’s no need to start lashing out just because you’ve lost an eight-year argument.
Graham D. Warner is returning to his old ways.
The blog’s fast becoming a political cesspool. If ever there was an emergency, in need of a moderation team, it’s now.
Graham only notices what displeases him.
No wonder he’s still looking for love:
https://www.youtube.com/watch?v=Nm4kwyydmeM&t=2s
Willard, please stop trolling.
A couple of points on some bonehead misconceptions promulgated here by some commenters who brag about being from the Ivy League:
1. When someone loses 2% of their equity value and then win back 2%, that someone still lost money. In algebraic terms, percentages of wins and losses are not commutative.
2. The S&P 500 is not the only market around. The ASX 200 barely noticed Dozing Donald’s 45-min pouting. That’s notwithstanding commodities, forex, etc. And we’re not even touching the biggest market of them all: real estate.
3. Equities are a secondary market. That is, they have no direct impact on corporations. Prices only reflect expectation of future returns. The firewall between what a corporation does and what it must tell to the public is made more opaque now that Dozing Donald made sure there would be 90% less audits.
4. The market *is* a zero-sum game. Elon won can only win a penny that somebody lost. So by sheer arithmetic the existence of a class of multi-billionaire creates market inefficiency. I’m not saying this as sour grapes: I may not do as well as Mighty Tim or Arkady or the Inverse Cramer ETF, but I’m doing well enough.
5. The whole idea that there’s some vague trickle-down effect on share prices to the economy is, to put simply, without merit. It’s be like giving more chips to the chip leader in the hope that it’ll improve the Poker game. That’s just the logic of suckers.
6. Marx was a meritocrat. To each according to their needs and capacities means just what it says on the tin, and has been utterly botched by propagandists such as our reactionary cranks. These cranks just nurturing an illusion that they somehow deserve their privileges. They reveal their impotence each day of every month here.
7. Troglodytes who harp about socialism are kowtowing to those who require special treatment as to what they owe society. Just like with AGW, they ask that benefits be reaped by a small economic elite and externalities be shouldered by us all. Many of these elites come from South Africa, which may or may not be a coincidence.
If I was going to write a parody about someone who does not understand economics, this is what it might look like. Seriously, you and I disagree on a lot of things, but I am not a mean-spirited person. You should get out more and expose yourself to reliable information from an accredited college or maybe a junior college. Money is real. The stock market is real. When you purchase stock or invest in a fund, they want money. Years later when you sell shares, take a dividend, or a disbursement, they give you real money back that you can spend. Millions of retirees do that and live well on their investments that grow over timw.
Investing involves risk of various kinds. Those risks are usually short term and resolve over time. A strategy of diversified investments from a qualified advisor or competent person (such as myself) always provides a return on the long run. Such a strategy involves cash reserves that do not keep up with inflation, but provide security against market fluctuation.
Good luck.
Our Ivy Leaguer’s sardonicism is as crude and ineffective as when Dozing Donald rebrands a deal the US of A had with Denmark since the 50s, if not the 40s. Just about every single economy on this planet is mixed, including China. He’s forcing a door that is both open and shut at the same time.
But speaking for retirees, perhaps he forgets that “the share of households ages 65 and up increased by 33% in a decade—and, nationwide, more older residents are living in poverty”:
https://www.pew.org/en/research-and-analysis/articles/2025/08/04/more-us-residents-are-working-past-retirement-age
The fact that *he* invests on the market doesn’t magically transfer to the population. Less than 60% of Muricans own stocks, which means that more than 40% don’t even have a 401K. And those who do own little as “the bottom 50% of Americans owned just 1% of all stocks and mutual fund shares in the third quarter of 2024”:
https://finance.yahoo.com/news/wealthiest-10-americans-own-93-033623827.html
But let’s not bury the lede:
“The top 10% of Americans held 93% of all stocks, the highest level ever recorded.”
Nobody but rich asshats ought to care about market drops.
In any event, let’s assume that our Ivy Leaguer is as good at investing as our in-house fund manager. Odds are the he consistently underperforms his own benchmark. Heck, it is almost a certainty that obdurate gold nuts bested him in the long run!
Stock markets are as representative of economies as NASCAR is to the automobile industry.
Total stock market capitalization is $44.7 trillion. At 7%, that leaves 3.1 trillion for the 60% who own the rest of the stock. Assuming 60% of the adult population is about 100 million people, that leaves about $31,000 per person on average. The average 2-parent family has over $60,000 in the stock market. That is certainly better than a savings account for long term growth. Those funds should not be for daily expenses.
30K or even 60K is far from the 1M one would need to retire if we follow the 4% rule of thumb. And that’s just to live on 40K, which may be frugal to many Ivy League frat boys. After all, they have their collection of silver spoons to shine each week.
Besides, there’s a sound argument for 2,7%:
https://pwlcapital.com/the-2-7-rule-rethinking-safe-retirement-spending/
So make that 2-3M.
And that’s notwithstanding health costs that rise 5-10 years at the end of life, which for Muricans is kind of a big deal.
Which may explain why the US of A is the only industrialized country in the world with so many health-related bankruptcies:
https://www.ilr.cornell.edu/scheinman-institute/blog/john-august-healthcare/healthcare-insights-how-medical-debt-crushing-100-million-americans
What’s 100M Americans between frens?
Cornell, that ought to please our Ivy League fans.
This is why Willard should stick to things he understands such as children’s games. The annual yield on a million dollars should average out over a 5 year span with normal market fluctuations to a return of 10% which 100k per year.
Next question.
So our Ivy League brat can’t grok basic actuarial calculus.
Let’s put his 30K in “perspective”:
Op. cit.
So yeah, if George is the average non-10%, there goes his market savings. Luckily, George is insured, which isn’t the case for 10% of the US population. Which makes me think of insurance costs:
https://www.investopedia.com/how-much-does-health-insurance-cost-4774184
So even if our Ivy League brat’s 30K figure was per year, half of it would go in health insurance cost!
***
Perhaps he should ponder on the fact that there are many more investors in the US market than Muricans?
Just a thought.
Back in my days, paid sophists were a little less BS artists.
I am providing good advice. People who have a competent self-investment strategy, follow the advice of a Certified Financial Planner, or invest with a full service investment fund (with a higher expense ratio — paying higher fees) do very well when they include a mix of different types of stocks and bonds as part of a diversified portfolio of investment instruments. Note that purchasing individual stocks requires skill, knowledge, luck, and time spent doing research. Mutual funds are a better option for most people.
The US economy is still very strong despite the efforts of Trump, and the stock markets are a demonstration of that strength. People with a negative attitude engaging in insults, and criticizing competent people for being successful, usually do not do as well. Imagine that!
Let’s say Ivy League braggart retires and all he got is 1M in his 401K; he needs 100K per year, and expect 10% returns. That’s as if his equity will never be reduced (i.e. 10-10 = 0), right?
Think again, especially about volatility, for markets move a lot, between 15 to 25% depending if we want to play tech stocks. Let’s keep it easy and that SPY’s last 10y rolling window:
In 2015, it made -0.81%. That means at the end of the year our Ivy Leaguer had less than 900K.
In 2016, the SPY made 9.64. That means he’s again in the hole, for he takes out a little more than what he earns. He should be around 875K.
2017 was a good year: 19.38!!! Yet, that’s not 200K like we may infer looking at the initial value, but 170K. Still, he’s at 950K.
Now comes 2018: -6.35%. Ouch. Remove his 100K and 60K more: he’s at 790K.
Let’s speedrun the remaining years: 29%, 16%, 27% were great. Then came 2022 at -20%, which took him the last years to overcome, perhaps more. At the end he should be a little lower than where he started.
So here’s the kicker: SPY made 12.6% on average during this time. Ten very good years, exceptional years. For the SPY made around 8% since 1999. To overshoot our yearly objective by 25% would be silly. To discount volatility would be foolish.
The 2005-2014 window averaged to 8% (2000-2001-2002 were rather harsh), and the 1995-2004 window averaged to 12%. That number obfuscates 2008: a -38% drawdown is quite a blow on an equity curve to which we take off 10% every year!
TL;DR – the order of returns matter.
We’re not talking real, only nominal: total cumulative inflation sits at 35% during that decade. And we’re not anticipating big expenses, like medical emergencies or tornadoes. And taxes. Etc.
Perhaps he should ask Thomas instead. After all, people paid him a risk-free 2% all his life for him to tell them not to listen to paid sophists like our Ivy Leaguer.
Alternatively, perhaps he should pay more due diligence to the resource he’s being offered before sneering at it. It is after all written by a certified wealth manager, a very orthodox boutique, one that abides by Fama & French and all the Chicago boys he likes.
***
Dozing Donald’s economy is a mess, of course, but that’ll have to wait. For now, let’s hope our Ivy Leaguer understands why simulations show that a 4% rate leads to a risk of ruin of more than 15%.
And that’s the memo.
This is why Willard is not a good source for investment advice. It appears he does not understand interest compounding. I only glanced at this attempt, but the fundamental problem is the statement that $1 million was not enough to proved 40k income at 4% return. I pointed out that a more typical return is 10% averaged over time for a 100k gain per year on average.
Like a typical Democrat, he suddenly decided he would like to spend the whole 100k instead of sticking to the original 40k. Investing requires discipline that includes having a budget that controls spending.
One the one hand, our Ivy Leaguer is sure I don’t understand compounding. On the other, he has not looked at my demonstration of what is usually known as volatility drag:
https://en.wikipedia.org/wiki/Volatility_tax
My demonstration, step-by-step and year-by-year, showed that the drag was something like 20% over the last decade for the S&P. It was even bigger for the NASDAQ.
All this to reject fairly basic results presented by Ben Felix, a Chief Investment Officer, Portfolio Manager, MBA, CFA®, CFP®, CIM®, F.PI, and a YT celebrity in the investment world:
https://www.youtube.com/watch?v=1FwgCRIS0Wg
Which shows once again that Ivy leagues have little to do with any kind of merit.
Willard, please stop trolling.
willard…”Marx was a meritocrat”.
***
I guess that’s a fair description but it’s not what drove him to such a solution. In today’s society, I presume everyone, including myself, would consider him a crank.
I have tried to emphasize that it is ingenuous to consider Marx and Engels by today’s standards. They lived in an era we would consider today a horror show for most. And the conditions were driven by capitalists and the so-called upper class. They simply did not care about anything other than profits and status while keeping costs as low as possible.
I asked Google AI “what were the conditions Marx and Engels decried in the UK in the 18th century”? Here i the ….
https://tinyurl.com/mrx6vwyf
The appalling part that wrankles me is the right-wing justification that the poor were poor due to their own fault. In the capitalist mentality, anyone can succeed provided they try hard enough. That’s not even true today unless one is willing to sell his/her soul and learn to cheat and use people. In those days, it was virtually impossible for anyone to get out of poverty simply because the system was geared to keeping people in poverty.
I was a contractor for some time and I was not very good at it because I simply could not bring myself to rip people off. I was approached several times by people wanting me to hire friends and acquaintances and I could not do so because I could not afford to pay them a decent wage and provide decent working conditions.
Someone will come along and claim I am a Commie or a lover of communism, which could not be further from the truth. I am a lover of democracy and much of my life I have held my nose and endured the utter stupidity and cold-heartedness of mindless right-wing politicians who are quite willing to justify poverty and a perversion of democracy.
That does not mean I hate capitalism or that I am a socialist or a communist. It simply means that I regard our present system as being mean-spirited and designed to serve only a minority. If there is a label I can identify with it is humanitarian. I care about people first and if someone doesn’t like that they can sue me.
Having said that, I am not so naive to think there is good in everyone. Some people are plain evil and they thrive on the suffering of others. When I use the word humanitarian, I use it lightly, with the clear understanding of the naivety implied. Still, I don;t see a recent not to try.
From the Google AI article, apparently taken in part from the writings of Engels, who seems to me to be a humanitarian and not the godless image with which he and Marx have been labeled. They were truthful people writing bout the horrendous conditions of their time.
“Marx and Engels decried the horrific conditions of Britain’s 18th-century industrial working class, highlighting abysmal living conditions (overcrowded, filthy housing, disease), brutal exploitation (low wages, long hours, child labor), and moral decay (crime, prostitution, alcoholism) driven by capitalist greed, leading to widespread poverty, suffering, and stagnant real wages, starkly contrasting the industrialists’ profits with the proletariat’s degradation. Key Conditions Decried:
Exploitation & Poverty Wages: Workers, including women and children, received meager wages, barely enough for survival, while industrialists profited immensely.
Appalling Housing & Sanitation: Rapid, unplanned urban growth led to overcrowded slums, lack of clean water, and rampant disease, with death rates far exceeding rural areas.
Brutal Working Conditions: Long hours, dangerous factories, industrial accidents, and child labor were rampant, with no protections for workers.
Moral Degradation: The system pushed workers into crime, prostitution, and alcoholism as desperate measures to cope with poverty and starvation, eroding community bonds. Capitalist Greed & Complacency: Engels noted the bourgeoisie’s indifference to suffering, viewing workers as mere cogs in the profit machine and resisting any regulation.
Economic Instability: Recessions led to mass layoffs, eviction, and entry into brutal workhouses, leaving families destitute.
Engels’s Contribution:
His seminal work, The Condition of the Working-Class in England (1845), meticulously documented these horrors, showing how industrial capitalism inherently worsened the lives of the proletariat, fostering revolutionary consciousness through shared suffering.
Marx’s Perspective:
Marx saw these conditions as integral to capitalism’s development, where the separation of labor from the means of production created a system of exploitation and class antagonism, setting the stage for inevitable revolution”.
Always find it strange how people only associate greed with capitalism. All the USA presidents in the last ,50+ years all made a large profit by being president, all but one. It wasn’t biden, who made a lot of money with his deals around the world.
Slave owners back on the day made a lot of money, and the ones who wanted to keep all their slaves were the democrats, you know the ones who push socialism.
Various communist leaders excessively wealthy.
So greed effects all political ideology.
anon…because capitalism promotes greed while pure socialism does not. True socialists, by nature, want to share, to a degree, with others. It is in their nature.
I was raised to share with by biological brother. On one occasion, my uncle, who had a store, gave me an orange. In a moment of childish naivete I asked him if I could have one for my brother. He called me a cheeky boy and took the orange back. That is a perfect example of socialism versus capitalism. What I regarded as sharing with my brother, my capitalist uncle regarded as cheekiness.
Mind you, my uncle was a good guy in an overall sense. Guess I caught him on a bad day. Mind you, I have met many capitalists who are good people on a day. I think capitalists are bred to believe their is kindness and there is business, where business justifies the lack of kindness and empathy.
I have no idea what Marx meant by his statement, ‘From each according to his ability, to each according to his needs’. I regard that as naive statement based on modern practice, but at the time he was trying to envision a just society that did not exist in his time, in a world driven by cruelty and havoc. He was projecting.
Google AI explains his statement as follows…”…it describes a system where individuals contribute to society based on what they can do and receive resources based on what they require for a dignified life, emphasizing free access to goods and services rather than equal distribution”.
It’s a rather simple, naive vision actually, but it makes capitalists apoplectic.
I think the reason capitalists fear this statement so much is that it cuts them out of the sole decision making process by making them responsible to society as a whole. I sat and bit my lip as some jerk employer preached to us that we were a family, obviously with him as the father-figure. The employers speech was justifying why he could not afford to pay us a bonus at years end, as in the past, then he took his family to Hawaii for a Christmas vacation.
There is a lot wrong with capitalism that needs to be mended. I don’t want to dismantle it, I want to fix it so it meets the needs of employees and the nation s a whole. I am in no way inferring that governments should interfere in the running of a business, only to ensure they are run in a fair manner to everyone.
I think the people in a country should have a say in how capitalists do business in general. We do to a degree but only if they flagrantly break laws. Capitalists find ways to get around those laws, making them irresponsible citizens.
Tim S is on about the stock market which is essentially a band of thieves who fix it internally so only certain participants benefit.
After their financial shenanigans brought the US to its knees in the 2000 decade, none of them were charged, even though they had engaged in illegal activities, in fact, Obama rewarded some of them by hiring them as advisors.
Please, don’t kid yourself that Democrats are in any away advocates of socialism. They are as capitalist and corrupt as Republicans and Biden was paranoid about Russia and Putin. His paranoia led to the current Ukraine war, both by him and his family profiting from internal economic affairs in the Ukraine and poking the Russian bear by trying to force the Ukraine into NATO.
One of the Democrats, Bernie Sanders, brays about socialist principles but there is no strength in his words and actions. Both Obama and Clinton had 16 years between them to fix the US medical coverage plans and did nothing. Clinton was more interested in diddling a young female intern in the Oval Office than helping US citizens.
His wife, Hillary, stood by her man through countless affairs yet she ran for President. Hillary talked the talk but was shy when it came to walking the walk.
Here in Canada, we are little better, but a true socialist like Tommy Douglas was able to institute a true Medicare system in Saskatchewan when he was premier. Later, when he was a federal MP, he worked with Paul Martin Sr., a Liberal, to institute Medicare in Canada. Martin’s son, Paul Jr., was a Prime Minster and dismantled our Unemployment Insurance scheme, making it tougher for the unemployed to get UIC.
Possibly one of his most diabolical schemes was renaming Unemployment Insurance to Employment Insurance, claiming cynically that UIC was not unemployment benefit but employment benefit. This was a capitalist who kept a fleet of ships off shore so he would not have to pat taxes in Canada.
I did not come about my jaundice about capitalism through an ideology, I got it through actual practice, from experiencing it with my eyes wide open. I experienced employers and their thinking through union negotiations directly, which are supposed to be conducted in good faith. Humbug!!! In one bargaining session, the employers began by demanding a 15% cut in wages and benefits. When we arrived at a contract, most of them did everything they could to breach the contract. Anyone, like myself, who protested was summarily laid off.
Tommy Douglas was a religious Reverend and a decent human being. He was in no way a rabid extremist, simply a good Scotsman with a heart. That’s what many Yanks fail to grasp, that socialism is about humanitarianism, not an extreme ideology with a mandate to deprive people of their hard earned money.
However, capitalists have created a propaganda relating socialism to the horrors of Stalinist Russia. They have not a shred of proof to back the propaganda.
Gordon,
Do you acknowledge that communism was a refined stance of socialism?
Don’t need war & peace.
SOLAR MINIMUM UPDATE
https://www.youtube.com/watch?v=VVxYOQS6ggk
Willard, please stop trolling.
Apparently, some people here are still living in 1963:
“It’s about perversion, Eldro. It’s NOT just a “relationship”.”
“Eldrosion: That has no influence on me, but it’s harmful to teach this kind of BS to small children in public schools. That is the problem, not sexual perversions.”
That’s pretty mild, Eldro. If you’re going to be a loyal cultist, you’re going to have to step it up several notches. You can’t have people free to have their own opinions….
It’s mild because I am not a cultist. I am just trying to understand why you think the way you do.
My other questions:
When you see a Black person, do you think ‘back of the bus’?
When you see a woman walking to work, do you think ‘shouldn’t she be home making dinner?’
Yeah, typically cultists don’t admit to being cultists. You have to go by other indicators.
Concern about WOKE issues is a pretty good indicator.
Basic racial and gender equality isn’t ‘woke.’ If you think otherwise you’re just a plain old, 1920s-style bigot.
What Barry said.
Building straw men and ganging up are also indicators of cultism.
Hey, Puffman –
Whiny titty-ass baby Von Shitzhispants is having a nervous breakdown over his awful poll numbers and is using his usual cudgel, lawsuits against any news in the press that makes him look bad.
https://crooksandliars.com/2026/01/trumop-vows-sue-all-pollsters
No riddle at this moment.
“Although the U.S. Department of Homeland Security (DHS) has not historically relied on administrative warrants alone to arrest aliens subject to final orders of removal in their place of residence, the DHS Office of the General Counsel has recently determined that the U.S. Constitution, the Immigration and Nationality Act, and the immigration regulations do not prohibit relying on administrative warrants for this purpose.” — DHS, seeing that getting judges on their side is now a little harder.
Eldrosion,
To quote you
“When you see a Black person, do you think ‘back of the bus’?”
No I see a person, I dont think about colour. I would suggest to you that because you readily asked that question then it is you who seems to want to see the world via race. Why
Clint R’s comment describing LGBTQ+ identities as “perversion” is what prompted me to ask that question. I think he grew up during a time in the US when white men were widely treated as superior by society, and that worldview was reinforced through law and culture.
I do not see race in my own daily experience, but I am also not a black man or woman, so my perspective is different. The United States has a dark history of racial hierarchy, and although many explicitly discriminatory laws were outdated decades ago, they produced systemic inequalities that remain today.
For example, from 1930s-1960s, Black Americans were routinely denied bank loans and prevented from living in higher opportunity neighborhoods through segregation. This limited their ability to build wealth and pass it on to future generations, while white families were allowed to accumulate assets and get ahead.
Now Eldro is twisting my words. Somehow trying to imply I’m a racist because I believe homosexuality is perversion.
That’s just one more indication of his cultism.
I should clarify my original statement to say: “when straight, white men were widely treated as superior by society.”
Feel free to point out any misconceptions I may have and elaborate on your perspective. You have yet to do so.
Eldrosion,
Wow, now you conflating race with preferences.
Today in there is a senator who’s ancestors worked on a plantation, his farther had to go to the bad door of a shop to buy items. And the senator is a republican because he understands history and the evil within the democratic party.
Perhaps our Anon for Q-related reasons might need to revisit The Rise and Fall of the Voting Rights Act:
https://www.patreon.com/posts/rise-and-fall-of-148655430
The fight by Southern troglodytes to undermine rights has never stopped. It is still ongoing. Some might argue it has even reached its ancient colonists.
“Wow, now you conflating race with preferences”
They might seem conflated, but there is actually a key connection between how people from that time developed their views on both race and sexual orientation, especially when you consider the cultural context in which they were raised. As I mentioned, the US during that era was defined by rigid norms surrounding both race and sexuality.
And MAGA conservatives frame diversity efforts as “woke” and insist that outcomes should be based purely on merit. On the surface, that sounds fair but it assumes a level playing field that historically did not exist. For a long time, access to education and opportunities was explicitly restricted by shaped race.
Diversity initiatives are not about abandoning merit. They are about correcting those historical barriers that still influence outcomes today.
MAGA conservatives simply lack the eduction to understand this (just like many other issues: climate change science, COVID-19 virology and its associated health prevention measures, etc).
Eldro, I’m guessing you have been so fully indoctrinated by some public school system that you’re no longer able to think for yourself. That’s why you’re a cultist.
I’m also guessing you know nothing about physics or thermodynamics.
Prove me wrong: Can radiative fluxes simply add?
Hey Puffman, riddle me this –
https://bsky.app/profile/broadwaybabyto.bsky.social/post/3md57yxm4ok22
Pray tell more about perversion.
Well, no response from Eldro. So typical. Bring up a little science, and all the “experts” leave.
Eldrosion,
What you will find if you look is numerous maga people who have zero anti LGB views. They may not agree or promote LGB views but they also don’t hate or discriminate against them. Charlie Kirk was not pro LGB but had many friends who lived as LGB, didn’t stop them from being friends. And yes you will find a few who are anti LGB or racist.
But when it comes to trans it’s a completely different story. I would say the majority of MAGA are against Trans and the rest of the alphabet soup for a variety of reasons. Gor some it is to do with it being a coercive, predatory dogma. For others it’s to protect actually girls & women.
Again you don’t seem to know the whole picture, but only the caricature pushed by a biased MSM.
“God’s perfect law when it comes to sexual matters.” — Charlie Kirk, on stoning gays.
Anon
According to ChatGPT, approximately 2.8 million people aged 13 and older identify as transgender in the U.S.
Are you really suggesting that all 2.8 million of them can be reduced to just two negative stereotypes: predators/ideologues, or as threats to women?
Eldrosion,
Your inability to read what I wrote is somewhat silly.
Try this, many trans are on autism spectrum.
Anon,
“Again you don’t seem to know the whole picture, but only the caricature pushed by a biased MSM”
So we should adopt instead the caricature pushed by right-wing media?:
“some it is to do with it being a coercive, predatory dogma. For others it’s to protect actually girls & women”
eldrosion…”People routinely call doctors “Dr.” and married women “Mrs.” without calling it compelled speech. These are socially recognized titles that reflect how people identify and are recognized by others.
Using a transgender person’s pronouns fits the same category. Treating that as uniquely coercive suggests the issue is not free speech, but discomfort with the group itself”.
***
More on climate….[/Sarc off].
Message to Roy, if this off-topic stuff is getting up your nose, please say something. I will be glad to cease and desist. I appreciate your open-mindedness thus far.
I came across the transgender reference initially as a man dressing as a woman. We called them cross-dressers. A man does not dress as a woman because he wants to be a woman, that makes little sense. Women learn how to dress as women, it is conditioned into them as children. Ergo, the way women dress has little to do with them being natural females, it has far more to do with curlture.
Men dress as women because it gives them some sort of sexual fulfillment. It is a sexual fantasy based on sexual fetish. A sexual fetish is loosely defined as a person becoming sexually aroused over an inanimate object. A man becoming aroused over a woman’s clothing constitutes a sexual fetish, and dreaming about it is a sexual fantasy, as is implementing the fantasy.
There is simply no way to tell if a man was cheated at birth with a generous proportion of female genes or whether he is living out a sexual fantasy. If the former is true, I suggest he get over it and live with it rather than making an utter fool of himself by claiming to be a woman.
I don’t know about such matter but I am sure Clint is an authority on it. I put that comment here mainly to see how much of my novellas Clint reads and understands.
In fact, the entire LGBTQ thing is based on sexual fulfillment. It’s right there in the name…homosexual, bisexual, transexual… They are definitely not references to men being friends with men, men being friends with women, or men at parties choosing to be one of the girls and gathered in the kitchen while everyone else mixes.
It gets confusing since many refer to homosexual interactions as ‘same sex’, which is a reference to sexual actuality. In the word homosexual, however, the reference to sexual is a reference to sexual feeling and practice with members of the same sex.
It is about sex and sexual fulfillment. I find it vulgar trying to teach that to children, through personal pronouns and such, who have not even reached puberty and begun to feel sexual desire. Many LGBTQ people claim to be born as such but that cannot be the case. Children don’t generally experience sexual feeling till around age 10 and puberty.
The word gay to describe a homosexual male came out of utter denial of that fact. The word gay began in the San Francisco homosexual scene where homosexuals approached local newspaper writers and implored them to use the word gay rather than homosexual. Is it not obvious why they wanted to obfuscate their sexual activity?
Now we have men wanting to come out as women, dressing like women, and in utter denial of why. It turns them on sexually and they get to pretend they are women with other men, likely pretending to be men.
That extends to men pretending to be women getting themselves onto womens’ sports teams and gaining entry to their dressing rooms and washrooms. I watched a TV interview involving one of those so-called transexuals. Speaking in an effeminate voice he revealed that he did not always feel like a woman, sometimes he felt like a man.
This is a danger. These people are fantasizing to the point they are sometimes men and sometimes women. I don’t care what they do re their fantasy life, but I am adamant they keep their perversions away from children and stop forcing themselves into the real female community as real women.
The main basis for claiming people are born homosexual etc., are vague studies from psychologists. I studied psychology for 4 years as an elective while studying engineering, and while that study does not give me expertise in psychology, it gave me valuable insight into the history of psychology and what it is about.
One psychologist I could identify with was Carl Rogers who developed Client Centred Therapy. Rogers is famous for his T-groups, which were the basis of encounter groups. Rogers conducted a study into the effectiveness of psychotherapy, and concluded that, at best, and including his own school, psychotherapy was only 60% effective. He concluded that psychoanalysis, the basis of psychiatry, was no better than no therapy at all.
A student of his, Eugene Gendlin, who wrote the book, Focusing, took it further, trying to investigate why the claims of Rogers were so. He concluded that people who benefited from therapy were predisposed to the therapy. In other words, they ‘got’ what the therapist was talking about. Without that insight or cognition, therapy becomes useless, not to mention expensive.
So, I am not about to accept a psychological study claiming to have proof that homosexuality is natural. There are far too many flakes go into psychology. The same can be said for engineering but there are strictly administered exams to weed them out. Psychology exams are essentially judged by the professor in essays. It’s far easier to manipulate a psych professor into giving you good grades as it is an engineering prof.
As this is circling back round to a science point – biology – I’ll comment.
Gordon, how can homosexuality be “unnatural” if there are gay animals? The animal kingdom can be considered “natural”.
dremt I did not say natural, I said there is no proof that people are simply born homosexual. As far as animals are concerned I think that is an example of what we call animal instinct. Many animals are not fussy about how they fulfill desire and I think that applies to humans as well.
I want to be clear that I don’t give a hoot what people do in private in their sexual lives, I just want it to stay in private. I want it kept away from children and not fooced on women as it is now being done.
Have you ever had a dog try to hump your leg? I don’t think that’s an act of homosexuality, it is simply uncontrolled lust. Animals are purely instinctual and if an animal feels lustful it’s not fussy about how it satisfy that lust. That’s why I prefer cats, who can’t be bothered with you unless they want to be fed, or cuddle up.
Having said that, a fellow in the UK approached a mounted policeman and asked him if his horse was gay. he was promptly arrested for a hate crime. That’s how insane this politically-correct bs is getting.
I have an opinion that many sexual aberrations begin with confusion related to puberty and adolescence. Based on my own experiences in that era, there was a lot of confusion about the feelings and associated fantasies and fetishes formed lead an innocent mind down controversial paths. Fortunately, I had no interest in males of the species but I was approached several times by curious males.
As one advances from puberty into the teen years one is likely to confuse hormonal feelings and lust for love. Love has nothing in common with lust, although many people confuse them. The Everly Brothers and Nazareth sang that ‘Love Hurts;. It was a good song but the lyrics are nonsense. How can love hurt? Or how can it produce any negative feelings?
The best description I have seen for love is an unconditional acceptance of another. That immediately negates such feelings we learn to associate with love like envy, jealousy, possessiveness, or loss. Put simply, it is not possible to accept someone unconditionally and feel envy or jealousy, to want to possess that person, or grieve over their loss. Grief is a personal matter related to one’s loss.
Grief is a tricky matter related to loss via death, but the loss of an object of desire, is plainly a personal matter related to expectation and desire. If it is regarded as a loss of love, then love was never there in the first place. Love is metaphorically located in the heart and if it is there, it should always be there, even if someone leaves.
I am fully aware of what it means to be rejected or dumped and I am not trying to minimize the situation. At the time, the grief was palpable, sometimes unbearable. It took me years to become aware that I set up each situation via my expectations and fairy tales about romance.
That kind of confusion begins with puberty and any path taken by a young person can be put down to that, IMHO. I was a pretty shy and naive kid, albeit well-mannered. By the time I was 20, I had become a loud-mouthed jerk, even though I never did give up on my values from younger years. I still tend to be loud-mouthed but with a major difference. I am now fully aware of it and can take steps to turn it off immediately if required.
In other words, through awareness, whatever was important to me that produced the loud-mouth, is now apparent, and I no longer need it.
Krishnamurti explained those negative feelings (envy, etc,) well as being related to the pursuit of desire. We have an experience with a woman and we want it to continue, so we cling to the experience. It’s that pursuit of desire that causes envy, jealously, possessiveness and a feeling of loss, not love.
Re the song, that messes with the lyrics which must become ‘the pursuit and the subsequent loss hurts’. Doesn’t work as a lyric.
After years of the associated heartache related to the pursuit of desire, I feel finally cured. The feeling is similar to an addictive drug, once you engage in it, you are hooked. Lust mistaken for love is simply a hormonal addiction.
If I can become aware of the pursuit of desire related to women it stands to reason that homosexual men can do the same. I am not implying they should, only that they can drop the pursuit any time they want.
Well, I don’t think anyone is born gay or straight, they’re born a baby with no desire either way. But, there’s certainly evidence that genetic factors have a role to play:
https://theconversation.com/stop-calling-it-a-choice-biological-factors-drive-homosexuality-122764
DREMT: I hope homosexuality is genetic, because then we can use prenatal screening tests. Screening can help to identify pregnancies at an increased risk for many birth defects.
I wonder if there’s a “bigotry” gene.
DREMT: Delayed abortion is too late for you.
It’s all about Freedom and Liberty say right-wingers, like Max.
Except for people who don’t conform to what Max decides is ‘normal’.
Child Nate, “Freedom and Liberty” do not mean you get to burn down buildings. There are necessary limits.
But, as long as you do no harm to others, you cult kids can avoid growing up as long as you want.
True, the gays should really just focus on being gay, and stop burning down all those buildings!
Crossed wires in your brain?
BACK AT THE RANCH
https://bsky.app/profile/bobkopp.net/post/3md2ssbvk5s2x
Cunning Koonin!
Variation on a theme…
Newly disclosed records about the Trump administration’s “Climate Working Group” (CWG).
https://www.edf.org/media/newly-disclosed-records-show-trump-administrations-unlawful-actions-related-secretly-formed
Secrecy, government officials using private email accounts to communicate with the group, fast-tracked on a 6 week timeline, negative internal reviews quashed. Seems legit!
Arkady, please stop trolling.
Trump mocks ‘environmental insurrectionists’ as Americans brace for massive winter storms: ‘Global warming?’
https://www.foxnews.com/politics/trump-mocks-environmental-insurrectionists-americans-brace-massive-winter-storms-global-warming
The president of the United States, who doesn’t understand basic junior high school level science, can’t grasp the difference between weather and climate.
Even the movie “The Day After Tomorrow” had a tighter grip on climate change than these tools.
Ark, your political bias is showing, again. You’re criticizing Trump for his lack of science, but you have no criticism for Biden. At least Trump has the common sense to recognize the CO2 nonsense is a hoax.
But back to science — Have you figured out why you can’t boil water with ice cubes yet?
Arkady: I know the difference between weather and climate. When it is cooling it’s weather and when warming it’s climate.
Max:
I don’t know the difference between your homophobic hot takes and this one:
https://wattsupwiththat.com/2024/02/07/trump-2024-climate-panic-in-a-word-horrific/#comment-3862877
Some things never change.
This president is obviously not a reader.
An early definition by A.J. Herbertson from his 1901 textbook “Outlines of physiography: An introduction to the study of the earth.”
The modern definition:
Arkady, please stop trolling.
Hoping the I pad lets me comment.
Cold Jan Feb coming up
Define cold.
dremt….”Well, I don’t think anyone is born gay or straight, they’re born a baby with no desire either way. But, there’s certainly evidence that genetic factors have a role to play:
https://theconversation.com/stop-calling-it-a-choice-biological-factors-drive-homosexuality-122764 ”
***
Dremt…I tried to read your article with an open mind but the scant mount of actual evidence bothered me. The author of the article, Bill Sullivan, begins with the claim that…
“…biologists have documented homosexual behavior in more than 450 species, arguing that same-sex behavior is not an unnatural choice, and may in fact play a vital role within populations”.
It strikes me as a bit strange that he is referencing animal instinctual behavior and calling that a choice. We humans refer to homosexuality in humans as a ‘preference’, not a choice. So, why is he claiming homosexuality has been determined in over 450 species and relating that to choice, while claiming at the same time that genes are driving homosexuality?
If genes are involved, why do they lay dormant till puberty then turn on with a vengeance? And when they turn on, what is the mechanism by which they influence sexual preference? The author not only fails to explain that, he appears to be jumping to major conclusions with relation to those genes.
As I have argued with you, it is ingenuous to call so-called same-sex relationships in animals homosexual. Animals don’t choose their partners based on preference’, as humans ‘can’ and do, they are driven by instinct. At the same time, they are also driven to procreate their species. The author seems to have over-looked the apparent fact that sexual attraction is about procreation, not entertainment or relieving boredom.
I realize that animals pair by some kind of instinctual preference and that applies to humans as well. I cannot explain why I have been attracted to certain women and especially why they have been attracted to me. I subscribe to the views of Groucho Marx, that I would never go out with a woman who would go out with a guy like me.
The author’s claim that biologists have identified homosexual behavior in more than 450 species is not exactly an objective statement. It seem geared more to proving the authors claim. He has failed to distinguish general instinctual animal behavior from that of humans who have a greater mental capacity to understand the difference and the consequences of his/her behavior.
In other words, even if a man is attracted to a man, he does not have to become involved sexually. The same applies to heterosexual attraction but we often feel overpowered by our hormones, which can result in extremely silly behavior, and even behavior that is dangerous to your health.
In other words, animals don’t appear to have a choice, they simply get aroused and try to satisfy their cravings in any way convenient. Mind you, that describes many humans as well. Trying to extrapolate general animal behavior to the human animal seems fraught with scientific questions yet this other is reaching conclusions based on scant evidence.
Perhaps if he had phrased it as a question, it might have flown. However, making an assertion seems to indicated a desire to prove his point.
He has failed to explain the connection between human genes and sexual behavior. What actual one to one connection do they have? I don’t think anyone has the slightest idea. If you stimulate a mouse to produce more or less of a hormone, where is the proof of a one to one relationship between that and sexuality?
Sexual feeling is a strange phenomenon. Humans can become aroused from stress alone. Humans don’t need a member of the same or opposite sex, they can become aroused over tiredness, stress, or unrelated events. We all know that arousal can be satisfied by other means, a means we are told leads to feeble-mindedness and even blindness. ☺ ☺ ☺
Although the messenger (The Conversation) claim to be scientific, there article is presented with the LGBTQ colour scheme. Where is the objectivity there? They claim that papers can only be presented to them from people who prove a qualification in the field. In other words, if a perfectly scientific argument is presented to them by someone lacking a degree, according to their mandate, they wont print it.
Finally, the editorial team is comprised of 8 women and two men. I have been harassed in my life by many women urging me to try homosexuality. These women, as far as I know, have been heterosexual themselves. Why do they have such an interest in a man trying homosexuality? That makes me question whether a bias exists in support of homosexuality in their articles.
“It strikes me as a bit strange that he is referencing animal instinctual behavior and calling that a choice. We humans refer to homosexuality in humans as a ‘preference’, not a choice. So, why is he claiming homosexuality has been determined in over 450 species and relating that to choice, while claiming at the same time that genes are driving homosexuality?”
It’s perhaps not the best-written article. He’s not saying it’s a choice though, he’s actually arguing the complete opposite. I think it’s just the way he wrote that particular sentence about “choice” that has confused the issue.
“If genes are involved, why do they lay dormant till puberty then turn on with a vengeance? And when they turn on, what is the mechanism by which they influence sexual preference?”
I asked Google AI how certain genes can only affect us later in life, and here’s what it said:
“Genes that do not affect us until later in life (known as late-onset genes) often lie dormant or "silent" for decades, activated only when the body’s protective mechanisms decline, when specific environmental triggers accumulate, or when they are turned on by natural aging processes. While our DNA sequence remains the same from birth, these genes are subject to complex regulatory mechanisms—epigenetics—which act as a, "software" to turn genes on or off, or to turn them on only after reproductive age.
Here is how certain genes do not affect us until later in life:
1. The "Accumulated Damage" Mechanism Many diseases, such as cancer and Alzheimer’s, are not caused by a single, instantly active gene, but by the accumulation of cellular stress and damage over many years.
Threshold Effect: A person may carry a genetic predisposition (susceptibility) that is harmless when young. As years pass, environmental factors (smoking, diet, stress) and natural aging damage cells.
The "Multiple-Hit" Model: Multiple genetic, environmental, and aging-related risks must accumulate to reach a "threshold" before symptoms appear, such as the accumulation of toxic proteins in Alzheimer’s.
2. Epigenetic "Memory" and Timing Epigenetics allows genes to be switched on or off in response to life stages or experiences.
Gene Expression Memory: Events early in life can "program" how genes behave much later, acting like a memory that persists across the lifespan.
Methylation/Silencing: Chemical modifications (like methylation) can keep a gene "off" during youth, but as the body ages, these controls can weaken or change, allowing the gene to express.
3. Evolutionary Pressure (Medawar’s Hypothesis) Evolutionary theory suggests that natural selection is less effective at eliminating harmful genes that only take effect after an organism has reproduced.
Reproductive Timing: Genes critical for surviving to reproduce are heavily constrained by evolution (must be "good").
Late-Life Erosion: Genes that cause problems after reproduction are under less pressure to be "good." Therefore, variations in gene expression are much higher later in life, leading to more erratic, harmful, or late-acting gene behavior.
4. Genetic Switch Model of Aging Research suggests that, similar to development, aging is a "genetically-programmed switch".
Protective Shutdown: In youth, genes maintain high cellular repair, DNA maintenance, and stress resistance.
Turning Off Repair: Later in life, these protective mechanisms are naturally switched off (or down), allowing damage to accumulate and enabling other genes that promote aging (gerontogenes) to take effect.
Examples of Late-Onset Genetic Effects Neurodegenerative Diseases: Alzheimer’s disease or Huntington’s disease, where toxic protein buildup takes decades.
Male Pattern Baldness/Alopecia: Genes responsible for sensitivity to dihydrotestosterone (DHT) typically activate after maturity.
Cancer: Accumulation of mutations in tumor-suppressor genes over decades.
Key Takeaway: The "software" of your genome (epigenetics) controls the "hardware" (DNA). Over time, the, "software" changes due to age and environment, allowing genes that were once silent to become active, often with negative consequences in later life.”
I’m not sure I get your point about animals. It’s pretty straightforward – zoologists study animal behaviour and have observed homosexuality in many different species. That animals act on instinct surely reinforces the author’s point – it’s not a choice. An animal’s not likely to be sitting there thinking – “hmmm, I’m having some confusing thoughts, perhaps today I’ll experiment with another male animal”. It just humps what it wants. And if what it wants is of the same sex, what else can you call it but a homosexual animal?
“It strikes me as a bit strange that he is referencing animal instinctual behavior and calling that a choice.”
He is not saying that – he is saying that same-sex behaviour in humans is NOT a choice, referencing the animal kingdom. But one could be confused by his inclusion of the word ‘unnatural’ (“is not an unnatural choice…”), I suppose.
Same-sex sexual behaviour is natural. That’s the point. If this is the case, then suppressing public displays of affection (your particular bugbear?) should be equal across the board, not more stringently applied to any group in particular.
Do we need to ensure that children never witness heterosexual kissing? Should their parents refrain in their line of view? At what age can people safely be permitted to watch a film with heterosexual pashes?
Once you’ve decided, that should be the bar for another natural behaviour you appear to have a problem with.
I was watching a so-called climate expert on local television trying to explain how the inordinate cold weather being experienced in eastern Canada came from Texas. The current mob of climate fabricators have no idea where cold air originates because they have been conditioned to believe a false science.
While we in the true West in Vancouver, Canada (Pacific Coast) have experienced a relatively mild winter, the rest of Canada has been hammered with record low temperatures. That, of course, comes courtesy of the Arctic Air (Polar Vortex) which dumps cold air straight from the polar Arctic region.
Daytime temps in the Vancouver area at sea level have not yet dipped below 0C and I am tempting fate by revealing that. Some recent winters have seen us dip to as low as -15C, and it is local weather coming off the Pacific that shields us. Of course, climate alarmists go ominously quiet when it freezes here like that.
The Arctic is claimed by alarmists to be warming twice as fast as the rest of the planet. How then is it dumping extra cold air down as far as Texas and Florida?
The answer is surprisingly simple. Due to our axial inclination and our orbit, the Arctic (and Antarctic) receive little or no sunshine for a good part of their respective winters. That causes the Arctic Ocean to freeze with as much as 10 feet of ice and the lowering of the stratosphere dumps air with temperatures down to -60C into the polar region. Occasionally, in winter, that air gets distributed southward.
There is nothing we can do about it, no matter how much CO2 we manage to emit. Winter after winter, we can expect a froze Arctic with a varying polar vortex that will continue to drive frozen air as far south as Florida and Texas.
And year after year we will continue to hear the same alarmist propaganda re how the Arctic is warming twice as fast as the rest of the planet.
BACK AT THE RANCK
ICE detained a 2-year-old girl in Minneapolis and put the child on a flight to a detention center in Texas, despite a court ordering her release.
https://www.startribune.com/agents-detain-and-send-2-year-old-girl-and-her-father-to-texas-despite-court-order-to-release-toddler/601569252
“What were the justifications for the boycotts of the Olympic Games in the 1980s? By my reckoning the potential threat is greater now than it was then. We need to have this discussion.” — Oke Göttlich
Willard, please stop trolling.
As if we needed more proof that the regime is more consumed with online branding than with clear public safety communication…
Another incredibly idiotic story.
https://www.mediaite.com/media/tv/another-incredibly-idiotic-story-jake-tapper-cant-believe-trump-officials-reportedly-told-fema-not-to-say-ice-amid-winter-storm/
Arkady,
As it a country wide it should be:
National
Immigration
Customs
Enforcement
The future Anon for Q-related reasons wants:
https://www.vocesunidas.org/post/ice-left-racist-death-cards-to-intimidate-latinos-in-eagle-county
Willard, please stop trolling.
As a proud ‘environmental insurrectionist,’ I ask, must we explain this every winter?…
GREENE, CHARLES H., and BRUCE C. MONGER. “An Arctic Wild Card in the Weather.” Oceanography 25, no. 2 (2012): 7–9. http://www.jstor.org/stable/24861337.
Earth is in a natural warming trend. To claim the warming is caused by CO2 requires the relevant science. IOW, it needs to be shown how CO2’s 15μ photons can raise the temperature of a 288K surface.
Both Greene and Monger roost at Cornell. Both are “educated” in “Biological Oceanography”, which means they have zero understanding of radiative physics or thermodynamics.
In fact, Monger is heavily into student indoctrination:
https://www.professorwatchlist.org/professor/brucemonger
The CO2 hoax is about politics, NOT science. Just as a cult is about beliefs, NOT reality. The cult kids here merely provide evidence of their indoctrination and inability to learn.
“In an interview, Dr. Monger – who describes himself as a socialist – admits his classes are taught for the purpose of creating revolutionaries.”
This is the same as arguing that global warming skepticism is about faith because Roy Spencer is a devout Christian.
One man’s predilections do not upend a body of thought.
Yes, there supposedly is a global hoax, and miraculously Clint R is the only one smart enough to notice.
His childhood superhero fantasy has finally found its outlet.
Eldro, I’ve already got plenty of childish stalkers proving me right, but there’s always room for one more.
Also, you didn’t do your homework:
https://www.drroyspencer.com/2026/01/uah-v6-1-global-temperature-update-for-december-2025-0-30-deg-c/#comment-1730296
Hey Puffman, riddle me this –
ICE thugs just executed a man immobilized on the ground –
https://bsky.app/profile/deanobeidallah.bsky.social/post/3md6mr7xhqc2u
What’s your excuse this time?
“Repatriate the gold” — German economists, seeing that Dozing Donald is unstable.
Eldrosion at 1:19 PM.
It’s best not to feed the troll
The cult kids no longer attempt science. Now, they’ve moved almost completely into politics, due to their TDS.
Variety is important in comedy….
Puffman, who is trying to bait a newcomer with one of his three riddles, pretends he’s here for science. The only thing that changed over the last decade with him is his various sock puppets. Unless we count when he posts crap like Charlie’s blacklist.
Let’s see if he can solve that riddle –
https://www.theguardian.com/business/2026/jan/24/europe-divorce-donald-trump-wef-davos-us-government-bonds
Would he go “treasuries go brrr”?
“The decision is rooted in the poor US government finances. Thus, it is not directly related to the ongoing rift between the US and Europe, but of course that didn’t make it more difficult to take the decision.” — Anders Schelde from AkademikerPension, promising it would sell all remaining US government bonds in its multibillion-
Willard, please stop trolling.
The USA is clearly on the path to fascism.
Another murder by ICE:
https://www.startribune.com/alex-pretti-identified-as-man-fatally-shot-by-federal-officers-in-minneapolis/601570109
https://www.nytimes.com/2026/01/24/us/minneapolis-shooting-federal-agents-video.html
*
What is happening in your country was described to me 40 years ago by my wife Rose’s mother, who witnessed similar scenes with SA murderers in Berlin in 1932.
Different clothes, same behavior.
A year later, the Nazi leader Hitler established the Nazi dictatorship.
*
Be careful, people: What is happening here is developing so quickly that you will soon no longer be able to control it.
*
Only wealthy Americans will be pleased when hundreds of thousands of ICE officers are stationed outside every polling place next November, preventing anyone suspected of not voting for Trump from casting their ballot.
Don’t forget: at a campaign rally in 2024, Trump told utterly devoted Christian supporters, “If you elect me, you’ll never have to vote again.”
Bindi, which causes you the most insomnia — your irrational fear of CO2, or your irrational fear of Trump?
Hey Puffman, riddle me this –
A video of Alex Pretti reading out the final salute of an unnamed veteran he cared for until the end of his life in the ICU, posted to Facebook by his son.
https://bsky.app/profile/badideas.bsky.social/post/3md7kq2i35k2c
When was the last time you did something like that?
Willard, please stop trolling.
Wow. Again Kristi Noem gaslights all of us. She wants us to disbelieve our eyes and ears, and instead believe her portrayal of the killing of this protester, who was pepper-sprayed, was pushed down onto the ground with 5 agents on him, then shot 10 times, as ‘defensive’.
He was legally carrying a weapon on his body. There is no evidence he tried to use it on agents. She claims that because he was legally armed, that he intended to do maximum harm to agents.
Now, we find that the investigation of this shooting, will be investigated by the DHS, headed by Kristi Noem, who as we saw, has already prejudged the case, rather than the normal protocol which be to have the Justice Dept Civil Rights Division investigate.
That is a typical lie from Nate who always misquotes people. Try this:
“The suspect also had 2 magazines and no ID — this looks like a situation where an individual wanted to do maximum damage and massacre law enforcement.”
Some may need a lesson in reading comprehension, but the term “looks like” suggests speculation as to the need for extra magazines that news media are reported to have “extended” capacity.
“The suspect also had 2 magazines and no ID — this looks like a situation where an individual wanted to do maximum damage and massacre law enforcement.”
Yep well this ought to alarm every gun-rights advocate, that their federal government assumes that if you are carrying a gun, while protesting, then you must be intending to massacre law enforcement, rather than simply exercising your 1st and 2nd amendment rights.
Since our Ivy Leaguer is once again trying to minimize as best as he can:
https://bsky.app/profile/simonwdc.bsky.social/post/3md7drykzwk2q
Being so blind to injustice might explain why our Ivy Leaguer sucks at estimating volatility drag.
He was a domestic terrorist who carried a loaded gun.
Max is a monkey.
“I don’t know why they shot him. He was only helping. I was five feet from him and they just shot him.” — From a federal court declaration from a witness standing five away feet from the murder scene.
‘carrying a loaded gun’!
That makes him a terrorist in the eyes of the Feds?
Max, you are scaring the gun-rights lobby.
My good friend happens to be a strong gun rights advocate, in large part to keep govt tyrrany in check.
He has a bumper sticker ‘Love your country, but fear your government’
If ever there was a moment for locals to fear federal govt tyrrany, it is now, in Minneapolis.
Right wingers should be supportive of local people outraged by Fed overreach, invading their neighborhoods and harming their community.
Let’s be clear. All of the available evidence shows the shooting was wrong. The guy did not need to be shot. No other conclusions are valid at this time. Once again, intelligent people ask questions and wait for answers. Just about everyone involved is doing something wrong. Poorly trained agents are out of control. Local officials — especially the Mayor and Governor — are making irresponsible statements.
Civil and Constitutional rights are enforced in the court system, not by rioters in the streets. If ICE and Border Patrol do not belong there, get a court order. Otherwise, shut and obey the law!
None of that has anything to do with Nate’s blatant misquote and lie.
Common sense, along with your usual hyperbolic ad-hominems.
Was not a quote nor misquote, but nonetheless captured her essential message.
“Civil and Constitutional rights are enforced in the court system, not by rioters in the streets. If ICE and Border Patrol do not belong there, get a court order.”
Im sure they have tried. But this is essentially a rogue President and his sadistic minions intent on abusing federal power to inflict maximum damage and sow chaos in the streets of liberal cities.
Perhaps so he can follow the authoritarian playbook and declare emergency powers.
As yet neither impotent congress nor the courts seem willing to intervene.
I happened to check in on Fox News. They were irate that some Dem congressmen were advocating to pull ICE’s funding.
But that is Congresses principle power for influencing government policy, which clearly they need to exercise at this moment.
Nate, please stop trolling.
Willard, Nate
TDS was always a rhetorical label meant to dismiss objections by framing them as emotionally driven complaints rather than arguments.
But when some of the same people here using that label casually describe the entire LGBTQ demographic as “perversion,” they are doing exactly what they accuse others of: substituting moral disgust for reasoning.
Irony sure is fun.
Eldrosion,
Once upon a time, Roy’s was dominated by three main trolling, each characters expressing a component of the Dark Triad: psychopathy, narcissism, and Machiavellianism.
There was Bully, who bad mouthed everyone. He was so abusive that Roy wiped out years comment threads. (Good riddance.) He somehow disappeared, but recently resurfaced at Tony’s.
Then there was Lulzy, who keeps lulzing and taunting. No manners. No morals. No depth. That’s Puffman.
And then there was Slimy. Slimy pretended he was Roy’s hall monitor for a long while, PSTering people. He stopped, returned to his old bad habits, but seems to be making an effort this week. After all, he’s just looking for love.
Puffman was the narcissist of the bunch. But now that Mike is gone, he’s making his sociopath traits shine through. That seems to isolate him from his usual dalliance. Other troglodytes won’t follow his path.
Welcome to Climateball!
Thanks.
In my view, Clint R’s lack of humility and restraint when he emphatically declares climate science a hoax largely drains the sting from any insults he directs at others.
I also tend to see him as an older timer whose worldview has not kept pace with where things are now.
He reminds me of another user I have interacted with over at WUWT named “bnice2000.” He’s also an older figure who denies science. I get bombarded with aggressive replies from him as well, but for similar reasons they don’t really land.
Eldro, it’s hard to display “humility and restraint” when emphatically exposing the CO2 hoax.
Part of the reason it’s a hoax is your cult can’t even define/describe how CO2 can warm the planet. You don’t understand the relevant science. You are unable to answer the simple physics question. That’s no surprise, as none of the cult kids understand the basic science either.
But what is interesting is that very few of your cult even understand their own cult’s “climate science”. So here’s another question for you: Your “Climate science” claims Earth is 33K warmer than it’s supposed to be. Where does the “33K” come from? IOW, what is the calculation that results in “33K”?
It comes from the greenhouse effect.
As stated, Eldro doesn’t even know his own cult’s “science”!
The “33K” is the difference between Earth’s average surface temperature (288K) and the temperature of an imaginary sphere receiving 960 W/m² solar (255K).
Eldro has no clue, same as the rest of his cult. But that doesn’t stop him….
And what physical mechanism causes that temperature difference?
“…and the temperature of an imaginary sphere…”
Get a responsible adult to explain it to you, Eldro.
As you can see, Eldrosion, Puffman is only here to play Questions and to lulz. Meanwhile, his sidekick is whining about how people are mean to him, oblivious to Puffman’s abuses, these days worse than the NRA prez’, who’s a pure sociopath.
Our Sky Dragon cranks only have about three talking points anyway.
As for Bordo, well, he’s Bordo. If you want astrology, there’s also Gill. Sometimes one answers for the other. It’s weird at first, but then we’re at Roy’s.
***
I have a story featuring Mr. Nice:
https://andthentheresphysics.wordpress.com/2024/01/16/how-to-cavil-like-cranks/
He appears in the comments at Tony’s.
Enjoy,
Willard, I read your story, very nicely done and genuinely entertaining.
I have not read Pat Frank’s paper on model propagation, but I did read his other paper in which he claims the temperature record contains systematic errors exceeding ±1C.
You have probably seen it as well. In my view, that paper is nonsense. There is extensive independent confirmation of the surface temperature record.
The surf. temperature record also shows consistent and coherent responses to ENSO events and volcanic forcing. If the uncertainty were truly as large as Frank suggests, those signals would not be resolvable and would be swamped by noise from the uncertainty bars he alleges.
I also saw the WUWT thread featured and I think you handled yourself very well. Bnice2000 was behaving aggressively, as usual, and undermining his own position. You also remained composed when responding to the concern troll who called you a monkey.
That’s WUWT for you. For the incoherent and the desperate, it passes as ‘information’. For everyone else, it is occasional entertainment.
Thank you for the kind words.
Pat’s propagation of nonsense is legendary:
https://andthentheresphysics.wordpress.com/2019/09/08/propagation-of-nonsense/
Even Roy had things to say, even tho he had to walk on eggshells:
https://www.drroyspencer.com/2019/09/critique-of-propagation-of-error-and-the-reliability-of-global-air-temperature-predictions/
Cheers.
I do not normally comment on this kind of thing, but you might want to be careful with making conclusions about people based on stereotypes. I consider each person to be an individual.
I will make an analogy that intelligent people will understand, and the rest of you can just carry on. A straight man who likes large women might think there is something wrong with a man who likes skinny women, and vice versa. Those individuals would most likely see something “wrong” with any other arrangement.
The problem with grouping everyone into the alphabet soup is the fact that there is no “P”, and for good reason. Everyone has limits of tolerance. The controversy with the Epstein Files is proof of that.
The following is off-topic but I am trying to establish that all science is affected by seriously shoddy science, not just alarmist climate science. These sciences are being controlled by small groups of paradigm-junkies who control peer review and ostracize any scientist who dares to be skeptical of a particular science.
Major search engines like Google have taken up the suppression of skeptics. Google AI is programmed to seek out only sources that Google deems ‘correct’. Here in Canada, the CBC (Canadian Broadcasting Corporation), although publicly funded, are seriously biased in their reporting of science.
***
eldrosion…the word perversion is being used out of context. One definition from Dictionary.com is…
“…the alteration of something from its original course, meaning, or state to a distortion or corruption of what was first intended”. As an example they use…’A scandalous perversion of the law’.
Then they offer a second definition related to sexual perversion which I find inconsistent with the first…
“sexual behavior or desire that is considered abnormal and unacceptable”.
I think they erred by including ‘unacceptable’. That’s the issue isn’t it? It becomes moralizing when someone implies that LGBTQ behavior is unacceptable. The words abnormal and unacceptable take the issues from one of scientific observation as in definition ‘one’ above to an almost religious definition based on morality.
When I use the word perversion, which I tend to avoid due to reasons given, I mean it in a scientific sense. The obvious reason for the design of sexual desire into humans and other animals is to encourage procreation. Anything else, even straight heterosexual sex, is essentially a perversion. That does not been it is good or bad, simply that it is a perverted based on the obvious.
Put another way, sexual desire is no big deal. It is a powerful force but people can easily get through life without indulging unless they want children. Back in the 1960s and 1970s magazines like Playboy and Penthouse began glamourizing sexual desire as something with which we should be comfortable.
That tended to removing the stigma for many and lead to an almost overindulgence. People began to feel entitled and overlooked matters like sexually-transmitted diseases. It also lead to the widespread belief that AIDS is not related to lifestyle but to a mysterious virus that no one has yet seen on an EM. The glaringly obvious conditions in which gay men carried on was ignored and excluded as a cause of AIDS.
Please don’t waste your time looking for photos of HIV on Google, most of them are computer generated and outright fakes. It’s apparently very difficult to tell the difference between an actual virus and viral particles that are similar but not viruses. Also, as Lanka has pointed out, many references to viruses are actually references to the cells believed to contain them.
A quick search with ‘images of HIV virus’ returns a plethora of images where each image differs remarkably from the other. An EM of a virus is always in black and white and has a size marker attached. Even at that, there is no guarantee that what is presented is a virus. I have seen B&W images from EMs with a size marker and the particles have a wide variety of sizes.
It is apparent that the LGBTQ community is in denial of this basic fact. Rather than acknowledge that what they do is rather odd, to say the least, they insist on covering it up using outright lies and deception while trying make everything they do seem absolutely normal. Heck, I don’t even regard some of the fun times I’ve had heterosexually as being normal.
Moreover, they attack anyone questioning their behavior, as homophobic, insinuating that such people have an extreme fear of their lifestyle. A phobia is a serious fear incurred by some who suffer from issues like GAD (general anxiety disorder) and panic disorder. The fear is immense and can be crippling in nature. I seriously doubt that anyone is phobic about the LGBTQ lifestyle.
To make my views clear, I need to go into the science and the history of HIV/AIDS. I apologize for taking up so much space, and I can justify it only as an example of how other branches of science have become corrupt, not only climate science.
One of the greatest lies and acts of deception by the homosexual lobby was putting immense pressure on the Reagan administration, circa 1983, to declare the cause of AIDS as a virus that no one could see on an electron microscope. The Reagan admin introduced the theory that HIV causes AIDS without peer review. HIV was simply anointed as the cause of AIDS and anyone questioning that decree was simply ostracized or blamed for passing misinformation.
At first, the media referred to HIV as ‘the virus thought to cause AIDS’. Over time, that was amended to ‘HIV, the AIDS virus’, without any further scientific evidence to back the claim.
When Kary Mullis, the scientist who won a Nobel for inventing the PCR method for DNA amplification, was in a lab, he called to a colleague and asked if he could cite a paper that proved HIV caused AIDS. The colleague replied, ‘Everybody know that’. That was the attitude following the inference by Montagnier circa 1983 that he had ‘inferred’ HIV, yet everyone seemed to know it caused AIDS even though no one could prove it.
Mullis was stubborn and went on a 10 year search to find such a paper. he even confronted Montagnier at a meeting and he shrugged it off, referring Mullis to Simian studies, the study of monkeys and apes. After 10 years, Mullis had not found one paper that proved how HIV causes AIDS.
The key here is that the scientist who inferred HIV could not point Mullis to a scientific paper that proved it. Even though Montagnier was awarded a Nobel for ‘discovering’ HIV he only ever claimed to have inferred it.
The scientists credited with discovering HIV, Luc Montagnier, freely admitted that his team had failed to see HIV on an EM, and that they had inferred HIV using retroviral theory that was about 10 years old at the time. I feel strongly that the team, being unable to see HIV on an EM, should have stopped there. However, there was immense pressure from a homosexual lobby for someone to come up with an explanation for AIDS.
Ergo, HIV was inferred using RNA taken from a man with AIDS in Paris. An early pioneer in the field had warned against using RNA as an identifier for a virus since RNA is found freely in the human body and had already been associated with disease, cell death, etc. In other words, RNA could simply be a marker of disease and not related to a virus at all.
Anthony Fauci and David Ho, had the idea of amplifying the inferred virus using the new PCR method for DNA amplification. The inventor of PCR, Kary Mullis, for which he was awarded a Nobel, immediately cried foul. He claimed that PCR cannot be used diagnostically to amplify an inferred virus that cannot be seen on an EM.
The PCR process is murky and does not test for a virus. PCR is great for amplifying DNA but not much else diagnostically. RNA ‘inferred’ to be from a virus, is converted to DNA. The process of amplification with PCR involves consecutive iterations in which the DNA is amplified iteration by iteration. If the DNA amplification reaches a certain number of iteration, that sample is claimed to represent a high viral load, in this case, HIV, even though no virus has been isolated physically.
The basic problem here is that the RNA suspected has already been presumed to be part of a virus genome. As Stefan Lanka has pointed out, the genomes are generated by computer programs based on presumptions. Google AI reveal that…”Before a PCR test is created, scientists sequence the entire genome of the target virus (e.g., SARS-CoV-2)”.
How do we know the genome of an unknown virus? Duh??? According to Lanka, an expert with viruses the genomes are created artificially and theoretically on computer models by guessing at them and piecing them together strand by strand. Montagnier recognized the HIV sequence in the alleged covid genome even though he admits he never saw HIV on an EM.
Lanka has written volumes on the fabrication of virus theory over the past 200 years and he makes sense to me.
Dremt…are you there? Need your biology input. Is Tim S not into biology as well?
That makes no sense yet it has become the go to test for identifying a virus. Covid and all other viruses since 1983 have been identified using the same RNA-PCR test. Since it does not test for a virus, how can a vaccine be developed? That did not stop Pfizer, a company already fined over 5 billion dollars for misrepresenting their products, from pushing out a covid virus in several months when it should have taken 6 years.
Where is the virus? All they ever see is amplified DNA and as Mullis claimed, a virus will still not appear if it could not be seen on an EM. He claimed that PCR amplifies everything equally, meaning all DNA converted from the original RNA, and if the virus was not obvious originally it will not be obvious after amplification.
Backtrack to Montagnier and his inference of HIV. At the same time, Peter Duesberg claimed it was not possible for HIV to produce AIDS even if it did exist. He thought it did exist. In fact, he claimed emphatically that AIDS had nothing to do with a virus and was solely the product of lifestyle. He pointed out that the most serious cases of AIDS involved 17% of the male homosexual population who indulged in sexual practices with multiple partners, high on drugs, often in steamy environments like the steam baths of New York and San Francisco.
Mullis inferred that the steamy environment could transmit particles of fecal matter into the lings. Such bacteria could set up pneumonia, one of the 30-odd infections that define AIDS. In fact, many of the AIDS defining secondary infections are not even related to a virus.
Duesberg was no lightweight. He was the youngest researcher of his time ever inducted into the National Academy of Science and he got inducted for discovering the first cancer gene. He also won California Scientist of the Year, among other awards. Unfortunately, Fauci got himself into a position with the National Institute of Health where he was responsible for meting out awards for researchers. He held a grudge against Duesberg for being so forthcoming about HIV and AIDS and withheld Duesberg’s funding, essentially ruining his career.
This is a sore point in climate science where skeptics can lose their jobs or funding, or be ostracized from publishing in journals, simply because thy question the status quo. Phil Jones, a Coordinating Lead Author on IPCC reviews has already bragged about taking steps to ban papers from skeptics from IPCC reviews.
Back to Montagnier. After inferring HIV and getting a Nobel, he amended his views on HIV, bring them inline with those of Duesberg. He stated that HIV is harmless to a healthy immune system and that AIDS is caused by oxidative stress related to lifestyle.
It is plainly obvious that AIDS is related to lifestyle and drug abuse as Duesberg claimed. The 17% minority of homosexual men, many of whom frequented steam baths, have sex with multiple partners while high on up to 6 designer drugs, were those most prone to AIDS causing death. It’s in the stats of the US CDC. That is, it was, unless the Democrats have erased it as they have with other scientific bodies. More than 90% of AIDS deaths are in a high risk group featuring male homosexuals, IV drugs users, and bisexual men, but only in those who practice high-risk sex.
An insignificant number of women, including female prostitutes, simply never got AIDS never mind died from it. The HIV/AIDS scam is likely one of the worst scams of the 20th century.
That is one of the greatest reasons I am opposed to the LGBTQ community, for hiding behind this scam which infers that heterosexuals are equally at risk re HIV. They have willfully supported a very costly scam and gone into deep denial about it. When journalist John Lauritsen, himself a gay activist, took his enlightened views on HIV/AIDS to the San Francisco gay community, he was rebuffed and told to mind his own business.
Lauritsen;s message was that amyl nitrates used by gay men to relax anal muscles was in fact causing lung cancer and pneumonia, both classified as AIDS. The drug is sniffed and was designed for angina sufferers to dilate cardiac arteries. Sniffing the drug out of shared bottles had a double-whammy, they victims not only inhaled the drug, they also inhaled bacteria-laden steam particles. Direct proof that this drug was leading to AIDS, by definition.
https://www.virusmyth.com/aids/index/jlauritsen.htm
I regard the gay community as among some of the most closed-minded and narrow-minded people around. I also regard them as being very self-centred, pushing their own agendas, even on children. That’s why I feel negatively about them, it has little to do with perversion or morality.
If you have an interest you can find anything you need from a scientific POV here…
https://www.virusmyth.com/aids/index.htm
Another irony is that those who claim to renounce bigotry in their politics on this blog seem to be the most bigoted against those that question the GHE.
Awww. And don’t forget Flat Earthers.
See what I mean? A deliberately false and insulting comparison to kick off the bigoted abuse.
Apt comparison. Neither Flat Earthers nor GHE deniers care about facts or logic. Both are shamelessly sacrificed to maintain their nonsensical beliefs.
Wrong, and insulting.
You realise even if “back-radiation warming/insulation” were a thing, there are still many, many arguments against a radiative GHE.
On the other hand, there are no plausible arguments against a round Earth.
Sorry, but your arguments are neither logical or plausible.
Wrong, but irrelevant. None of this is about me, or my arguments. There are many, many arguments made by many, many people against the GHE. From all different backgrounds and levels of expertise. Only one of them needs to be right.
If there was any sort of consistency to what is presented as the GHE then there wouldn’t need to be so many different arguments against it. But, there you go.
The point is, questioning the GHE has nothing in common with Flat Earth. Flat Earth is science denial. Questioning the GHE is what every climate scientist ought to be doing! Yet, it’s not “permitted”. It’s become stigmatised. Anyone who questions the GHE is called a crank or dismissed as a Flat Earther, etc. In some cases they can even lose their jobs!
That’s what happens when science gets “politicised”.
Just look at how bad this blog’s getting…
“There are many, many arguments made by many, many people against the GHE”
There are many arguments made in support of perpetual motion machines, and free energy from water on the internet.
This blog, led by a climate-change-skeptic and meterology expert, Roy Spencer, has debunked the most prominent arguments made against the GHE.
People should at keast take his arguments seriously.
“when science gets “politicised””
The laws of physics are apolitical.
Nate kicks off with some more false comparisons. Then:
“This blog, led by a climate-change-skeptic and meterology expert, Roy Spencer, has debunked the most prominent arguments made against the GHE.”
In your extremely biased opinion. From what I’ve seen, and with all due respect to Dr Spencer, they’re just endlessly misrepresented.
“People should at keast take his arguments seriously.”
All arguments should be judged only by their own merits. Whoever made the argument should be considered irrelevant. Strictly speaking. Obviously people are more likely to find arguments made by those with relevant expertise more convincing. However, I note that when people like Ferenc Miskolczi, who is an atmospheric physicist specialising in radiative heat transfer, argue there is no GHE, that this principle somehow no longer applies. Instead they’re labelled a crank and completely ostracised from the scientific community.
“The laws of physics are apolitical.”
Yes. Like 2LoT.
DREMT 2:10 pm makes yet more erroneous comments writing: “people like Ferenc Miskolczi, who is an atmospheric physicist specialising in radiative heat transfer, argue there is no GHE”
Google AI refutes DREMT answering:
“A radical but rather elegant theory has been proposed by a Hungarian Physicist Ferenc Miskolczi that the Earth maintains a maximised greenhouse effect…”
He argues there’s no enhanced GHE; in other words, adding more CO2 to the atmosphere does not lead to warming.
And, I’m not going to be discussing his arguments in detail because it’s not relevant to the point I’m making.
No DREMT 3:37 pm, Miskolczi did NOT argue there is no enhanced GHE due added ppm CO2. His paper reported finding humidity decreases measured by sparse radiosondes simply offset the added ppm CO2 effect on atm. optical depth calculations in a certain time period.
…resulting in no overall warming effect from adding CO2 to the atmosphere.
In every field of science, there are always outliers, who claim the established science gets it wrong.
We can still find outlier bioligists, that Gordon regularly reminds us of, who claim viruses dont exist or cause illness.
Are they right? If they are, then tons and tons of observations would have to be sonehow wrong.
Not very plausible.
The mere existence of these outliers on the GHE, cranks in many cases, is nothing extraordinary nor particularly meaningful.
Given the piles of evidence in support of the GHE, the odds are quite low that the outliers are right.
Unlike Flat Earth, where evidence has to be directly rejected and observations claimed to be deliberately faked, all the evidence supposedly in support of the radiative GHE is “open to interpretation”.
DDREMT 1:43 am: … confirming both a GHE and enhanced GHE in his work.
Why is Ball4 arguing with me, and what exactly is he arguing about?
Gun-rights proponents of America, the shooting of Alex Pretti in Minneapolis shows how little respect the regime has for the Second Amendment.
A “good guy with a gun,” a lawful concealed carry, was pummeled and murdered in the street in broad daylight. Shot in the back nine times while being pinned face down to the freezing ground by half a dozen heavily armed federal agents, after they had taken his gun.
They’re going to come for our guns next when they’re done with “The Left.”
Wrong again, Ark. The shooting might show how little respect some people have for law. Or, it might show what “suicide-by-cop” means.
Let the investigation happen. There are probably other videos out there that will help clarify the situation. Just having a weapon was not the problem, but did he go for it?
No, he didn’t go for the gun. It was still holstered in the back of his belt. he never reached behind him. The gun was taken by an ICE officer, and it was AFTER that happened that he was shot multiple times in the back after being pepper sprayed in the face and while pinned down by several guys.
That’s what more video footage has revealed, as well as him holding his hands up, holding a phone, and trying to help the woman they shoved to the ground. His last words were to her: “Are you ok?”
The video I saw showed him wrestling with officers, resisting/obstructing, typically grounds for arrest. Wait for the investigation to finish. I don’t know if shooting him was necessary, but he clearly wasn’t a “law abiding citizen”. The truth will out, just as it does with you cult kids.
The Left wants things like this to happen. That’s why they provoke law enforcement as much as they do. We see the same kind of childish provocations here, such as “riddle me this” and “lying dog”.
Hey Puffman, riddle me this –
https://bsky.app/profile/lawprofblawg.bsky.social/post/3mddf42bbns2e
Who’s Kyle Rittenhouse?
“The video I saw showed him wrestling with officers”
Link please. All I saw was him shouting and them pushing him, pepper spraying him, and when he went to help a woman up, wrestling him to the ground.
Show us the video.
“Let the investigation happen”
There was none for Renee Good.
There will be only a sham investigation by DHS for this one.
I saw an interview with an analyst who correctly stated that standing directly in front of a Federal Agent and blowing a whistle at full volume is not against the law. Is it a good idea?
That is how this one started. That is what the woman was doing. The one the guy was protecting from the poorly trained and highly stressed agents. It is not against the law to act foolishly, but it is against the law to rough up an innocent protester. Law enforcement is supposed to take it on the chin, or in the ear in this case. If you look at professionally trained, disciplined, and supervised LEOs, they do just that. They take abuse until it becomes physical at which point an arrest is appropriate.
These guys are most likely not able to find a steady law enforcement job, so they answer the recruiting offer from ICE and get sent into the streets with minimal training or proper supervision. None of that excuses the very irresponsible language coming from the Mayor and Governor.
My advice is simple. Do not show up to a violent protest with a loaded firearm. Obey all commands from law enforcement. If confronted, raise your hands and surrender. Announce that you have a firearm immediately. Do not fight. This guy was probably within his rights to carry the gun — dead right!
There are two related cases that demonstrate the effect of sustained stress. In general, police that are involved in a long car chase, can become very violent at the end due to Adrenalin and other effects.
California Highway Patrol are among the most carefully selected, trained, disciplined and supervised LEOs in the country. They are also amazingly well paid with a six-figure starting salary. There was a case of a very long car chase involving immigrants. The people were in effect victims as well. It was the driver who was the criminal, but after more than an hour when it ended, some of them just started beating up the people for no reason.
There was also a case somewhere (Chicago?) that some kid was doing a really good job of running from the cops by jumping fences and just running crazy, but it was working. He was getting away. Finally, they cornered the kid and he pulls out a knife. This was a time to negotiate. One of the cops decides he’s done and proceeds to empty his whole magazine of 15 shots into the kid out of pure frustration. Yes, he went to prison.
The point is that humans are more likely to become erratic when they are subjected to prolonged stress like people blowing whistles in their faces.
“Yes, he went to prison.”
Good.
But the problem is that the DHS, the Dept of Justice, the FBI, and the rest of the govt has shown that they have no intention to properly investigate nor hold their people accountable.
That the agents are violent, poorly trained, and unrestrained is a feature not a bug.
“None of that excuses the very irresponsible language coming from the Mayor and Governor.”
Such as? Can you provide quotes?
That is the Fed government’s narraitive.
All I have heard is that they want ICE to end this inflammatory operation in their state/city.
“My advice is simple. Do not show up to a violent protest with a loaded firearm.”
That may be good advice, but it seems that you (and others) are implying it is unwise to exercise your 1st and 2nd amendment rights at the same time. Either protest without a gun, or carry a weapon but do not join a protest if police are near.
“If confronted, raise your hands and surrender.” Alex Prettis is on video raising both hands in the surrender motion. To me it looks like he is clearly indicating he does not intend to threaten.
Yes, I think you are correct on the lack of training here. Military and border policing is a different exercise to urban pacification.
Saw an iterview with Greg Bovino, the guy who led the Minneapolis operation, with Dana Bash.
He said that he personally had protested while legally armed, and that there was nothing wrong with that.
Trump, ICE and DHS are, right now, trashing legal gun owners and concealed carry. That’s my point here. That’s the canary in the coal mine.
“Freedom is not Free.” Alex Pretti.
Ark, settle down. If it turns out this trouble-causer was illegally killed, the officer will be prosecuted, probably spending a long time in prison.
You need to be looking at the people that caused this to happen. Look at how elated Walz is, for example.
Look at those signs people are carrying:
mg.apmcdn.org/e0a62c9f119f3f7cb056f3d018af54e548291829/uncropped/104a12-20260108-people-hold-signs-and-protest-webp2000.webp
According to Wikipedia The Party for Socialism and Liberation (PSL) is a communist political party in the United States. PSL describes itself as a revolutionary socialist party, as the party believes that only a revolution can end capitalism and establish socialism. PSL pursues this goal by participating in local protests, running candidates in elections, and conducting political education.
PSL is a Marxist-Leninist party. PSL describes its primary goal as the revolutionary overthrow of capitalism. PSL supports the Worker’s Party of North Korea and the Communist Party of China. PSL is financed by businessman and socialist Neville Roy Singham living in Shanghai, China.
Correct link:
https://img.apmcdn.org/e0a62c9f119f3f7cb056f3d018af54e548291829/uncropped/104a12-20260108-people-hold-signs-and-protest-webp2000.webp
Vice President JD Vance unironically compares the regime-led economy to the Titanic.
https://www.yahoo.com/news/articles/jd-vance-comes-metaphor-trump-162056373.html
“Brownie, you’re doing a heck of a job”
Arkady, please stop trolling.
BACK AT THE RANCH
https://www.rollingstone.com/politics/politics-news/nra-ceo-doug-hamlin-tortured-killed-cat-fraternity-1235133164/
Willard, please stop trolling.
Trump 9 Days Ago: “If Canada can get a trade deal with China, they should do that.”
Trump yesterday: “If Canada makes a deal with China, it will immediately be hit with a 100% tariff.”
Trump Dementia Syndrome.
So what? Canada can freely make a trade deal with China, but it has consequences (100% tariffs).
“So what?”
Yes, you’re right.
This will be the fastest TACO ever when Trump realizes that a 100% tariff on Canadian oil will mean an extra $ 1/gal at the gas pump.
But, I’m sure Venezuela’s oil will replace Canada’s oil any day now!: https://www.dailymail.co.uk/news/article-15447321/oil-giants-fret-trump-tweet-upend-venezuela-investment.html
Ark doesn’t know how to play chess.
And, I bet he couldn’t learn….
Hey Puffman, riddle me this –
https://www.axios.com/2026/01/25/cruz-trump-vance-secret-tapes
What’s your ELO – 800?
“Boo hoo.” — An ICE thug, after a colleague murdered Alex Pretti.
Nah. He has been acting like a King with his random tariffs when he feels like it. The Supreme Court seems likely to tell him soon he does have that authority.
arrgh
‘that he does not have the authority’
The cult kids don’t understand Trump uses tariffs as a tool. A tool, such as a hammer. Once the nails are all hammered in, he can put the hammer away.
They think that means he caved, because he put the hammer away!
Kids these days….
Hey Puffman, riddle me this statement from Matt Moberg, chaplain of the Minnesota Timberwolves –
https://bsky.app/profile/gregolear.bsky.social/post/3mdbsboorn22g
Do you think you can keep waving your hands?
Willard, please stop trolling.
For the deranged Trumpistas
https://www.washingtonpost.com/nation/2026/01/25/live-updates-minneapolis-shooting-alex-pretti/
The head of the U.S. Border Patrol sidestepped key questions about the fatal shooting of Alex Pretti, a 37-year-old intensive care nurse, including how many shots were fired and whether the victim brandished a weapon, as other Trump officials have alleged. Minneapolis Police Chief Brian O’Hara noted that Pretti appeared to be exercising his First and Second Amendment rights. O’Hara told The Washington Post that “it’s very obvious from a lot of these videos that this is not what professional policing looks like in this country today.”
A Post analysis of videos that captured the incident from several angles found that federal agents removed a handgun from Pretti’s back near his waistband moments before he was shot multiple times. Criticism of the administration’s actions in Minneapolis ramped up, with a majority of House Democrats pushing the chamber to consider impeaching Department of Homeland Security Secretary Kristi L. Noem. Oklahoma Gov. Kevin Stitt (R) said President Donald Trump is “getting bad advice” and that Americans “don’t like what they’re seeing right now” in Minnesota.
*
https://www.washingtonpost.com/investigations/2026/01/25/minneapolis-shooting-video-gun/
Federal agent secured gun from Minn. man before fatal shooting, videos show
A Washington Post analysis of videos sheds light on the encounter that left 37-year-old Alex Pretti dead.
Federal agents who were wrestling a man to the ground in Minneapolis early Saturday had already secured a handgun he was carrying by the time they fatally shot him, according to a Washington Post analysis of videos that captured the incident from several angles.
As many as eight agents were attempting to detain Alex Pretti, a 37-year-old ICU nurse, videos show. One emerged from the scrum holding Pretti’s gun, having removed it from his waistband area. Less than a second later, the first of what appear to be 10 shots was fired. It is not clear from the video whether the other agents realized Pretti — who local authorities believe had a permit to carry the weapon — had been disarmed.
In that kind of situation officials don’t ask gun permits. They take no risks when you have to make decisions in a split second.
“The Party for Socialism and Liberation (PSL)” needs martyrs and now they have two already. Does the next president of the U.S. come from China?
What is outraging gun rights advocates is that he was within his rights to both carry the gun and protest.
But after tbe fact, the government claimed that the because he was armed, he was intent on shooting the agents.
Unless he was attempting to use the gun, he should not have been shot, in the back, while no longer in possesion of a gun.
Who reads
” Federal agents who were wrestling a man to the ground in Minneapolis early Saturday had already secured a handgun he was carrying by the time they fatally shot him.”
but replies with
” In that kind of situation officials don’t ask gun permits. They take no risks when you have to make decisions in a split second. ”
very certainly belongs to those who intentionally divert and misrepresent the reality, hence also belongs to those who have nothing against tbhe US inevitably moving, under the Trumping boy and his hench(wo)men, toward Fascism.
Bindidon: It’s easy to watch those slow motion videos and say “Federal agents had already secured the handgun.” If you watch the videos in full speed, then you can’t see that kind of details because it all happened so fast. Faster than snapping your fingers. And why he had those fully loaded extra clips?? It looks like he was prepared for a gun fight and mass murder.
“If you watch the videos in full speed, then you can’t see that kind of details because it all happened so fast. Faster than snapping your fingers.”
…. which is why you slow down the video.
” It looks like he was prepared for a gun fight and mass murder. ”
Once morre the ‘smalltalk’ of a person who thinks he can utterly lie just because everyone can lie on this blog.
MaxC has the same bullishit in his head as Gregory Bovino and all his ICE guys & dolls (oh yes: also woman).
What about watching information describing Alex Pretti, instead of woefully, disgustingly discrediting him as a potential mass murder?
Shame on you, MaxC!
“It looks like he was prepared for a gun fight and mass murder.”
MaxC, you are regurgitating the shameless gaslighting from DHS.
Are you really so easy to manipulate?
Think for yourself.
Nate, please stop trolling.
So a man shot dead exercising his rights under the 1st and 2nd amendment is being pilloried by the right as if those rights don’t exist.
His protesting is touted as impeding government officials, and his legal carrying a weapon is branded a provocation.
The right in the US is unrecognizable. Where once it railed against governmental overreach on freedom of speech and the right to bear arms, their true colours (again) become clear, dropping these ‘ironclad’ precepts in favour of supporting policies they favour.
The lies they tell each other are nauseating: that Pretti was brandishing a weapon, attacked federal officials, was a domestic terrorist. That’s the crap they have to buy into to distract themselves from their once core values.
barry
Merci beaucoup / Vielen Dank / Thanks a lot for this excellent comment which of course will be denigrated by the Trump addiction deranged, far right extremists and all these very wealthy persons who, like in Germany’s 1930s, silently welcome these days an incoming destruction of rights.
It’s wild how the same people who spent years yelling “don’t tread on me” were the first ones who willingly crawled on their bellies and kissed the boot the second actual Fascism came to America.
You have very selective memory.
During Obama reign he deported 3 million often without trial, built cages and ranted about how illegal migration hurt America. Can you show me your posts that condemned Obama views?
Texas is apparently working with ICE and there is little violence.
Whereas Tim waltz, who on the surface seems to be corrupt, is fuelling the riots. Or have you forgotten there is billions of fraud that’s being uncovered.
With the exacerbated tensions it is little surprised that mistakes are being made.
“Whereas Tim waltz, who on the surface seems to be corrupt, is fuelling the riots. Or have you forgotten there is billions of fraud that’s being uncovered.”
You are an easy mark for government gaslighting. The fraud is not by the governor.
Minneapolis has the largest number of DHS agents of any city in the country. They outnumber the police. They should be at the border, are not trained to manage urban protest.
They are being encouraged to intimidate or beat up people documenting their actions with phones. That tactic is what started the events that led to the murder of the nurse, who was brandishing nothing but a phone.
THAT is obviously what is creating the chaos.
Downfall, Bovino edition:
https://bsky.app/profile/tom.medsky.social/post/3mdf22bpdz225
I’m 100% sure his amazing historical ancestors are, so to speak ‘a posteriori’, very proud of him:
https://www.houseofnames.com/bovino-family-crest
Setting aside the fact that in the Obama era due process was given when the law required (unlike Trump), and that the many non-tried cases fell within immigration law, such as recent arrivals or already convicted criminals – people with judge-signed deportation orders (Trump is deporting non-criminals who have been in country for years – which does require notification and a hearing under US law)…….
You entirely missed the point. Which is about the right ceding their most cherished values to policies they like.
Nice try on the whataboutism, but not only is it incorrect, it is a tediously typical deflection.
What do you think of the right abandoning 1st and 2nd amendment rights in favour of government policy?
barry
You’re absolutely right: People like QAnon severely distort the perspective when they compare Obama (but as if by magic… not Bush DubbleU) to the Trumping boy.
95% of those deported from the US in 2015 under Obama’s administration were criminals; under the Trumping boy’s disastrous admin, this happens regardless of the activities of the illegal immigrants and – as you just said – with absolute arbitrariness and disregard for applicable federal and state laws.
*
But… the QAnon boy’s whole range of misrepresentations includes more than just immigration policy in the US/UK and elsewhere: he behaves in the same way when he polemically denigrates analysis results obtained e.g. from various surface station data – of course without showing any technical let alone scientific contradiction.
Bindidon, please stop trolling.
With the US48 likely to be down quite a bit from a December high, I’m predicting a significant drop for the January global figure… 0.12 deg. C
Only the eastern U.S. has experienced a real winter.
https://www.snow.news/p/snow-drought-update-january-2026
The Polar Vortex is being attacked by a large high, short circuiting air flow to the Stratosphere. And possibly setting up another Arctic blast (SSW).
https://watchers.news/2026/01/24/stratospheric-warming-developing-over-the-arctic-forecast-to-weaken-the-polar-vortex-and-influence-february-weather/
ENSO is warming slightly, with area 3.4 trying again to move above -1C. (Still many months from an El Niño, however.)
The last two months of UAH Global have seen significant drops, Nov.=0.43C (0.1 drop from 0.53) and Dec.=0.3C (0.13 drop from 0.43). So the recent down move may need a rest.
Putting all this together we might even see a slight uptick for January Global, say 0.32-0.34.
Then the down tread can continue into spring/summer.
Hey Puffman, riddle me this –
https://www.bloomberg.com/news/articles/2026-01-27/heat-wave-upends-australian-open-as-temperatures-set-to-hit-45c
Is this…the solar minimum?
This link shows the Polar Vortex with the attacking high-pressure system. The PV is the system on the right, and the high is to the left. Note how the high is much more organized (circular) than the PV. The conflict is supportive to formation of a SSW.
https://postimg.cc/wtXj4QQp
Here’s a better link, Puffman:
https://bsky.app/profile/teroterotero.bsky.social/post/3md7e623ijs23
Why can’t you call it Greenland’s revenge, like a grown-up would?
Let’s show Buzz how perfectly the whole Globe and CONUS aka USA48 correlate within UAH LT’s zonal and regional subseries…
https://drive.google.com/file/d/1duEiW7tr96iRihutC54CQS4F8faXLDy6/view
{ All USA48 anomaly peaks and drops above 2.0 resp. below -3.5 were cut off. }
We see by just simply eye-balling the 13 month averages how often Globe and USA48 behave more controversial than aligned (what was anyway already visible in the 24 month table shown at thread’s top).
Even during the global El Nino / La Nina sequence between 1997 and 1999 they differ by a lot.
No wonder: CONUS is about 6% of Globe’s land and about 2% of Globe’s land and ocean (in UAH’s 2.5 degree grid: about 200 USA48 cells compared to about 9,500 for the whole Globe).
Let’s show Bindidon that the US48 was the highest for two years, so I’m guessing it will drop – and add to the ‘cooling’. We will soon see in a week.
” With the US48 likely to be down quite a bit from a December high, I’m predicting a significant drop for the January global figure… ”
If there is any such significant drop, it might be much more due to the 5 month lag between ENSO signals and their appearance in the LT data than to anything USA48 could ever tell us:
https://psl.noaa.gov/enso/mei/data/meiv2.data
https://www.cpc.ncep.noaa.gov/products/CFSv2/imagesInd3/nino34Mon.gif
Key CFSv2 & Climate Trends for January 2026
” Based on CFSv2 modeling with December 2025 initial conditions, the January 2026 U.S. climate outlook is driven by a transitioning La Niña, featuring
– below-normal temperatures across the eastern US/Plains
and
– above-normal temperatures in the West.
Wetter-than-normal conditions are expected in the Upper Mississippi Valley, while persistent ridging brings dryness to California. ”
We’ll see.
A descending sort of the USA48 series shows that its Dec 2025 anomaly wasn’t only the ‘highest for two years’, but above all the second highest since its beginning:
2012 3 2.24 (°C)
2025 12 2.10
2017 2 2.06
1981 4 1.97
1999 11 1.87
2016 11 1.84
2021 12 1.81
2007 3 1.75
2015 3 1.57
1979 12 1.53
No matter. With a lower US48 contributing, I’m predicting a significant drop for the January global figure… 0.12 deg. C.
https://www.wsj.com/world/asia/trump-threat-on-south-korea-jolts-trade-partners-who-thought-they-had-deals-c9146efa
“who thought they had deals”
October 29, 2025: Trump announced a trade deal with South Korea whereby they would pay the U.S. $350 billion in exchange for lower tariffs and purchase U.S. oil and gas in “vast quantities.”
January 26, 2026: Trump now says that “Because the Korean Legislature hasn’t enacted our Historic Trade Agreement,… I am hereby increasing South Korean TARIFFS… from 15% to 25%.”
Conclusion: Trump’s “deal” was fake and hasn’t happened. None of the deals he announced are happening. MAGA celebrated them all like they were real.
The most important thing to remember is that 100% of those tariffs are paid by US companies and consumers. It’s a consumption tax.
Ark, you STILL don’t understand the tariffs issue. Start here:
https://www.drroyspencer.com/2026/01/uah-v6-1-global-temperature-update-for-december-2025-0-30-deg-c/#comment-1730654
Hey Puffman, riddle me this –
https://bsky.app/profile/thetnholler.bsky.social/post/3mdeblvu25c2o
Is shamelessness a requirement to be enamored with Dozing Donald?
“He was not at a “protest,” he was documenting CPB actions. He did not “take that 9mm and start to engage”; it was holstered. He didn’t “resist arrest”—he was pinned and then executed within a matter of seconds. But it’s so clearly indefensible they have to lie.” — Julian Sanchez, on Sean Duffy’s lies to cover up for the murdering of Alex Jeffrey Pretti.
Willard, please stop trolling.
Since January 5 when I re-upped these graphs https://ibb.co/chfy3mmq, they have been viewed another 200 times for a total of 312 views.
The graphs in the image, from Petty (2006), display actual infrared emission spectra measured by a satellite looking down at Earth in different regions.
It’s good to see so much interest in the compelling, direct empirical evidence that the greenhouse effect exists and that specific gases a b s o r b radiation at particular wavelengths.
Sorry Ark, but that ain’t “emission spectra”. It’s “radiance”. Emission spectra is measured in “W/m²”.
There’s no chance you can learn the difference, so just enjoy your TDS. That’s all you’ve got….
You show no more self-awareness than a dog licking its own arsehole in the middle of a crowded public sidewalk.
Archie proves me right again, with his immaturity and anal fetish.
Cringe.
1. Pseudoscience genius Clint R isn’t about to understand that
– while emission spectra represent the specific, discrete wavelengths of emitted radiation
– radiance is the total radiant energy emitted per unit area over a range of wavelengths.
While emission spectra are a qualitative measure, radiance is a quantitative one. Nonetheless do they express the very same thing.
*
2.This graph series makes it abundantly clear that the effect of CO2 in Antarctica is exactly the opposite of that in the other three regions, and clearly confirms how naive the notion propagated by pseudo-skeptics is that CO2 necessarily has the same effect everywhere due to its worldwide homogeneous distribution.
*
Even if H2O in water vapor form remains for long the major GHE constituent, it is interesting to see such CO2 behavior.
Ooops?!
I just see when looking again at graph (b) in the figure
https://ibb.co/chfy3mmq
that not only the CO2 spectrum around 15 µ is the opposite of that in (a,b,c); the entire frequence range shows kinda inverted behavior, even in tiniest details like the portion of the atmospheric window between 9 and 10 µ and within it, also the inverted ozone peak at 9.6 µ.
Amazing.
Wrong Bindi. “Emission spectra” and “Spectral radiance” are completely different. The two even have different units. “Spectral radiance” is NOT “Emission spectra”.
You just start making nonsense on your keyboard and believe it means something. Like when you claimed proof of lunar rotation, but couldn’t produce any. You couldn’t even come up with a viable model of “orbiting without spin”.
You’re not fooling anyone, except maybe Willard….
Clint R
As in all your replies, you come across as so ignorant, stubborn, and prejudiced that you don’t understand at all what the people you’re replying to have actually written.
Whether or not you post your blah blah along my comments doesn’t change anything; but everybody on this blog knows that you never will become able to resist your urge to write your endlessly irrelevant nonsense.
Bindi, if you can’t stand reality then quit stalking me. You’re one of the many frauds here that has NO interest in science or learning.
Hey Puffman, riddle me this –
Some Nazi freak ran up on Ilhan Omar at a town hall just a minute ago, sprayed her with unknown liquid, threatened her life before he was tackled by her security. Meanwhile in Iowa, nearly simultaneously, Dozing Donald calls for her to be “dealt with like drug dealers, boom boom boom”
https://bsky.app/profile/pulsar.bsky.social/post/3mdh3etrvsc26
Coincidence?
Willard: You mean Somali refugee Ilhan Abdullahi Omar from Mogadishu, Somalia? Is she legally in America? She married her brother Ahmed Nur Said Elmi to get some welfare benefits. Elmi lives in Somalia, Africa.
I wonder if there is a connection between the massive 20 billion dollar welfare fraud discovered in the Somali community of Minneapolis and the 3500% increase in the personal wealth of Democratic Rep. Ilhan Omar since taking the office in January 2019? ICE should pick her up, but she says that investigating fraud is racist.
Another troglodyte who can’t read:
https://www.yahoo.com/news/articles/trump-trashed-ilhan-omar-hours-032411469.html
Dozing Donald is othering more than immigrants in his hour-long speech, which makes people wonder – what drugs did he take?
“I do think that he will lose the midterms because of Stephen Miller” — Ileana Garcia, who didn’t think the leopard would eat HER face!
Willard at 7:28 PM.
I watched the video here: https://bsky.app/profile/thetnholler.bsky.social/post/3mdh5php4hc2x
It’s a good thing for that guy he was tackled by security, because it looked like Omar was going to beat his ass. She ran straight at him hands balled up. That’s courage!
100% Trump’s fault.
Bindidon at 3:58 PM.
Yes, you’re absolutely on point to highlight the vertical temperature structure effect on the Antarctic spectrum.
Due to the very cold, dry polar conditions, (1) the surface temperature is colder than the emission temperature in the CO2 band, and (2) there may also be a strong surface temperature inversion. As a result the CO2 band shows higher outgoing radiance than the window region.
In the other regions (a, c, d), the CO2-band radiance is lower than the window radiance because it originates from colder, higher layers.
The graphs show direct empirical evidence of how the greenhouse mechanism operates.
TY
Thank you for confirming my layman’s opinion.
I think that though clearly differing from graph (a), graph (d) nevertheless might look somewhat redundant; I’d have much more appreciated the Arctic region instead which could look like a mix of (a/c) and (b).
*
Maybe you’ll appreciate this dissertation:
CO2 Profiling in the Lower Troposphere using
a High Spectral Resolution Infrared Radiometer
Kobra Khosravian Ghadikolaei
Cologne 2017, Germoney
https://kups.ub.uni-koeln.de/8704/1/Kkhosravian_dissertation.pdf
Ark, you keep getting it wrong — really wrong! It’s like you believe if you get it wrong enough, somehow it will be right?
Take a deep breath and let’s see if you can get untangled.
“Emission” is NOT “radiance”. The units are different. When the units are different, that should tell you something. The two aren’t even measured the same, or at the same locations! You’re trying to compare two completely different things.
If you really know “how the greenhouse mechanism operates”, please tell us. Everything your cult claims violates the laws of physics.
Hey Puffman, riddle me this:
https://www.thedailybeast.com/trump-ally-shocked-at-presidents-psychological-state-in-private-meeting/
Is it the reason why Dozing Donald has offered his personal support to MAGA influencer Nick Sortor and invited him to the White House as a star journalist, and while Sortor wined and dined with Dozing Donald, Bondi, Patel and Noem, a warrant for his arrest was active in Kentucky?
“If a country bombed our air defense missiles, captured & removed our president, & blockaded our country, would that be considered an act of war?” — Rand Paul, roasting Marco, who could only lie in response.
Bindidon at 11:23 AM.
Unless you’re a climate scientist, which I certainly am not, we’re all laymen.
“…though clearly differing from graph (a), graph (d) nevertheless might look somewhat redundant…”
Besides the fact that the window-region emission is much higher over the Sahara than over Southern Iraq, the latter is also smoother possibly due to greater atmospheric water vapor since Iraq is closer to marine moisture sources than the central Sahara. IMO.
“I’d have much more appreciated the Arctic region instead which could look like a mix of (a/c) and (b).”
Yes, Petty (2006) does have an Arctic spectrum (Fig. 8.2.a), albeit measured from an aircraft (NASA ER-2) flown at 20 km altitude. You can see it here: https://ibb.co/rfcjhByH
Your intuition is correct, it looks like a composite of the other graphs.
Note that there is also a downwelling spectrum (Fig. 8.2.b) measured simultaneously from a surface instrument looking up.
Thanks for the Khosravian Ghadikolaei thesis. Look forward to reading it.
Ark failed to address my challenge. He couldn’t provide a viable definition/description of how CO2 can warm the planet.
But, Bindi tried to save him. From Bindi’s link (bold my emphasis):
Now, can either Bindi or Ark state what is wrong with the quote? It has been discussed here numerous times, with clear examples. But neither Bindi, nor Ark, nor any of the other cult kids can state what’s wrong with it.
Prove me wrong.
Psst, Puffman –
https://www.cnn.com/2026/01/28/europe/us-embassy-copenhagen-removes-flags-danish-soldiers-intl
Does it remind you when ICE thugs are throwing elderly women to the ground?
“It’s a good time to remember that, for the past 3 decades, it has been the overt goal of the GOP to incapacitate the IRS.” — Connor Ewing
Willard: NEWS: Alex Pretti was not a peaceful protestor. On January 13 there is footage of Alex with a gun in his waistband, spitting on and attacking ICE officers and breaking the tail light of their vehicle. Alex also broke a rib in confrontation with federal agents week before his death.
A hub of communist and socialist nonprofit organizations emerged as key organizers of the protests. Many of them are funded by American-born billionaire Neville Roy Singham, a self-declared Marxist-Leninist living in Shanghai, China. Some are also offshoots of the People’s Forum Inc., a nonprofit hub Singham has funded in New York City since 2017 as an “incubator” for socialist and communist groups.
After showing that he can’t read, our troglodyte now hallucinates news. Here’s what news looks like:
https://www.cbsnews.com/news/north-carolina-protesters-weapons-guns-apparent-rocket-launcher-subway/
No wonder Krokodile left.
“I have been arguing since the great anti Muslim panic under Bush that conservatives are fucking weak ass fuckers. Troglodytes are goddamned scared of EVERYTHING. Muslims. Black people. Women. Drag queens. I’ve never seen a more scared ass group in my life. They’re fucking scared of WHISTLES.” — Oliver Willis
Our troglodyte insists in throwing crap into a fan right in front of his face.
Here’s a whole thread on MAGA haters protesting with military-grade weapons:
https://bsky.app/profile/sarahlongwell25.bsky.social/post/3mdbrdnlufs2l
“You cannot bring a firearm loaded with multiple magazines to any sort of protest that you want. It’s that simple.” — the one and only Kash Patel
Max,
What is your source for this?
“A hub of communist and socialist nonprofit organizations emerged as key organizers of the protests. Many of them are funded by American-born billionaire Neville Roy Singham”?
Most of the protesters are simply out documenting the Fed agents. Very useful as it turns out!
And perfectly within their rights.
No conspiracies needed, just Facebook, etc.
Nate, please stop trolling.
Still cant pass by any long-dead discussion without pissing on it?
Classy.
“Still cant pass by any long-dead discussion without pissing on it? Classy”, said Nate, pissing on a long-dead discussion he was unable to pass by.
No longer dead after you baited me by name.
You are the troll here.
Incorrect, Nate. You are the troll.
You keep posting in off-topic, inflammatory, political threads. And, even starting them.
“You keep posting in off-topic, inflammatory, political threads.”
Again, we understand that you are not interested in this topic.
Then you don’t need to post in the thread.
That is the way online forums work. Why is that hard to understand? Did your mother not teach you basic politeness?
Besides your excuse is BS.
You did not criticize the topic of the thread, you singled out one person, me, to troll.
Then you seem shocked that the person you trolled read and responded to your post.
Just weird.
Poor Nate, so hard done by. Apparently, he has not noticed the pattern. I simply ask the person who had the last word on each thread, to stop trolling. He is not being singled out in any way.
“The person who had tthe last word on each thread. He is not being singled out..”??
Pulleez..
Not true on each thread.
Only those threads in which an enemy of yours makes the last post and thus requires your piss, for some reason.
So it is turning out to be a Fully Fallacious February for you.
Sorry that you find it unfair. That’s life though, I’m afraid.
Judge Revives Wind Farm That Trump Halted Off Martha’s Vineyard.
https://www.nytimes.com/2026/01/27/climate/judge-offshore-wind-vineyard-massachusetts.html
Cervantes definitely was prescient in describing a senile Don fighting against windmills.
very good..
DREMT, kindly piss in a toilet, instead of on threads of no interest to you.
Thanks.
Nate, please stop trolling.
maxc …”Alex Pretti was not a peaceful protestor”.
***
The entire world has now witnessed Alex Pretti charged and beaten by at least 6 goons. The intial contact was by a goon, not Pretti. Early in the encounter, one goon is seen removing his firearm and running it to a goon car. Then they beat him, culminating in one goon hero shooting him in the back. They stepped back, and as he struggled for his life, they shot him in the back a further 7 or 8 times.
We all saw it. Nothing to do with socialists and communists, just a good, old US protest by good, old US citizens.
Gordon: This is truth about that “good, old US protest by good, old US citizens”.
NEWS: The far-left network helped put Alex Pretti in harm’s way, then made him a martyr. Encrypted Signal messages show ‘rapid responders’ mobilized demonstrators to harass federal agents, then socialist groups capitalized on killing to foment protests.
https://www.foxnews.com/politics/far-left-network-helped-put-alex-pretti-harms-way-made-him-martyr
Alex was a brainwashed activist. His father warned him not to take part in these violent riots, in vain.
It took only one thread four our newly arrived troglodyte to ruin his reputation:
https://www.theguardian.com/us-news/2026/jan/29/who-is-alex-pretti-ice-minneapolis-shooting
What will be his next sock?
“It’s not often, if ever, that the U.S. Director of National Intelligence goes for an FBI ride-along on a raid to a state election office. Are they getting ready for a foreign interference play for this year’s midterm?” — Philip Mai
Statement from the family of Alex Pretti, Michael and Susan Pretti:
https://leadstories.com/hoax-alert/2026/01/fact-check-pretti-parents-did-not-say-son-quit-his-job-months-ago.html
Willard & Arkady: Are you talking about this lunatic?
https://www.youtube.com/watch?v=CRWR13BAIEs
https://www.youtube.com/shorts/mh0m8W9TpeE
Is our young troglodyte already at handwaving to conspiracy videos?
https://www.liberalcurrents.com/after-alex-prettis-murder-its-clear-that-maga-media-views-white-liberals-as-race-traitors/
“I’m coming to Boston and I’m bringing hell with me.”,– Tom Homan, in February
“Do I expect violence to escalate? Absolutely.” — Homan, in March
“I actually thought about getting up and throwing that man a beating right there in the middle of the room” — Homan in July, referring to a D congressman
“I begged for the last two months on TV for the rhetoric to stop. I said in March — if the rhetoric doesn’t stop, there is gonna be bloodshed. And there has been. I wish I wasn’t right. I don’t want to see anybody die.” Homan, the man of the hour
Mistakes were made!
Top White House aide Stephen Miller acknowledges possible breach of protocol before Alex Pretti’s shooting
https://edition.cnn.com/2026/01/27/politics/stephen-miller-alex-pretti-trump
https://www.npr.org/2026/01/27/g-s1-107608/alex-pretti-death-internal-review-immigration
“MaxC” wrote: “The far-left network helped put Alex Pretti in harm’s way, then made him a martyr. Encrypted Signal messages show ‘rapid responders’ mobilized demonstrators to harass federal agents, then socialist groups capitalized on killing to foment protests.”
“MaxC” is repeating communist propaganda!
Arkady, please stop trolling.
This tracks…
https://www.independent.co.uk/news/world/americas/ilhan-omar-attack-anthony-kazmierczak-brother-b2909613.html
Brother labels suspect who attacked Ilhan Omar a ‘right-wing extremist’ who has hated Somalis for decades. ‘In my mind, he’s a piece of s**t,’ Anthony Kazmierczak’s brother told The Independent.
Arkady, please stop trolling.
Max,
Are you suggesting that Pretti’s behavior a week before justified that he was later shot in the back while on the ground with 4 agents holding him down?
Then afterword, the agents can be seen desperately searching him for the gun, asking ‘where is the gun’?
Then another agent says he has it in the car.
This shows that the agents who shot him never saw him with the gun, nor its removal.
Instead they may have heard the word ‘gun’.
“simply hearing the word ‘gun’ does not legally or ethically justify shooting someone. The use of deadly force is generally only justified to protect oneself or others from an imminent threat of death or serious bodily harm, not based on words alone.”
Nate: Alex Pretti was a hooligan and troublemaker as we can all see in those videos. It was a mistake that he was not arrested when he broke that tail light. Two years in prison and anger management counselling would have done him good. Standing in a street corner with flags and banderolls was not enough for him. He wanted to fight. I’m glad he didn’t kill any law enforcement officers with his gun.
Alex Pretti giving a final salute to a veteran he treated at a VA hospital: https://www.youtube.com/shorts/Dro1-lcOgwY?feature=share
Yes he broke a tailight, thus he deserved the instant capital punishment he got.
Right Max?
Nate,
You show so much empathy for the protesters, what about showing sone empathy for the federal agents that are being attacked or on the receiving end of non peaceful protests.
If you believe in democracy then you ought to respect the mandate that Trump won by saying he was going to deport illegal immigrants.
Trump DID NOT “win a mandate.”
31.78% voted for Trump.
30.84% voted for Harris.
1.06% voted third party.
36.33% did not vote.
More than 2/3 of voters DID NOT VOTE FOR TRUMP.
Anon for Q-related reasons was really rational, he’d recognize that when Dozing Donald goes after Don Lemon or says that China will ban hockey in Canada, he’s making George III look like Roger Penrose.
If he really believed in argumentation he’d recognize that “illegal” begs the same kind of questions as when he uses “but CAGW”.
Yes the agents were trained for the border, not to manage urban protests. Theyve been put into a stressful position.
Whatever ‘mandate’ Trump had was not carte blanche to militarize are cities.
The polls show that the current policies and tactics are deeply unpopular.
And Trump has finally noticed that.
Speaking of training:
https://www.wired.com/story/ice-agent-jonathan-ross-renee-good-shooting-firearms-trainer-testimony/
An elite ICE agent, imagine that.
Not that this should distract us from Bellingcat community members having already found two files detailing explicit allegations that Dozing Donald engaged in sexual activities with children.
Willard, please stop trolling.
As usual, none of the cult kids know anything about the issue. Ark, Nate, Willard, and Bindi shout their emotional, worthless opinions, but can’t get anything right.
Years ago, when I took a course to obtain my CCP, a gun-toting attorney came in to cover the legalities. He spent half a day describing various situations. He said if he were in a large box store and heard gunshots from the other side of the store, he would immediately flee the store, in the other direction. He said that going to investigate the shots fired would appear as “vigilantism” in a court, if he had to use his weapon. He made it very clear that CC did NOT make us LEO.
So for someone to take a weapon to a riot was clearly an irresponsible decision. Then to fight LEO, while carrying a weapon, worsened the decision leading to the tragic result.
Kids these days….
Hey Puffman, riddle me this –
Why has Pam deleted this?
“Dozing Donald 2.0 has been ‘a blast for Stephen'” — A WH advisor, on his way to the Hague.
Yes, bringing a gun to a protest during a time of heightened tension is a bad idea. But does that mean Alex Pretti deserved to lose his life? Hell no.
Pointing to the fact that he brought a gun as if that somehow justifies or minimizes what happened is about the strongest argument MAGA conservatives seem to have.
“So for someone to take a weapon to a riot was clearly an irresponsible decision.”
To a protest. To document what agents were doing with a phone. The only violence was initiated by the agents.
Several Gun rights activist organizations disagree with your opinion.
Nate, please stop trolling.
https://www.nytimes.com/2026/01/30/climate/energy-department-climate-ruling.html
A Secret Panel to Question Climate Science Was Unlawful, Judge Rules
The one with Roy Spencer.
nate…from the NYT article…
“But the Federal Advisory Committee Act of 1972 does not allow agencies to recruit or rely on secret groups for the purposes of policymaking. Judge William Young of the U.S. District Court for the District of Massachusetts said the Energy Department did not deny that it had failed to hold open meetings or assemble a balance of viewpoints, as the law requires, when it created the panel, known as the Climate Working Group”.
***
The law seems pretty hypocritical to me. The previous administration and all other since 1972, have not held open meetings or assembled a balance of viewpoints. The entire AGW theory is based largely on the IPCC POV and unvalidated climate model theory.
IPCC reviews (the IPCC was formed in 1988) have come under considerable scrutiny based on their practices. The most glaringly obvious is their questionable practice of releasing the Summary for Policymakers, which essentially is a guideline for governments, before the main report then amending the main report to agree with the Summary.
The problem here is that the main report is written by 50 politically-appointed lead authors while the main report is written by 2500 reviewers who are appointed by the lead authors. That process has become such a closed shop that skeptics are simply not invited anymore to IPCC reviews.
Where is the transparency in such a process as required by law?
Then there was Climategate where leading alarmists scientists met in secrecy via email. In those discussions they often contradicted the POV they presented to the public.
They contradicted what they said in public? Which mischaracterisations will you reference? Hide the decline (don’t emphasise known poor data)? It’s a travesty we can’t account for the lack of warming (bemoaning the lack in monitoring systems)? Redefining peer-review itself (obvious hyperbole)?
And will you once again ignore the thousands of emails that didn’t get reported the demonstrate honest scientists wrestling with imperfect data and trying to get to the truth? No, just the stuff that’s easiest to mischaracterize, I guess.
The law is trying to make government operate with transparency.
The judge looked at all facts and ruled the gov was not following the law.
I guess you know better..
And the IPCC is not a US government appointed committee.
Nate wrote: “A Secret Panel to Question Climate Science Was Unlawful, Judge Rules”
Turns out having secret meetings coordinated by shadowy fossil fuel funded groups with a pre-determined outcome aimed at overturning critical policies based on mainstream science is not only wrong, it’s also illegal.
Arkady, please stop trolling.
“Then there was CG”
There sure was:
Koonin is cookin!
“He has… sent hither swarms of Officers to harrass our people…
He has kept among us, in times of peace, Standing Armies without the Consent of our legislatures…
For Quartering large bodies of armed troops among us…
He has excited domestic insurrections amongst us…”
Declaration of Independence
July 4, 1776
You can’t go wrong quoting from valid sources barry.
Of course there’s no guarantee you cult kids will understand. It’s kind of like the tariffs issue, huh?
FBI raids Fulton County office for records tied to 2020 election
https://www.atlantanewsfirst.com/2026/01/28/fbi-executes-search-warrant-fulton-county-main-election-office/
” The spokesperson also said Fulton County officials were not notified of the activity beforehand.
Robb Pitts, chairman of the Fulton County Board of Commissioners, confirmed the county did not know of the FBI activity ahead of time.
A Fulton County spokesperson later said the search warrant pertained to “a number of records related to the 2020 election.” ”
*
” For the life of me, I still cannot understand the fascination with the 2020 election,” Pitts said Wednesday night.
He said the 2020 election has been audited and reviewed, and in every instance, “we get a clean bill of health.”
“So we can no longer, and I can no longer, as chair of this board, satisfy not only the citizens of Atlanta, but the citizens of the world that those ballots are still secure. So that is a major concern that I have right now,” he added.
Pitts said he does not know what federal agents will do with the boxes of ballots, or where they are going. ”
*
It’s 100% clear to any Non-MAGAmaniac that the FBI agents who invaded the County office and stole all these records will let anything disappear what proved that there was no fraud in 2020.
But there is one thing that nobody at FBI nor at DOJ can let disappear:
https://www.youtube.com/watch?v=UhBxg17QqZ4
(Skip the bloody ads)
While checking for January UAH results, I found this long discussion above. DREMT was trying to teach the cult kids some basics, involving the old “blue/green plates” nonsense. Nate and Ball4 are so confused that DREMT was making little progress. (They can’t learn.) Here’s an example of how confused Ball4 is:
https://www.drroyspencer.com/2026/01/uah-v6-1-global-temperature-update-for-december-2025-0-30-deg-c/#comment-1732468
I didn’t have time to read the entire sub-thread, but here are some quick points:
1) DREMT’s diagram is the best way to understand the issue:
https://postimg.cc/F1fryx8h
2) Nate’s “RHTE” is nonsense. The equation merely provides a mathematical difference between two fluxes. That is NOT “heat”. It’s meaningless. But, it’s a good example of how confused the cult is about radiative physics and thermodynamics.
3) If the blue plate started out at 262K, it would cool to 244K, as it would be losing more that it is gaining.
Again, this simple problem illustrates how little the cult understands about the relevant science.
The crazy thing is, Nate and Ball4 completely disagree with each other, but won’t admit it! Whereas I will happily admit that I disagree with you that the RHTE is “nonsense”. I think it can be used, if carefully understood. It shows that heat flow goes to zero when the plates are at the same temperature, and this is “equilibrium”. Which should give them a bit of a clue that 244 K…244 K is the correct solution!
However, I would note that you often turn out to be right, Clint, so I’m not completely ruling out that the RHTE might prove to be “nonsense”. Certainly it can be used (or rather abused) to obscure the truth.
The bogus “RHTE” employs the corrupt concept that radiative fluxes can be simply added/subtracted. That concept is used throughout climate science, to pervert reality. You especially see it in the bogus “Earth Energy Imbalance’, where they attempt to “balance” flux, which does NOT balance.
The confusion comes from the fact that all flux has the same basic units. But the units make it very complicated. “Watts/Area” is “Energy/time/area”. That’s why kids believe flux is energy.
A simple analogy might be to use “dozens” for units. So can a dozen elephants be added or subtracted to a dozen strawberries because the units are the same? Of course not. Flux units are even more complicated that “dozens”, as flux involves photons and photons can be different.
In simple terms, that’s why the RHTE is bogus.
The crazy thing is that you are seeking a trolling partner, who you totally disagree with:
“Nate’s “RHTE” is nonsense”
Recall that you, DREMT, spent a month arguing that the RHTE was essential to use to solve a radiative heat transfer problem.
And if one didnt use it, their solution would be ‘a joke’.
Granted, Clints 3 arrow diagram is a joke.
Be careful who you partner up with.
Nate, do you even read through sub-threads before knee-jerk responding? I just said to Clint that I disagreed with him about the RHTE. Can you finally admit you disagree with Ball4?
Yep I missed that. But it is still crazy that you select him as your trolling partner.
The truth clearly doesnt matter to you guys. Its all about the troll.
Nate, I didn’t “select” anybody. Clint mentioned the discussion, so I commented. Neither of us are trolling.
What is crazy are the lengths you will go to, to avoid admitting that you and Ball4 disagree.
Of course you did.
Why else would you ‘move the discussion’ down here, other than to join forces with your buddy.
So now I’m responsible for someone else mentioning the discussion I’m involved in.
Meanwhile, Nate again refuses to acknowledge his disagreement with Ball4.
A quick summary of my argument:
1) If the “back-radiation” transfer (transfer from GP to BP) is not permitted to occur, the plate temperatures will be 244 K…244 K at equilibrium.
2) If the “back-radiation” transfer is permitted to occur, the plate temperatures will be 262 K…220 K.
3) The above two points demonstrate that the “back-radiation” transfer is solely responsible for the difference between the plates being 244 K…244 K and the plates being 262 K…220 K.
4) That means the “back-radiation” transfer is effectively increasing the temperature of the BP by 18 K, and reducing the
temperature of the GP by 24 K. This could be clearly seen if the GP were introduced at 244 K. 5) Which in turn means that the “back-radiation” is transferring internal energy from the GP to the BP, where it builds up at the expense of the GP. Energy cannot just “organise” itself in this way. It’s a 2LoT violation.
6) Since 2LoT cannot be violated, but “back-radiation” exists, the “back-radiation” transfer must be returned from the BP back to the GP. See the diagram that Clint linked to.
7) Everything then balances at 244 K…244 K. Hence, that is the correct solution.
Hey Puffman, riddle me this –
https://www.drroyspencer.com/2026/01/uah-v6-1-global-temperature-update-for-december-2025-0-30-deg-c/#comment-1732593
Are you looking for love, as Graham D. Warner does?
Let’s try posting that summary again:
1) If the “back-radiation” transfer (transfer from GP to BP) is not permitted to occur, the plate temperatures will be 244 K…244 K at equilibrium.
2) If the “back-radiation” transfer is permitted to occur, the plate temperatures will be 262 K…220 K.
3) The above two points demonstrate that the “back-radiation” transfer is solely responsible for the difference between the plates being 244 K…244 K and the plates being 262 K…220 K.
4) That means the “back-radiation” transfer is effectively increasing the temperature of the BP by 18 K, and reducing the temperature of the GP by 24 K. This could be clearly seen if the GP were introduced at 244 K.
5) Which in turn means that the “back-radiation” is transferring internal energy from the GP to the BP, where it builds up at the expense of the GP. Energy cannot just “organise” itself in this way. It’s a 2LoT violation.
6) Since 2LoT cannot be violated, but “back-radiation” exists, the “back-radiation” transfer must be returned from the BP back to the GP. See the diagram that Clint linked to: https://postimg.cc/F1fryx8h
7) Everything then balances at 244 K…244 K. Hence, that is the correct solution.
“2) If the “back-radiation” transfer is permitted to occur, the plate temperatures will be 262 K…220 K.
Well, as you noted to Mark: “Back-radiation” occurs. There’s no doubt about it.”
Which is true. It is just the way radiative heat transfer works, a 2 way transfer of energy, but the NET is always from warmwr body to colder.
So you have made a solid case for Eli’s solution.
QED. Glad thats over.
Nate misses 6). Silly Nate.
Yes, “back-radiation” occurs. It exists. But, since it can’t violate 2LoT, the “back-radiation” transfer must be returned from the BP to the GP:
https://postimg.cc/F1fryx8h
“Which in turn means that the “back-radiation” is transferring internal energy from the GP to the BP”
Meanwhile, BP is transferring MORE internal energy to the GP. This difference is what determines the flow of heat. Any contrary argument ignores the classic definition of heat.
As has been said many times, EM radiation is not heat. Not if you define heat in the classic way.
Temperature change is not heat, either.
What is the classic definition of heat?
“heat (Q) is defined as energy in a state of transit across the boundary of a system by virtue of a temperature difference”
In the 2-plate example, Q is determined by subtracting one energy transfer from another. Any different analysis is not considering classic heat flow.
“Key Characteristics
Energy in Transit: Heat is not “contained” within an object. Instead, it describes the process of energy moving from a higher-temperature body to a lower-temperature body. Once the energy enters the new system, it is stored as internal energy, not as heat.
Distinction from Temperature: While often confused, temperature is a measure of the average kinetic energy of a substance’s particles. Heat is the total energy transferred because of the temperature difference…
Direction of Flow: According to the Second Law of Thermodynamics, heat spontaneously flows only from a hotter object to a colder one”
Is energy flowing from the hotter object to a colder one? Yep. Therefore accounting for both directions of energy flow, the direction of heat is obvious.
DREMT, your definition of heat requires we ignore one direction of energy flow, and that we defne heat using temperature change as a guideline. Your definition of heat is not the classic definition.
barry…at no time in those points 1) – 7) did I even use the term, “heat”.
Here’s what you left out from your quote:
“Which in turn means that the “back-radiation” is transferring internal energy from the GP to the BP, where it builds up at the expense of the GP. Energy cannot just “organise” itself in this way. It’s a 2LoT violation.”
What do you disagree with?
barry doesn’t understand the fact that there is NO “heat” between the plates. The plates are at the same temperature. There is a transfer of flux, but flux is NOT “heat” if there is no temperature difference.
“es, “back-radiation” occurs. It exists. But, since it can’t violate 2LoT, the “back-radiation” transfer must be returned from the BP to the GP:”
You are very very confused.
There is no actual mechanism for the back radiation to be returned. None. It disagrees with 2 laws of physics: the RHTE, which you claim is valid, and Kirchoffs Law , which requires black bodies to abs.orb all radiation.
But no matter. You wont allow facts to get in the way of your fantasies.
And for the billionth time, you offer no logical evidence of heat being transferred from colder to warmer.
None. Thus there is no 2LOT violation.
Because, for the billionth time, there is a heat source. ITS THE SUN!
Why, why, why, do you keep ignoring the Sun as a heat source? Are you actually that stoopid
Because you ignore the Sun as a heat source, you conclude that the the heat can ONLY have come from the cold body!
Glaringly flawed logic.
Nate, I don’t ignore the Sun. The Sun is present when considering 1), and 2). 1) and 2) involve all the energy flows throughout the entire system, going through to equilibrium, in two different scenarios which are separated only by the absence or presence of the “back-radiation” transfer. That’s the starting point for the chain of logic. The Sun is thus not ignored.
The means by which the energy is returned from the BP, back to the GP, is irrelevant. 2LoT cannot be violated, so it must be returned. That’s all you need to know.
“Nate, I don’t ignore the Sun. The Sun is present when considering 1), and 2). 1) and 2) involve all the energy flows throughout the entire system”
You keep saying that you look at all the energy flows, but you never actually do. This is dishonesr.
I did, for example in the first second after the GP us put in place, the sun provides 400 J to the BP. The GP provides 200 J to the BP, but the BP gives it right back! It gives 200 J to the GP, making the NET transfer 0.
ZERO.
After that first second, the BP is warmer than the GP. Then it gives more to the GP than the colder GP gives to it.
On it goes until equilibrium. At no point GP is making a NET positive energy transfer to the BP.
Because the BP is getting 400 J each second from the sun!
That cannot be ignored.
“two different scenarios which are separated only by the absence or presence of the “back-radiation” transfer. That’s the starting point for the chain of logic. The Sun is thus not ignored.”
Your thinking here is flawed. By bringing in the GP, we are interupting the heat loss from the BP to space.
Yes that is a change. But not what you claim. There is no evidence of heat flowing backwards from cold to warm, just a reduction in heat LOSS, while the sun’s input remains steady.
“You keep saying that you look at all the energy flows, but you never actually do. This is dishonesr.“
I’m going to need you to withdraw that false accusation before the discussion goes any further. All the energy flows are considered in getting the plate temperatures in 1) and 2). How else do you think the plate temperatures are known!?
Seriously sick and tired of people falsely accusing me of dishonesty.
You do no accounting of the energy flows at any time.
No numbers. No Joules. No Watts, flowing to or from any body, as I did.
Instead, you just jump to a false conclusion, and declare you know what the flows are, without actually bothering to find out what they are.
No accounting, no credit.
An actual accounting shows that the BP always gives back to GP, the same or MORE than it receives.
Can you dispute this? How?
How can you with a straight face claim that the cold body, the GP, violated 2LOT by transferring heat to a warmer body?
With the sun supplying heat, there is simply no need for that to happen.
Look at the diagram Clint linked to:
https://postimg.cc/F1fryx8h
It includes all the energy flows, including the flow from the Sun. If you mentally remove the “back-radiation” arrow, and the opposing arrow that is returned from the BP to the GP, you will be left with one single arrow from the BP to the GP. That would be the situation where the “back-radiation” transfer was not allowed to proceed. The temperatures would of course be 244 K…244 K, since the two arrows you mentally removed simply cancel each other out. That is 1).
I assume you don’t dispute the case where the “back-radiation” transfer is allowed to proceed. That is 2).
Now you have a full accounting. OK?
Nate, it’s clear you can’t understand the simple diagram:
https://postimg.cc/F1fryx8h
That’s why you get so frustrated and angry. Maybe science just isn’t your bag….
As noted above. Be careful who you partner up with to troll.
That diagram is total nonsense. Just a distraction.
It has no relevance to Eli’s solution, which is what your 2LOT claims are all about.
In Elis solution there are 2 arrows.
Back to where we left off.
No accounting, no credit.
An actual accounting shows that the BP always gives back to GP, the same or MORE than it receives. The arrow from the BP is = or larger than the atrow from the GP.
Can you dispute this? No.
How can you then with a straight face claim that the cold body, the GP, violated 2LOT by transferring heat to a warmer body?
With the sun supplying heat, there is simply no need for that to happen.
Nate, if you cannot follow what is being said, perhaps you shouldn’t be commenting on this issue. I just told you how to interpret the diagram for a full accounting of all the energy flows in point 1). Point 2) you should not have a problem with.
It’s starting to look like you’re simply not intelligent enough to understand the argument being made here. This frustrates you, and you start lashing out with accusations of dishonesty.
Not my problem, though.
Nate is unable to support his false beliefs, so he ramps up the insults and false accusations. That’s just like a cult child.
He doesn’t understand the science, and doesn’t want to, because the reality is science destroys the CO2 nonsense. I think some of his cult is already realizing this. Norman and Folkerts, who have at least a basic understanding of physics, no longer support the “plates” nonsense. The only supporters left are the bottom, like Nate and Ball4.
So for any adults following, here’s Nate’s problem:
He confuses “back-radiation” with “insulation”. This is another common mistake in the cult. They believe “back-radiation” is an actual insulator. To understand, consider only one plate. The plate is thick and composed of material that is a poor conductor, instead of being a perfect conductor. The plate conducts so poorly that when it is warmed on one side with 400 W/m^2, that only 133 W/m^2 is emitted from the other side. The side warmed by the 400 W/^2 reaches a temperature of 262K, emitting 267 W/m^2. And the back side reaches a temperature of 220 K. This is very valid, and does not violate any laws of thermo. This is what Nate believes happens with the blue/green plates. He confuses “back-radiation” with “insulation”.
“Look at the diagram Clint linked to:
https://postimg.cc/F1fryx8h
It includes all the energy flows, including the flow from the Sun.”
The linked diagram is nonphysical because the radiation flux density out of the blue plate as shown is asymmetrical, that is 200 W/m^2 on the left side and twice that on the right. Since black body radiation is a function of the temperature of the body, the outgoing radiation density has to be the same in both directions for a planar object.
If you delete the two green arrows between the plates it shifts the problem to the green plate outgoing radiation being asymmetrical, so that can’t be right either.
Sorry Mark B, but you obviously don’t understand the diagram, or the science involved.
The flux “out of the blue plate” is exactly symmetrical. The blue plate is emitting the blue arrows, and the green plate is emitting the green arrows.
But don’t feel bad, none of your cult understands the relevant science either. In fact they even believe they can boil water with ice cubes.
Kids these days….
Yes, Mark – you obviously cannot follow what is being argued:
https://www.drroyspencer.com/2026/01/uah-v6-1-global-temperature-update-for-december-2025-0-30-deg-c/#comment-1732629
Even when I break it down into seven relatively easy to follow numbered points and accompany it with a simple colour-coded diagram. This is the problem – they don’t get it, but they’re certain we’re wrong, anyway.
I was explaining to Nate that the accounting for point 1) in the linked comment, involving the hypothetical scenario where the “back-radiation” transfer doesn’t happen, can be understood by mentally removing the two green arrows from between the plates.
You can hypothesize anything you wish, but it’s still not the physical or mathematical realization of an ideal black body to have asymmetrical radiation, nor is it the realization of an ideal black body to not radiate at any temperature above absolute zero.
Also it doesn’t violate the 2nd law of thermodynamics if the net flow of energy is from hot to cold regardless of how one partitions the components of that flow.
With your seven steps and your diagram you’ve finally provided a sufficiently clear explanation of the hypothesis that we have clear reasons to reject it.
“You can hypothesize anything you wish, but it’s still not the physical or mathematical realization of an ideal black body to have asymmetrical radiation, nor is it the realization of an ideal black body to not radiate at any temperature above absolute zero…”
…correct, and I’m not saying otherwise. If you think I am, you’re not understanding my argument, or the diagram.
To analyse the impact of the “back-radiation” transfer, it’s necessary to find the equilibrium temperatures of the plates without the transfer occurring, and then find the equilibrium temperatures of the plates with the transfer occurring to completion, and then compare the differences. That’s points 1), 2) and 3).
“To analyze the impact of the “back-radiation” transfer, it’s necessary to find the equilibrium temperatures of the plates without the transfer occurring,”
If you “do not permit back-radiation” in step 1 then the green plate can’t be a black body so you can’t use the Stefan-Boltzman law to find the equilibrium temperature of the green plate. In fact the green plate would be behaving as a transparent (to EM) and non-radiating object so it’s temperature is indeterminate.
Essentially your construct is “Step 1: find the temperature of a plate that effectively doesn’t exist”, which doesn’t seem like a sensible start to a coherent argument.
It might be more fruitful if you were to point out where you think the original construct goes wrong:
https://rabett.blogspot.com/2017/10/an-evergreen-of-denial-is-that-colder.html
For the second time Mark B, there are NO asymmetrical emissions in the simple diagram. Not only do you not understand the basic physics, but you must be color blind:
https://postimg.cc/F1fryx8h
The flux “out of the blue plate” is exactly symmetrical. The blue plate is emitting the blue arrows, and the green plate is emitting the green arrows.
In addition to your other problems, you appear to be believe “black bodies” are real. There is no object that will absorb all frequencies at room temperature. If you believe otherwise, you will fall for the nonsense that ice cubes will boil water and CO2 can heat the planet.
You have a choice to accept reality, or be a cult kid….
Mark, you’re just being silly. Looking for any excuse to reject the argument, because you know it refutes the Green Plate Effect. You apparently can’t even get past step 1)! All that is required is for you to temporarily accept, for the sake of argument, that the GP does not emit on the side facing the BP. You have to understand that by the time you get through to step 7), both sides of the GP emit as usual. In the actual, correct, 244 K…244 K solution, both sides of both plates emit as usual.
“there are NO asymmetrical emissions”
Puffman can’t count, even arrows!
Again, the principle of multi-layer radiative thermal shielding has real world engineering use and has for decades. That it works is not reasonably disputable.
https://en.wikipedia.org/wiki/Multi-layer_insulation
Mark. Again:
https://www.drroyspencer.com/2026/01/uah-v6-1-global-temperature-update-for-december-2025-0-30-deg-c/#comment-1730026
and again:
https://www.drroyspencer.com/2026/01/uah-v6-1-global-temperature-update-for-december-2025-0-30-deg-c/#comment-1732832
You all just keep making the same mistakes, repeatedly. Clint is correct to say you all cannot learn.
No. Drawing inaginary arrows without actual numbers is not accounting.
Erm…there are numbers on the diagram, too, Nate.
As usual, we get to see the antics of the cult kids. Mark B acts like he’s color-blind, and Nate tries to appear totally blind. He can’t see the arrows!
https://postimg.cc/F1fryx8h
And Mark B finds links he doesn’t understand to throw against the wall, hoping something will stick.
Mark B, since you’re trying to impress us with your knowledge of radiative physics, please answer these simple questions:
Problem 1: A perfectly conducting sphere (emissivity = 1) receives flux from four sources equally spaced around its equator. Each source supplies 1000 W/m² to the sphere’s “disk”.
What is the sphere’s temperature?
Problem 2: Two additional sources are added, above and below the sphere, each supplying 1000 W/m² to the sphere’s “disk”.
What is the sphere’s temperature?
I predict you won’t answer. Prove me wrong.
“In the actual, correct, 244 K…244 K solution, both sides of both plates emit as usual.”
In the correct solution both sides of both plates abs.orb as usual according to the laws of physics.
Not so in your solution.
Just endless denial of reality here.
“The numbers are on the diagram”
Oh ok. Then explain how they reveal a 2LOT violation in Eli’s solution.
The numbers prove that when the “back-radiation” transfer is not permitted to occur, the plate temperatures are 244 K…244 K. Do you need me to walk you through that, or can you work that out for yourself?
That is point 1), in the points 1) – 7):
https://www.drroyspencer.com/2026/01/uah-v6-1-global-temperature-update-for-december-2025-0-30-deg-c/#comment-1732629
Points 1) – 5), taken together, are the proof of a 2LoT violation in Eli’s solution.
Hey Puffman, riddle me this –
https://postimg.cc/F1fryx8h
in:
400
out:
200 + 200 + 200 from left to right.
200 + 200 from right to left.
Is that what you call symmetry?
Here’s symmetry:
https://ibb.co/gFMSwM5t
Perhaps you prefer:
https://ibb.co/qTg9ZpD
You got NOTHING.
In case any readers are still confused by the diagram:
https://postimg.cc/F1fryx8h
BP inputs: 400 from Sun (red arrow)
BP outputs: 200 + 200 (blue arrows)
GP inputs: 200 (blue arrow) + 200 (green arrow returned from BP rather than violate 2LoT)
GP outputs: 200 + 200 (green arrows)
“BP inputs: 400 from Sun (red arrow)
BP outputs: 200 + 200 (blue arrows)
GP inputs: 200 (blue arrow) + 200 (green arrow returned from BP rather than violate 2LoT)
GP outputs: 200 + 200 (green arrows)”
But in Elis solution and in actual physics, you know very well that
BP output: 200. ONE blue arrow.
GP input: 200, the ONE blue arrow.
Thus the GP output Green arrow to the BP straightforwdly cancels the Blue arrow.
Thus the GP never transfers NET energy to the BP. No 2LOT violation occurs.
But the BP gains its 200 from…..the SUN.
Its the SUN stoopid..
Nate, those are not the figures from Eli’s solution, at equilibrium.
You have got yourself very confused indeed.
DREMT,
Pointing out that your diagram is an incorrect representation of black body radiation isn’t readers being confused.
It either indicates that the green arrow coming into the BP is perfectly reflected or it is absorbed by the BP and re-radiated asymmetrically. Neither option is consistent with the behavior of an ideal black body.
Clint,
Your pivot to quiz master rather than addressing the fact that multilayer insulation for space application is the experimental result (more than that, it’s really long standing standard engineering practice) that contradicts your thesis is telling. It’s apparently Kryptonite to back-radiation deniers.
Here’s the chart deck for a full-blown MLI class from the engineering perspective if you’re interested:
https://ntrs.nasa.gov/api/citations/20240010471/downloads/TFAWS%20Johnson.pdf
Sorry Mark, I had assumed you had read through my points 1) – 7), and understood them.
My mistake.
Mark B, you have NO knowledge of the science involved. You can’t even understand the simple diagram. You just believe in your cult nonsense, and can’t learn. I see the same failings in all you cult kids.
I’ll be glad to explain MLI to you once you demonstrate a basic understanding of radiative physics. Solve these two simple problems:
Problem 1: A perfectly conducting sphere (emissivity = 1) receives flux from four sources equally spaced around its equator. Each source supplies 1000 W/m² to the sphere’s “disk”.
What is the sphere’s temperature?
Problem 2: Two additional sources are added, above and below the sphere, each supplying 1000 W/m² to the sphere’s “disk”.
What is the sphere’s temperature?
Either solve the simple problems or admit you don’t have an understanding of radiative physics. Anything else is just kiddie crap.
At equilibrium
400 sum to BP
267 BP to space
267 BP to GP
133 GP to BP
133 gp to space
Notice at equil there is net energy transfer from gp to bp.
The same as at the start.
Where are your numbers for his solution at any time?
Nate, why would I need to produce any numbers?
They are already known.
” All that is required is for you to temporarily accept, for the sake of argument, that the GP does not emit on the side facing the BP.”
Riiight, temporarily.
Except at the very end when you ask people to permanently accept that the GP does not emit on the side facing the BP.
Thats your faulty logic, leading to an impossible conclusion.
Mark is correct that:
“Essentially your construct is ‘Step 1: find the temperature of a plate that effectively doesn’t exist’, which doesn’t seem like a sensible start to a coherent argument.”
“Except at the very end when you ask people to permanently accept that the GP does not emit on the side facing the BP.”
Nate has started telling porkie pies!
Clint, I’m not asking you to explain MLI to me. I’m simply pointing out that it a common engineering practice which contradicts the narrative that you and DREMT are peddling on this thread.
If this exchange were about the technical merit of your narrative, you’ve lost, but that’s not really the game you’re playing and I think we knew that all along.
Mark:
1) MLI doesn’t contradict anything we’re saying. You might want to find a form of insulation that doesn’t involve reflective surfaces if you want to try to contradict us:
https://www.drroyspencer.com/2026/01/uah-v6-1-global-temperature-update-for-december-2025-0-30-deg-c/#comment-1732909
2) MLI was your dodge, your attempt to distract. Don’t try to spin this that Clint is the one avoiding anything. The issue here is, “does Eli’s solution violate 2LoT”? Points 1) – 5) say, “yes”, and nobody seems to have any relevant response to that. That’s the thing – since there is a 2LoT violation, the “back-radiation” transfer must be returned. There’s no point arguing about what you expect to see from an ideal blackbody – they’re not real! And thus, they cannot be used as an excuse to violate 2LoT. Going on about how an ideal blackbody “should” behave is purely argumentative on your part. The imaginary concept bends to the laws of physics, not the other way around.
3) All you’re doing is proving Clint to be correct – as predicted, you’re not answering the problems.
Hey Puffman, instead of pretending you can explain when you never do, riddle me this –
Look back at the green arrows between the two plates in your silly diagram:
https://postimg.cc/F1fryx8h
have Sky Dragon cranks just invented a perpetually heating machine?
I’ll assume astute readers are easily able to understand the simple diagram, even if some commenters aren’t.
Correct DREMT. Mark B is avoiding the issue. He’s trying to hide behind a link he found, but doesn’t understand. The MLI doesn’t prove him right, it’s closer to proving him wrong! That’s one of the reasons we know he’s ignorant of the science. Another reason is he can’t solve the simple problems.
But, he’ll rely on other cult kids, like Nate, Ball4, and Willard, to cover for him.
Nothing new….
Readers can see that the graph fails symmetry and outputs more than it receives, and that Graham D. Warner’s “rather than violate 2LoT” is rather ridiculous.
Willard shows up to immediately prove Clint right.
“barry… at no time in those points 1) – 7) did I even use the term, “heat”.”
You invoked it the moment you said “2LoT”.
If you have a definition for that term that has nothing to do with heat, you should immediately post it so we can see what you mean by it.
barry:
https://www.drroyspencer.com/2026/01/uah-v6-1-global-temperature-update-for-december-2025-0-30-deg-c/#comment-1732645
I asked you a question. If you’re going to disappear for about a week, then randomly pop up again out of nowhere (some call it, “doing a Mark B”), at least answer the question on your return.
BACK AT THE RANCH
A government official and top royal from the United Arab Emirates purchased a $500 million stake in the Dozing Donald family’s cryptocurrency venture last year, months before the Dozing Donald administration greenlit the sale of advanced AI chips to the UAE, The Wall Street Journal reported on Saturday.
Sheikh Tahnoon bin Zayed Al Nahyan — also known as the “spy sheikh” — is the Gulf nation’s national security adviser and manager of its largest wealth fund. Aryam Investment, a Tahnoon-backed company, took a 49% stake in World Liberty Financial, according to the Journal. The deal would make Aryam the largest shareholder of World Liberty, and the company’s only known investor besides the founders, the Journal reported.
https://www.cnbc.com/2026/02/01/spy-sheikh-stake-trump-crypto.html
Another big big win!
Will Dozing Donald use this money to bulldoze the JFK Center?
“Fell the enemies” — Illini Republicans, learning from their elders
A new dirty anti-MAGA traitor, operating undetected within the deep state, has been exposed!
https://www.washingtonpost.com/national-security/2026/02/02/ed-martin-demoted-justice-department/
*
” Justice Dept. demotes Ed Martin, stripping Trump ally of most authority
Martin will no longer head the Justice Department task force that pushed investigations into Trump’s foes.
Top Justice Department officials have stripped Ed Martin of the bulk of his expansive responsibilities, leaving the staunch ally of President Donald Trump on the sidelines of many of the controversial investigations he has championed, according to two people familiar with the personnel move. ”
*
No wonder a picture showing the Trumping boy and Putin in perfect harmony hangs somewhere in the White House: the two not only get along famously, they act in the same autocratic manner.
The only (still) existing difference between the two is that the Trumping boy’s opponents till now don’t commit (yet) inexplicable suicide.
Desperate times at WUWT:
https://wattsupwiththat.com/2026/02/02/re-evaluating-the-concern-of-climate-change/
https://wattsupwiththat.com/2026/02/02/re-evaluating-the-concern-of-climate-change/#comment-4161644
ME: “The modern, anomalous blade at the end is already present in the raw 18O data (panel a, Fig. S3), before any conversation to temperature.”
Andy May: “Fine. Without a conversion to temperature how do you get a rate of warming? Answer: You don’t.”
ME: “Again, the modern blade is already present in the raw 18O data. That means the sharp rate of change exists, just without being multiplied by a constant.”
ROFL!!!!
Thanks for participating, Willard.
If past experience is any guide, WUWT threads usually quiet down overnight in USA time and then spring back to life early morning. Looks like you might be in for some fun!
New post created in response to my criticism:
https://wattsupwiththat.com/2026/02/05/holocene-warming/
Andy’s “I did not make this judgement based on any reconstruction. I used individual proxies from several places” was masterful.
It echoes a similar argument about regional climate models.
I call it the Meteorological fallacy.
Now is the time to write it up!
Thanks for the invitation, and never forget:
https://www.youtube.com/watch?v=xT0M2YxFQ50
Climateball manners maketh man.
The fun was mine as well.
Definitely a thread to remember.
nate…”The law is trying to make government operate with transparency.
The judge looked at all facts and ruled the gov was not following the law.
I guess you know better..”
Later in the thread…
“And the IPCC is not a US government appointed committee”.
***
Hope you are not taking this personally, I did not reply to take shots at you personally. My point was that the judge’s ruling was wrong considering the precedents that have been set since 1972.
And, yes, when it comes to science, I know a damned sight more than any judge, unless he/she has spent considerable time studying the science.
The law was created in 1972, long before global warming became an issue. In fact, they were concerned about global cooling back then. I think the law itself has merit as long as legal beagles stick to it. It is the intent of the law that is in question, not how it is being interpreted by modern judges.
In 1988, James Hansen, then head of NASA GISS came out swinging, backed by Al Gore and government money via NASA. The head of NASA at the time tried to muzzle him and he was overruled from above. Hansen was not beyond theatrics to make his fabricated point, in fact, he engaged in protests of pipelines and the likes being arrested at one point along with actress Daryl Hannah.
That is hardly appropriate for the head of GISS, taking one side of a debate. After all, he is supposed to be an objective scientist, which he had never been from the start. He adopted the theory of his role model, Carl Sagan, that the atmosphere of Venus had come from a runaway greenhouse effect. Hansen tried to apply the theory to Earth with CO2 from anthropogenic sources as the driving force.
BTW…satellite probes in the late 1970s returned evidence that the surface of Venus was some 450C. That rules out a GHE, which claims the GHGs are heating the surface. In order for that to happen, according to the 2nd law, the atmosphere would need to be hotter than the 450C surface. How would CO2 get to that temperature?
Gore engaged in having laws passed based on the same theory, which was an egregious contravention of the 1972 law since no one was consulted in public meetings.
Patrick Michaels, a skeptic, was the only scientist openly trying to oppose Hansen and he complained that he lacked the funding to compete with the money Hansen received from government sources. When an oil company, Western Fuels, stepped up and offered him funding, Michaels was lambasted by alarmists as representing big oil money. In fact, that became the MO of alarmists, relating anyone who opposed their views to Big Oil.
There was zero evidence of collusion between Michaels and Big Oil, he simply received money for expenses in order to compete with Hansen. However, even John and Roy of UAH have been labeled by alarmists as being in the pockets of Big Oil.
I ask you, Nate, you’ve been here a while, does Roy, or John, strike you as the type to deceive people re funding from oil companies? John pays his own way to hearings and the likes to remove any suggestion that he is compensated in any way.
barry…”Meanwhile, BP is transferring MORE internal energy to the GP. This difference is what determines the flow of heat. Any contrary argument ignores the classic definition of heat.
As has been said many times, EM radiation is not heat. Not if you define heat in the classic way.
Temperature change is not heat, either.
What is the classic definition of heat?
“heat (Q) is defined as energy in a state of transit across the boundary of a system by virtue of a temperature difference”
***
Barry…the classic definition of heat goes back to Clausius circa 1850, and as he put it, heat is the ponderable motion of particles (atoms). Ponderable means they have significant mass, but in the day no one knew much about atoms.
Clausius also lent the definition of internal energy to the first law and he defined it as internal heat plus internal work, where work was in the atomic vibrations. Unfortunately we has ijits in those days like Thompson, who convinced Clausius that his definition of internal energy was too cumbersome and should be shortened to just energy. That has lead to the modern stupidity where heat has been redefined as a transfer of energy, where energy is left as a mysterious, undefined entity.
If you have external work and heat as energies in the 1st law then you must have internal heat and work to balance the equation. Lumping internal heat and work as internal energy is a serious cop out. It gets worse when this mysterious internal energy is being transferred and called heat.
Temperature is defined implicitly as the measure of a change in heat levels. Nobody anywhere claims temperature is a measure of internal energy, it is a measure of the relative level of heat.
From the following link re the etymology of temperature…”The modern scientific sense of “degree of heat or cold” is by 1670 (Boyle), from Latin temperatura, which had been used in this sense by Galileo. As “the thermal element of weather” by 1820; in reference to the degree of heat of a living body, by 1876. The meaning “fever, high temperature” is attested by 1898″.
https://www.etymonline.com/word/temperature
A better question is this…what is energy? The popularized definition of energy is the ability to do work. What does that tell us about the phenomenon we call energy…absolutely nothing. We still have no idea what it is in form.
The term kinetic energy is no better since it refers to any energy in motion. Here is a rough definition of energy…
https://www.eia.gov/energyexplained/what-is-energy/
Note that it uses the definition above then it goes on to list different forms of energy such as heat, light, motion, electrical, chemical and gravitational. For some reason it omit nuclear energy.
Ergo, we cannot reference energy specifically unless we state its form.
It also mentions that energy can be converted from one of those forms to another. How can that work if heat is relegated to a transfer of energy? Makes no sense. The energy being transferred is heat since the energy represented by it is defined by Clausius as heat re internal energy.
We cannot transfer work since it is defined as a force acting over a distance on a mass. We can transfer work as an equivalent by converting it to heat. That is the basis of the work of Clausius, the equivalence of heat and work. The equivalence was first stated by Joule circa 1840 when the derived an equivalence between the joule (work) and the calorie (heat).
Internally, work can be realized as an atom vibrating but what causes the force that makes it vibrate. We know that atoms vibrate more in a mass as heat is applied and less as heat is removed. We also use a thermometer to measure the relative level of heat in the mass.
The definition of temperature became obfuscated when Maxwell and Boltzmann began theorizing about fictitious particles in mass. They had to do that because at the time the electron had not been discovered and atomic structure was unknown.
The point is, temperature had already been defined using the freezing and boiling points of water as set points. Both the Celsius and Fahrenheit scales had already been developed, as well as the Kelvin scale as a projection of the Celsius scale toward a fictitious absolute zero.
How do we raise the temperature of ice and continue to raise it to the boiling point? We add heat!!!! A child could tell you that yet many modern scientists don’t understand it.
The BP/GP experiment is not an actual experiment but a thought-experiment by Eli Rabbett who has demonstrated a lack of understanding of heat transfer. He was offering the thought experiment to substantiate his alarmist belief of heat transfer re the AGW theory.
In a rebuttal to G&T, Halpern (Eli) et al replied that if two bodies are radiating at each other, and the 2nd law applied, then one body would not be radiating. They were trying to sum heat in a transfer using your logic based on a two-way flow of heat via radiation. G&T replied that heat can only be summed if there are two quantities of heat to be summed and the summation cannot be applied to an alleged transfer of heat by radiation.
Heat cannot flow in both directions via radiation and the proof lies in Bohr important discovery in 1913 that explains basic atomic theory. He based it on the electron in the hydrogen atom which he visualized orbiting the sole proton in the nucleus. He solved it by limiting the orbiting electron to only discrete orbits based on Planck ‘h’ relationship between frequency and intensity.
The basic formula is E = hf. If the electron gains energy and increases it KE it must jump to a specified higher energy orbital. According to Clausius that rise in KE represents an increase in heat. That is exactly what happens. If heat is added to the mass, or EM of sufficient energy to the mass surface, the temperature of the mass rises.
The electrons that have gained KE can apparently only exist in that state for a short period and then drop back to a lower level. As they drop back, they must give up the acquired KE and they do so via radiation by emitting a quantum of EM. That EM has a frequency equivalent to the angular frequency of the orbiting electron.
The electron is the arbiter. The frequency of emitted EM and the intensity is solely determined by the electron angular velocity and the number of orbitals over which it drops. The electron in any material is also very sensitive to the incoming EM frequency. It will only react to a very narrow band of frequencies, in the order of 1 hertz, or cycles per second.
If the electrons in the GP atoms are at a lower frequency than the BP electrons, electrons in the BP will not react to GP radiation. The BP electrons are that fussy. This theory comes naturally to me since I have decades of experience with electrons and how they work. I have seen the way they react in narrow band filters and how susceptible they are to resonance in magnetrons (microwave devices).
I understand from an intuitive perspective why they reject frequencies that do not meet their angular frequency requirements and I get it why you don’t understand it. Having said that, if you want to understand it, get into Bohr at a pre-Schrodinger level. Shroddy obfuscated it incredibly with his wave equation which was based incorrectly on the claim of de Broglie that electrons are both a particle and a wave.
For whatever reason, Schrodinger’s wave equation works even though Linus Pauling had to modify it to get it to work on molecules. Feynman summed it up nicely by claiming that quantum theory works but no one knows why.
Gordon,
No one can discern what your point is.
Your Native American name must be ‘He Who Gish Gallops’.
I addressed the incorrect point made by Barry that the classic definition of heat is a transfer of energy. That is not classic at all, it is a new definition by people who neither understand energy nor heat. I pointed out that heat had already been defined classically by scientists like Clausius and Joule, definitions that made good sense wrt energy.
The nonsense that heat is simply a measure of energy transfer is so stupid it deserves to be banned. I have asked the simple question, without a single reply, that if heat is a transfer of energy, what energy is being transferred? Talking about a generic energy is for children in grade school, in science, we must name the energy form. In this case, the energy form being transferred is heat.
If the energy forms are named, then the AGW theory immediately falls apart. It contradicts the 2nd law by allowing a heat transfer from cold to hot, by its own means, and the justification is based on a redefinition of the 2nd law as a net heat flow, without proof, and lumping electromagnetic energy and heat under a generic energy.
How can heat be defined as a transfer of heat?
Barry also claimed that temperature is not heat. Of course it’s not, temperature is a human definition that tries to measure the relative levels of heat. This is not something I made up, Planck discussed it in his book on heat over a century ago. Planck laid out other measurements like time and density that are based on natural phenomena. Temperature is defined based on the freezing point and boiling points of water and density is defined as the mass/volume of water. Time is defined on the rotational period of the Earth.
Here again, Boltzmann and Maxwell redefined temperature as the average kinetic energy of gas molecules, hence the statement by Barry. The problem is, they were not talking about real molecules composed of real atoms, bonded together by electron orbitals, they were talking about imaginary data points in a statistical argument. The structure of the atom, or the molecule, had yet to be derived, and when it was derived, it shot down the definitions by Maxwell and Boltzmann.
Boltzmann was actually trying to determine entropy and the 2nd law using statistical methods and he failed. Yet, many scientists today line up to use his obfuscated science while discarding that of Clausius. In fact, most definitions of entropy I have read from modern scientists is so far from the Clausius definition, as to be worthless. Remember, Clausius defined entropy as a mathematical application of the 2nd law, which is about a limitation in the direction of heat transfer under certain conditions.
Clausius defined entropy based on heat, yet yahoos today insist on redefining it as a measure of disorder. Is disorder measured in joules/degree K, the basic units of entropy? Last time I looked, the joule is an equivalent measure of heat, in calories, and the degree is a relative measure of heat.
Has anyone made any attempt to understand that statement re kinetic energy? Kinetic energy is nothing more than any energy in motion. It tells us nothing about the form of that energy. So, what is the form of energy related to gas molecules?
If you add heat to a gas, the molecules move faster. But why??? No one knows. That means adding heat increases the KE of each molecule, something Maxwell and Boltzmann defined as temperature. The point is, heat is the form of energy that causes molecules to move faster, hence increasing their KE. Temperature is a measure of that increase in KE.
***However, the increase in KE is an increase in a FORM of energy***
What form of energy is increasing!!! That must be stated in order for the KE to make sense. The only form of energy that will affect a thermometer is heat. Even if the thermometer is radiated by EM, the EM is converted to heat within the thermometer, otherwise it will not register.
***Thermometers measure heat***
But, what is heat as a form of energy? No one knows!!!! Clausius was closest when he claimed heat is the KE of ponderable particles. In modern terms, heat is the kinetic energy of atoms in a gas or as atomic vibrations in a liquid or solid. However, internally in atoms, heat is the relative orbital energy level, aka internal KE of the electrons in an atom. Ergo, heat internally in an atom is related to the KE of electrons in orbitals.
But, what is it about heat or EM absorption that causes an electron to gain KE and move to a higher energy orbital? We don’t know!!! We have to call it something and in this case we call it heat. In atoms, heat begats heat and EM gets converted to heat.
The stumbling point is kinetic energy? What is it? When you have an atom with a mass in motion, that is kinetic energy. However, it tells you nothing about the form of that energy. We have defined the form of that energy as thermal energy, or heat. That is the faster the molecules of a gas move in a mix, the hotter the gas, and the higher the temperature.
Claiming we are measuring kinetic energy or internal energy is plain silly. Neither definition has any meaning that reveals the form of energy. Anyone with integrity will state that form so we know what form of energy is involved. Once that form is ascertained, then we can apply words like kinetic and internal freely.
But, what causes atoms to move faster or slower? We know it’s about energy but that’s all we know. We can’t even state what gravity is, never mind energy. So, when scientists make statements that define heat as the transfer of heat, they are being exceedingly stupid.
Barry is missing the obvious, that heat and temperature were defined correctly long before Boltzmann and Maxwell obfuscated the meanings. Both tried to base heat and temperature on an imaginary entity which was nothing more than data points conjured to represent imaginary atoms of gas. Since then, we have learned how atoms are basically constructed and that information has negated Boltzmann et al.
Gordon, You’re stuck in the
50s.
The 1850s.
To suggest nothing has been learned about Thermodynamics since then is absurd.
“The nonsense that heat is simply a measure of energy transfer is so stupid it deserves to be banned.”
Science uses this definition for good reason: it works. A better version has heat is ‘energy transfer as a consequence of a temperature difference’
Heat is not a substance that exists in a body, because once it is transferred to a body it can be transformed into work (expanding the body for example).
Kinetic and potential energy in a body is called internal energy.
This works for science. Whether you like it or not, is irrelevant.
Nate 6:32 am, since, as you write, heat is not a substance in a body then heat can’t be transferred out of a body in which heat is not contained thus your typical dictionary definition of heat has lost physical meaning. At 12:56 am, Gordon does almost correctly physically define heat as did Clausius in 1850s: “heat is the (total) KE of ponderable particles” contained inside a body. The massive particle internal KE does physically transfer into, and out of, any massive substance at all times during any thermodynamic process.
However, the list of what Gordon does continually get physically wrong is long. Note that Gordon strays from using his own initially (almost) physically correct definition of heat throughout his own comment (and others).
When we measure the heat capacity of materials, it is aways actually a measurement of the amount transferred to the object in order to raise its temperature by 1 degree C.
Obviously we never actually measure the heat when it is inside the body.
Once transferred inside a body the energy is both potential and kinetic.
And its then called internal energy. Which is perfectly reasonable name. Its ebergy and is internal.
And keep in mind, it is just a name, and no one is harmed by it.
I’d say DREMT, Gordon, et. al. are irreparably harmed in thermodymimic discussions when misusing the term “heat” for a purely imaginary entity. Being imaginary, that entity can be anything they can imagine e.g. “heat internally in an atom”, lol.
“I’d say DREMT…”
Of course you would. You’re obsessed.
…. With correcting bad thermodynamic science.
No, with me. I live rent free in your head.
Hi Nate,
Is this you by chance?:
https://wattsupwiththat.com/2026/02/05/holocene-warming/#comment-4163018
If so, your comment has been approved from moderation, and there’s a reply waiting for you.