
 Home/Blog
March 2026 was record-warm for the Lower 48.
The Version 6.1 global average lower tropospheric temperature (LT) anomaly for March, 2026 was +0.38 deg. C departure from the 1991-2020 mean, statistically unchanged from the February, 2026 value of +0.39 deg. C.
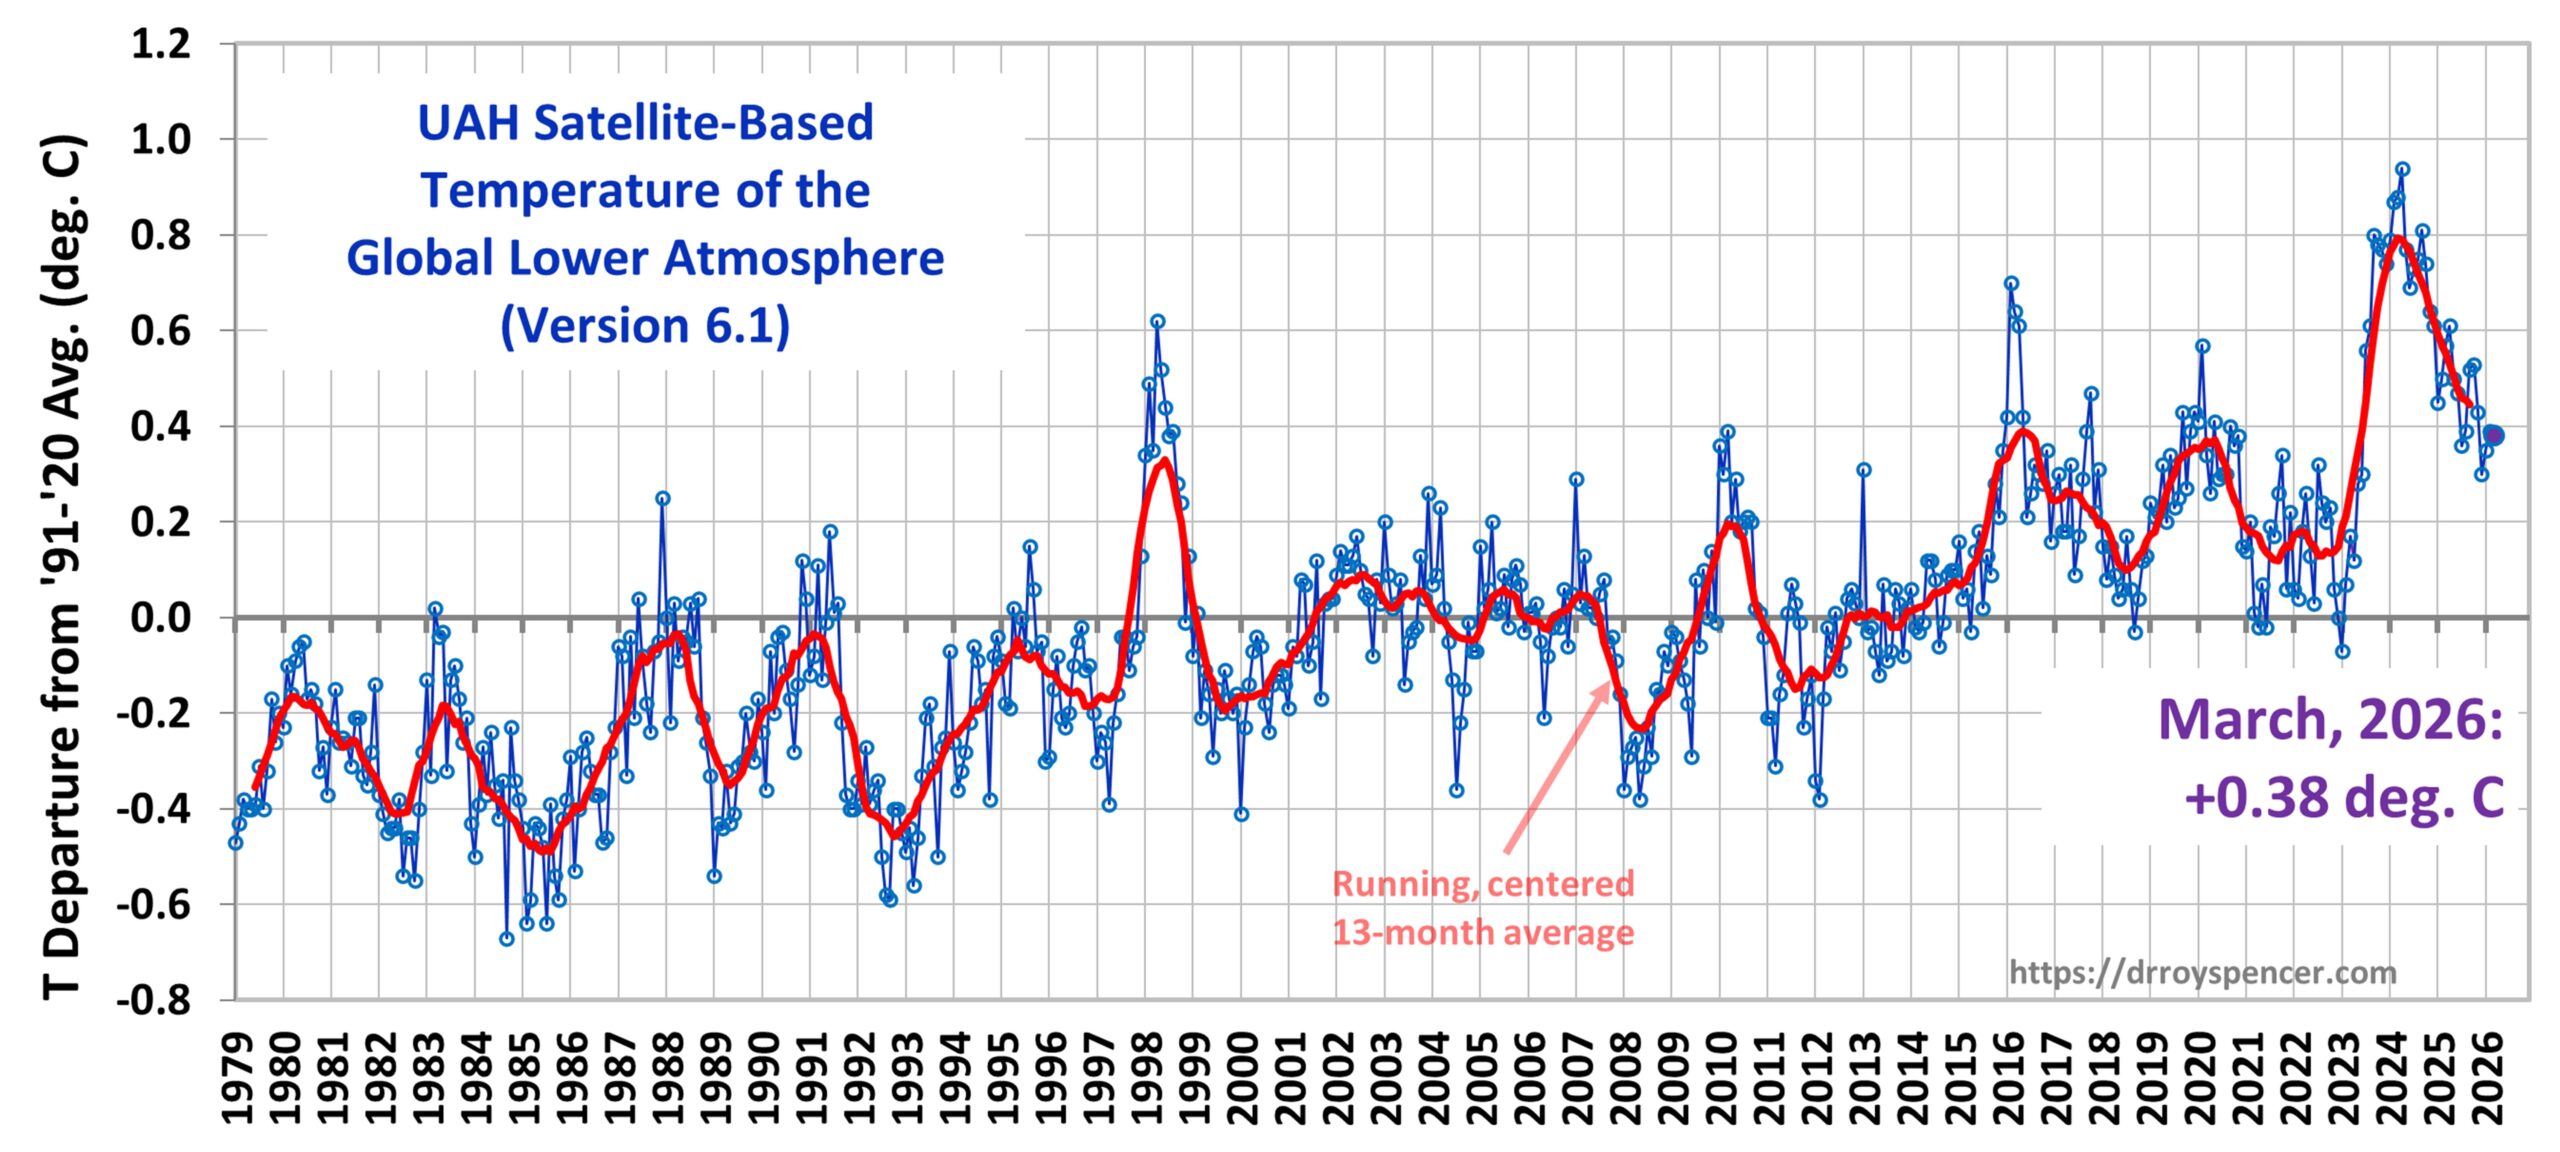
The Version 6.1 global area-averaged linear temperature trend (January 1979 through March 2026) remains at +0.16 deg/ C/decade (+0.22 C/decade over land, +0.13 C/decade over oceans).
The following table lists various regional Version 6.1 LT departures from the 30-year (1991-2020) average for the last 27 months (record highs are in red).
| YEAR | MO | GLOBE | NHEM | SHEM | TROPIC | USA48 | ARCTIC | AUST |
| 2024 | Jan | +0.80 | +1.02 | +0.57 | +1.20 | -0.19 | +0.40 | +1.12 |
| 2024 | Feb | +0.88 | +0.94 | +0.81 | +1.16 | +1.31 | +0.85 | +1.16 |
| 2024 | Mar | +0.88 | +0.96 | +0.80 | +1.25 | +0.22 | +1.05 | +1.34 |
| 2024 | Apr | +0.94 | +1.12 | +0.76 | +1.15 | +0.86 | +0.88 | +0.54 |
| 2024 | May | +0.77 | +0.77 | +0.78 | +1.20 | +0.04 | +0.20 | +0.52 |
| 2024 | June | +0.69 | +0.78 | +0.60 | +0.85 | +1.36 | +0.63 | +0.91 |
| 2024 | July | +0.73 | +0.86 | +0.61 | +0.96 | +0.44 | +0.56 | -0.07 |
| 2024 | Aug | +0.75 | +0.81 | +0.69 | +0.74 | +0.40 | +0.88 | +1.75 |
| 2024 | Sep | +0.81 | +1.04 | +0.58 | +0.82 | +1.31 | +1.48 | +0.98 |
| 2024 | Oct | +0.75 | +0.89 | +0.60 | +0.63 | +1.89 | +0.81 | +1.09 |
| 2024 | Nov | +0.64 | +0.87 | +0.40 | +0.53 | +1.11 | +0.79 | +1.00 |
| 2024 | Dec | +0.61 | +0.75 | +0.47 | +0.52 | +1.41 | +1.12 | +1.54 |
| 2025 | Jan | +0.45 | +0.70 | +0.21 | +0.24 | -1.07 | +0.74 | +0.48 |
| 2025 | Feb | +0.50 | +0.55 | +0.45 | +0.26 | +1.03 | +2.10 | +0.87 |
| 2025 | Mar | +0.57 | +0.73 | +0.41 | +0.40 | +1.24 | +1.23 | +1.20 |
| 2025 | Apr | +0.61 | +0.76 | +0.46 | +0.36 | +0.81 | +0.85 | +1.21 |
| 2025 | May | +0.50 | +0.45 | +0.55 | +0.30 | +0.15 | +0.75 | +0.98 |
| 2025 | June | +0.48 | +0.48 | +0.47 | +0.30 | +0.80 | +0.05 | +0.39 |
| 2025 | July | +0.36 | +0.49 | +0.23 | +0.45 | +0.32 | +0.40 | +0.53 |
| 2025 | Aug | +0.39 | +0.39 | +0.39 | +0.16 | -0.06 | +0.82 | +0.11 |
| 2025 | Sep | +0.53 | +0.56 | +0.49 | +0.35 | +0.38 | +0.77 | +0.30 |
| 2025 | Oct | +0.53 | +0.52 | +0.55 | +0.24 | +1.12 | +1.42 | +1.67 |
| 2025 | Nov | +0.43 | +0.59 | +0.27 | +0.24 | +1.32 | +0.78 | +0.36 |
| 2025 | Dec | +0.30 | +0.45 | +0.15 | +0.19 | +2.10 | +0.32 | +0.37 |
| 2026 | Jan | +0.35 | +0.51 | +0.19 | +0.09 | +0.30 | +1.40 | +0.95 |
| 2026 | Feb | +0.39 | +0.54 | +0.23 | +0.03 | +1.91 | -0.48 | +0.73 |
| 2026 | Mar | +0.38 | +0.33 | +0.42 | +0.07 | +3.74 | -0.48 | +1.14 |
| YEAR | MO | GLOBE | NHEM | SHEM | TROPIC | USA48 | ARCTIC | AUST |
Record Warmth in the Contiguous U.S. (Lower 48)
For the Lower 48, the March 2026 temperature anomaly was easily the record warmest of all months in the 47+ year satellite record: +3.7 deg. C above average for all Marches. Second place goes to March 2012, with +2.2 deg. C above the mean, while 3rd place goes to December 2025 at +2.1 deg. C.
Interestingly, December through April are periods of large variability for the Lower 48. All 6 of the warmest months (in terms of departures from normal) since 1979 occurred in December through April. Furthermore, all 8 of the coldest months occurred in December through April.
————————-
The full UAH Global Temperature Report, along with the LT global gridpoint anomaly map for March, 2026 and a more detailed analysis by John Christy, should be available within the next several days here.
The monthly anomalies for various regions for the four deep layers we monitor from satellites will be available in the next several days at the following locations:


5th warmest March in the UAH data set, statistically tied with 2010 at 4th place.
Year Anomaly
1 2024 0.88
2 2016 0.64
3 2025 0.57
4 2010 0.39
5 2026 0.38
6 1998 0.35
7 2020 0.34
8 2004 0.23
9 2019 0.22
10 2017 0.18
10=2022 0.18
I thought March would be slightly warmer, maybe even up to +0.42C. The Polar Vortex is moving to the South Pole, and ENSO has been warming for about a month.
So the +0.38C is interesting, as the cooling trend appears healthy.
A couple of thoughts relative to that cooling trend.
1) We’ve seen cooling from the March/April time frame into Jun/Jul over the last couple of years. If that happens again in 2026, it would bring the anomaly below 0.2 C. That would be quite interesting to see.
2) My theory is the AMO index is driven by Arctic changes. The current cooling seen in the satellite data could be evidence that next 30+ year AMO cool phase has started and the AMO index will soon follow. This would also drive some global cooling.
Of course, it also appears El Nino will show up later this year which will drive warmer global temperatures over the fall and winter. El Nino is really an ocean cooling period but the energy movement temporarily warms the SSTs and air. This would mask some of the cooling, but set the stage for more dramatic atmospheric cooling in 2027.
Below normal here in the Vancouver, Canada area. After a mild winter, spring has proved to be quite cool.
Even if you accept that CO2 is, in part at least, responsible for some of the rise in temperatures since we came out of the Little Ice Age, the idea that this rise in temperatures seems to be responsible for every piece of bad weather – whether it’s heat waves, storms, droughts and floods is an extraordinary claim. And extraordinary claims need extraordinary evidence. We don’t have any such evidence. Instead we have models and “attribution studies”.
And given CO2, fundamental to photosynthesis, is greening the planet, 9 times as many people die from the cold than the heat and we find no evidence that rising sea levels is impacting anywhere – even the Maldives and South Pacific islands – attempting to curtail co2 emissions on this lack of evidence of harm is wrong.
Any reasonable person looking at the data would conclude that CO2 ‘most probably’ has little to no bearing on global temperatures due to saturation alone, never mind if there even is a greenhouse effect (due to heat rising up through the tropo by convection rather than radiation).
Reduced global cloud cover (which is certain, not a model) accounts for 80% of the observed warming and 100% of the trend. Alas, politics (money & power) grabbed hold of the climate debate many years ago, and when money & power gets anything, it doesn’t let go. Then you have people added into the mix who really do think that models are data. ‘Science’ is in a terrible mess – believing things that are not there (like dark matter/energy).
The deluded won’t admit to anything until the world cools between 2030-2035 due to solar cycle 26 and a cooling AMO. They will move onto something else, like microplastics, or radio waves, or aliens.
It’s been T shirt and shorts weather since January here in Los Angeles. Unusually warm since the beginning of the year,, just like all of the western U.S.
So what’s going on in the US?
+3.74!
I could recycle my comment from last month and then Nate would make a fool of himself again. I am still waiting for a “consensus” agreement to explain the last 3 years. For now, the cooling, yes cooling, seems to continue. Until next month…