 President Trump’s actions yesterday to rein in the EPA on a number of fronts involves the usual tension between environment and prosperity. Trump has rightly asserted that we can have both a relatively clean environment and prosperity, but this falls on deaf ears in the environmental community. His actions are painted as Republican’s desire to harm your children, because a more polluted environment is claimed to be worse for human health and welfare than achieving a cleaner environment.
But such assertions must be rejected, and forcefully. Because exactly the opposite is true — at least in an America which is already pretty clean.
Let me give you a simple example. Let’s say you pay to have your house cleaned once a week, and for a reasonable price the house is 90% cleaner each time.
Now let’s say you decide you want your house 99% cleaner on a continuous basis. Cleaner is better, right?
You have crews come in and work for hours every day, cleaning every surface with disinfectant. You buy the best air and water filtration systems. The cost goes up dramatically, and as a result you can no longer afford, say, the health care you once could afford before.
Then your young child falls ill from something she picked up at daycare. You figure she will probably be OK, kids get sick all the time, and you don’t take her to the doctor.
But this time it’s something more insidious. A rare disease left untreated leads to the rapid formation of an aneurysm in her coronary artery. Several years later she dies at a young age.
All because you wanted your house cleaner.
You might think this example is outlandish. Well, in the past week one of my grandsons was diagnosed with this disease. But since America has invested a great deal of money in our health care system, rather than wasting it on green energy schemes, it was caught in time.
In a theoretical sense, we can always work to make the environment “cleaner”, that is, reduce human pollution. So, any attempts to reduce the EPA’s efforts will be viewed by some as just cozying up to big, polluting corporate interests. As I heard one EPA official state at a conference years ago, “We can’t stop making the environment ever cleaner”.
The question no one is asking, though, is “But at what cost?”
It was relatively inexpensive to design and install scrubbers on smokestacks at coal-fired power plants to greatly reduce sulfur emissions. The cost was easily absorbed, and electricty rates were not increased that much.
The same is not true of carbon dioxide emissions. Efforts to remove CO2 from combustion byproducts have been extremely difficult, expensive, and with little hope of large-scale success.
There is a saying: don’t let perfect be the enemy of good enough.
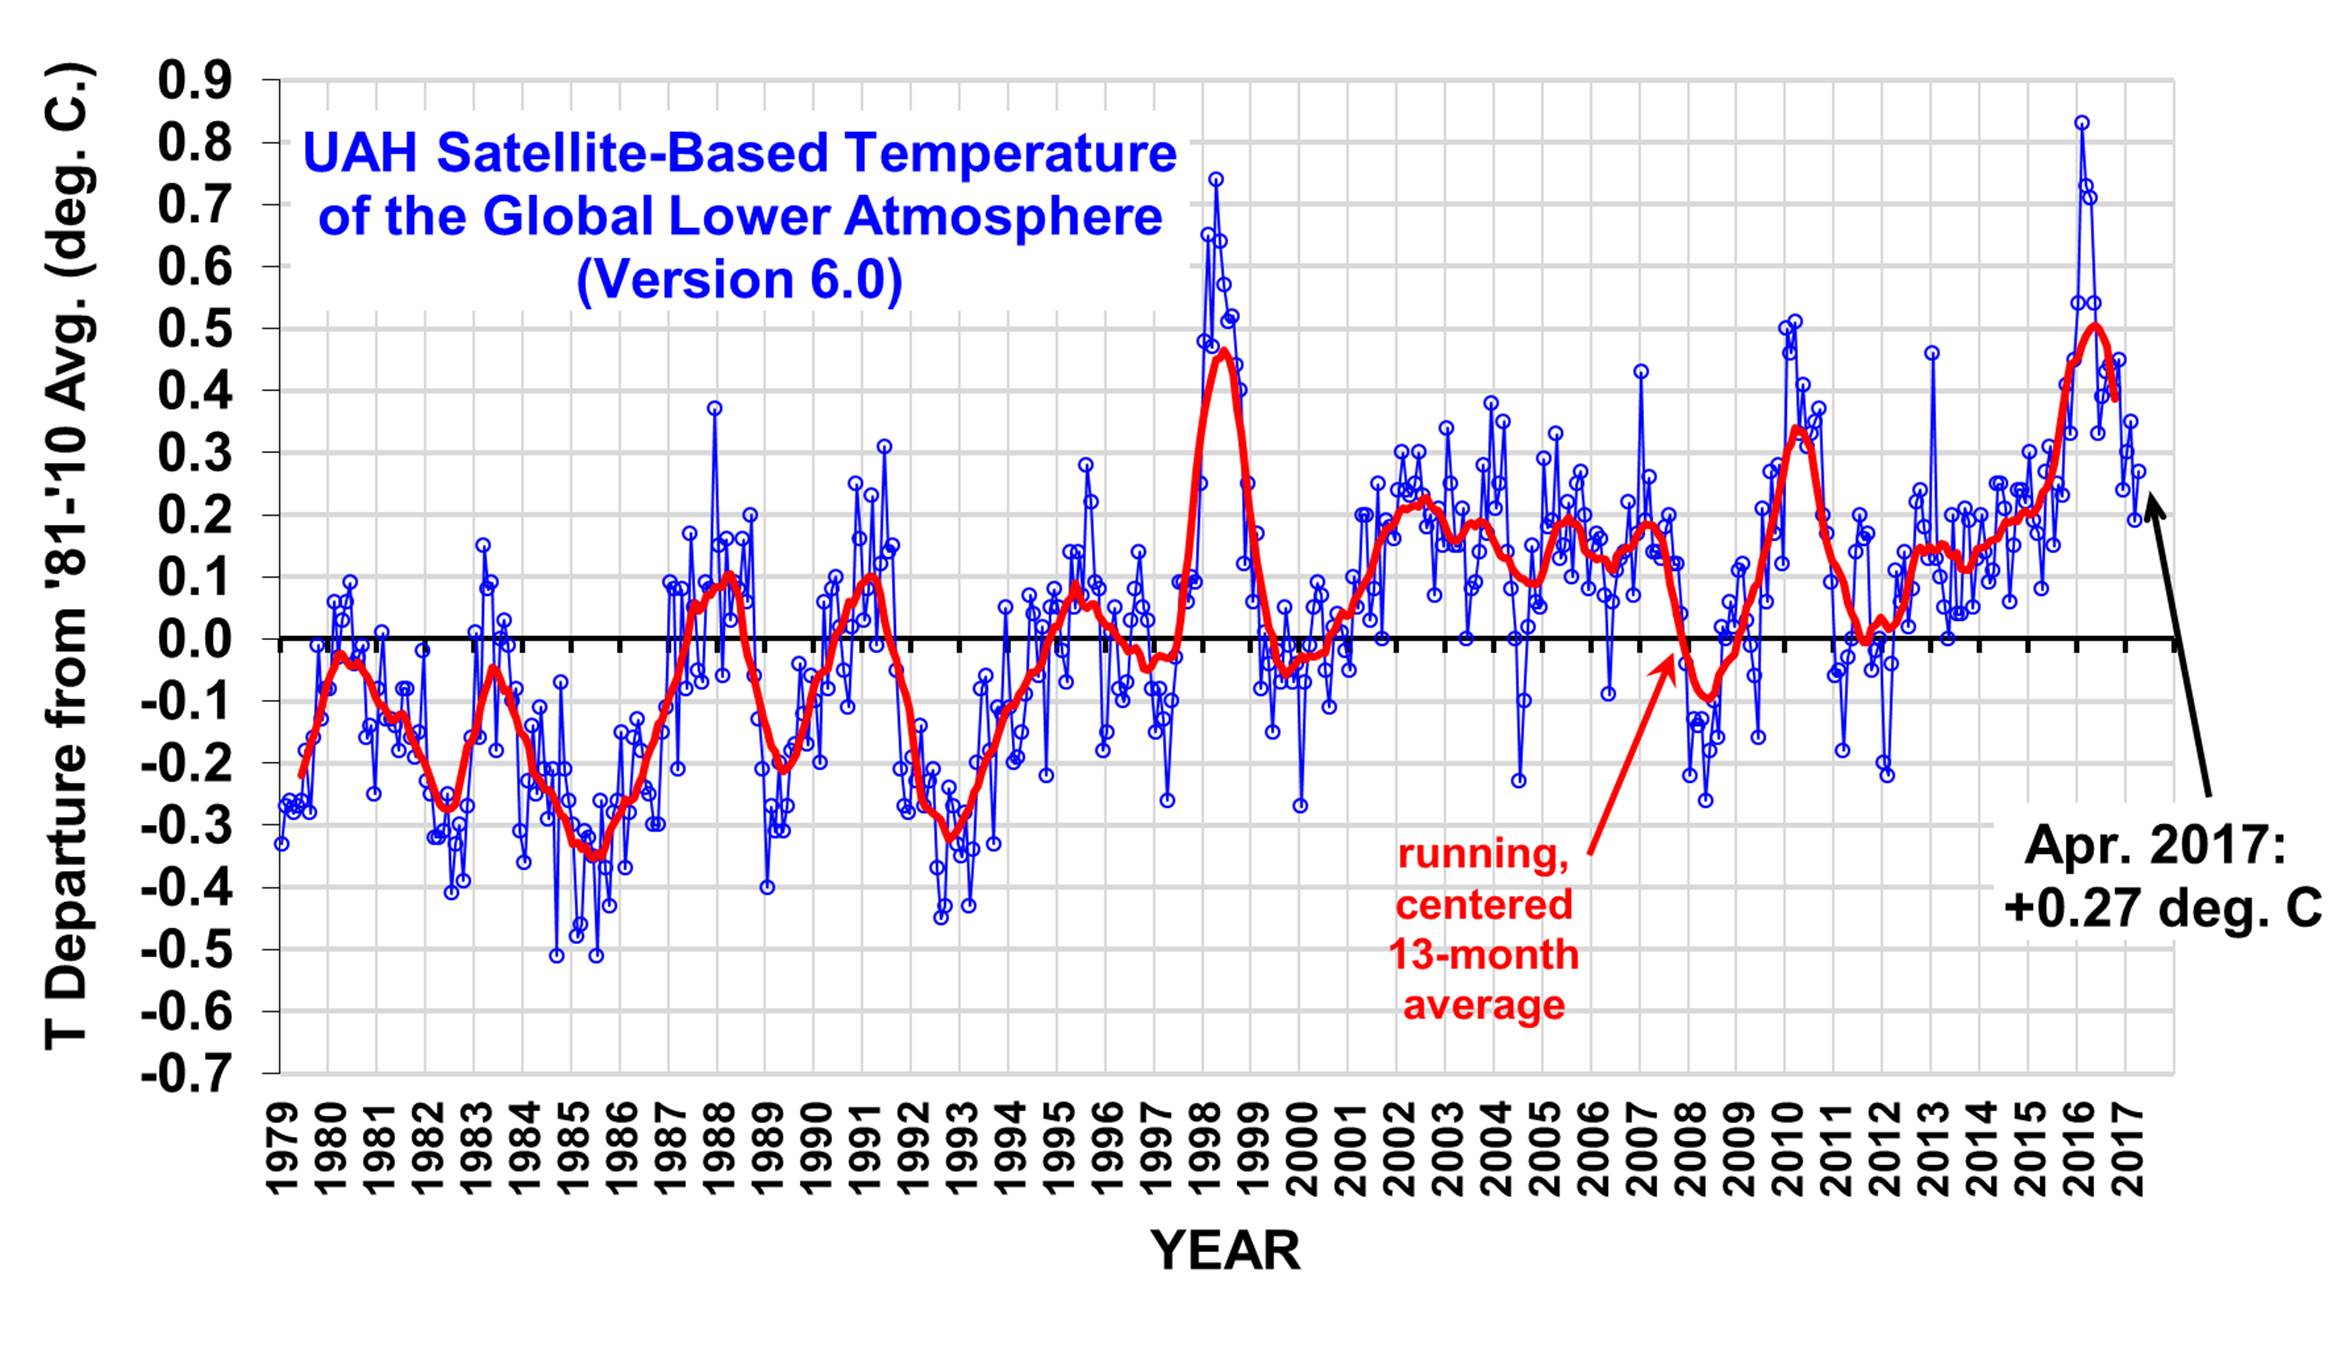
In the case of reducing CO2 emissions to fight global warming, I could discuss the science which says it’s not the huge problem it’s portrayed to be — how warming is only progressing at half the rate forecast by those computerized climate models which are guiding our energy policy; how there have been no obvious long-term changes in severe weather; and how nature actually enjoys the extra CO2, with satellites now showing a “global greening” phenomenon with its contribution to increases in agricultural yields.
But it’s the economics which should kill the Clean Power Plan and the alleged Social “Cost” of Carbon. Not the science.
There is no reasonable pathway by which we can meet more than about 20% of global energy demand with renewable energy…the rest must come mostly from fossil fuels. Yes, renewable energy sources are increasing each year, usually because rate payers or taxpayers are forced to subsidize them by the government or by public service commissions. But global energy demand is rising much faster than renewable energy sources can supply. So, for decades to come, we are stuck with fossil fuels as our main energy source.
The fact is, the more we impose high-priced energy on the masses, the more it will hurt the poor. And poverty is arguably the biggest threat to human health and welfare on the planet.
But isn’t it true that renewable energy such as solar and wind actually employ more people than the fossil fuel business? Yes, but once again there is a basic economic concept people need to keep in mind. We could put all of our unemployed people to work tomorrow by having them dig holes in the ground and filling them up again.
Yet, what would that do to increase prosperity? In order to build wealth, jobs need to be efficiently producing goods and services that people want… not just moving dirt around. So, just because it takes more people to provide more expensive renewable energy that can’t meet our needs anyway… that’s not a good thing.
People want — and need — inexpensive energy to prosper. Energy is required for everything humans do. Everything. The more it costs, the less money we have available for other more pressing problems.
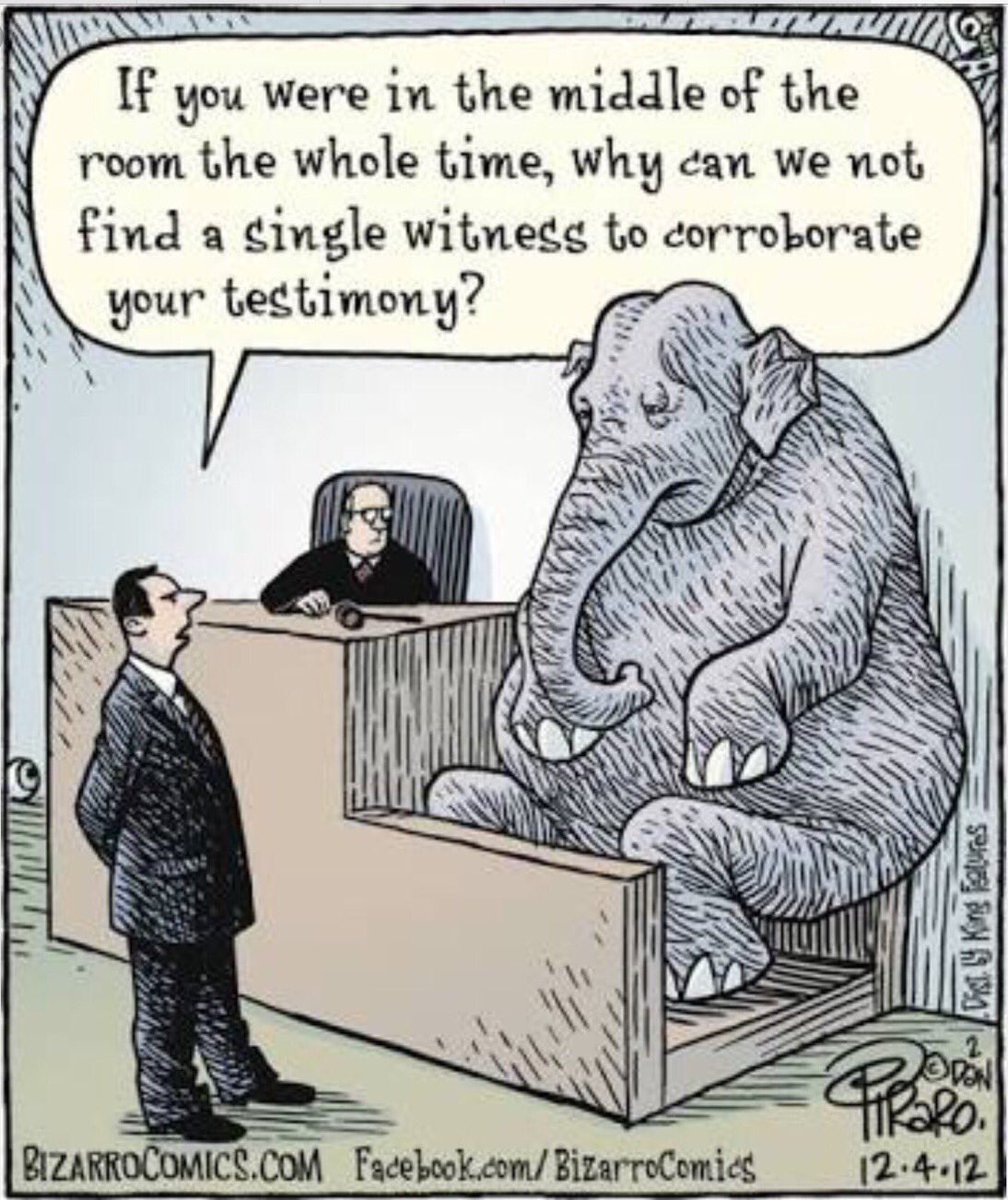
So, the elephant in the room no one is talking about is that fact that the Clean Power Plan (which Trump is trying to dismantle) will make poverty worse, and as a result more people will die. Expensive attempts to make things too clean will be worse for human health and welfare — not better.
And what would have been gained for all that extra expense? Even the EPA has admitted that President Obama’s plans for reducing CO2 emissions will have no measurable effect on global temperatures in this century… only hundredths of a degree reductions in global warming, even if the “consensus of scientists” theory is correct.
This is why Obama’s coal-killing efforts have been legitimately characterized as all pain for no gain.
So, this is an issue where we global warming “skeptics” have the moral high ground. Let’s take it and own it.
Do not accept the premise that everything the EPA wants to do is good for America. The EPA provided a useful service years ago when it required us to clean up our air and waterways. Now it is a bloated bureaucracy in a continuing search for relevancy. It wants to force us to make everything not just 90% cleaner, but 99% cleaner.
And THAT is bad for human health and welfare.

 Home/Blog