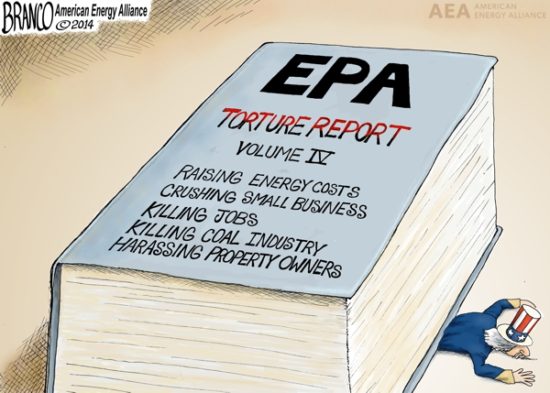
You might expect that my background in climate research would mean my suggestions to a Trump Administration would be all climate-related. And there’s no question that climate would be a primary focus, especially neutering the Endangerment Finding by the EPA which, if left unchecked, will weaken our economy and destroy jobs, with no measurable benefit to the climate system.
But there’s a bigger problem in U.S. government funded research of which the climate issue is just one example. It involves bias in the way that government agencies fund science.
Government funds science to support pre-determined policy outcomes
So, you thought government-funded science is objective?
Oh, that’s adorable.
Since politicians are ultimately in charge of deciding how much money agencies receive to dole out to the research community, it is inevitable that politics and desired outcomes influence the science the public pays for.
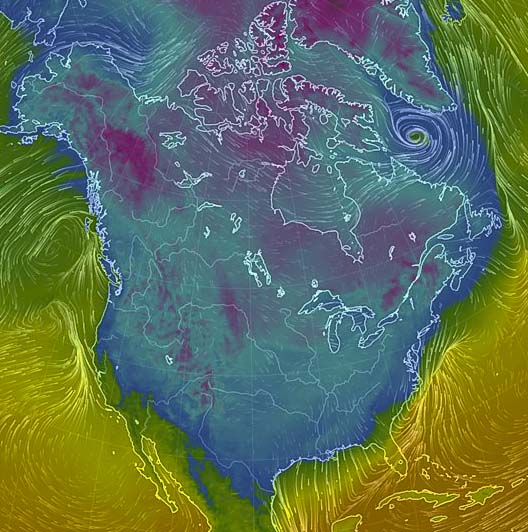
Using climate as an example, around thirty years ago various agencies started issuing requests for proposals (RFPs) for scientists to research the ways in which humans are affecting climate. Climate research up until that time was mostly looking into natural climate fluctuations, since the ocean-atmosphere is a coupled nonlinear dynamical system, capable of producing climate change without any external forcing whatsoever.
Giddy from the regulatory success to limit the production of ozone-destroying chemicals in the atmosphere with the 1973 Montreal Protocol, the government turned its sights on carbon dioxide and global warming.
While ozone was a relatively minor issue with minor regulatory impact, CO2 is the Big Kahuna. Everything humans do requires energy, and for decades to come that energy will mostly come from fossil fuels, the burning of which produces CO2.
The National Academies, which are supposed to provide independent advice to the nation on new directions in science, were asked by the government to tell the government to study human causes of climate change. (See how that works?)
Research RFPs were worded in such a way that researchers could blame virtually any change they saw on humans, not Mother Nature. And as I like to say, if you offer scientists billions of dollars to find something… they will do their best to find it. As a result, every change researchers saw in nature was suddenly mankind’s fault.
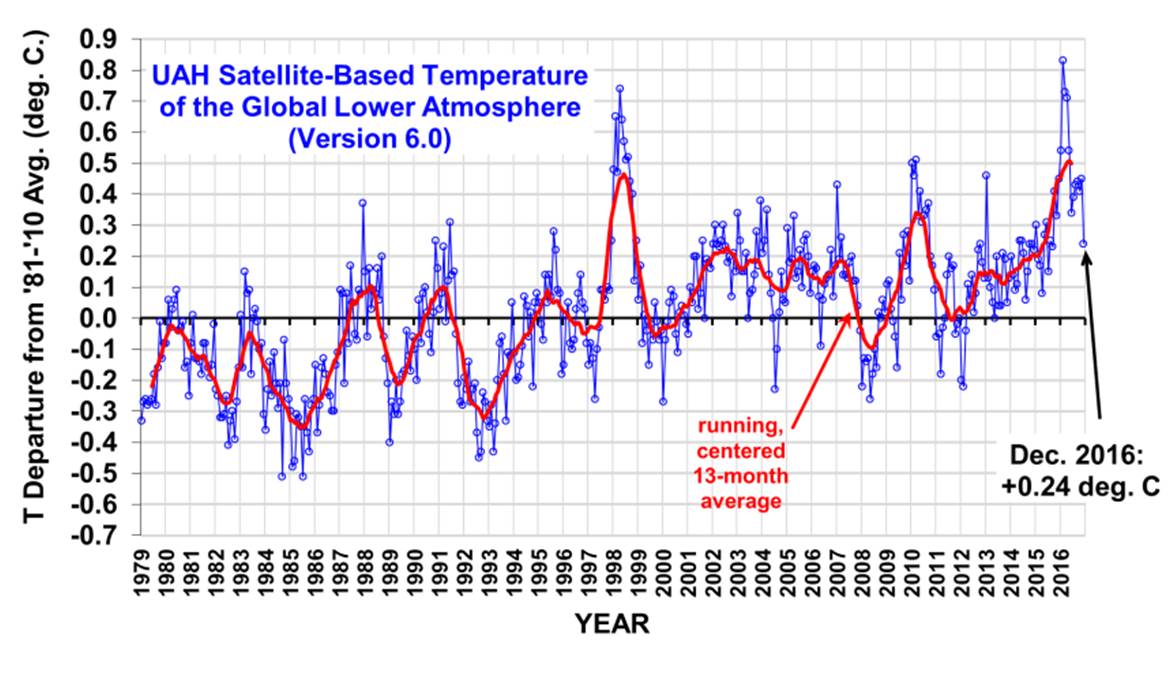
The problem with attribution in global warming research is that any source of warming will look about the same, whether human-caused or nature-caused. The land will warm faster than the ocean. The high northern latitudes will warm the most. Winters will warm somewhat more than summers. The warming will be somewhat greater at 10 km altitude than at the surface. It doesn’t matter what caused the warming. So, it’s easy for the experts to say the warming is “consistent with” human causation, without mentioning it could also be “consistent with” natural causation.
The result of this pernicious, incestuous relationship between government and the research community is biased findings by researchers tasked to find that which they were paid to find. The problem has been studied at the Cato Institute by Pat Michaels, among others; Judith Curry has provided a good summary of some of the related issues.
The problem is bigger than climate research
The overarching goal of every regulatory agency is to write regulations. That’s their reason for existence.
It’s not to strengthen the economy. Or protect jobs. It’s to regulate.
As a result, the EPA continues the push to make the environment cleaner and cleaner, no matter the cost to society.
How does the EPA justify, on scientific grounds, the effort to push our pollution levels to near-zero?
It comes from the widespread assumption that, if we know huge amounts of some substance is a danger, then even tiny amounts must be be a danger as well.
This is how the government can use, say, extreme radiation exposure which is lethal, and extrapolate that to the claim that thousands of people die every year from even low levels of radiation exposure.
The only problem is that it is probably not true; it is the result of bad statistical analysis. The assumption that any amount of a potentially dangerous substance is also dangerous is the so-called linear no-threshold issue, which undergirds much of our over-regulated society.
In fact, decades of research by people like Ed Calabrese has suggested that exposure to low levels of things which are considered toxic in large amounts actually strength the human body and make it more resilient — even exposure to radiation. You let your children get sick because it will strengthen their immune systems later in life. If you protected them from all illnesses, it could prove fatal later in life. Read about the Russian family Lost in the Taiga for 40 years, and how their eventual exposure to others led to their deaths due to disease.
The situation in climate change is somewhat similar. It is assumed that any climate change is bad, as if climate never changed before, or as if there is some preferred climate state that keeps all forms of life in perpetual peace and harmony.
But, if anything, some small amount of warming is probably beneficial to most forms of life on Earth, including humans. The belief that all human influence on the environment is bad is not scientific, but religious, and is held by most researchers in the Earth sciences.
In my experience, it is unavoidable that scientists’ culture, wordview, and even religion, impact the way they interpret data. But let that bias be balanced by other points of view. Since CO2 is necessary for life on Earth, an unbiased scientist would be taking that into account before pontificating on the supposed dangers of CO2 emissions. That level of balance is seldom seen in today’s research community. If you don’t toe the line, getting research results that support desired government policy outcomes, you won’t get funded.
Over-regulation kills people
You might ask, what’s wrong with making our environment ever-cleaner? Making our food ever-safer? Making our radiation exposure ever-lower?
The answer is that it is expensive. And as any economist will tell you (except maybe Paul Krugman), the money we spend on such efforts is not available to address more pressing problems.
Since poverty is arguably the most lethal of killers, I believe we have a moral obligation to critically examine any regulations which have the potential of making poverty worse.
And that’s what is wrong with the Precautionary Principle, a popular concept in environmental circles, which states that we should avoid technologies which carry potential risk for harm.
The trouble is that you also add risk when you prevent society from technological benefits, based upon your risk-adverse worldview of its potential side effects. Costs always have to be weighed against benefits. Thats the way everyone lives their lives, every day.
Are you going to stop feeding your children because they might choke on food and die? Are you going to stop driving your car because there are 40,000 automobile deaths per year?
Oh, you dont drive? Well, are you going to stop crossing the street? That’s also a dangerous activity.
Every decision humans make involve cost-vs-benefit tradeoffs. We do it consciously and subconsciously.
Conclusions & Recommendations
In my opinion, we are an over-regulated society. Over-regulation not only destroys prosperity and jobs, it ends up killing people. And political pressures in government to perform scientific research that favors biased policy outcomes is part of the problem.
Science is being misused, prostituted if you wish.
Yes, we need regulations to help keep our air, water, and food reasonably clean. But government agencies must be required to take into account the costs and risks their regulations impose upon society.
Just as too much pollution can kill people, so too can too much regulation of pollution.
I don’t believe that cutting off funding for research into human causes of climate change is the answer. Instead, require that a portion of existing climate funding be put into investigating natural causes of climate change, too. Maybe call it a Red Team approach. This then removes the bias in the existing way such research programs are worded and funded.
I’ve found that the public is very supportive of the idea that climate changes naturally, and until we determine how much of the change weve seen is natural, we cannot say how much is human-caused.
While any efforts to reduce the regulatory burden will be met with claims that the new administration is out to kill your children, I would counter these objections with, “No, expensive regulations will kill our children, due to the increased poverty and societal decay they will cause. 22,000 children die each day in the world due to poverty; in contrast, we aren’t even sure if anyone has ever died due to human-caused global warming.”
Using a simple analogy, you can make your house 90% clean and safe relatively easily, but if you have to pay to make it 100% clean and safe (an impossible goal), you will no longer be able to afford food or health care. Is that what we want for our children?
The same is true of our government’s misguided efforts to reduce human pollution to near-zero.

 Home/Blog