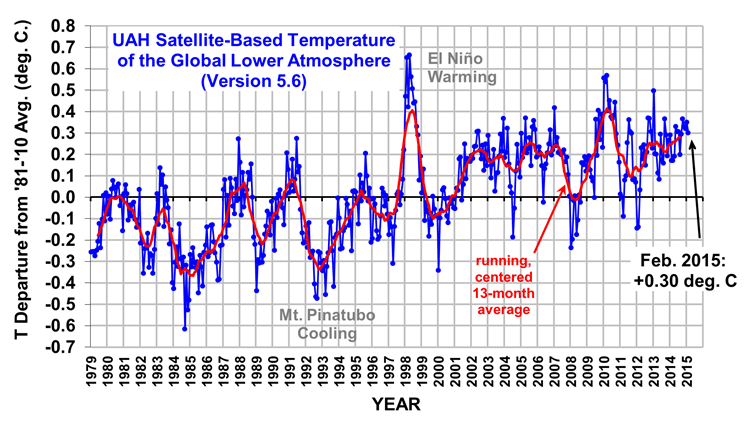
The “pause” in global warming is becoming increasingly difficult for the climate establishment to ignore, which is a good thing. They are now coming up with reasons why there has been a “pause” (a term I dislike because it implies knowledge of future warming, which no one has), and spinning it as if it is bad new for us.
But when they assume that natural climate variations can cause a cooling influence, they are also admitting there can be natural sources of warming.
A natural change in ocean circulation is the leading potential explanation for the pause. Due to the huge temperature difference between surface waters and deep water, any small change in ocean overturning can result in either warming or cooling of surface temperatures. If the ocean was isothermal with depth, such a mechanism would not exist.
The point of this post is to remind people of what I have stated before: to the extent that a change in ocean circulation has negated anthropogenic warming in the last 15+ years, an opposite change likely enhanced warming during the 1970s to 1990s.
You can’t have one without the other. Natural fluctuations in ocean vertical circulation are cyclical. You can’t attribute the recent warming hiatus to natural forcings without also addressing the role of potential natural forcings in causing the previous warming period. At best, it betrays a bias in reasoning; at worst, it is logically inconsistent.
This is not just a minor detail that is irrelevant to long-term climate predictions because the models were mostly developed (and modelers’ opinions regarding sensitivity formed) during a period (the 1970s to 1990s) when substantial natural warming was occurring, yet they assumed it was entirely manmade. Correcting for the mistake would alter our understanding of climate change as well as any proposed energy policies to (supposedly) avert it.
This is why the paper we published in APJAS last year was so important. It demonstrated that El Ninos change the planetary radiation budget, allowing more solar heating of the system. The paper was rejected out of hand by many in the climate establishment simply because it did not support the IPCC party line. (Odd, since our results potentially explain why their models continue to produce, on average, twice as much warming as has been observed.)
Most of those who criticized it probably didn’t even read it, or try to understand it. (I’ve had reviewers of papers reject our paper without even reading it, because their objections were based upon what they assumed was in the paper, rather than what was actually in the paper!)
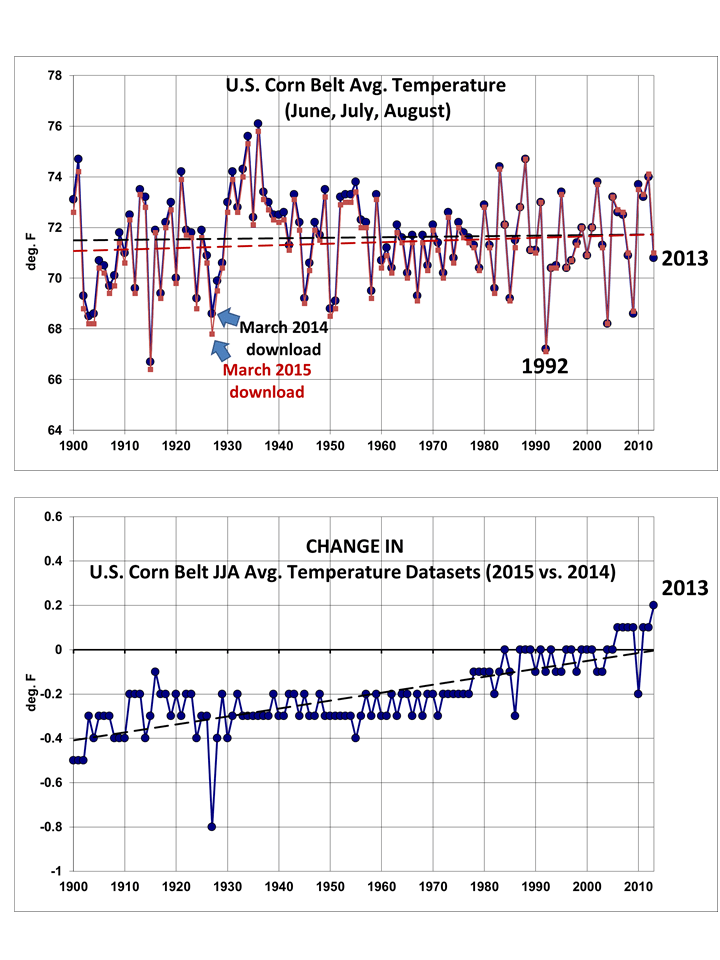
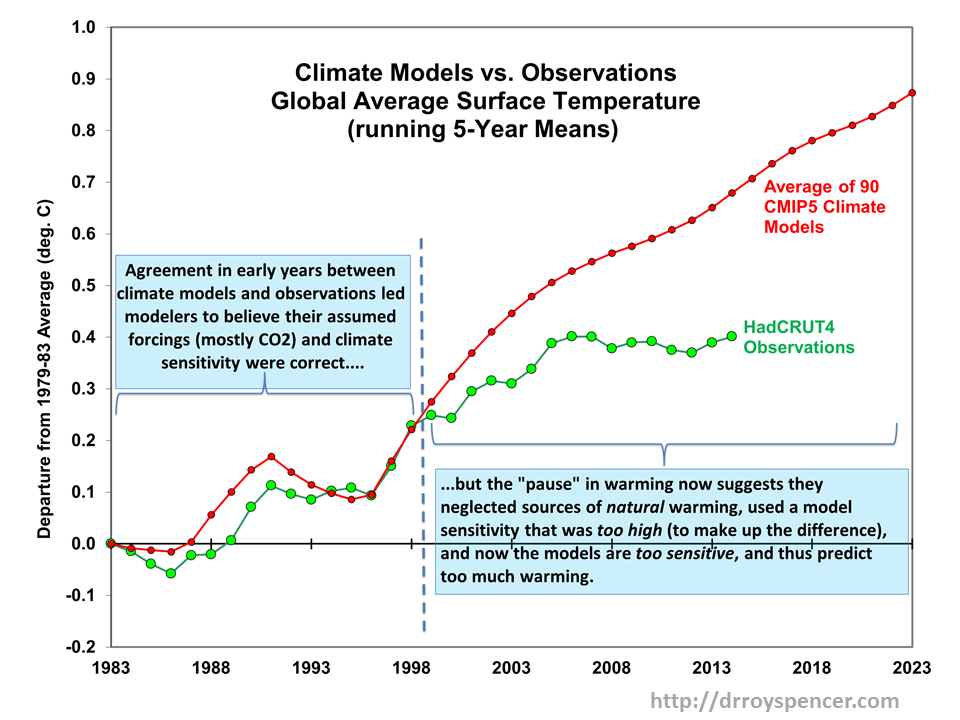
Before I go over some of the details of that paper (again), here’s a graph which conceptually explains the big-picture significance of it. Please read the informational boxes. Go ahead, I’ll wait…
The simplicity of our 1D model (one vertical dimensional) is one of its strengths. Global average surface temperature changes (as James Hansen has also stated), can only be due to 3 processes: (1) radiative forcing, (2) radiative feedback, and (3) changes in ocean vertical circulation, all of which can be addressed with a 1D model like ours.
Contrary to straw-man criticisms of the model, it was not meant to replicate El Nino and La Nina (which even 3D coupled climate models cannot do), but instead to (1) take the observed radiative perturbation of the climate system associated with ENSO since we have had good CERES satellite radiative budget observations (since 2000), and then (2) extend that relationship back in time with the known history of El Nino and La Nina to see how much of recent ocean warming was due to ENSO.
Admittedly, the model we used was not perfect, just as no model is. Even complex 3D climate models include a myriad of assumptions and approximations, most of which can be improved upon. Our critics will use technical jargon to make it sound like our model is worthless even though their 3D models, after billions of dollars of investment, still do not produce demonstrably better forecasts of global warming than 1D models!
The central issue we addressed in Spencer & Braswell (2014) — which cannot be brushed aside by claiming there are imperfections of our model — is this:
1) satellite radiative budget observations show the Earth’s radiative balance changes with ENSO, with the radiative changes occurring before the actual temperature changes occur (implying causation). In particular, El Nino warmth (and La Nina coolness) is partly (about 1/3) radiatively-caused. We termed this “internal radiative forcing” of the climate system, probably due to a change in global average cloudiness associated with changes in atmospheric circulation.
2) Since there are periods when El Nino is stronger than La Nina (e.g. 1970s-1990s), this then causes periods of natural warming.
3) Models that ignore natural sources of warming must be tuned to be too sensitive, in order to explain the observed 1970s-1990s warming with increasing CO2 alone (or nearly alone). They then produce too much warming in future decades.
The basic idea of something like ENSO producing multi-decadal periods of warming or cooling was not original to us. We simply used observational data (satellite radiative budget measurements) to demonstrate the natural radiative warming (and cooling) mechanism exists, and then used an energy balance model to quantitatively estimate just how much of recent ocean warming could be explained by the mechanism.
No nitpicking over our finite differencing scheme, or our extension of the bottom of the ocean to only 2,000 m depth, changes this fact.
In fact, it doesn’t even matter if you call the ENSO radiative effect a “forcing” or a “feedback” (an argument I’ve had with Andy Dessler)…the model shows that when the effect is included in an energy balance model, with the observed time lag, it reduces the resulting model climate sensitivity by about 50%.
I know….I’ve said all of this before. But it needs to be repeated. Climate change issues are complex, and whenever we can find clarity and significance, it needs to be drilled into our heads so we don’t lose sight of real progress in our understanding.
Even our simple 1D model produced a higher climate sensitivity consistent with IPCC claims if we assumed all climate change was due to the same forcings they assume. The IPCC’s climate models are too sensitive (produce too much warming in response to increasing CO2) because they have basically assumed virtually all previous warming was due to increasing CO2, not due to Nature.
The models produce results consistent with whatever assumptions are programmed into them. We should always question our assumptions, which are usually wrong, and continually strive to make them less wrong.
I don’t have hopes that the IPCC will change their tune, however, because that organization was not formed to find out if anthropogenic global warming was a problem. It assumed that from the outset. And by the time their models are unequivocally proved wrong, all of the modelers will be retired — or dead.
But what our analysis also implies is that, when the current natural cooling effect goes away, some warming will resume. It just won’t be as strong as current models predict. Admittedly, we only addressed ENSO as a natural forcing mechanism. To the extent other mechanisms are at work, climate sensitivity might be even lower than we calculated, and future warming would be even more benign.
I wouldn’t even rule out future cooling. But for now, I sure wouldn’t bet on it.
At this point, no one really knows.

 Home/Blog