Following the release of the latest U.S. National Climate Assessment report, a new climate forecast visualization widget has just gone live today.
The National Climate Change Viewer (NCCV) allows you to visualize how climate models forecast temperature and precipitation to change over the next 50 years or so. You can examine either individual model’s projections, or the average of all of the models’ projections.
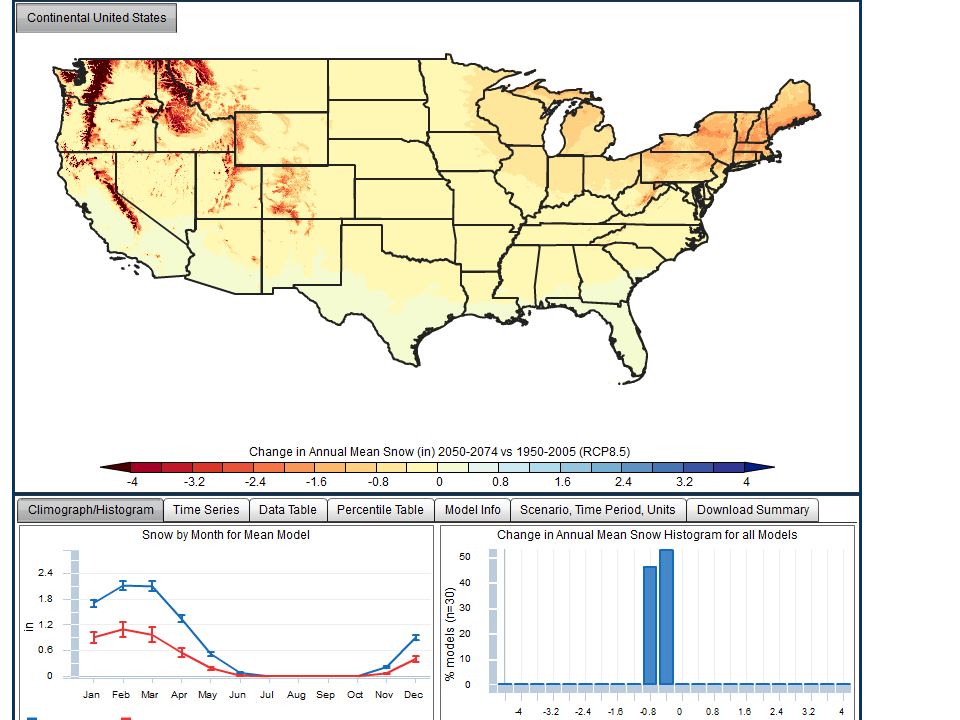
I just started playing with it, and the first thing that really that caught my eye was the dramatic decrease in total snowfall: a 50% decrease over the next 50 years, pretty much independent of calendar month. Here’s the graphic (click for larger versions of images):

Note the largest decreases are in the mountainous areas of the west (where they get a lot of snow anyway), as well as over the Great Lakes and Northeast. It would be helpful if they also provided an option to plot the percentage change…a decrease of 10 inches of seasonal snowfall is a bigger deal in Iowa than it is in the mountains.
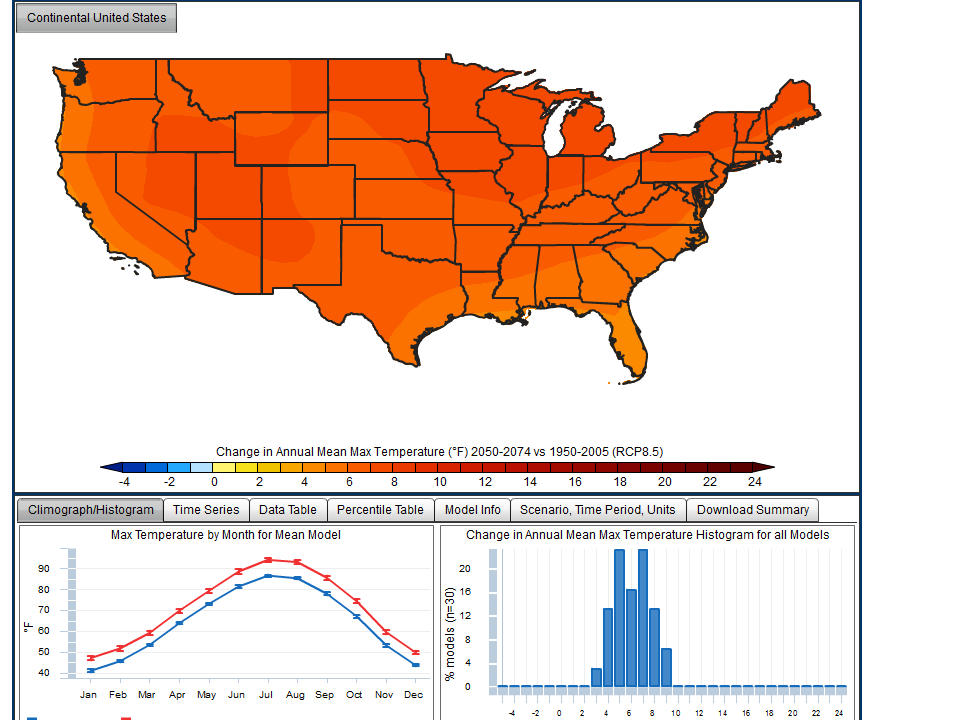
The forecast change in temperature just shows an almost uniformly red map (work on the color scales, guys) with the models forecasting generally 4 to 8 deg. F of warming for most of the U.S., in both daily maximum and minimum temperatures. Here’s the max temperature change graphic:

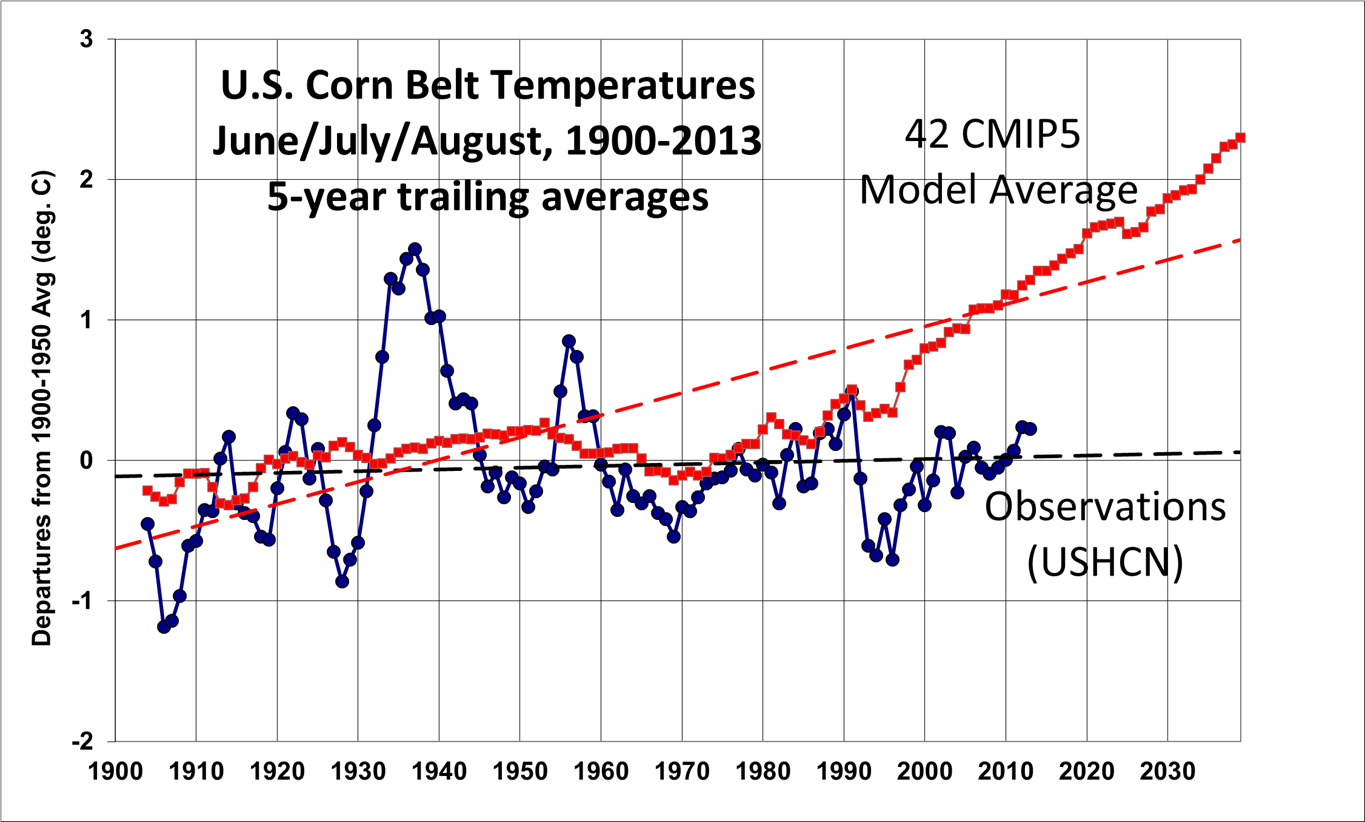
I’ve previously posted about the huge disconnect that is shaping up between the USHCN temperatures observed over the Midwest during the growing season and the climate model projections…eek!….

Setting aside the likely exaggerated forecast trends, the visualization tool, from the USGS and Oregon State University, is pretty cool, and is a useful public outreach tool for the science-savvy public. I’m sure they will improve it over time. Check it out.

 Home/Blog


The last year for which we have complete historical data is 2005…. about a decade ago…. There has had to be more recent information than 2005. However, sometimes that information, like snow cover, is ignored since it doesn’t match the model.