
 Home/Blog
Now that John Christy and I have had a little more time to digest the new paper by Carl Mears and Frank Wentz (“Sensitivity of satellite derived tropospheric temperature trends to the diurnal cycle adjustment”, paywalled here), our conclusion has remained mostly the same as originally stated in Anthony Watts’ post.
While the title of their article implies that their new diurnal drift adjustment to the satellite data has caused the large increase in the global warming trend, it is actually their inclusion of what the evidence will suggest is a spurious warming (calibration drift) in the NOAA-14 MSU instrument that leads to most (maybe 2/3) of the change. I will provide more details of why we believe that satellite is to blame, below.
Also, we provide new radiosonde validation results, supporting the UAH v6 data over the new RSS v4 data.
MT Comparison: RSS v4 versus UAH v6
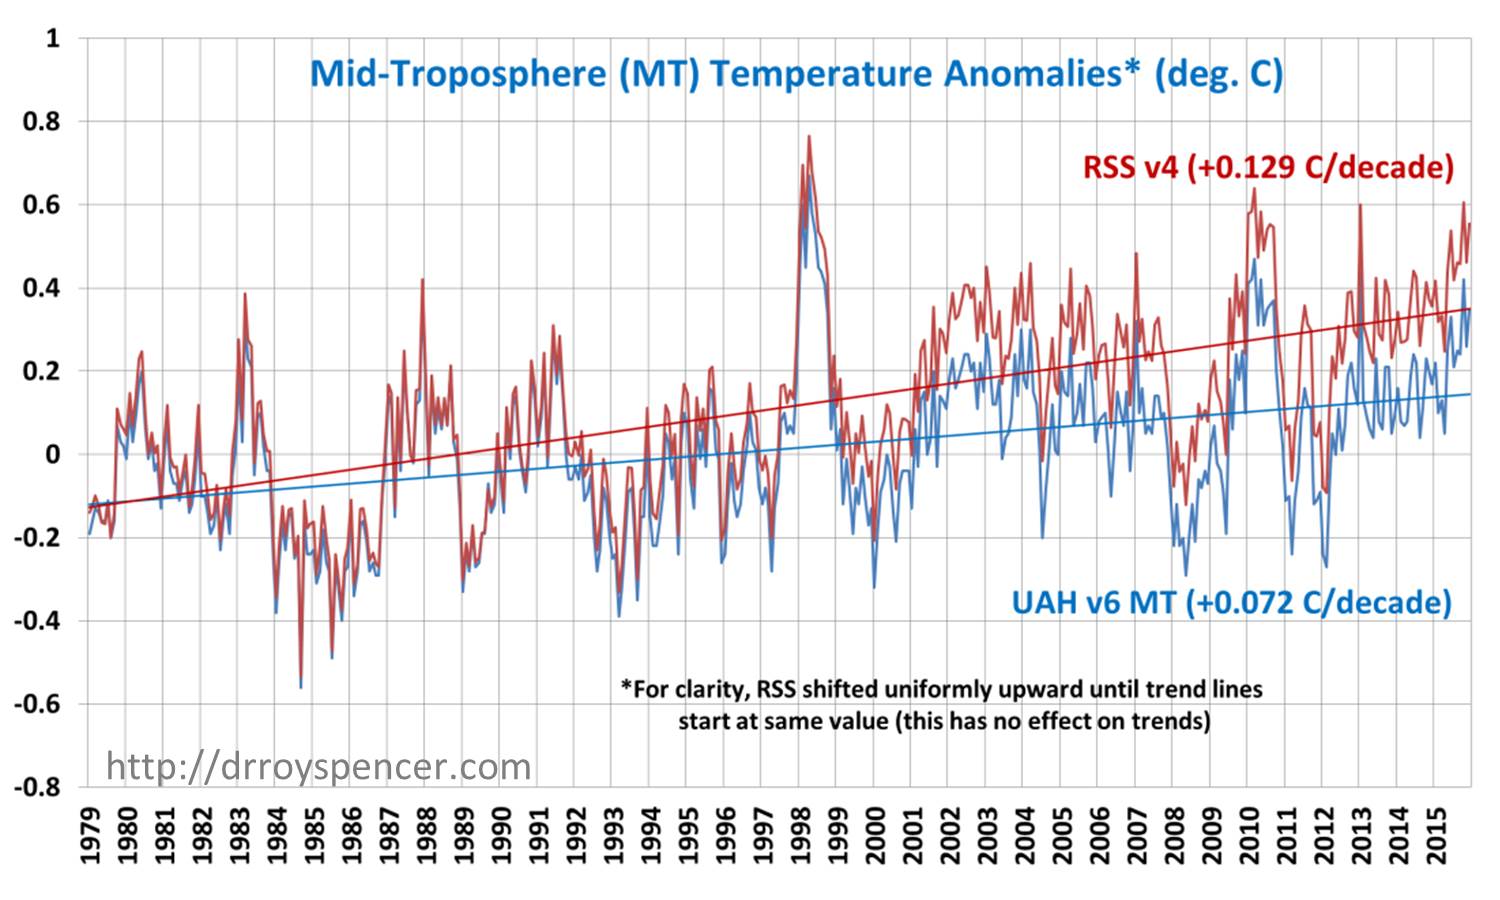
While Carl and Frank have yet to provide a new analysis of the most popular Lower Troposphere (LT) temperature product, their new analysis for the Mid-Troposphere (MT) has greatly increased their reported warming trend, which used to be very close to ours:
If we plot the difference between the two curves, we see more clearly where the discrepancies between the two datasets arise:
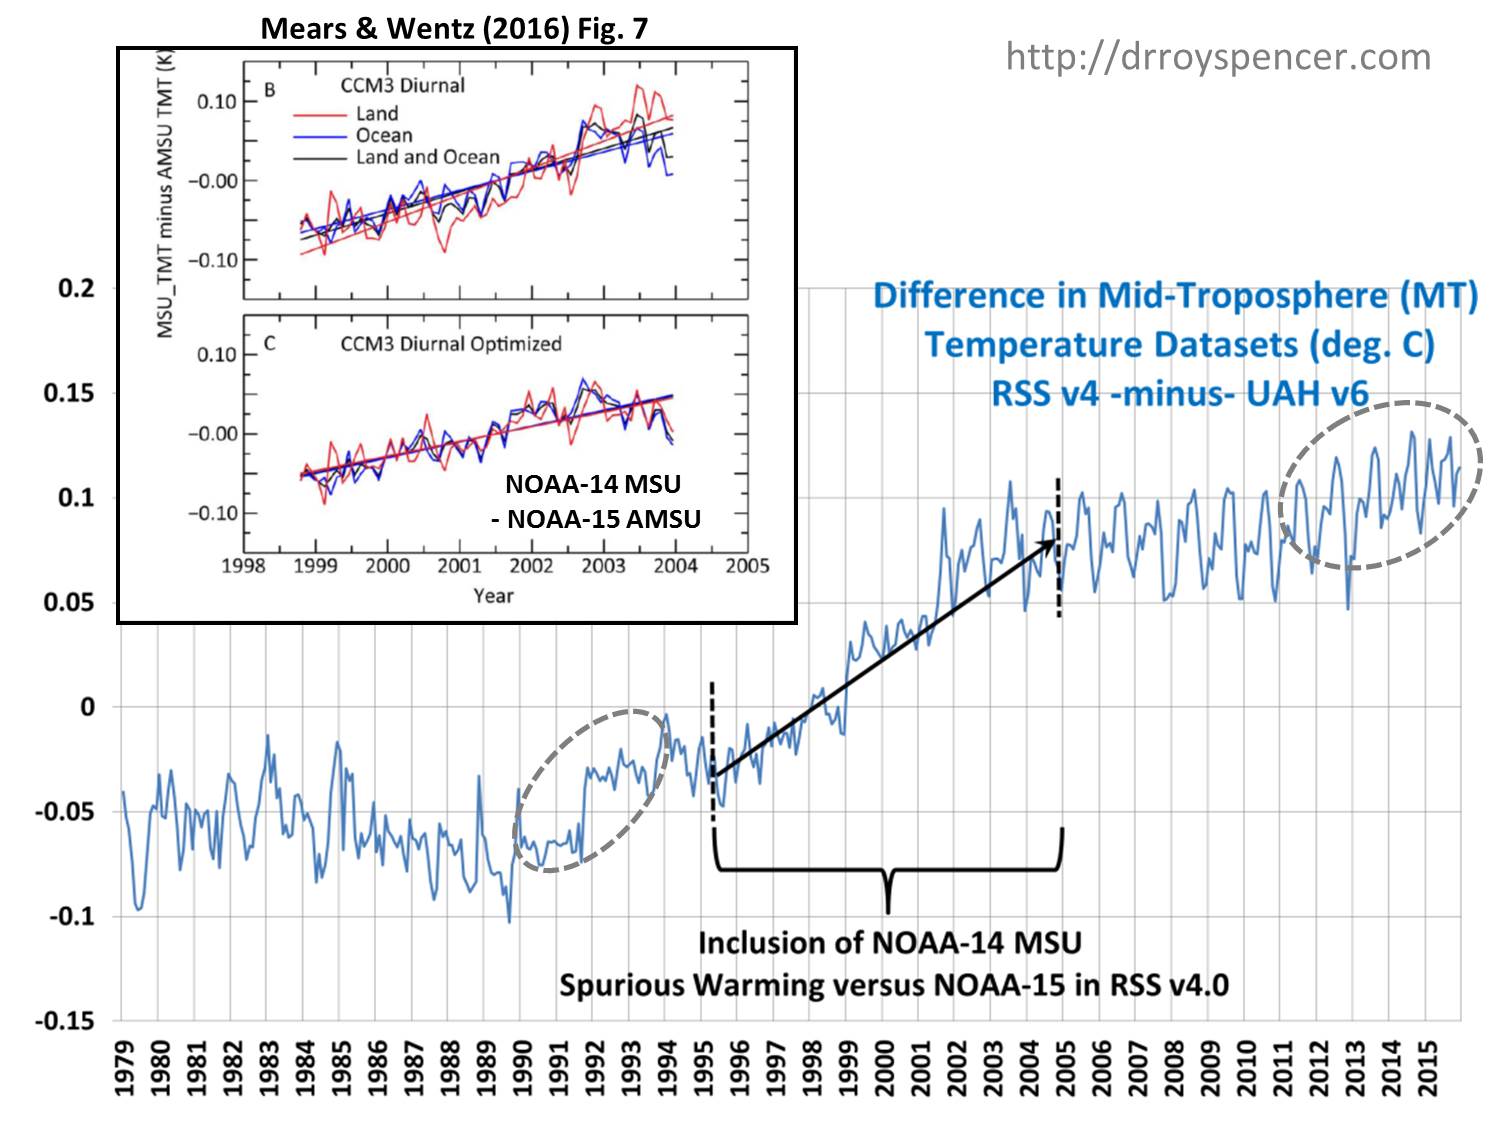
Here I have included their Fig. 7 as an inset to show that they know there is a substantial trend difference between the old NOAA-14 MSU and the newer NOAA-15 AMSU measurements. That trend difference amounts to +0.20 C/decade…a large discrepancy.
Importantly, Mears and Wentz choose to leave this calibration drift in without adjustment for it. In effect they are saying, ‘we don’t know which of the two satellites is at fault, so we will leave both satellites in without adjustment’.
Here are the reasons why we believe we can blame the calibration drift on the NOAA-14 MSU instrument, and why we remove that spurious warming from the NOAA-14 data in our v6 LT and MT products:
- the old MSU instruments’ calibration did not have near the sophistication of the newer AMSU instruments (NASA AMSU design engineer Jim Shiue once told me the AMSUs had “Cadillac”-quality calibration)
- the NOAA-14 satellite orbit was drifting far beyond any of the other dozen satellites in the record, leading to warming of the instrument itself (which is why we cut the record short after 6 yrs, RSS uses all 10 years), while the NOAA-15 satellite had very little orbital drift during its overlap with NOAA-14.
We find it curious (to say the least) that RSS would treat these two satellites as equally accurate.
About a third of the trend difference appears to be due to a change in the RSS method for diurnal drift adjustment, as indicated by the dashed ovals in the second plot, above. (Diurnal drift is the result of the satellite overpass time changing over the years, so that measurements are made at a different times of day; over land in particular this causes a drift in measured temperature due to the day-night cycle, not climate). Their new adjustment appears to provide a stronger correction for the diurnal cooling of the NOAA-11 satellite (first oval) and the NOAA-18 satellite (second oval). RSS uses the diurnal cycle from a climate model (CCM3), with empirical adjustments. We (UAH) use a pure empirical adjustment based of the the observed drift between NOAA-18 and NOAA-19 (for the “1:30” satellites) and NOAA-15 and Aqua (for the “7:30” satellites).
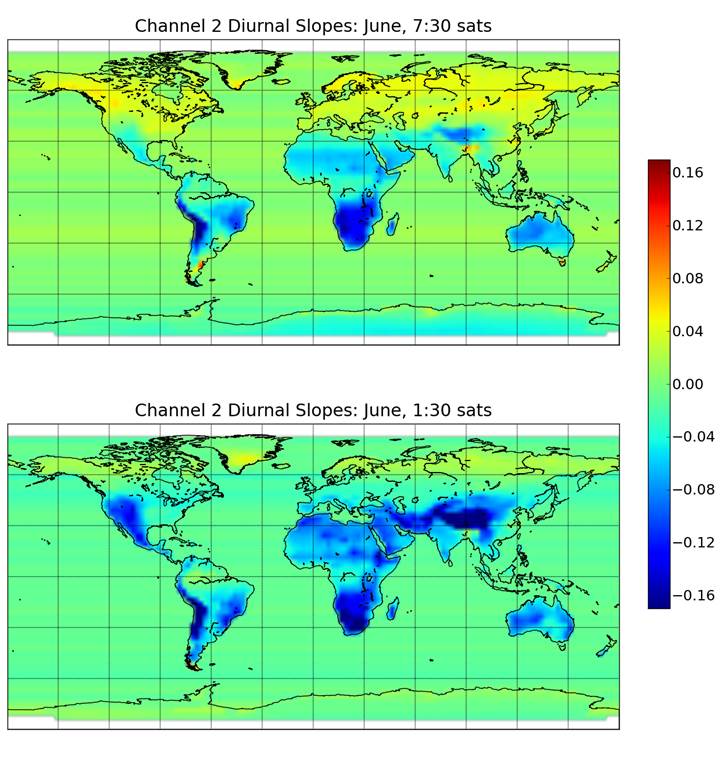
Details of our diurnal drift adjustments (now submitted for publication) were discussed here; for example, here are the diurnal drift coefficients (deg. C/hr) used during June:
Radiosonde and Reanalysis Comparisons
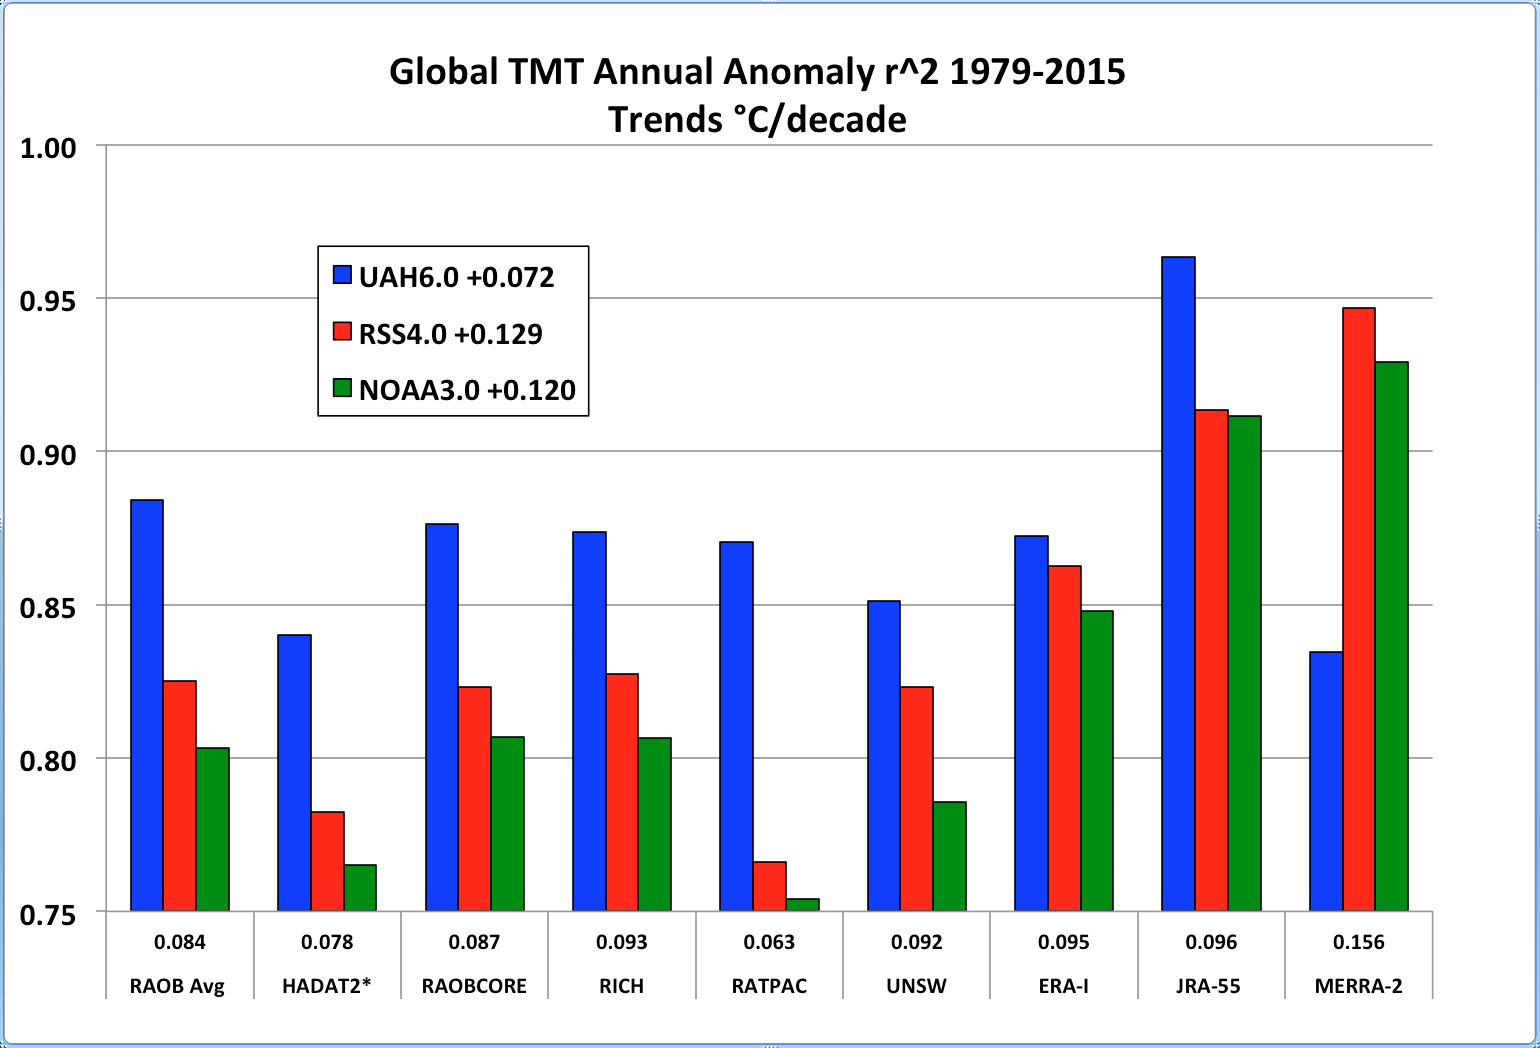
After Carl made the new RSS data available to us, John Christy computed the level of agreement (explained variance) that three satellite datasets (RSSv4, UAHv6, NOAAv3.0) have with the corresponding values from various radiosonde and reanalysis datasets. The results indicate that, with the exception of one reanalysis dataset (MERRA-2, which has by far the warmest trend), the UAH anomalies have better agreement with other data sources than does the RSS (or NOAA) dataset:
Regarding the NOAA-14 period in particular, John also computed the change in global average temperature between two 5 yr periods, 1990-94 versus 2003-2007, in both the radiosonde data (average of RICH, RAOBCORE, RATPAC, UNSW) and the satellite data. The results suggest that there is spurious warming in the RSS product over this time period:
2003-07 minus 1990-94 MT, Global
UAH_v6: +0.16 deg. C
RAOBav: +0.16 deg. C
RSS_v4: +0.28 deg. C
Conclusion
The evidence suggests that the new RSS v4 MT dataset has spurious warming due to a lack of correction for calibration drift in the NOAA-14 MSU instrument. Somewhat smaller increases in their warming trend are due to their use of a climate model for diurnal drift adjustment, compared to our use of an empirical approach that relies upon observed diurnal drift from the satellite data themselves. While the difference in diurnal drift correction methodolgy is a more legitimate point of contention, in the final analysis independent validation with radiosonde data and most reanalysis datasets suggest better agreement with the UAH product than the RSS product.
Update (4 March 12:35 p.m.)
Chip Knappenberger has pointed out that, while the warming in RSS v4 versus UAH v6 might be as described above, when RSS v4 is compared to RSS v3.3, the increase in warming might be mostly due to their new diurnal cycle adjustment. In other words, the NOAA-14 calibration issue was also in their v3.3, but maybe it was obscured more by diurnal drift adjustment issues.


