
 Home/Blog
I’ve previously posted a variety of articles (e.g. here and here) where I address the evidence that land surface temperature trends from existing homogenized datasets have some level of spurious warming due to urban heat island (UHI) effects. While it is widely believed that homogenization techniques remove UHI effects on trends, this is unlikely because UHI effects on trends are largely indistinguishable from global warming. Current homogenization techniques can remove abrupt changes in station data, but cannot correct for any sources of slowly-increasing spurious warming.
Anthony Watts has approached this problem for the U.S. temperature monitoring stations by physically visiting the sites and documenting the exposure of the thermometers to spurious heat sources (active and passive), and comparing trends from well-sited instruments to trends from poorly sited instruments. He found that stations with good siting characteristics showed, on average, cooler temperature trends than both the poorly-sited locations and the official “adjusted” temperature data from NOAA.
I’ve taken a different approach by using global datasets of population density and, more recently, analysis of high-resolution Landsat satellite based measurements of Global Human Settlements “Built-Up” areas. I have also started analyzing weather station data (mostly from airports) which have hourly time resolution, instead of the usual daily maximum and minimum temperature data (Tmax, Tmin) measurements that make up current global land temperature datasets. The hourly data stations are, unfortunately, fewer in number but have the advantage of better maintenance since they support aviation safety and allow examination of how UHI effects vary throughout the day and night.
In this two-part series, I’m going to look at the latest official global GHCN thermometer (Tmax, Tmin) dataset (Version 4) to see if there is evidence of spurious warming from increasing urbanization effects over time. In the latest GHCN dataset version Tmax and Tmin are no longer provided separately, only their average (Tavg) is available.
Based upon what I’ve seen so far, I’m convinced that there is spurious warming remaining in the GHCN-based temperature data. The only question is, how much? That will be addressed in Part II.
The issue is important (obviously) because if observed warming trends have been overstated, then any deductions about the sensitivity of the climate system to anthropogenic greenhouse gas emissions are also overstated. (Here I am not going to go into the possibility that some portion of recent warming is due to natural effects, that’s a very different discussion for another day).
What I am going to show is based upon the global stations in the GHCN monthly dataset (downloaded January, 2023) which had sufficient data to produce at least 45 years of July data during the 50 year period, 1973-2022. The start years of 1973 is chosen for two reasons: (1) it’s when the separate dataset with hourly time resolution I’m analyzing had a large increase in the number of digitized records (remember, weather recording used to be a manual process onto paper forms, which someone has to digitize), and (2) the global Landsat-based urbanization data starts in 1975, which is close enough to 1973.
Because the Landsat measurements of urbanization are very high resolution, one must decide what spatial resolution should be used to relate to potential UHI effects. I have (somewhat arbitrarily) chosen averaging grid sizes of 3×3 km, 9×9 km, 21×21 km, and 45 x 45 km. In the global dataset I am getting the best results with the 21 x 21 km averaging of the urbanization data, and all results here will be shown for that resolution.
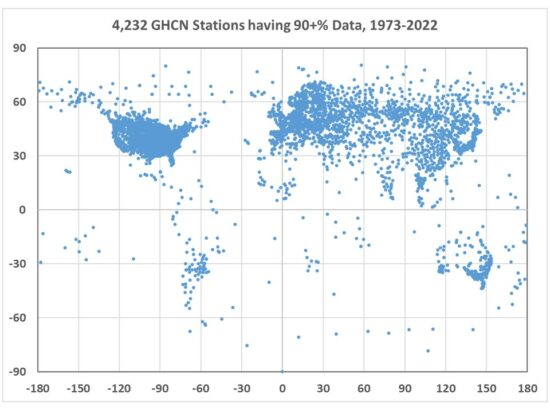
The resulting distribution of 4,232 stations (Fig. 1) shows that only a few countries have good coverage, especially the United States, Russia, Japan, and many European countries. Africa is poorly represented, as is most of South America.
I’ve analyzed the corresponding Landsat-based urban settlement diagnoses for all of these stations, which is shown in Fig. 2. That dataset covers a 40 year period, from 1975 to 2014. Here I’ve plotted the 40-year average level of urbanization versus the 40-year trend in urbanization.
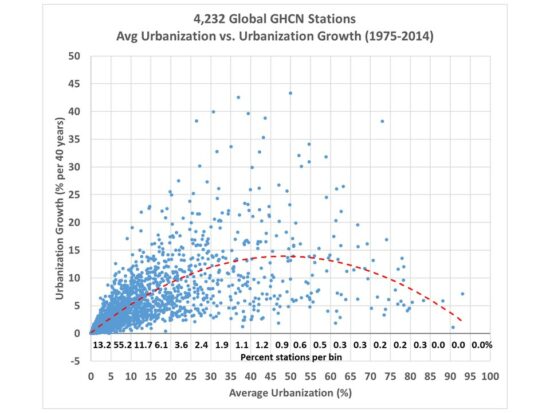
There are a few important and interesting things to note from Fig. 2.
- Few GHCN station locations are truly rural: 13.2% are less than 5% urbanized, while 68.4% are less than 10% urbanized.
- Virtually all station locations have experienced an increase in building, and none have decreased (which would require a net destruction of buildings, returning the land to its natural state).
- Greatest growth has been in areas not completely rural and not already heavily urbanized (see the curve fitted to the data). That is, very rural locations stay rural, and heavily urbanized locations have little room to grow anyway.
One might think that since the majority of stations are less than 10% urbanized that UHI effects should be negligible. But the seminal study by Oke (1973) showed that UHI warming is non-linear, with the most rapid warming occurring at the lowest population densities, with an eventual saturation of the warming at high population densities. I have previously showed evidence supporting this based upon updated global population density data that the greatest rate of spurious warming (comparing neighboring stations with differing populations) occurs at the lowest population densities. It remains to be seen whether this is also true of “built-up” measurements of human settlements (buildings rather than population density).
Average Urbanization or Urbanization Growth?
One interesting question is whether it is the trend in urbanization (growing amounts of infrastructure), or just the average urbanization that has the largest impact on temperature trends? Obviously, growth will have an impact. But what about towns and cities where there have been no increases in building, but still have had growth in energy use (which generates waste heat)? As people increasingly move from rural areas to cities, the population density can increase much faster than the number of buildings, as people live in smaller spaces and apartment and office buildings grow vertically without increasing their footprint on the landscape. There are also increases in wealth, automobile usage, economic productivity and consumption, air conditioning, etc., all of which can cause more waste heat production without an increase in population or urbanization.
In Part II I will examine how GHCN station temperature trends relate to station urbanization for a variety of countries, in both the raw (unadjusted) temperature data and in the homogenized (adjusted) data, and also look at how growth in urbanization compares to average urbanization.


Satellite data has challenges, but it still seems a lot less complicated. I’m unsure how any objective individual can call satellite data an outlier.
Objective individuals seldom if ever become troglodytes.
You aren’t logical. Propagandists never are objective.
It was a factual claim, Troglodyte.
Willard, please stop trying to troll.
Willard,
I can give you all kinds of evidence that propagandists aren’t objective. Please give me one piece of evidence that troglodytes aren’t objectvie.
I am sure you could provide evidence, Troglodyte.
It just so happens that you never do.
Willard, please stop trying to troll.
No, Wiltard, you made the claim.
After you, Troglodyte.
You made an unsupported claim first.
Willard, please stop trying to troll.
Willard,
A troglodyte’s example of objectivism…
https://www.cnbc.com/2023/01/17/losing-candidate-arrested-in-string-of-shootings-at-new-mexico-democrats-homes.html
Didn’t think so, Wiltard.
No U, dear Troglodyte.
Let me raise you, Tyson:
https://www.cnbc.com/2023/01/13/trump-deposition-in-e-jean-carroll-rape-defamation-case-ordered-unsealed.html
Willard, please stop trying to troll.
Willard…
https://tinyurl.com/y27r5972
A Philly man bragged about wanting to relieve himself in Pelosi’s office on Jan. 6. Now, hes headed to prison.
…
And in case there was any doubt as to what role he played in the attack, Rahm took a selfie of his pepper-sprayed face moments after exiting the Capitol building again.
“Do not believe the media,” he wrote in the caption he posted. “There were no anarchists. No antifa. Just patriots trying to take our country back. I was there.”
https://www.reuters.com/world/us/embattled-us-rep-santos-was-drag-queen-brazil-pageants-say-associates-2023-01-19/
SAO PAULO, Jan 18 (Reuters) – U.S. Representative George Santos competed as a drag queen in Brazilian beauty pageants 15 years ago, two acquaintances told Reuters on Wednesday, adding to contrasts that have drawn criticism of the openly gay Republican congressman’s staunchly conservative views.
…
Another person from Niteroi who knew the congressman but asked not to be named said he participated in drag queen beauty pageants and aspired to be Miss Gay Rio de Janeiro.
…
Rochard said the congressman was a “poor” drag queen in 2005, with a simple black dress, but in 2008 “he came back to Niteroi with a lot of money,” and a flamboyant pink dress to show for it. Santos competed in a drag beauty pageant that year but lost, Rochard said.
McGoofin,
Is it difficult for you to see him sitting in that NY seat casting those votes for McCarthy? All day long.
No, you rat fink. I have no problem with an elected official doing his duty.
This, though, turns my stomach. You’re apparently fine with it… all day long, huh! https://twitter.com/BillyCorben/status/1616092634958659588?s=20&t=d86s2_D1Y4cDSEMfOKWoPg
You’re getting visceral, McGoofin. Two more years at a minimum.
VISCERAL EVISCERATION was my youngest son’s high school fight song.
So yeah! I was visceral before visceral was cool!
Willard, please stop trying to troll.
Satellite data isn’t an outlier.
If you want to see some outliers take a look at how Bindidon manages to mangle data via gridding strategies in this comment section.
The main argument supporting gridding strategies is that collection sites represent a random sample. The gridding/kriging effort itself is in fact a strategic attempt to over representation of some areas over others as if there was the representation of a random sample within the grids themselves.
Nowhere will you find a study that studies that problem.
There is also the matter of control of the data. As Roy mentions here GHCN is providing less information to the public. Why?
But that doesn’t even touch on controls over the data to ensure its reliable.
A huge percentage of weather station info is provided by authoritarian/communist powers that everybody seems to be in agreement with is engaged in wholesale disinformation programs!
The global surface data collection efforts are a complete flop in just about everyway possible. Reliability of data, representation of data, and even how we process that data to allegedly turn non-representative data into global data.
Actually does global data even matter? Well some do especially about Antarctica where it seems data is getting sparser. How about central greenland? Oh but we need to know the most about sea ice so we are regaled constantly about the Arctic. An arctic melting that isn’t going to raise sea level even an inch.
Why should we worry about Russian and Chinese disinformation when we have our own system of disinformation?
outlier (n): a person or thing differing from all other members of a particular group or set.
Ok, spot the outlier.
https://tinyurl.com/2m4cgss8
And again.
https://tinyurl.com/8bwh9e4e
So, not ‘satellite data’.
The UAH 6.0 global temperature record is an outlier when compared to the other global temp records, because it differs most from the rest.
Well that was easy.
Apples and oranges Barry.
UAH measures the lower troposphere dude! They disagree with RSS but RSS has no confidence in their data and previously were colder than UAH.
You want to compare it to surface stations? A network of stations never designed to be random nor to measure temperatures in the natural environment. With a system of very bad control over data. Particularly over the vast majority of the database?
UAH has done better against better managed alternative datasets. Balloon and radiosonde. Perhaps even USCRN
Well you missed the point completely, Bill. It was about outliers, and you can’t get outliers from a sample of two. So, no, stephen comment wasn’t referring to the difference between UAH and RSS. It was referring to a collection of global temperature data sets. UAH is the outlier. That’s the point he was fuzzy about, and I set him straight. With pictures, no less. Looks like we’re going to need more illustrations if people can’t understand the points under discussion.
Now to YOUR points.
“UAH has done better against better managed alternative datasets.”
What sophistry in the word ‘managed.’ They are all estimates with strengths and weaknesses. All of them. They are all ‘managed’ – in that their measuring sticks weren’t designed to measure long-term climate, so they all make do.
“Balloon and radiosonde.”
Global coverage for balloon mounted radiosondes used in global temperature analysis is….
RATPAC = 87 stations
https://agupubs.onlinelibrary.wiley.com/doi/full/10.1029/2005JD006169
Why on Earth do ‘skeptics’ think radiosonde global temp is reliable, when it has a thousand times less coverage than the surface data has?
And the data sets are also heavily adjusted. Isn’t that a big no-no for ‘skeptics’?
How on Earth can ‘skeptics’ give any credence to radiosonde global temperature estimates? Perhaps there is some convenience for them in doing so….
… f they can overlook the fact that radiosondes also support RSS global temp data – depending on which radiosonde data set you compare with.
“Perhaps even USCRN”
USCRN is also a close match to USHCN. How about that?
Here are some uhi studies that indicate how sensitive weather stations are to urban encroachment.
Roughly 37% of the warming in the surface record may be due to this.
https://everythingclimate.com/the-us-surface-temperature-record-is-unreliable/
https://journals.ametsoc.org/view/journals/apme/58/6/jamc-d-19-0002.1.xml
What is essentially being recommended here is to keep temperature monitoring more than a 100 meters away from human structures. Unless they find some solution for this it spells the deathknell of surface weather monitoring and its going to be nigh impossible to fix this globally.
Anthony Watts’ study found that average temperature trends from well-sited stations matched the official US temp records.
USCRN matches USHCN.
While plenty of papers from at least the late 1980s have discussed the issues regarding microsite bias, many papers have also demonstrated that the adjustments made the US temp record are sound with respect to average temperatures.
Microsite biases affect minimum and maximum temperatures, but not average temperatures, as the effects seem to cancel out.
It’s a perennial argument from ‘skeptics’, unchanged since the early 2000s. They point to UHI at a weather station and claim that therefore the national or global temp records are wrong.
But when they actually do the work, time and again ‘skeptics’ corroborate the official records.
Watts did it. Jeff Condon did it. Murray Salby and Judith Curry did it.
But ‘skeptics’ seem to overlook these things and focus only on the microsite biases, which are well-discussed for decades, as if it is something new.
Well it’s good you’re catching up, Bill, but it seems you have a one-eyed view of that matter. I popped some links to peer-reviewed studies on microsite bias and the temperature records in a post to you here:
https://www.drroyspencer.com/2023/01/urbanization-effects-on-ghcn-temperature-trends-part-i-the-urbanization-characteristics-of-the-ghcn-stations/#comment-1434918
Happy reading.
https://www.drroyspencer.com/2023/01/urbanization-effects-on-ghcn-temperature-trends-part-i-the-urbanization-characteristics-of-the-ghcn-stations/#comment-1435055
I’m not an expert, but would the atmospheric window allow radiation from the ground to be detected by satellites, and by looking at the peak wavelength determine the temperature of the surface?
If so, I assume it would be easy to cover the Earth’s overall temperature without the need for ground based stations.
Agreed: I’ve compared the trend lines of the UAH data for USA49 to the USCRN data for the period from 2005 to the present. The trend lines are so close that I had to expand the graph to separate the two trend lines. This would appear to be an appropriate comparison, but it would be desirable to compare other geographic areas. Have any other nations created networks that match the USCRN for station quality? It would be beneficial to expand the comparison, but even this does provide confidence that the Dr. Spencer program is very accurate
What do you get when you compare US surface trends from 1979 with the US trend per UAH for the same period?
There’s a section discussing uncertainty in satellite data here.
https://www.realclimate.org/index.php/archives/2023/01/2022-updates-to-the-temperature-records/
The problem we face is that if the UHI effect is not properly accounted for (and this is what is being examined in Dr. Spencer’s two part series here) then all of temperature series based on surface station data are problematic with the exception of USCRN program, which unfortunately, is quite short.
Our basic problem is that had Hansen and others started properly, they would have first done a thorough examination of the quality of the surface stations that comprised both the USHCN and the GHCN and quickly determined that they were not adequate for the task. Hansen and others started with inadequate sources for the accurate data necessary to construct an viable program and the climate community has been wrestling with this problem ever since.
My wife and I personally have inspected 30 of the USHCN stations and found only 2 that were in compliance. To conduct good science it is absolutely necessary to start from a sound database. Hopefully Dr. Spencer’s new program can rectify the UHI issue, but we will probably still be guessing until the USCRN program has matured and precise networks like it can be established worldwide. Until we accomplish that, the UAH record appears to be the best available.
Don can I clarify. Did you physically check the stations for Compliance or just look at the data sets.
“Our basic problem is that had Hansen and others started properly, they would have first done a thorough examination of the quality of the surface stations that comprised both the USHCN and the GHCN and quickly determined that they were not adequate for the task.”
As the current GHCN monthly comprises tens of thousands of stations, who was going to foot the bill for the international travel to scores of countries including accommodation, for the decades it would take to check every location?
C’mon. That’s just preposterous. Even Anthony Watts with a horde of followers still hasn’t checked every station in the US network since they started in 2007.
Barry
Cmon. Thats just preposterous. Even Anthony Watts with a horde of followers still hasnt checked every station in the US network since they started in 2007.
—————-
Exactly!
Exactly what? Every global temperature monitoring group, including the satellite records, has to make do with systems that weren’t designed for climate monitoring.
It seems like you’ve just discovered issues with the data that have been known and investigated for decades. This has all been taken into account. Multiple tests of different type has confirmed the robustness of the global temperature records, particularly the surface records.
You and Don are essentially arguing that unless every single weather station n the world is hand-checked by the global temp compilers, then the temp records are spurious.
Spencer and Christy haven’t personally examined the instruments launched on consecutive satellites to create the lower troposphere temp records, and these instruments have known issues, and the satellites carrying them drift in their altitude and orbit.
Like the surface data sets, the MSU/AMSU records are assembled by adjusting for known and theorised biases.
The fact that the measuring systems are imperfect is old news.
What you need to catch up on is the research done to account and correct for this.
Barry is really up to snuff in the latest propaganda of his daddy:
”Spencer and Christy havent personally examined the instruments launched on consecutive satellites to create the lower troposphere temp records, and these instruments have known issues, and the satellites carrying them drift in their altitude and orbit.”
Roy Spencer’s job descriptions:
is a meteorologist, a principal research scientist at the University of Alabama in Huntsville, and the U.S. Science Team leader for the Advanced Microwave Scanning Radiometer (AMSR-E) on NASA’s Aqua satellite. He has served as senior scientist for climate studies at NASA’s Marshall Space Flight Center.
Since 1992 Dr. Spencer has been the U.S. Team Leader for the Multichannel Imaging Microwave Radiometer (MIMR) team and the follow-on AMSR-E team. In 1994 he became the AMSR-E Science Team leader. Gee only 30 years of experience as the team leader for the instruments themselves. Since this is actually information accessible on the website Barry posts from it has to be at least a tie for the world record in cluelessness. Can anybody find any one else more clueless? this is a classic!
UAH is less than 10 miles from Marshall Space Flight Center
Well Bill, let me show you something that you and your skeptic buddies don’t know how to do.
I was wrong. Spencer and Christy have examined (some/most/all?) of the instruments flying on satellites.
Now, how did they manage to document satellite drift, and how did they correct for it?
You can bet it wasn’t from taking photographs of decaying orbits or visiting the satellites in person.
The point remains. All the measuring systems have flaws, and the corrections are imperfect, too. As Spencer and Christy will tell you.
Barry if you want to know how they did it you should read their paper.
We can track satellite altitude to one centimeter of resolution. so drift which is orbit decay is well understood. No visit required.
The effect of it on temperature readings is complex but they worked it out with the help of Carl Mears of RSS and other scientists.
Basically what it entails sorting out the signal from other changes like diurnal variation.
Roy’s observation that they are very close to CRN is helpful. And as I noted it doesn’t matter if they are close to USCHN. I would expect raw quality controlled and otherwise unprocessed data from a network run and/or documented by the civil service and dedicated volunteers is going to be pretty reliable. But we have seen repeatedly over time with raw quality controlled and unprocessed data from the US network a lower rate of warming than elsewhere. And of course processed data seems to always result in more warming. I wonder why the thermometers themselves are not more reliable truth tellers.
Bill, if it was a perfect measuring system then we wouldn’t have 3 different satellite temperature datasets with different results.
And in the case of global temps from satellites, the satellite records have had the larger adjustments over time, and the different institutes have datasets that are more different from each other than the surface datasets.
Thus, RSS has a trend difference to UAH that is larger than the trend difference of the surface datasets for the same period.
Of al the adjustments to datasets, UAH has had the largest changes of all – when they corrected their data in 2005.
They’ve reworked the data dozens of times.
Why do you think we have different versions?
Here is the difference between UAHv6 and the previous version.
https://www.woodfortrees.org/plot/uah5/mean:12/plot/uah5/trend/plot/uah6/to:2017.51/mean:12/offset:0.1/plot/uah6/to:2017.51/trend/offset:0.1
And how does that compare with RSS?
https://www.woodfortrees.org/plot/uah5/mean:12/plot/uah5/trend/plot/uah6/to:2017.51/mean:12/offset:0.1/plot/uah6/to:2017.51/trend/offset:0.1/plot/rss/to:2017.51/mean:12/offset:-0.05/plot/rss/to:2017.51/trend/offset:-0.05
The issue here is pretty simple. Skeptics are ideologically aligned with Spencer and Christy, and their dataset produces the lowest trend of all the datasets.
Therefore skeptics automatically ascribe superior qualities to them and to their work.
It’s not based on a thorough understanding of the strengths and weaknesses of the various datasets and methods. It’s simple bias.
I favour none of the datasets, as they are all estimates with strengths and weaknesses.
But let Roy tell it himself:
“All data adjustments required to correct for these changes involve decisions regarding methodology, and different methodologies will lead to somewhat different results. This is the unavoidable situation when dealing with less than perfect data…”
“We can track satellite altitude to one centimeter of resolution. so drift which is orbit decay is well understood. No visit required.
That is NOT how UAH apply correction for orbital decay and diurnal drift. This is done by proxy, not direct measurement. Diurnal drift is calculated by comparing changes in brightness temperature between different satellites, and then worked backward from there.
“As the 1:30 satellites drift to later local observation times (an indirect result of orbit decay), the MSU2 (AMSU5) Tb tend to cool, especially over land in certain seasons, due to the day-night cycle in temperature. As the 7:30 satellites drift to earlier observation times, the Tb tend to warm for the same reason…
These diurnal drift effects are empirically quantified at the gridpoint level by comparing NOAA-15 (a drifting 7:30 satellite) to Aqua (a non-drifting satellite), and by comparing NOAA-19 against NOAA-18 during 2009-2014, when NOAA-18 was drifting rapidly and NOAA-19 had no net drift. The resulting estimates of change in Tb as a function of local observation time are quite noisy at the gridpoint level, and so require some form of spatial smoothing. Since they also depend upon terrain altitude and the dryness of the region (deserts have stronger diurnal cycles in temperature than do rain forests), a regression is performed within each 2.5 deg. latitude band between the gridpoint diurnal drift coefficients and terrain altitude as well as average rainfall (1981-2010) for that calendar month, then that relationship is applied back onto the gridpoint average rainfall and terrain elevation within the latitude band. Over ocean, where diurnal drift effects are small, the gridpoint drift coefficients are replaced with the corresponding ocean zonal band averages of those gridpoint drift coefficients.”
https://www.drroyspencer.com/2015/04/version-6-0-of-the-uah-temperature-dataset-released-new-lt-trend-0-11-cdecade/
But do I really need to tell you that UAH and the other datasets are estimates?
All that may be true Barry but this discussion is about the UHI element in surface datasets. There is no controversy it is there. Once you have teased out all the biases using Oke 1973 then you will have a correction for those databases. Then you can talk about what matches up and does not match up.
there is no controversy about what Roy is doing except perhaps why nobody else may have done it.
Yeah, they released RSS ver. 4 in 2017, jumping on the bandwagon.
So, there are two satellite data sets. One since 2017 agrees with the surface. So, UAH is the outlier. Got it!
RSS includes known warming satellites. UAH does not.
There are at least 3 satellite datasets. NOAA STAR is less well-known.
“RSS includes known warming satellites. UAH does not.”
Why do you promulgate this lie after admitting it’s not true?
RSS and UAH use exactly the same satellites, including NOAA14 and NOAA15.
UAH is objective. RSS is a subjective bandwagoner.
UAH is objective?
Oh please. Spencer and Christy have taken activist positions against global warming, in congressional hearings and in signing political declarations. They are as biased as anyone else.
Could ‘skeptics’ actually be skeptical once in a while?
Thats not true! Excellent scientists like Roy, John, and others have been called to testify. They stood up and gave their learned opinion. They didn’t say there was no warming from CO2 emissions. In fact, if I am correct they said there almost certainly was.
Taking an activist position is what most of the scientists favored for quotes by mainstream yellow journalism take.
As Dr Judith Curry said sometime ago. That went something akin to that eventually science will need to start paying more attention to observations than models.
Even Nate supported that notion lately saying if you aren’t publishing observations you are a fraudster. I agree. But I think Nate may have slipped off his scripts there.
Excellent scientists like Gavin Schmidt and Jim Hansen also “have been called to testify. They stood up and gave their learned opinion.” It seems you think that this means they must be objective. Interesting!
But you missed the bit where I said that Roy has signed politically active declarations on climate. Roy was on the board of the Cornwall Alliance, which declares that the Earth is created by God to be admirably suited to the needs of humanity, and that traditional energy systems are indispensable. Roy also signed the declaration saying this.
Declaration:
https://web.archive.org/web/20150529004812/http://www.cornwallalliance.org/docs/the-cornwall-declaration-on-environmental-stewardship.pdf
Roy’s signature:
https://web.archive.org/web/20130708011458/https://cornwallalliance.org/blog/item/prominent-signers-of-an-evangelical-declaration-on-global-warming/
Now, I’m not saying that Roy is any more biased than anyone else. I’m saying be a proper skeptic and acknowledge that everyone is to some degree, and that Roy’s view on AGW is clearly guided by religious principles, rather than purely objective science.
‘Skeptics’ because least skeptical when they fanboy their favoured people. Your defence of UAH is empty assertion. All the skeptics like UAH because it gives them what they want, not because of any understanding of its scientific validity.
Because once you investigate this stuff properly you realize that there is much less controversy than the blogs and the media would like to whip you into, and everyone is doing the best they can with what they’ve got to work with. Even the evangelicals.
barry says:
”Excellent scientists like Gavin Schmidt and Jim Hansen also have been called to testify. They stood up and gave their learned opinion. It seems you think that this means they must be objective. Interesting!
————————–
Perhaps.
I listened to at least some of John and Roy’s testimony, perhaps not everytime they have stood up before Congress.
I have not ever heard what Gavin and Jim might have said in front of Congress. So I have no opinion on that front.
As one might expect giving such testimony you can state facts in the area of experience like the results of signals coming back from a satellite. Thats science. Thats objective.
Scientists in testimony can say they are concerned or not concerned. Those are subjective statements and as are all opinions and should be labeled clearly as such.
One should conclude that if scientists are standing up and saying different things and giving different opinions the science isn’t settled.
But a smart policy maker realizes the subjective opinion is from a person who is not representative of the population who will certainly have other priorities.
Thats why I make such a big deal about inculcation which by definition is a learned opinion. Its entirely subjective.
Why am I having to tell you this?
I don’t know why you need to say anything, but when you speak bunkum I sometimes point it out.
Spencer and Christy were chosen by the Republican party to speak at congress because their views were aligned with those of the Republican party – which was that there’s no need to reduce fossil fuels.
And the democrats call in scientists aligned with the democrat party as well. Why do you have your panties in a bunch about that?
Panties, Bill?
You’ve lost the thread of the conversation.
But as you now seem to be agreeing that Spencer and Christy are as biased as anyone else, it doesn’t matter.
Barry the point is who gets called in by which party doesn’t show which scientist has the bias.
I assume you aren’t that naive. All scientists in the weather and climate field are effectively in the climate ‘business’. Politics might matter the most to some but that is not my experience. Independence and all that implies is important. But more important is to listen carefully as to what they are promoting. Are there incentives they could be seeking? Are they rent seeking.
Thats why the websites with the least amount of integrity claim incentives that they have no idea if they materially exist or not. They do that when they are concerned about empirical measures of bias. They struggle to thrown something on the other side of the scale. The money has be coming clandestinely from some corporation because they sure aren’t motivated to say what they are saying as a civil servant.
A dollar/promotional/empire building opportunity is a quality that can be roughly measured empirically.
Don Healy
Your comments (January 14, 2023 at 9:19 AM; 1:11 PM)
You claim
– to have compared the trend lines of the UAH data for USA49 to the USCRN data for the period from 2005 to the present
and
– to have inspected 30 of the USHCN stations and found only 2 that were in compliance.
*
1. First of all: how many USCRN stations did you use for your comparison to UAH49, and how did you generate the USCRN data?
Last year I downloaded all USCRN hourly data from the very begin till June 2021, and generated absolute and anomaly data:
– ungridded, direct averaging of station anomalies into months;
– gridded, i.e. with first averaging anomalies into 2.5 degree grid cells (a grid like UAH’s).
Here is the CRN/UAH anomaly comparison I obtain for Jan 2005-Jun 2021, with 133 of 137 stations processed wrt the mean of 2016-2020:
– ungridded
https://drive.google.com/file/d/1ClQPD8L83XT_WiKwnvuP9Fsn4PVs2wS-/view
– gridded
https://drive.google.com/file/d/1WSU4vRg-QyOeBGSWCfDYSCUN77AIh3K3/view
Even the ungridded data doesn’t clearly match UAH49.
*
2. Which USHCN stations did you compare to which USCRN stations?
*
3. Here is a comparison of the original USCRN data of 133 stations to their respective data in GHCN daily, in order to ensure that the latter sufficiently match the former:
https://drive.google.com/file/d/1ZE-y65iuHTD051x0WCGomObDS4KE8mL_/view
*
4. Now we compare the 133 GHCN daily data of the USCRN stations to all available 920 GHCN daily stations located in the 1 degree vicinity of the 133, by the ways ensuring that we won’t compare station subsets having nothing in common:
https://drive.google.com/file/d/1MZvuVnJeKQ5R41AXDZKNzg4d50BCnkYu/view
Of these 920 stations however, 92 are located within airports.
A last comparison shows how these remaining 828 GHCN daily stations behave compared to the 133 GHCN daily CRN stations:
https://drive.google.com/file/d/1DAU5AKRJZgTuk5ODMMlOwsmkQREbvPo2/view
*
Maybe you show us your data?
Binny,
The Earth has cooled over the last four and a half billion years or so, hasn’t it?
Presumably, you have a graph which reflects this inconvenient fact.
Would you mind providing it?
You could just have two points, if you want to simplify things. An estimate global surface temperature high enough to reflect the molten surface, and an estimated present global temperature, lower than your first point.
If you want more points, it will create great difficulties. You do not possess the ability to calculate the shape of the cooling curve, as it involves things like the exponential decay of radiogenic heat, plus the different effect of the radiative intensity associated with the fourth power of the absolute surface temperature, the core, the mantle, and the relevant heat transfer properties, to say nothing of the chaotic and not yet understood mechanisms of tectonic motion and so forth.
I don’t believe you have the ability to calculate these things, which means you cannot give any reasons at all why current surface temperatures are not precisely what they should be.
Delusional SkyDragon cultists just deny reality, and attempt to abuse anyone who doesn’t fall for their evangelism. Feel free to present some facts, if you disagree with my opinions.
Only joking – I know you can’t.
” The Earth has cooled over the last four and a half billion years or so, hasnt it? ”
Haaah, the dumb Flynnson stalker is blathering again.
Lacking as usual anything relevant to say, he urges is saying something irrelevant.
Carry on, Flynnson, carry on.
Binny,
Don’t like fact?
I don’t blame you. You would have to face the fact that the Earth cooled – in spite of GHGs, GHE, SkyDragon chanting – or anything else!
By the way, although your English is quite good for a sauerkraut, saying “he urges is saying something irrelevant.” makes you look either sloppy or illiterate.
Maybe you could give your view on the role of the GHE in the observed cooling of the Earth since its creation? Feel free to deny the surface was ever molten, if that would suit you.
You might expose yourself to a little bit of disagreement, but I would hope that you would be willing to defend your position.
The comparison of the USCRN record to the recent UAH data involved going to the site:
https://www.ncei.noaa.gov/access/monitoring/national-temperature-index/
and selecting Average temperature anomaly, 1-Month,and all months in the fields and hitting plot, then copying the data in the USCRN column after converting to Centigrade and entering the data into an excel spread sheet.
The data from Dr. Spencer’s UAH site in the column “USA49″ for the same period was selected and entered into the the next line on the Excel Spread Sheet. The graphing functions were used to compare the two and a linear trend line was chosen for both data sets. The data for both was monthly average temperatures. It is recognized that the two programs take measurements from different areas, but the fact that the two trend lines matched so closely appeared to indicate that the satellite record was validated by the USCRN’s surface record over the period covered.
You appear to question our experience in checking the 30 sites on the USHCN under Anthony Watts” Surface Station Project for which he gave us honorable mention in his initial publication.
Let me give you one example, that might explain our deep reservations: We checked the station at Port Angeles, Washington. The GPS coordinates showed the MMTS unit on the Court House lawn. We found the unit and quickly checked its siting relative to NOAA standards. It was a bit too close to the building and adjacent to a concrete walkway. A bit out of compliance but not too bad. After concluding our survey I went inside and asked if it was possible to talk with the individual responsible for the unit and I was referred to Jimmy in the Engineering Department. Jimmy took me upstairs to his office and explained that they had had problems with people vandalizing the unit. He pointed out his office window to a light pole across the street to show me a unit that he had purchased from Oregon Scientific to replace the damaged MMTS unit and had mounted 30 feet or so up the utility pole, not far from a street light. This was the type of unit that one might buy for home use; not one compliant with NOAA standards. Additionally, per NOAA standards the units are supposed to 100 feet from the nearest paved surface, 5 to 6 feet above ground level, 4 times the height of any obstructions away for the obstruction and on terrain typical of the general area. The utility pole was set over pavement from an intersection with streets on two sides, with the other sides composed of a paved motel parking lot.
I have no idea as to what the correct adjustments should be to this station, and I doubt NOAA does either. In fact, from other misplaced sites we found I doubt that NOAA was even aware that the instrumentation and placement had been changed.
This was one of the worst sites we surveyed, but there were quite a few runner-ups and one even more poorly sited.
The really bad news to me is that while only 11% of the sites in Watt’s earlier survey meet standards, Watt’s most recent re-survey of the old USHCN sites which have now been incorporated into the ClimDiv Network (I believe this is correct) have deteriorated even further.
I find it incomprehensible that with flaws of this nature that we can trust the information from this older network or any databases using this information. The satellite record and the USCRN data appear to be the only valid data bases available.
Don Healy
Thanks for the convenient reply.
1. I’m happy to discover that NOAA’s USCRN shows a trend even lower than what I evaluated out of their own sources:
https://www.ncei.noaa.gov/pub/data/uscrn/products/hourly02/
because some people on this blog endlessly discredit NOAA.
And that NOAA’s USCRN is even perfectly on par with UAH’s usa49 time series is amazing because I myself am so often discredited when posting charts comparing NOAA and UAH in a similar way!
{ The differences between NOAA’s and my evaluation
https://drive.google.com/file/d/1ClQPD8L83XT_WiKwnvuP9Fsn4PVs2wS-/view
are mainly due to a completely different generation of anomalies: while NOAA use their well-known Pairwise Homogenisation Algorithm, which is based on step-wise alignment of station anomalies, I generate them completely stand-alone and reject all stations lacking sufficient data in the selected reference period. }
*
2. However, your lecture on this endlessly chewed discussion of poorly placed weather stations was of little help, as it is limited to extremely few places.
This reminds me of those WUWT lectures by a certain Dave Burton, who endlessly conjured up the slogan ‘No sea level rise’, but only on the basis of very few tide gauges (about 15 out of 1500) but was never able to back up his claims with an overall analysis.
So it doesn’t surprise me that you don’t say a word about my results, as if you had no interest in producing anything other than your own view.
Did you even understand that the graphic
https://drive.google.com/file/d/1DAU5AKRJZgTuk5ODMMlOwsmkQREbvPo2/view
is in fact pointing out how little your purely local UHI investigations have to do with reality?
Because if
– the trend from data out of 828 weather stations randomly selected in the immediate vicinity of the 133 very best weather stations in the US, corresponds exactly to
– the trend from the latters’ probably most reliable data:
where exactly is your UHI problem, please?
*
3. Let me please finally come back to Watts’ claims about badly sited temperature measurement stations.
In 2012, NOAA posted somewhere the following list of 71 USHCN stations
https://drive.google.com/file/d/1ipzDRdJppZDM6ii4qj9h1AKFrC3t0h94/view
considered ‘well-sited’ by Watts’ collaborators at his ‘surfacestations.org’.
Here is the result of a comparison, made some years ago, of the data from these 71 ‘well-sited’ stations to ALL available GHCN daily stations having sufficient data for building anomalies wrt the 1981-2010 period:
https://drive.google.com/file/d/1pbQCHFwTTy1HIns9pDNj6mDQ85Vau7NC/view
The running means show that the average of over 8,000 randomly selected stations of mostly poor quality has even a lower trend than thw ‘well-sited’ set!
Sorry, Sir: this is simply laughable.
Bindidon, did you inform Don that you always attack and abuse people that bring science and reality here?
” … people that bring science and reality here? ”
Dou you mean yourself, troll Clint R?
And this your nonsense, Clint R?
https://www.drroyspencer.com/2023/01/uah-global-temperature-update-2022-was-the-7th-warmest-of-44-year-satellite-record/#comment-1430721
Did you ask Don Healy whether he denies scientific results like the lunar spin, or Einstein’s time dilation, or the evolution, like you do, Clint R?
Yes Bin, that’s exactly what I’m talking about — you “always attack and abuse people that bring science and reality here”.
Bindidon I don’t understand what you are getting at.
Paragraph 2: Why is this graph comparing non-airport stations to ghcn stations?
Paragraph 3: What does Watts Surface Station project poorly sited stations have to do with UHI? Watts was only looking to see if the screens were currently placed in accordance with established standards. You can’t measure UHI like that. thinking you can; well I agree that would be laughable but what does that have to do with Roy?
“What does Watts Surface Station project poorly sited stations have to do with UHI?”
A lot. They were trying to show that micro site influences bias the record, and UHI has always been Anthony Watt’s top-ranked bias.
But Bindidon was graphing Watts’ best sited stations, not the poorly sited ones.
Barry, stations that don’t meet NOAA standards are just plain not reliable when one is concerning oneself with less than a degree warming.
Why would a station with poor controls be a bellweather for anything?
It’s like you’re having a conversation with someone else. Nothing you said just then bore on what I said.
Barry I am not in here defending anything.
IMO, Anthony Watts an experienced meteorologist understands the sensitivities of measuring climate. His opinion was carried out in his results that bad stations have different temperature readings than good stations.
His efforts sparked interest in the topic. While Anthony’s amateur volunteer effort identified a huge number of violations of NOAA standards completely justifying his concern; follow up research is showing that NOAA standards themselves are inadequate.
https://journals.ametsoc.org/view/journals/apme/58/6/jamc-d-19-0002.1.xml
“follow up research is showing that NOAA standards themselves are inadequate.”
Is the following link meant to demonstrate this assertion? Because it doesn’t.
Surfacestations.org produced nothing new. Microsite biases were already known about and discussed from decades before.
https://sci-hub.se/10.1175/1520-0477(1993)074%3C1007:anporg%3E2.0.co;2
This paper (1993), like others following, notes that UHI is amplified at night – minima are more impacted than maxima.
UHI with respect to climate records has been discussed even earlier.
https://tinyurl.com/25ykphwn (1988) for example
Fall et al 2011 is Anthony Watts only peer-reviewed, published work on microsite bias in US weather stations.
They found what others had found before them. Minima are biased warm by UHI, and maxima are biased cold, at sites with urban encroachment. They also found that this didn’t affect the averages, as the effects tended to cancel out.
A thesis and conclusion already reached by the people whose job it is to put the temperature records together.
http://www-personal.umich.edu/~eoswald/Menne2009_USHCN_V2.pdf
https://agupubs.onlinelibrary.wiley.com/doi/full/10.1029/2009JD013094
Fall et al added a little detail, but the work didn’t give any new information that would influence how the US temp record is assessed.
Sure, Watts should be commended for doing some work. He had to be dragged kicking and screaming to accept that Time of Observation bias is a necessary adjustment, and one that they needed to do in Fall et al to get non-spurious results. When faced with serious science instead of blogging, Watt’s cries of foul were suddenly muted, and while they amplified the results that were already known – maxima and minima were biased at poorly sited stations – they buried near the bottom of the paper the finding that the best sited stations matched the official record when it came to average temperatures.
https://agupubs.onlinelibrary.wiley.com/doi/full/10.1029/2010JD015146#jgrd16904-bib-0031
Barry says:
”He had to be dragged kicking and screaming to accept that Time of Observation bias is a necessary adjustment, and one that they needed to do in Fall et al to get non-spurious results.”
Not sure why that is. Doesn’t CO2 warm every hour of the day?
Why can’t skeptics tell expensive jokes?
I am understanding a need for a station observer to select the same time every day and if you change your time of observation its apt to have an effect, especially during the day. Nighttime though is pretty much quick surface cooling followed by warming and cooling throughout the night with indeed the coldest occurring before first light. So per documentation they adjust everything to midnight. Heck there is zero sun from early night to like 4am at least if not later. Add to that an anomaly is going to x degrees at virtually any time of the day with just the uncertainty of clouds, humidity, or winds changing the temperature.
So an auditor then is called to audit the adjustments and when adjustments are being carried out really for no reason thats a red flag. Perhaps you have some documentation supporting the reasoning?
Bindidon,
GHCN daily for the US is ‘raw’ data, right? That’s problematic.
Adjusting for ToB raises the US trend quite a bit.
So the raw data can’t safely be used to compare against Watts’ 71.
The relatively cooler trend could potentially a result of ToB, rather than any soundness about the raw data.
Looks like you goofed in the gridded to ungridded comparisons under #1 Your crn anomaly increased significantly.
Ungridded difference to UAH appears ~.045/decade
gridded difference to UAH appears ~.136/decade
Something appears wrong there. Needs explanations.
As I see it with a less than climate length sampling range and the biggest deviations between the records coming from ENSO events.
And since La Nina comes early and El Nino coming late in the record that deviation is going to be exaggerated by both phases of ENSO when measuring a trend.
Thus ENSO needs to be detrended to remove that weather influence. Or alternatively you need a longer sampling period to detrend it naturally into a climate record.
Thus I am sure UAH49 is going to close the gap with USCRN as time goes on. You should be able to easily see that problem by trending shorter periods say 2015 to 2021. Do that one and CRN is going to be cooling a good deal faster than UAH.
Roy already knows how close he is to CRN has he has some ENSO smoothing algorithms.
Dr Spencer wrote –
“In the latest GHCN dataset version Tmax and Tmin are no longer provided separately, only their average (Tavg) is available.”
This seems bizarre. The only time for providing only averages is when you want to hide data, or if you dont know what you are doing. For example, the average of 50 C and 0 C is 25 C. So is 30 C and 20 C.
Dressing for the second average, but being exposed to the first, can and has killed, under wartime conditions.
One possible reason might be to obscure the effect that Dr Spencer surmises might be occurring, which would be more noticeable as an increase in the minimum temperature. Averaging would have the effect of raising the average temperature, but hiding the fact that maxima have not increased (the human heat contribution being minor in comparison with daytime sunlight).
A nifty parlour trick, if the intention is to mislead people into believing the claims of the SkyDragon cultists.
It doesn’t matter. As Feynman said “Nature cannot be fooled.” Fools keep trying, though.
It remains extremely cold in Siberia. There was just recorded -62.4 C in Tongulakh, new all-time low at this station. Moreover, it is the coldest temperature in Siberia since 2002.
https://i.ibb.co/bBrmDRJ/325838369-857299378716565-6928693938482106968-n.jpg
Yes: -62.4 C, that’s really very cold.
GHCN daily’s coldest temperature record for Russia is
1920 1 6 -66.9 C
in Markovo:
RSM00025551 64.6831 170.4167 25.0 MARKOVO
https://www.google.com/maps/place/64%C2%B040'59.2%22N+170%C2%B025'00.1%22E/@64.6831,170.4167,2992m/data=!3m1!1e3!4m5!3m4!1s0x0:0x89125b1470729933!8m2!3d64.6831!4d170.4167?hl=en
It might interesting to look at January data as well as those from July. Simple observation gives me to believe that even slightly urbanized or industrialized areas are much warmer in winter than surrounding countryside, especially overnight in high latitudes. Possibly it is enough to affect monthly average temperatures.
This is exactly what Roy Spencer did a few months ago:
https://www.drroyspencer.com/2022/11/de-urbanization-of-surface-temperatures-with-the-landsat-based-built-up-dataset/
Are you sure, Bindidon? I went back and re-read the article that you linked, and as I remembered, it seemed to concentrate on August data for the Northern Hemisphere. A gppd piece. But while I grant that Winter and August in the Southern Hemisphere is probably of interest, I’m after looking at winter in the U.S. Perhaps you were thinking of another post? I do forget things, and I certainly miss some, so I’d be interested in seeing/re-reading anything of that nature from any authorative source.
I don’t do this sort of analysis myself, anymore (if ever), but it seems that the hype and focus is popularly on the high temperature end, when according to the theory night time lows should also be shifting upwards. Might not urban heat island effects also give a strong signal in the winter?
Dr Roy Spencer.
“The issue is important (obviously) because if observed warming trends have been overstated, then any deductions about the sensitivity of the climate system to anthropogenic greenhouse gas emissions are also overstated.”
It’s also important to keep the issue in perspective. Focusing on land surface temperatures misses over 90% of the warming of the planet from anthropogenic sources.
As you well know, about 93% of the heat imbalance is going into the oceans. Another 3% is going into melting ice, and only 2-3% into raising surface temperatures.
So, yes it is important that we have the best possible surface temperature dataset. But in context it is a small component of the climate system sensitivity calculation.
TM,
You wrote –
“As you well know, about 93% of the heat imbalance is going into the oceans.”
Nonsense, unless you choose to believe in Trenberth’s “missing heat”, – which can’t be found. The oceans don’t freeze because the rock below them is hot. At 10 km depth, the crust is around 200 C, and this is what 10 km deep ocean is sitting in.
Sunlight warms the top water only, which stubbornly floats on the colder water beneath.
Saying “as you well know” is just a silly SkyDragon cultist attempt to present fiction as fact.
There is no “climate sensitivity”. Climate is the statistics of historical weather observations.
“The oceans dont freeze because the rock below them is hot. At 10 km depth, the crust is around 200 C, and this is what 10 km deep ocean is sitting in. ”
Thank you. Best laugh I’ve had all weekend.
EM,
Laugh at facts all you like. Reality doesn’t care if you laugh at it. Nor do I.
There is nothing wrong with you laughing for no particular reason, if it makes you happy.
You might have an additional laugh at the fact that Antarctic ice caps are warmer under several kilometers of ice.
According to the European Space Agency –
“However, although the surface of the ice sheet is cold, the temperature increases with depth primarily because of the basal geothermal heating from beneath Earths crust. In places, it is warm enough to melt the ice, which accounts for the presence of lakes and a vast hydrological network at the bedrock.”
I assume you think that the ice stores heat from sunlight, just as I assume you think that oceans “store” heat from the sun!
Other SkyDragons seem to believe similar nonsense, but they seem to be a sour lot. At least you can laugh at yourself.
Keep it up.
Swenson
The oceans dont freeze because the rock below them is hot. At 10 km depth, the crust is around 200 C, and this is what 10 km deep ocean is sitting in.
You have just declared that a submarine at the bottom of the Marianas Trench would measure an external water temperature of 200C instead of the actual 4C.
Of course it’s funny. It’s the daftest thing you’e said in a long time.
EM,
Don’t look more stupid than you really are.
You wrote –
“You have just declared that a submarine at the bottom of the Marianas Trench would measure an external water temperature of 200C instead of the actual 4C.” Of course I didn’t, you ninny.
That’s why you can’t quote me, but try to convince others that the contents of your bizarre fantasy are to be preferred to fact. Others might call it lying, but it is more gently referred to as SkyDragon cultist delusion.
A thermometer at the bottom of the Marianas Trench immersed in water will read whatever it reads – maybe a little less than 4 C, actually. I’m not sure why you think that the thermal profile of the crust is similar to that of the ocean, but if you do, you are quite mad.
Unlike the ocean, the temperature of the crust rises with depth – Wikipedia states around 25 – 30 C per Km, but I try to be conservative.
Keep laughing at the facts – it still won’t make them go away. “Nature can’t be fooled” – Feynman.
TM, your cult was content with land measurements until they started being debunked. Now you want to move into the ocean.
Where will you go next?
for other countries?! Please could you include The Netherlands? For example, at one of the big five stations, Eelde (an airport), without discussing this with the kNMI, there have been paced lots of solar panels up to tens of meters
Roy Spencer
” In the latest GHCN dataset version Tmax and Tmin are no longer provided separately, only their average (Tavg) is available. ”
Indeed, V4 lacks this separation, unlike V3.
The only way to keep it is to use GHCN daily:
https://www.ncei.noaa.gov/pub/data/ghcn/daily/
and to average the daily data into months.
It’s a lot of additional work but has the advantage to offer raw data.
The temperature near the surface largely depends on the degree of sunlight and the type of surface, since the Earth’s troposphere is very thin.
https://i.ibb.co/gb0jSr5/zt-nh.gif
A simple question: why is all the warming near the surface concentrated only in the Northern Hemisphere? Czy może dlatego, że najwięcej CO2 jest teraz na płkuli płnocnej?
https://i.ibb.co/4TQrTvK/gfs-world-wt2-t2anom-d1.png
https://earth.nullschool.net/#2023/01/15/0300Z/chem/surface/level/overlay=co2sc/patterson
Sorry.
Or is it because the most CO2 is now in the northern hemisphere?
Nie kłopocz się! Polski alfabet wygląda wspaniale.
If you check UAH you will note that the ocean warming rate is 0.13C/decade and the land rate is 0.18C/decade.
Since the majority of land is in the Northern Hemisphere this would naturally lead to a higher warming rate in the Northern Hemisphere.
EM,
As Dr Spencer is investigating, hotter thermometers are due to increased heat.
Delusional SkyDragon cultists claim that a magical new source of heat due to CO2 being present in the atmosphere suddenly appeared, no doubt due to sinful humans.
Apparently, the GHE did not exist for four and a half billion years or so, and so the Earth cooled.
But now, the cult of the SkyDragon and its “coal trains of death”, promotes the coming incineration of mankind – unless sufficient donations and obedience to the SkyDragon cult leaders are forthcoming.
Pardon me while I snigger.
Entropic was talking about UAH temperatures. No thermometers.
The map showing the locations of the GHCN stations, really shows that it’s not at all “Global”, simply Northern hemisphere with a smattering of stations further south.
It’s not even Northern Hemispheric, but only some parts of the land parts. You can’t even talk about ‘national average temperature’ if you don’t have a thermometer every 10 meters to account for microsite influences.
:eyeroll:
They test for how much coverage they need. The result is that a subset of a hundred stations provides similar results to a subset of a different hundred stations, which are both similar to the whole data set.
The focus on surface air temperatures still seems odd to me, at least from a physics viewpoint. Air is such wispy stuff, with a (volumetric) heat capacity a few orders of magnitude lower than solids or liquids, such as land or water. Using a small number of temperatures to characterize an entire day seems even more problematic; a minimum or maximum temperature might have only existed for a minute or two (e.g., clouds rolling by). And how is average temperature related to thermal energy storage? Is it a linear relationship? (I think it is when delta-T is the driver of thermal energy storage, but I don’t know if the relationship is linear when delta-T is the consequence of thermal energy storage.)
It seems like the quantity of interest is total thermal energy storage, and the rate of change of total thermal energy storage over time. If I were challenged to measure this, I think I would look for natural reservoirs of thermal energy, like deeper bodies of water (larger lakes and oceans). Water temperatures at various depths would be measured to estimate the total heat storage per unit volume. The UHI error would disappear completely, since the planet-wide total thermal energy storage estimate would be summing energy directly. (I.e., a body of water in an urban area may be heating faster, but that’s real actual thermal energy and should be added in to the total, although it’s contribution will generally be negligible.)
Yes, there are possible sources of ‘error’ to worry about, such as evaporation, but perhaps evaporation would be more easily characterized and corrected (using temperature, humidity, wind speed). I suppose dealing with surface ice might be a bigger challenge.
I’ve read that measuring ocean water temperature, where most of the thermal energy storage resides, is challenging because very small fractions of a degree must be measured accurately and repeatably over long periods of time. This brings to mind an analogy of measuring the position and speed of a slow-moving dog, and deciding to instrument the dog’s tail with an accelerometer because the signals are much larger and thus can be measured more accurately. Does your intuition tell you that is going to give you a more accurate estimate of the parameter of interest? (I was tempted to use the “Streetlight Effect” as an analogy, but it’s not quite that bad.)
Say – what did happen to all the “missing heat” getting so much attention in the past? It looks like they still haven’t for sure found it, it’s still all theorizing:
https://www.antarcticajournal.com/the-missing-heat-global-warming-hits-plateau/
The warmists, of course, still claim the missing heat is still there, and will come roaring back to life eventually – another one of their beloved “tipping points” that are supposed to prod us into action despite the lack of evidence of a problem.
I’m with Tyson McGuffin. 93% of the extra energy retained in the climate system as we warm goes into the ocean.
Was it Richard Lindzen or Roger Pielke who suggested that the most reliable measure of global warming is ocean heat content?into
https://climate.nasa.gov/vital-signs/ocean-warming/
Or you could use sea level.
https://sealevel.colorado.edu/
EM,
If you want to believe delusional SkyDragons who claim that they can measure “global sea levels” to within about the thickness of a human hair, go right ahead.
You might choose to believe “The effect is that currently some land surfaces are rising and some ocean bottoms are falling relative to the center of the Earth (the center of the reference frame of the satellite altimeter).”, if you wish.
You might even believe that somebody knows how the ocean bottoms are falling, and how they know it. Maybe they use very long pieces of string, with a weight attached? Graduated to 0.1 mm, of course.
Only joking, of course. Nobody has the faintest idea of what the 70% of the surface covered by ocean is doing. Estimates of the volume of magma involved in sea floor spreading vary – nobody really knows.
The SkyDragon cultists at Colorado apparently don’t want to acknowledge that in some places, land surfaces are falling, but hey, why use facts, if fiction will suffice?
Carry on believing.
Your problem Ent is that the only way to heat the oceans is with solar. Infrared from CO2 won’t do it.
It’s the Sun, stupid.
Infrared from CO2 creates a warm surface film which makes it harder for heat to flow from the ocean to the atmosphere. Less heat flow, warmer ocean.
Exaggerating for clarity, if the ocean below the surface is at 9C and the atmosphere is 10C, a surface film at 11C reverses the temperature gradient the surface film and the water below.
Perhaps you should learn more before making false statements about what is impossible.
Even a small effect can be significant
Again, the near surface ocean temperature is 10C and the atmosphere is at 9C. The temperature gradient is 1C.
Now warm the surface film with IR to 9.1C The temperature gradient between the surface film and the water below has dropped from 1C to 0.9C and heat flow has dropped by 10%.
Sorry Ent, you’re STILL trying to boil water with ice cubes.
EM,
You are an idiot. The Sun heats water in the phototropic zone, obviously. The hotter water rises to the surface. At night, the hotter surface radiates its heat (mainly directly to outer space) and cools, in line with the laws of thermodynamics. It is displaced by now less dense water below it.
Net result, all deep water eventually consists of the densest water in the column. Depending on geothermal heating from below, and salinity, bottom Temperatures average close to 4 C.
Even NOAA reluctantly agrees – “Therefore, the deep ocean (below about 200 meters depth) is cold, with an average temperature of only 4C (39F). Cold water is also more dense, and as a result heavier, than warm water. Colder water sinks below the warm water at the surface, which contributes to the coldness of the deep ocean.”
They haven’t managed to accept the fact that the crust is quite warm, in absolute terms, yet.
Keep pushing your delusional fantasy. There is no GHE, and the Earth has cooled from the molten state over the past four and a half billion years or so.
Make up some fresh nonsense – maybe the ocean “stores” heat? You dimwit, without an external heat source, the oceans would cool – all the way to absolute zero! The Earth is a big ball of mostly glowing rock. Get used to it.
EM,
Listen peabrain, you wrote –
“The temperature gradient between the surface film and the water below has dropped from 1C to 0.9C and heat flow has dropped by 10%.”
And the temperature still drops, doesn’t it?
No increase in temperature. Energy is still being lost. It’s called cooling, and in spite of delusional SkyDragon cultists claiming that slow cooling results in raised temperatures, the four and a half billion years or so of the planet’s history demonstrate otherwise.
You really have no clue about this, do you?
There is no heat “trapping”, “multiplication”, or “accumulation”. That is why nobody has ever managed to provide experimental support for such fantasies! You can’t even describe this “GHE”, can you?
Dimwit.
I need my coffee. In my 6.03 post the ocean should have been at 10C and the atmosphere at 9C.
Nobody is paying attention to you anyway.
Yes, ignoring science while espousing denialist pseudoscience is the norm here. Your continuing support for Ed Berry’s nonsense puts you clearly into the same class as ClintR, Gordon Robertson and Swenson.
Ent, “denying science” is you claiming that passenger jets fly backwards.
ClintR
Thank you for another example of denialist incomprehension. You are unable to understand that in some reference frames airliners can fly backwards.
Ent, in the “reference frame” known as “reality”, passenger jets do NOT fly backwards.
You’re such a braindead cult idiot you actually believe you can pervert reality.
Fortunately, reality always prevails.
EM,
You wrote –
“You are unable to understand that in some reference frames airliners can fly backwards.”
This is your description of the GHE, is it?
Only joking, you can’t even describe the non-existent GHE, can you?
No wonder you want to talk about anything but something non-existent like the GHE!
Go on, tell me how thermometers are made hotter by greenhouse gases! How hard can it be?
Funny how you keep bringing up Dr. Berry. It was fun watching you try to debate him. You were so outmatched, and you still don’t understand.
It was Roger Pielke Snr that insisted ocean heat content was the best way to measure global warming, which the ‘skeptics’ lapped up then, but for some reason have become disinterested today.
Although Anthony Watts pointed out lower quality stations having greater warming trend than higher quality stations, there is the matter that USCRN is warming as much as USHCN is.
DLK,
Generally, hotter thermometers are a result of higher temperatures in the vicinity.
Hopefully, readings of the same thermometers should agree with each other.
Are you saying anything different?
Flynnson
Do you have the least idea of how dumb your reply to Mr Klipstein is?
As usual, the dumb Flynnson stalker is blathering again.
Lacking as usual anything relevant to say, he urges is saying something irrelevant.
Carry on, Flynnson, carry on.
Binny,
You wrote –
“Do you have the least idea of how dumb your reply to Mr Klipstein is?”
No, and I’m certain you can’t even explain why you made such a witless statement, can you?
I suppose you are stupid enough to claim that thermometer respond to greenhouse gases by becoming hotter!
If so, you are nothing but an idiotic SkyDragon cultist.
“Hopefully, readings of the same thermometers should agree with each other.”
It seems the point of Roy’s article went right over your head. Donald is right. The full USHCN gives the same result as the pristine USCRN, suggesting that the issue of UHI is not an issue – at least since 2005.
Lots of urbanization has been done in Europe lately:
https://twitter.com/US_Stormwatch/status/1609829457292066818
Vlad’s fanboys might not like this.
Have you seen any interviews of Europeans and what they think of their midwinter heat wave?
I’m a European. Some of my garden plants thought it was Spring and started new growth. Now the buds are being killed by today’s frost.
Am I supposed to be pleased?
You’re from Wales. That’s like a sloth claiming it’s a bear.
English, now living in Northern Ireland.
The American equivalent would be Seattle or Vancouver.
Well sounds better than straight freezing weather to me.
Have you seen ren lately, Gill?
Willard, please stop trying to troll.
This is very interesting analysis with a methodology and approach that is objective. As a young physicist I worked at the NPL the UK metrology centre of excellence. No scientist there would ever allow detrimental influence on what they measure to exist if they could remove it – not so the UK Metoffice.
I have reviewed a number of UK terrestrial weather stations that were flagged by the British Metoffice as recording a new record high temperature in July last year of 40.3 C at Coningsby ( they omitted to mention it is RAF Coningsby ) 53deg 05’38″N 0deg 10’22″W. while this site would arguably be in the less urbanised and certainly lower growth of urbanisation in Dr Spencer’s analysis any credible scientific person reviewing the site would see it is deeply flawed to bias in recording a false HIGH temperature. The weather station is surrounded by asphalt and concrete and also appears to have concrete walkways to the instruments. With asphalt reaching 20 to 25 deg C above ambient (as confirmed by reports of asphalt going soft on nearby roads) the station was clearly unfit to record a UK record high.
The British Metoffice fails in its responsibility for honest metrology. I believe the Metoffice is now a campaigning organisation which misleads policy in the UK given it is a government body. I am a petroleum engineer but even I know we have to transition our energy supply but we need to manage this propoerly. The Metoffice is not fit for purpose nor are its weather stations, a majority read false highs from my desk top review and in my opinion.
Good efforts Dr Spencer a voice of scientific reason in a sea of arguably fraudulent data.
Are we talking about the same RAF Coningsby?
Last time I checked, the weather station was at the southeastern edge of the airfield, 1000m South of the 07/25 main runway with all the built-up areas North of the runway. The airfield between North and West near the station is grass and WW2 vintage dispersals. The other three quadrants are open fields.
The previous record was at Cambridge Botanic Gardens which is quite urban ( I grew up there). I was not surprised to see a record from a town in the warmest area of the UK. I was surprised to see an effectively rural station like RAF Coningsby produce such a big jump.
I don’t know where you get the delusion that RAF airfields are warm. I’ve been on many of them down the years. Apart from the odd runway they are enormous open expanses of grass with no shelter and a chill wind blasting across them.
It would seem you are unable to locate the automatic weather station at Coningsby….. go to the Metoffice website and you will find a list of all the locations of weather stations they list Coningsby as (53.094, -0.171 Automatic
Copley England ). I posted the coordinates as well. If you put that in to google earth you will find it comes close to the weather station and what I have stated is accurate and factual. The Coningsby weather station is surrounded in very close proximity to asphalt and concrete pads. It is substandard due to its proximity to surfaces that will take a +23 deg C temp over ambient on a sunny day. The very point and topic if this article by Dr Spencer.
Sorry to hear you grew up in a garden I am sure your rhodent friends miss your sharp wit and analytical mind.
David Ramsay
” … any credible scientific person reviewing the site would see it is deeply flawed to bias in recording a false HIGH temperature. ”
” … in a sea of arguably fraudulent data. ”
*
As usual, cheap polemic instead of a scientific proof for this allegedly ‘fraudulent data’ !
You are yourself not even able to show us any valuable critique of Metoffice’s station siting.
Here is one example:
https://link.springer.com/content/pdf/10.1007/s10546-017-0263-0.pdf
Binny,
You wrote –
” . . . instead of a scientific proof . . . “.
Proof is for mathematics, sauerkraut.
You are so delusional that you cannot even describe this alleged GHE, which after cooling the planet for four and a half billion years or so, miraculously decided to heat it up!
Maybe you could launch into some “cheap polemic”, or some incomprehensible pseudo-English nonsense like “he urges is saying something irrelevant.”
Off you go now, try and describe the “GHE”.
Don’t blame me if all you get is sniggers or laughter, rather than applause.
Haaah, the dumb Flynnson stalker is blathering again.
Since, as usual, he has nothing relevant to say, he pushes to say something irrelevant.
Carry on, Flynnson, carry on.
Bindidon,
Please stop trying to troll.
Flynnson
Unlike me, you could never stop ‘trying to’ troll.
The only thing you can do, Flynnson, is stop trolling.
How about jumping in at the deep end and just doing it?
Bindidon,
Please stop trying to troll.
Flynnson
Unlike me, you could never stop ‘trying to’ troll.
The only thing you can do, Flynnson, is stop trolling.
How about jumping in at the deep end and just stop your endless trolling replies?
Bindidon, please stop trying to troll.
Au contraire
I posted the coordinates and it is clear to anyone prepared to open their eyes that the weather station in question is surrounded by asphalt and concrete. Indeed the proximity of these surfaces is too close for the accepted standards in weather stations. My posting the coordinates that clearly demonstrate a substandard weather station is quite correct. A site visit is nit. Required to see this. Try opening your eyes the coordinates from the met office are 53.094, -0.171 Automatic
Copley England. When you have gone to google earth and viewed the station and measured distances then respond as to why my statement is wrong. I am an educated and practiced scientist I provided a valid opinion validated with coordinates to demonstrate and prove what I say. It is pertinent to the topic Dr Spencer is posting. When you have made the effort to look at the weatherstation on google earth do come back with comments.
David Ramsay,
If the instrument enclosure is where I think it is, the instruments may be subject to jet exhaust wash – more noticeable if the military aircraft happen to fairly close when taxiing, depending on wind conditions at the time.
Even more concerning, from the name “Automatic Copley”, the MetOffice may be using fast response digital thermometers, and not averaging the readings as per WMO standards.
In any case, it’s all fairly irrelevant, just a matter of curiosity with no particular use. A hangover from 18th and 19th century passion with recording, temperature, humidity, wind speed etc. – because they could!
The aircraft have no use for the MetOffice temperatures, and instead depend on a multitude of temperature measuring devices fitted to the aircraft for various purposes.
Oh well, SkyDragon cultists seem infatuated with “surface” temperatures for some reason, completely ignoring the fact that actual surface (soil) temperatures are quite different to screened “air” temperatures, and that 70% of the planet is covered by water, and of the remaining 30%, much is mountainous, or having completely different characteristics to even 50 years ago.
All completely pointless – an exercise in futility, trying to support a mythical greenhouse effect, which even its most ardent supporters cannot describe.
Oh well, to each his own, I suppose.
It is possible jet wash picked up the heat of the asphalt and concrete lifting thermometer temp readings.
The weather station is on the North Wrst of the field beside the tower.
Several people have suggested the station is elsewhere however the Metoffice has the coordinates which shows it up as I describe.
I align with Dr Spencer and Prof Christie of UAH regarding the temperature readings by satellite. The methodology captures a massive volume on a frequent basis and I have greater belief in its representation over flawed terrestrial data points that go through a model to extend a grid to areas without instruments. If we can’t have accurate and believable data then the resultant analysis and conclusions are flawed.
You’ll find the location on the map here.
https://www.weatherhq.co.uk/weather-station/coningsby-royal-air-force-base
Or here.
https://www.google.com/maps/d/viewer?mid=1VlK41LLxJ1duQAYRseTzRfWvhL0&ll=53.085922492314175%2C-0.1639619413078175&z=14
The weather station is the small blue dot to the West of location 5 on the southern boundary of the airfield.
EM,
Here’s a quote from a UK source. I don’t know how accurate it is –
” . ..sudden spike when the temperature jumped by 1.3C between 3.06pm and 3.12pm, to its highest ever of 40.3C. A table published by the national weather service showed that the recorded temperatures rose at a rate of between 0.1 and 0.6C a minute.”
This tends to support digital instrumentation, and no compliance with WMO averaging requirements (to reject anomalous readings – say from jet aircraft exhaust).
By the way, the location you gave seems to be in a farmer’s field. Satellite pic shows nothing there (apart from field).
Maybe you could find a photo of the enclosure where the instruments are located. I’m not saying that you are wrong. The Coningsby satellite images show a fairly large airfield, home to 3 or 4 fighter squadrons, and there are weather forecasters stationed there, usually indicating a suite of meteorological recording instruments.
It doesn’t matter, I suppose.
EM
I have provided the coordinates that clearly show a weather station at RAF Coningsby and my source is the Metoffice website as their official location of an automatic station.
Your links do not appear to show anything. If you believe the weather station is located in the south of the airfield please do provide the coordinates that I can put into google earth to locate the station.
My coordinates tally with the Metoffice. The weatherstation is clearly visible on google earth and shows it surrounded by asphalt and concrete pads that would cause a false high to be read by thermometers.
Perhaps you just post spurious posts to blur and hide the truth and facts, one would have to question why? To what end?
I often find the climate alarmists use such tactics and the last thing they need is the truth. If you are not an alarmist intent on swamping threads with false statement then provide coordinates that would reveal an alternate weather station and explain why the Metoffice has the location identified as I have done.
I have briefly read your referenced paper. Perhaps you should have.
The paper refers to Coningsby and accepts that Urban heat Island effect cause false readings. The general approach of the analysis is an integrated or averaged reading response and correlated to wind direction and urbanisation proximity and growth.
The “proof” you refer to seems to be lost on you. I have clearly shown via the coordinates and the image IF you were to look that the site is deficient. My argument is not around general urbanisation but the specific conditions adjacent to the site. Indeed the asphalt and concrete are within 3 to 4 meters or the thermometer. These pads would be c. 20C above ambient in a hot sunny day when the sun is around its apex with maximum solar irradiance upon the absorbing surfaces. This is akin to hanging a theremometer on your oven to read the temperature of the kitchen.
As a young Physicist I was employed at the National Physical Laboratory. I am very familiar with accurate measurement and repeatability of measurement. I suspect you may not have such education or experience. I do nit need to put a mathematical analysis forward to identify a measuring system as flawed it is thee to see fir those that will open their eyes and maybe minds though I doubt this will be you.
Sorry, Mr Ramsay… your reply above is by no means an answer to what I wrote.
Yes it is an answer. Just one you do not care for.
Binny,
Please spare us the faux sorrow.
You wrote –
“Sorry, Mr Ramsay your reply above is by no means an answer to what I wrote.”
And your unsubstantiated assertion should be taken as fact because . . . ?
Sorry, Bindidon, your claim not to be a delusional SkyDragon cultist is by no means supported by fact.
You cannot even prove you are not suffering from delusional psychosis, can you?
See how easy it is to throw assertions around?
Climate should be a science debate instead of a political debate. I see in the news that Greta has been arrested again along with some of her followers. What is her science knowledge?
January 15, 2023
Swedish activist Greta Thunberg was removed Sunday by police along with other protesters as they demonstrated against the razing of the German village of Ltzerath for the expansion of a coal mine.
Thunberg did not comply with a police request to leave the area, prompting officers to physically escort her away, German media outlet Bild reported. Thunberg was among a group of activists still at the site on Sunday, the newspaper said.
Climate activists have been squatting in the village in the western state of North Rhine-Westphalia for more than two years to protest its demolition to accommodate an extension of the Garzweiler coal mine.
Thunberg joined them on Saturday, telling a large rally in the fields outside Ltzerath that the German government’s compromise deal with the owner of the coal mine was “shameful.”
According to the police, nine activists were taken to the hospital, Bild reported. More than 70 police officers have been injured in the operation to clear demonstrators from the site, the newspaper said.
Child abuse?
Imagine if the fossil fuel industry touted some uneducated teen as their mascot. The Left would be having cows!
Don’t be daft.
https://en.wikipedia.org/wiki/Naomi_Seibt
Naomi Seibt (born 18 August 2000) is a German political activist, known as a climate change denier and for her opposition to climate activist Greta Thunberg. Until April 2020, she was employed by the Heartland Institute, an American conservative and right-wing public policy think tank that marketed her as the “anti-Greta”. She has spoken at multiple events organized by conservative think tanks and has self-identified as a libertarian and an anarcho-capitalist. Seibt also describes herself as a “climate realist” and has denied allegations that she is a “puppet of the right wing or the climate deniers or the Heartland Institute.”
Thanks Andrea.
That kinda proves my point, in more ways than one….
I had never heard of this person before this link was posted. It does not surprise me that Wikipedia and the rest of the liberal media do not like her and would prefer to demonize and distort her views. Nonetheless we have this from Wikipedia:
“She achieved a first place in physics in local regional competition of the Jugend forscht junior division, called “Students Experiment”, and second place in mathematics.”
It took a considerable search to find this quote:
Seibt, who will appear at the Conservative Political Action Conference, or CPAC, this week, said she does not dispute that the Earth is being warmed by greenhouse gas emissions but that their impact has been overstated by many scientists and activists.
I dont want to get people to stop believing in man-made climate change, not at all, she told the paper. Are man-made CO2 emissions having that much impact on the climate? I think thats ridiculous to believe.
She was indoctrinated by her parents, so, less than zero.
If you want a science debate, Tim, why are you bringing up Greta?
Are you a politician?
It gives people like yourself who are just her to argue something to chew on.
Lame.
Solar wind
speed: 454.5 km/sec
density: 8.46 protons/cm3
Sunspot number: 177
The Radio Sun
10.7 cm flux: 234 sfu
Updated 16 Jan 2023
https://www.spaceweather.com/
Thermosphere Climate Index
today: 16.60×10^10 W Neutral
Oulu Neutron Counts
Percentages of the Space Age average:
today: +0.5% Elevated
[Some small Coronal Holes
Solar Max conditions could be beginning- jump in
with monthly Dec should go higher with Jan]
“FALCON HEAVY LAUNCH: The second most powerful rocket in the world lifted off from Cape Canaveral last night, delivering national security payloads to orbit for the US military.”
Solar wind
speed: 438.3 km/sec
density: 23.32 protons/cm3
Sunspot number: 186
The Radio Sun
10.7 cm flux: 228 sfu
Updated 17 Jan 2023
Thermosphere Climate Index
today: 17.17×10^10 W Neutral
[that might first time of going over 17 x 10^10 W in
awhile]
Oulu Neutron Counts
Percentages of the Space Age average:
today: +0.4% Elevated
48-hr change: +0.1%
Don’t any new spot coming from farside, but these
are going to be around for awhile and they might grow bigger.
Solar wind
speed: 425.7 km/sec
density: 3.95 protons/cm3
Sunspot number: 185
The Radio Sun
10.7 cm flux: 222 sfu
Thermosphere Climate Index
today: 17.65×10^10 W Neutral
Oulu Neutron Counts
Percentages of the Space Age average:
today: -0.9% Below Average
48-hr change: -1.3%
No new spot coming from farside but will be high
for Jan even fades before Feb.
Solar wind
speed: 435.9 km/sec
density: 5.06 protons/cm3
Sunspot number: 166
The Radio Sun
10.7 cm flux: 220 sfu
Updated 19 Jan 2023
Thermosphere Climate Index
today: 17.96×10^10 W Neutral
Oulu Neutron Counts
Percentages of the Space Age average:
today: -1.3% Below Average
Solar wind
speed: 478.4 km/sec
density: 11.94 protons/cm3
Sunspot number: 197
The Radio Sun
10.7 cm flux: 219 sfu
Updated 20 Jan 2023
https://www.spaceweather.com/
Thermosphere Climate Index
today: 18.12×10^10 W Warm
Oulu Neutron Counts
Percentages of the Space Age average:
today: -1.5% Below Average
48-hr change: -0.5%
Some small spot from farside, Jan going be
jumping, high, but I think Feb will be weaker- but
crash thru floor, but next 3 or 4 month I guessing
will strong- strongest of cycle 25.
Solar wind
speed: 448.4 km/sec
density: 6.34 protons/cm3
Sunspot number: 194
The Radio Sun
10.7 cm flux: 209 sfu
Updated 22 Jan 2023
Oulu Neutron Counts
Percentages of the Space Age average:
today: -2.2% Below Average
48-hr change: -0.0%
Continue it’s strength, 1 or 1 small spot are
coming from farside, while spots are disappearing from
near side. Continuing to support large upward jump in
Jan sunspot number.
But seems to me Feb will fall back a little before this solar
Max continues to heat up.
We have couple moderate size Coronal holes which I believe are not
as common in Solar Max.
[And btw, it seems likely we heading towards a brief though strong Grand Solar Min- 24, 25, and 26 will be weaker.
Since I believe this cause more extreme cold weather effects, in say 4 years, we see this.
Solar wind
speed: 523.8 km/sec
density: 10.51 protons/cm3
Sunspot number: 166
Updated 22 Jan 2023
The Radio Sun
10.7 cm flux: 209 sfu
Thermosphere Climate Index
today: 18.55×10^10 W Warm
[Thermosphere is warm- and solar winds is
howling]
Oulu Neutron Counts
Percentages of the Space Age average:
today: -1.9% Below Average
New imaging finds trigger for massive global warming 56 million years ago
56 million years ago, hot magma scorched the sediments under the Atlantic seafloor.
Howard Lee – 1/13/2023, 4:15 AM
https://arstechnica.com/science/2023/01/scientists-image-remains-of-volcanic-burst-that-triggered-massive-warming/
from: https://instapundit.com/
“Seismic cross section through the upper part of the North Atlantic crust at Eriador Ridge a bulge of thickened crust. Gondor is an isolated ancient seabed volcano. Numbers along the bottom are the rough age of the crust in millions of years.”
{Hobbits}
Heavy rain continues across northern Queensland this week.
A Severe Weather Warning for Heavy Rainfall is current in Queensland for the Central Coast, Whitsundays and parts of Herbert, Lower Burdekin, Central Highlands and Coalfields Forecast District.
Widespread daily rainfall totals are likely to exceed 200 mm, while isolated areas could see up to 400 mm. Heavy to locally intense rainfall will particularly affect coastal areas between Ayr and St Lawrence and adjacent inland regions.
Several Minor to Moderate flood warnings have already been issued across Queensland, while Major Flood Warnings are current for the Don river and the Pioneer river.
There are several road closures across the state, including the Bruce Highway which is cut off in multiple sections.
This rain is expected to ease by mid-week as this trough weakens and moves offshore on Wednesday.
A cool front from the south is approaching Melbourne, which will bring rain and a respite from the heat for tennis players.
The Alps will now experience record snowfall.
Good news, especially for northern Italy next spring.
But as you can see, not only the Alps would enjoy some more snow:
https://drive.google.com/file/d/1LdPNI4CcBLVBSpHryzUR_eCzumq4hQRP/view
Hunter
You wrote upthread:
” Paragraph 2: Why is this graph comparing non-airport stations to ghcn stations? ”
https://drive.google.com/file/d/1DAU5AKRJZgTuk5ODMMlOwsmkQREbvPo2/view
*
This graph does NOT compare ‘non-airport stations to ghcn stations’.
It compares, within the GHCN daily data set (over 40,000 stations worldwide, half in the US)
– those storing the TMIN and TMAX data of 133 of the 137 pristine USCRN stations
to
– all 920 US stations located in the 1 degree grid cell of the USCRN stations – minus 92 of them located within airports = 828.
The airport stations have been dropped as they are known to be the most UHI suspect.
*
The graph was updated today to show the previously missing filter output for the 828 station data (red). I also dropped the green UAH stuff, so it’s now easier to concentrate on USCRN (blue) versus USCRN vicinity (red).
*
Maybe you begin to understand what I’m showing for the USCRN period (2005-2022: 18 years).
1. If the average of the most pristine, in the entire US least UHI suspected stations, shows a mean temperature trend (0.48 C / decade) slightly above that of the average of over 800 randomly selected weather stations located in their immediate near (0.46 C / decade): what then exactly means UHI?
*
2. It is 100% evident that when considering, like does Roy Spencer, exclusively the TMIN i.e. nighttime minima, the 133 least UHI affected USCRN stations show a lower trend then the 828 stations around them (0.47 versus 0.55 C / decade).
*
But… are we suddenly only measuring the TMIN temperatures worldwide just because the UHI factor is much more visible there, or what?
What about TMAX?
When looking at TMAX, you suddenly see that while the same 133 USCRN stations show on average a trend of 0.49 C / decade, the average of their 828 neighbour stations is only 0.36 C / decade.
Did that suddenly become irrelevant for some ideological reasons??
**
” Paragraph 3: What does Watts Surface Station project poorly sited stations have to do with UHI? ”
Which ‘poorly sited stations’ of Watts’ Surface Station project can you have in mind, Hunter? The 71 I showed
https://drive.google.com/file/d/1pbQCHFwTTy1HIns9pDNj6mDQ85Vau7NC/view
on the contrary, are the ones that Watts and his collaborators selected as the least UHI-suspicious sites in 2011: you’d better read the big WUWT threads published on the subject at the time.
**
” You cant measure UHI like that. thinking you can; well I agree that would be laughable but what does that have to do with Roy? ”
Well I hope you got it now…
But when I recall your incredibly condescending attitude against historical astronomy results like those presented here
https://dspace.library.uu.nl/bitstream/handle/1874/22975/c9.pdf
– results which you discredited as ‘academic exercise’ despite your absolute lack of knowledge in the domain – I have kinda little doubt, Sir.
Addendum
With ‘all 920 US stations located in the 1 degree grid cell of the USCRN stations’ I understand the subset which had sufficient data for anomaly construction during the USCRN period.
You are rambling Bindidon. You are making it more garbled. Go back and read my comments above about your comparisons of CRN to UAH. Consider them and then rewrite the above. I have no idea what you are trying to get at with the Tmin vs Tmax discussion. Makes no sense to me. Perhaps a more carefully authored and documented presentation and I can figure out what you are talking about.
Hunter
Me, rambling? Ha ha. Nice try.
*
” Looks like you goofed in the gridded to ungridded comparisons under #1 Your crn anomaly increased significantly.
Ungridded difference to UAH appears ~.045/decade
gridded difference to UAH appears ~.136/decade
Something appears wrong there. Needs explanations. ”
*
People like you, Hunter, should do own work, i.e. download data, process it and present own results, instead of boasting alleged knowledge based on nothing more than guessing.
You seem to deliberately ignore the good old rule: ‘Put up or shut up’.
*
The difference between my ungridded and (2.5 degree) gridded USCRN anomaly data trends for 2005-2021 (0.37 resp. 0.47 C / decade) is due to the fact that for all years, there have been more stations than grid cells encompassing them. For example:
Year Stations Cells
2005 79 65
…
2010 121 101
…
2015 131 111
…
2020 133 113
As anybody writing comments in this context of course should know:
– when generating ungridded data out of station records, all station data are directly averaged into months;
– whereas when generating gridded data, these station data are first averaged into grid cells, and the grid cell averages then are finally averaged into months.
*
It is quite normal that the number of low trend records can dominate in the ungridded data but becomes dampened due to grid averaging, or vice-versa.
In GHCN daily, there are a few grid cells in North East CONUS which encompass around 300 stations, but in central CONUS, some cells have less than 20 stations.
Gridding means that grid cells with few stations have the same ‘voice’ as those with a huge number of stations.
This is much more perceptible for the Globe:
– ungridded GHCN daily data processing means that 20,000 stations in the US compete worldwide with 20,000 stations outside of it;
– whereas gridded data means that 220 grid cells compete worldwide with 2,200 grid cells outside of it.
*
No problem for me to show the difference tomorrow.
I know what gridding is but you are talking about gridding 135 stations of the USCRN network for the entire US and you come up with a huge difference. And your explanation is you have more stations than grid cells.
Obviously your gridding effort is inadequate and all you are doing is tilting at windmills.
And if you are going to make the claim that all Roy uses is Tmin when above he says he is trying to use hourly data, you need to put it in context by telling us what your source of that is.
Since GHCN data processed by Berkeley Earth showed trends of Tmin and Tmax it was noted that the Tmin warming trend was about double that of Tmax. It is also interesting that the latest version of GHCN according to Roy above no longer gives that data but only give Tavg. Tmin being the dominant warming doesn’t fit the political narrative so I understand why our government who loves us is no longer providing that information. Like masks don’t work and the vaccine prevents infection narratives. Its all out of love, right?
Bill Hunter,
Increased T min would would be expected if “warming” is due to man-made heat production. I”m not surprised that the SkyDragons have resorted to the refuge of reality deniers – the “average”!
What a pack of delusional cultists!
The Sky Dragon Cult in here are just a bunch of anal sucking worshippers of the establishment.
Bill Hunter,
I can’t find any facts to support me disagreeing with you, which is a roundabout way of saying I agree.
The picture becomes clearer as they move from topic to topic.
More rambling, garbling and goofing for Hunter
Two years ago, UAH presented on the blog statistics of highest daily maxima resp. lowest daily minima for a subset of USHCN stations:
https://tinyurl.com/3uparkhw
indicating how many stations reported their highest maximum resp. lowest minimum in each year.
The intention behind the statistic was to show a decrease in time of weather events – both heat waves and cold drops.
*
I did a similar job, however
– adding highest daily minima
– using line charts instead of bar charts
– extending the scope up to the Globe
– showing the difference between ungridded and gridded data processing.
1. Globe, ungridded data
https://tinyurl.com/5n8t56jk
2. Globe, gridded data
https://tinyurl.com/yckmmhjz
Who never saw these two graphs will ask: how is that difference possible?
The answer is:
3. CONUS, ungridded data
https://tinyurl.com/hurm76p6
And anyone can then understand that the ungridded data for the Globe lets look the Globe like CONUS’ backyard… because the CONUS stations utterly dominate the rest.
Now comparing the linear estimates for the Globe in Obs/100K/decade from 1895 till 2021 (max / low min / high min):
– ungridded: -23 ± 7 / -86 ± 6 / +8 ± 5
– gridded: +16 ± 6 / -103 ± 5 / +53 ± 7
Finally, let us look at
4. CONUS, gridded data
https://tinyurl.com/59fwmb6m
and we see that, though being of course way smaller than for the Globe, the estimate differences still are visible:
– ungridded: -47 ± 7 / -84 ± 6 / -16 ± 5
– gridded: -40 ± 5 / -93 ± 3 / -11 ± 5
But… for the period 2005-2021:
– ungridded: +125 ± 15 / +77 ± 22 / +132 ± 15
– gridded: +168 ± 29 / +65 ± 31 / +172 ± 44
*
Yeah.
You doubt about all that? Fine!
Do the same job, and come back with your results.
Bindidon says:
1. Globe, ungridded data
https://tinyurl.com/5n8t56jk
2. Globe, gridded data
https://tinyurl.com/yckmmhjz
———————————–
Thats very interesting indeed. How come there are no high/low maxima lines like for the minima?
Hunter
I’m being 100% honest here: you’re the very first person to ask about this fourth alternative since the beginning of 2021.
So I’ll get to work – on you alone, when I really have enough time.
Hunter
Work done.
Only the graphic file contents were updated; thus, the four Google Drive links were kept unchanged.
E.g. Globe gridded:
https://drive.google.com/file/d/1veLI9gYJCDEWvyhux5zF0BfBaBHhoa6-/view
That in the gridded global data, the correlation between low max and low min would be similar to that between high max and high min should not surprise anybody.
That is interesting Bindidon.
Years ago I saw a graph of temperature station record temperatures and high daily record temperatures were far below that of the 1930’s. I recall though it was done on the equivalent of USCHN in place at the time (though it may have had a different name then). But these were straight up thermometer variation not a far milder ‘mean’ variation of a huge area.
I am really only interested in non-gridded temps.
Thats for a couple of reasons.
1) A large area in a 2.5degree grid at the equator would be about an area about 60 times the area of Los Angeles. Los Angeles has a huge temperature variation across the city so the daily records you would be recording would be extremely mild in comparison to what people are actually feeling.
2) 2.5degree x 2.5 degree gridding strongly favors polar warming, which we know to be much greater than equator warming.
A grid cell at the equator would be more than 50 times the area of a grid cell adjacent to the pole. Thus for an apples and oranges comparison the grid cells would need to be weighted by their corresponding area to be equivalents.
Hunter
You are as much aware of temperature record processing as you are of the way how the lunar spin and its polar axis are computed: namely, not at all.
You simply ignore all that, but are brazen enough to discredit those who are really knowledgeable.
*
1. ” A large area in a 2.5 degree grid at the equator would be about an area about 60 times the area of Los Angeles. ”
2. ” 2.5 degree x 2.5 degree gridding strongly favors polar warming, which we know to be much greater than equator warming.
A grid cell at the equator would be more than 50 times the area of a grid cell adjacent to the pole. ”
*
Here we see once again how ignorant people like you really are, Hunter.
Instead of trying to obtain information from really experienced people, you prefer to argue according to your own guessings, like do… Robertson and a few other ‘specialists’.
*
Why don’t you think by your own that the problem you correctly assume – the relevance of temperatures decreasing with increasing latitudes when building a global average over a sphere – has nothing to do with gridding aka area weighting?
It has to do with latitude weighting related to the cosine of the latitude angles.
Even when you don’t use area weighting, you still have to perform latitude weighting, using the formula
Vglobal = sum [i=1:n] (Vlat(i) * cos(i)) / sum [i=1:n] (cos(i))
where ‘V’ is the value you want to obtain (temperature, precipitation, sea ice extent or whatsoever), and the index ‘i’ identifies either a single measurement point or, in case of area weighting, a grid cell encompassing an arbitrary number of such points.
*
If things were like you so superficially guess: wouldn’t then UAH’s zonal and regional time series all be wrong as well, Hunter?
*
Let me finally tell you that years ago, I made a comparison of different strategies; the result was that omitting area weighting led to a higher bias than omitting latitude weighting.
Recently, I compared UAH LT and LS time series for the Globe with resp. without latitude weighting; here is the difference:
LT
https://tinyurl.com/bddmvvzf
LS
https://tinyurl.com/454bxhjh
*
Maybe you feel I’m arrogant and teachy. But this is only a reaction to your own mix of arrogance and ignorance, like in
” The only way that he could possibly think we are refuting Mayer’s work is if he was still unable to grasp the the simple fact that the non-spinner position is: ‘yes the moon rotates. It rotates on the COM of the earth.’ ”
You not only show your ignorance of the fact that you discredit not only Mayer’s work (a work that you by the way 100 % ignore because you can’t understand even a bit of it).
You discredit also the work of hundreds of scientists who did the same job as Mayer – or fully understood that job, beginning with Cassini, Newton, Mercator, Lagrange, Laplace, Beer/Mädler… till Habibullin, Rizvanov, Eckardt, Calam, Migus, Wisdom etc etc.
And you finally ridicule yourself by discrediting papers like
https://downloads.spj.sciencemag.org/space/2021/9897105.pdf
or
https://www.lpi.usra.edu/lunar/documents/nasa_tn_d_2795.pdf
based on real experience.
*
No wonder for me, when I look at the level of incompetence you show with regard to simplest things like area and latitude weighting.
Now I am confused Bindidon. You said you were using 2.5 degree gridding, now you are saying I think you use so many sq km or miles.
Bindidon says:
”Which poorly sited stations of Watts Surface Station project can you have in mind, Hunter? The 71 I showed”
———————————
Wow thats insane Bindidon. You mean warming didn’t start in CONUS till 2015!!!
Hunter
Sorry, I don’t understand your uncontrolled polemic.
Try to explain what you mean in a more peaceful, less aggressive way and I’m sure I’ll start to understand.
i was just expressing surprise that us thermometers weren’t rising above natural fluctuations until the super el nino of this last decade. what is intimidating about that?
I have no clue what Bill is trying to say, either. I think he’s running some additional dialog in his head that he’s not sharing.
Barry you need to look here:
Bindidon’s post where he posts the temperature record of Anthony Watts Surface Station Project where he found 71 stations that passed NOAAs station standards.
https://www.drroyspencer.com/2023/01/urbanization-effects-on-ghcn-temperature-trends-part-i-the-urbanization-characteristics-of-the-ghcn-stations/#comment-1431888
Since it is a long post here is the link he posted for that record.
https://drive.google.com/file/d/1pbQCHFwTTy1HIns9pDNj6mDQ85Vau7NC/view
You should notice the record shows no warming before 2015 of a magnitude greater than the 1930’s.
Since this represents as far as I know the only record of stations tested to meet consistent NOAA standards and represents the only such stations that NOAA has any control over one would expect it to be a bellweather for global climate change from any world wide phenomena.
From an audit standpoint it represents good controls and a decent extended climate record of 119 years.
I read the post and saw the link.
Graph shows that the 71 best-sited US stations have a warmer long-term trend than the record from all USHCN weather stations.
https://drive.google.com/file/d/1pbQCHFwTTy1HIns9pDNj6mDQ85Vau7NC/view
So where is the UHI in the official record? Shouldn’t we have seen the opposite result?
That was Bindidon’s point.
And you think the 71 stations “represents the only such stations that NOAA has any control over.”
Wrong. They are just 71 stations that surfacestations gave top rating to. NOAA has no more control over these than the other weather stations in USHCN. You might be mistaking those 71 stations for the USCRN, which only begins in 2005 anyway.
one would expect it to be a bellweather for global climate change
The temperature record of America, less than 3% of the global surface, is supposed to be a good proxy for the whole globe?
What does UHI have to do with it?
Anthony’s station project didn’t address UHI. There is no reason to think that the stations he selected to test are any less or more vulnerable to UHI.
Barry says:
”And you think the 71 stations ‘represents the only such stations that NOAA has any control over.’ ”
No I never said that. What I am saying is there is a lot of evidence of a huge amount of UHI in the surface temperature record.
Anthony had the same thought. I don’t think he found it because his standards weren’t high enough. That is clear by this study:
https://journals.ametsoc.org/view/journals/apme/58/6/jamc-d-19-0002.1.xml
By this study it could be that 90% of USCHN stations are out of compliance. Watts published some estimates of the effect. NOAA for obvious reasons isn’t going to embrace that. And one can argue against the idea that anybody has done a complete study on the matter. but isn’t that what you would expect? How much evidence is necessary? Photo documentation of weather station site compliance with the best possible standards for preventing urban encroachment error over the entire surface station record?
Heck NOAA just recently ordered that when possible photo documentation should be made during routine site investigations.
Anthony’s effort brought that problem to light. If you read the study above you will see urban encroachment and affect a change of .1c from affects 124 meters away. And these are small encroachments. What is the result of a large tract development upwind a half mile away?
There might only be a handful of surface stations without significant encroachment over the surface temperature record or even the satellite era record of 43 years so right off the bat one could question a tenth of a degree difference resulting from UHI with some differences for individual stations in the record per the study mounting up to .3C. Indeed NOAA has done adjustments but they are highly motivated to be as conservative as possibly reasonable. Independent auditors thrive in this territory with healthy skepticism reinforced over numerous experiences.
Bill:
“What does UHI have to do with it?
Anthony’s station project didn’t address UHI.”
Also Bill:
“What I am saying is there is a lot of evidence of a huge amount of UHI in the surface temperature record.
Anthony had the same thought.”
Yes, former Bill got it wrong. surfacestations was predicated on the notion that microsite influence on weather stations – UHI – made the US temp record warmer.
Latter Bill didn’t quite get it right either. Watts and co did indeed find warm-bias influence at microsites, and this affected daily minima – which is why his peer-reviewed study, Fall et al 2011, spends so much of the time talking about diurnal temp trends.
However, Fall et al also discovered that the average temp trends were the same across all classes of weather stations. The issue was only with minima and maxima. Something already well-known.
But you’ve missed the point hugely. You were replying to Bindidon, and HE was talking about UHI. THAT’s what “its got to do with it.”
Not to mention that this is the theme of Roy’s article at the top.
So when you said,
“Barry you need to look here:
Bindidons post where he posts the temperature record of Anthony Watts Surface Station Project where he found 71 stations that passed NOAAs station standards.”
Yeah, I had read it. It was about UHI. DO try to keep it all together in your head.
barry says:
”It is clear you don’t understand the issue Barry or what Anthony’s contribution was.”
You are swooning over temperature trend records that don’t show Anthony’s good stations showing a lower temperature trend. And when I first got involved with it the thought was that these bad stations would be warmer than average stations. I suppose maybe Anthony thought that too. The problem is comparing good urban stations to the overall record that includes a lot of rural stations. . . .wouldn’t it occur to you that the trend is less not because the good stations are urban effect free but because the entire database has a lot of stations meeting current standards combined with a good number of really rural stations like CRN that was put in place while Anthony’s work was underway.
You might say Anthony and myself may have been lulled into thinking that NOAAs microclimate urban standards were good standards and that the only problem was enforcement of the standards.
It appears even Berkeley Earth bought into that notion and concluded that actual non-compliance with NOAA standards simply wasn’t all that important.
After all we all have tremendous respect for NOAA. Maybe me most of all. I have touted the NOAA civil servants at every opportunity, their independence, their dedication to their craft, their training, and how hard they work to do a good job.
But recent work is showing we didn’t know what good standards are to prevent the encroachment effect of urbanization into a system that is being asked to do something it was never designed to do in the first place.
I provided you papers talking about an up to .3c degree of error being introduced into our highest quality weather stations by microclimate urbanization not recognized as a threat.
Anthony didn’t know that. I didn’t know that. Berkeley Earth didn’t know that.
We are just starting to crack the nut on UHI. Anthony contributed greatly to that in that NOAA recognized that to recognize UHI in the future the microclimates surrounding weather stations need to be documented by pictures. They recognized that because Anthony’s documentation/photos showed obvious urban encroachment problems.
The fact that Anthony’s good stations might have UHI encroachment not prevented by current NOAA standards is only beginning to come to people’s attention. I gave you a link of the study that is finding such effects in some of the highest standard surface stations NOAA has.
NOAA isn’t talking much about it which is normal for an institution that wants to not have controversy. But it is inspiring more people to start looking for ways to estimate what the effect is.
“You are swooning over temperature trend records that don’t show Anthony’s good stations showing a lower temperature trend.”
So hard to unlace all this misinformation there.
1. I’m not swooning over anything. I’ve read the work, followed it all over time, I present you the facts.
2. It is the official US temp record, either from NOAA or GISS, that matches the record from Anthony’s 71 stations. Anthony Watts says so himself in Fall et al 2011, as I’ve quoted for you elsewhere.
“You might say Anthony and myself may have been lulled into thinking that NOAAs microclimate urban standards were good standards and that the only problem was enforcement of the standards.”
So much wrong with this.
1. NOAA doesn’t maintain the CONUS network of stations, so it doesn’t have a say in how microclimate issues are handled on site. They have zero power to enforce, and it’s not their job.
Their job is to understand what the issue is and find ways to account and correct for it.
There is 4 decades worth of peer-reviewed literature on exactly this, researched and written about by these compilers of the temp records, which you seem to be completely unaware of.
“It appears even Berkeley Earth bought into that notion and concluded that actual non-compliance with NOAA standards simply wasn’t all that important.”
Berkeley did their own analysis, using their own methods to account for UHI and other problems, and corroborated the other global temp records. The methods they used were built out of the concerns of AGW ‘skeptics’, which comprised most of the Berkeley team.
“But recent work is showing we didn’t know what good standards are to prevent the encroachment effect of urbanization into a system that is being asked to do something it was never designed to do in the first place.”
Anthony Watts and Roy Spencer are claiming that the microsite issues have a major impact on temperature trends, compared to the adjusted data. Meanwhile other work has supported the official records.
If you weren’t cherry-picking your papers you would know this.
“We are just starting to crack the nut on UHI.”
The issue has been investigated for decades and many methods have been designed to account for it. Such as:
Pairwise adjustment urban/rural stations
Comparing rural to urban data sets
Comparing ‘pristine’ data sets (as in USCRN) with the full ensemble
And more
“Anthony contributed greatly to that in that NOAA recognized that to recognize UHI in the future the microclimates surrounding weather stations need to be documented by pictures.”
Cite please. Or are you going to fail to give one like you did with Hansen’s quote on el Ninos being the new normal?
“They recognized that because Anthony’s documentation/photos showed obvious urban encroachment problems.”
They already knew about it decades before Watts started surfacestations, and had testing and correcting for it ever since.
“The fact that Anthony’s good stations might have UHI encroachment not prevented by current NOAA standards is only beginning to come to people’s attention.”
Again, NOAA is not the proprietor of most US weather stations. If surfacestations rating system is dubious then I am sorry that this is so. It was a good effort.
But NOAA’s US record matched the USCRN record. So since at least 2005 there has been no issue.
“I gave you a link of the study that is finding such effects in some of the highest standard surface stations NOAA has.”
The paper said that NOAA realised their might be encroachment issues when they installed the Kingston station, but that this could be monitored with another USCRN station close by that was not encroached.
So what they did was a case study on microsite influence, and YOU ‘interpret’ this as low standards.
“NOAA isn’t talking much about it which is normal for an institution that wants to not have controversy. But it is inspiring more people to start looking for ways to estimate what the effect is.”
NOAA has been talking about UHI for 4 decades at least, and have written reams of papers on it. Watts and co, and you, it seems, are blissfully unaware. Here is a small sample of papers written by the compilers of the temp records, on UHI and microsite biases.
1988 – https://tinyurl.com/25ykphwn
1993 – https://sci-hub.se/10.1175/1520-0477(1993)074%3C1007:anporg%3E2.0.co;2
2009 – http://www-personal.umich.edu/~eoswald/Menne2009_USHCN_V2.pdf
2010 – https://agupubs.onlinelibrary.wiley.com/doi/full/10.1029/2009JD013094
barry says:
”Bill: ”Anthony contributed greatly to that in that NOAA recognized that to recognize UHI in the future the microclimates surrounding weather stations need to be documented by pictures.”
Cite please. Or are you going to fail to give one like you did with Hansens quote on el Ninos being the new normal? ”
Sure thing Barry since you have had your blinders on with this.
Watts released his study in March 2009. That moved the needle and here is the Commerce Departments response.
https://www.oig.doc.gov/OIGPublications/STL-19846.pdf
———————–
barry says:
” ”Bill: They recognized that because Anthonys documentation/photos showed obvious urban encroachment problems.”
They already knew about it decades before Watts started surfacestations, and had testing and correcting for it ever since.”
Well that didn’t prevent Anthony from obtaining a lot of findings that hadn’t been corrected. And it may not prevent Roy from him finding more.
———————-
Barry says:
”The fact that Anthonys good stations might have UHI encroachment not prevented by current NOAA standards is only beginning to come to peoples attention.”
NOAA apparently already knew about the 100meter standard when they created CRN. but they had done little or nothing with the network.
———————-
Barry says:
”NOAA has been talking about UHI for 4 decades at least, and have written reams of papers on it. Watts and co, and you, it seems, are blissfully unaware. Here is a small sample of papers written by the compilers of the temp records, on UHI and microsite biases.”
Do you have one that doesn’t just assume a linear relationship for the effect? One where UHI is empirically linked to its potency throughout the range of urban development?
“Watts released his study in March 2009. That moved the needle and here is the Commerce Departments response.”
There is no mention of Watts, his study, or of surfacestations.org in that document.
The expert opinion sought is detailed in the document, and Watts is not included.
The experts in the document are generally positive about NOAA’s efforts in compiling the US temp record. The papers and experts cited on microsite influence are from NOAA, which is where the photographs came from.
So what is the link? It is the reference to photographs taken by Watts that appear in Menne’s 2009 study.
Did this move the needle? There’s no indication that it did in the document you provided, which credits NOAA with proper treatment of temperature data.
So you haven’t corroborated that “Anthony contributed greatly to that in that NOAA recognized that to recognize UHI in the future the microclimates surrounding weather stations need to be documented by pictures.”
Now I’ll need a cite that NOAA has recently ordered photos be taken at sites, and that this is tied to Watts’ effort. Because I think it is tied to the fact that everyone now has a smart phone.
“Well that didn’t prevent Anthony from obtaining a lot of findings that hadn’t been corrected.”
But they had been corrected – in the homogenised averaged data. As Anthony Watt’s peer-reviewed paper reveals. The min/max biases had also been noticed for decades. Photographs aren’t going to solve that problem.
“Do you have one that doesnt just assume a linear relationship for the effect? One where UHI is empirically linked to its potency throughout the range of urban development?
Any study involving pairwise analysis looks at discontinuities between stations as a sudden departure. So if someone builds a carpark right next to a weather station, that is going to show an immediate break with other stations that didn’t have urban development at the same time.
Do you have a suggestion as to how such a non-linear analysis could be done? Because I don’t see Roy suggesting one.
Barry you will have to wait and see how Roy approaches it. Looks like to me he is going to use a starting rural standard that is far more conservative than BE.
Bindidon:
”on the contrary, are the ones that Watts and his collaborators selected as the least UHI-suspicious sites in 2011: youd better read the big WUWT threads published on the subject at the time.”
That’s not quite correct. I went back and read one of his reports. He is talking about manmade influences on a weather station. Locating it to close to heat sources.
This is indeed a UHI influence on absolute temperature.
NOAA has long recognized that they could be off 2 degrees or so in absolute temperature due to non-representative sampling and the unnatural influences on weather stations.
If temps go up one degree its going to pretty much go up one degree across the board both natural and uhi areas.
The question is was this thermometer located next to the same heat sinks in the past, particular through the base period of 30 to 40 years.
Was this longtime reporting weather station (which are the ones in the global temperature record) always affected by the same influence. If it was then it is not the UHI that is the problem.
The problem for warming comes from increasing populations and resulting additional uhi encroachment on the station over the decades.
So Anthony’s work was just the first step in this. Poorly sited weather stations are more likely to have been encroached by urbanization as they had that in place when Anthony inspected the station.
The next step was to start figuring out what the encroachment amounts to over time. I put a couple of links to studies that do some estimates on that. Roy has some studies and has done some work that is narrowing the search and developing a proxy based upon population growth.
There are a number of studies out there showing this is a big problem. And that is using US weather stations. The rest of the world is probably a whole lot worse.
This study suggests that UHI might comprise 37% of the warming in the USHCN.
https://everythingclimate.com/the-us-surface-temperature-record-is-unreliable/
https://journals.ametsoc.org/view/journals/apme/58/6/jamc-d-19-0002.1.xml
And that is using US weather stations. The rest of the world is probably a whole lot worse.
Watt’s peer-reviewed paper on microsite bias found that while maxima and minima were affected by microsite issues at poorly sited stations, these effects canceleled out for average temperatures, and there was little difference across classes on that metric.
“The opposite-signed differences in maximum and minimum temperature trends at poorly sited stations compared to well-sited stations were of similar magnitude, so that average temperature trends were statistically indistinguishable across classes. For 30 year trends based on time-of-observation corrections, differences across classes were less than 0.05°C/decade, and the difference between the trend estimated using the full network and the trend estimated using the best-sited stations was less than 0.01°C/decade.”
And
“Homogeneity adjustments are necessary and tend to reduce the trend differences, but statistically significant differences remain for all but average temperature trends.”
https://agupubs.onlinelibrary.wiley.com/doi/full/10.1029/2010JD015146#jgrd16904-bib-0031
barry says:
”Watts peer-reviewed paper on microsite bias found that while maxima and minima were affected by microsite issues at poorly sited stations, these effects canceleled out for average temperatures, and there was little difference across classes on that metric.”
Yes Barry thats true. But one could look to Oke 1973 as Roy is doing and glean the reason why no result was found.
Namely that when you look at badly designed stations they have such an urban influence in them that much of it is saturated and so no trend was detected..
Then if you look to Oke again and note that most rapid onset of UHI is in the least dense urban areas you would realize that a good deal of UHI is built into the ‘good’ stations.
Compare the two and you have done what everybody else seems to have done in the study of UHI.
Roy is taking a non-linear look at the issue on the advice of Oke 1973. Smart move! There are too few scientists like Roy that actually ponder the issues. I know a few personally that regularly make a difference to outcomes. But like any segment of the population there are a lot more that just do enough of what it takes to get along.
I agree. convection accounts for over 80% of the cooling of the surface. Block convection in a greenhouse and it will cool slower. But surfaces don’t get hotter in a greenhouse in fact they are ever so slightly cooler because of filtering out IR from incoming light.
this whole issue all but disappeared over a 100 years ago with RW Woods experiment showing that fact.
So what do the advocates do with that information. They claim CO2 doesn’t act like a greenhouse.
Either it does or it doesn’t. You can’t have your cake and eat it too folks.
“But one could look to Oke 1973 as Roy is doing and glean the reason why no result was found.”
Sounds like you’re taking (Roy’s interpretation of) Oke’s paper as revelatory. Seems you know the result before the analysis.
“if you look to Oke again and note that most rapid onset of UHI is in the least dense urban areas you would realize that a good deal of UHI is built into the ‘good’ stations.”
What does it mean to you that the homogenised USHCN and USCRN are essentially identical? Whither UHI if these match?
If you’re going to say that USHCN is likewise susceptible to UHI, you’re going to have to come up with some evidence – and that 2019 paper is definitely not it.
“Roy is taking a non-linear look at the issue on the advice of Oke 1973.”
What gives you the impression Roy is definitely taking a non-linear look, and how do you think Roy is proposing to do it?
barry says:
” Bill says: ‘But one could look to Oke 1973 as Roy is doing and glean the reason why no result was found.’
Sounds like youre taking (Roys interpretation of) Okes paper as revelatory. Seems you know the result before the analysis.”
—————
Where did I say that Barry? Its a question that obviously needs an answer. That is what science is all about.
barry says:
”if you look to Oke again and note that most rapid onset of UHI is in the least dense urban areas you would realize that a good deal of UHI is built into the good stations.”
What does it mean to you that the homogenised USHCN and USCRN are essentially identical? Whither UHI if these match?
———————–
I haven’t seen the comparison Barry so I have no comment on that. and I am not sure why it matters. Roy has GCHN online for the work not USCHN.
Barry says:
”If youre going to say that USHCN is likewise susceptible to UHI, youre going to have to come up with some evidence and that 2019 paper is definitely not it.”
——————–
USCHN?
Barry says:
”Bill said: ‘Roy is taking a non-linear look at the issue on the advice of Oke 1973.’
What gives you the impression Roy is definitely taking a non-linear look, and how do you think Roy is proposing to do it?”
——————–
Because Roy sometime ago published here a quick and dirty look based on that using a small dataset and found a signal. And Part I is all about binning data to fit that same model.
“I havent seen the comparison Barry so I have no comment on that. and I am not sure why it matters.”
Here it is.
https://www.ncei.noaa.gov/access/monitoring/national-temperature-index/time-series/anom-tavg/ann/12
It matters because if UHI is contaminating the record, then we should see the official NOAA US record diverging from the reference network.
But we don’t. They are virtually identical.
This indicates that UHI may not be a problem with the homogenised USHCN.
In fact, the homogenised data show a slightly cooler trend than USCRN.
If you’re researching UHI, doesn’t this comparison merit inclusion into your study?
I don’t know why you would say it doesn’t matter.
barry: “Sounds like youre taking (Roys interpretation of) Okes paper as revelatory. Seems you know the result before the analysis.”
Bill: “Where did I say that Barry?”
Here.
“Then if you look to Oke again and note that most rapid onset of UHI is in the least dense urban areas you would realize that a good deal of UHI is built into the ‘good’ stations.”
That’s premature, as you haven’t factored actual urban growth over time. Rapid onset of UHI in rural stations would occur in Oke’s model, if urban encroachment, or population growth, around rural weather stations proceeded at the same rate or faster than the cities.
If population growth is slower in rural areas than cities, then it is not axiomatic that rural UHI has actually grown faster than city UHI over time.
A significant piece of evidence is trend comparisons between rural and urban weather stations. Rural stations (prior to pairwise homogenisation) warm slower than city stations.
So that’s why I think you’ve accepted the results before they’ve come in. You’ve assumed rural areas have developed a stronger UHI signal than urban areas over time.
“Then if you look to Oke again and note that most rapid onset of UHI is in the least dense urban areas you would realize that a good deal of UHI is built into the ‘good’ stations.”
barry says:
”barry: Sounds like youre taking (Roys interpretation of) Okes paper as revelatory. Seems you know the result before the analysis.”
Roy says Oke 1973 found that the highest amount of UHI was found at the beginning of urban development.
So Roy is looking at what Bindidon said needed to be looked at. . . .warming since 1980. Roy is starting with 1973.
We will have to see what he comes up with. Hopefully he can find a few still very rural.
86%+ at least in the current GHCN are urbanized. And the current GHCN only has 4232 stations (with ~560 not very urban) .
However, BE was selecting from 36,869 sites (15,594 were found to be very rural) and was testing for UHI over a 160 year period (Figure 5B).
Looks pretty encouraging for Roy that looking at a shorter period is apt to reveal UHI in that period not evident at looking at weather stations that have been around for 160 years.
Roy has several advantages.
1) A focused look at the only period of concern for AGW.
2) In 2010 GIS mapping software hand only recently begun to take advantage of widely spread databases and input into these databases was only a small fraction of whats in them today. . . .and likely in another decade there will be a whole lot more.
This corresponds similarly to the growth of the internet and simulataneous growth of those databases. And internet use is doubling about every 6 years.
3) A huge chance of better understanding of variation in global temperature monitoring.
IMO, somebody should be starting a project like this annually there is so much opportunity to take advantage at far more resolved data.
BE complained of not being able to accurately locate their stations as locations were only reported to one tenth of a degree or 10km so they had to split their sample into very rural and not very rural thus may have included rural sites as urban sites with no urban development within 6 miles. I don’t know how much that has improved overall globally but I suspect its pretty significant.
La Nina very stable.
http://www.bom.gov.au/archive/oceanography/ocean_anals/IDYOC006/IDYOC006.202301.gif
The climate change movement loses credibility in two very important ways. First, the policy statements of the IPCC and other organizations clearly state that redistribution of wealth is an important part of their agenda — they are political. Second, and most important is the failure to promote and endorse a complete and open examination of ALL of the science. Science that is limited in scope is not science at all. Dr. Spencer is openly criticized for doing genuine science, and that is shameful.
Tim S,
You wrote –
“Dr. Spencer is openly criticized for doing genuine science, and that is shameful.”
I agree wholeheartedly.
“the policy statements of the IPCC and other organizations clearly state that redistribution of wealth is an important part of their agenda they are political.”
Policy statements? Don’t you actually mean the quote of a single boffin in a talk?
You’re giving a good demonstration of how disinformation is done, Tim.
The quotes are vague and cleverly worded, but it is there. Would prefer the word subsidy or maybe “assistance”?
Try chapter 15 on page 1602 section 15.6.7 Development of Local Capital Markets
Good to see you’ve backed of the socialist-laced rhetoric and are saying something a bit more reasonable. Subsidies, assistance.
Yes, please compare and contrast historical and ongoing subsidies and assistance to the fossil fuel sector with that for renewables. It would be great if you could kick us off with this very useful context setter.
They use sleazy language and you like it. Most of understand that the UN is a political organization.
So no economics to help us out, then?
Ok, so the UN is political. Brilliant observation. And the government subsidies and grants for the fossil fuel industries are also political.
So you have a problem with the UN recommending redistributing subsidies and grants in favour of renewables because the UN is political, but not with governments distributing subsidies and grants to fossil fuel companies because they are not… political?
I realize I set you too hard a task comparing and contrasting subsidies for the various energy sectors. Perhaps it would be easier for you to explain explaining why national governments are not political but the UN is?
Sudden warming in the upper stratosphere (SSW) promises an interesting winter in the northern hemisphere.
https://i.ibb.co/Yd003CN/02mb9065.png
The first problem with ren is that he always predicts a lot of cold, but never tells us when his predictions didn’t come true.
The second problem with ren is that he never talks about warmth, and certainly not the warmth that comes after a brief cold spell.
Recently it was extremely cold in Denver, CO, which he was happy to share; immediately afterwards, however, it suddenly got warmer again than it had gotten cold before:
https://i.postimg.cc/HW0bvKjq/TNLD-x0079-20221123-20230118.gif
But that little detail he completely forgot to tell us.
*
Alarmism is not good! But that doesn’t just apply when we’re talking about Warmistas :–)
binny…”The first problem with ren is that he always predicts a lot of cold, but never tells us when his predictions didnt come true.
The second problem with ren is that he never talks about warmth, and certainly not the warmth that comes after a brief cold spell”.
***
The first problem with Binny’s critique is it is coming from an idiot. The second problem is the cold predicted by Ren is happening in an era where it was predicted we’d be able to sail throuh an ice-free Arctic and that children would never see snow.
As usual: a polemicist’s and denyer’s dumb reply having nothing to do with what I wrote.
That’s Robertson, yeah.
For the United States, the USCRN is identical to the full ClimDiv network:
https://www.ncei.noaa.gov/access/monitoring/national-temperature-index/time-series/anom-tavg/1/0
Where is the evidence of urbanization bias in ClimDiv?
Swenson
Here’s a photo of the Coningsby site, courtesy of the Met Office. Taken, I think , from the taxiway North of the station, looking South.
https://www.google.com/search?q=met+office+coningsby&oq=met+officec&aqs=chrome.1.69i57j35i39i285i305j35i39i305j0i131i273i433i457j0i402l2j0i273l3.7742j0j4&client=ms-android-samsung-gj-rev1&sourceid=chrome-mobile&ie=UTF-8
It’s fairly typical. A lightly fenced grassy enclosure about 20 yards by 10 yards with instruments and an anemometer pole scattered across it. At satellite photo resolution it does resemble a small field.
David Ramsay
Your time at Teddington may have distorted your thinking. I can picture you using a reference thermometer capa le of 10^-6C accuracy and resolution to calibrate other thermometers under carefully controlled lab conditions.
However, even using the same equipment, you could not achieve anything like the same performance in a muddy field in the rain.
I’ve noticed this before in laboratory physicists or engineers. They have impossible expectations regarding measurements taken in the field. Incidentally, RAF Coningsby was not the only 40C+ station on the day. Several other East of England stations recorded similar daily maximum temperatures.
David Ramsey, Swenson
Solved it.
There are, or have been, two weather station sites at RAF Coningsby.
The older site was at GPS coordinates 53.084, -0.166 on the Southern edge of the airfield. It shows on older aerial photographs and on the Met Office ground photo I linked for Swenson in my 8.21AM post. On the most recent satellite photos it’s gone.
The replacement automatic station is at your coordinates 53.094, -0.171. It shows on recent satellite photos between the main runway and the North taxiway, much closer to the modern buildings.
So you are right. The new station is more subject to UHI and jet exhaust than the old one.
Entropic man
A very honest reaction that I have never seen before on this blog from people discrediting you.
Binny,
When the facts don’t agree with me, I am wrong.
In this case, so was EM.
“Honest” reaction? Just accepting reality. As Feynman said “It doesn’t matter how beautiful your theory is, it doesn’t matter how smart you are. If it doesn’t agree with experiment, it’s wrong.”
Believe it or not, I have been wrong in the past – my cunningly worked out explanation was just wrong, wrong, wrong, as it turned out. More than once, actually, but nobody was seriously injured, so no harm done.
Who – except genius Flynnson – is interested in genius Flynnson’s blah blah?
Binny,
You are, obviously.
You are just trying to troll, but you need to try harder – it doesn’t look you are disrupting anything, or annoying anyone.
Carry on believing you can predict the future by “dissecting the past”.
Dr Roy Spencer:
“The issue is important (obviously) because if observed warming trends have been overstated, then any deductions about the sensitivity of the climate system to anthropogenic greenhouse gas emissions are also overstated. (Here I am not going to go into the possibility that some portion of recent warming is due to natural effects, that’s a very different discussion for another day).”
https://www.nsstc.uah.edu/climate/2022/december2022/202212_Bar.png
The past thirty years of Monthly Global Lower Troposphere v6.0 Anomaly show a definite warming pattern in cool La Nina years. This doesn’t support “natural variability” as the culprit, but rather the heat imbalance in the system. Put another way, the global warming signal in the bulk atmosphere has risen above the noise of natural variability.
I look forward to your insights concerning these observations.
TM, do you believe the Tonga-Hunga eruption was not part of “natural variability”?
If so, you really are braindead.
From the perspective of Statistical Process Control the process is out of control and trending upward. There are two problems with attempting to label the cause as increasing CO2. It does not show a smooth upward trend. It seems to move in spurts. Even if the low point and high points are considered, it still does not move smoothly. There have to be other factors that move randomly or episodically. There is no scientific validity in attempting to ascribe just one factor. There potentially are many factors in much the same was as the different orbital variations affect the Milankovitch Cycles in the 100,000 year period.
It helps if you know where to look for the signal.
M. B. Glaser, “CO2 Greenhouse Effect A Technical Review.” (Coordination and Planning Division, Exxon Research and Engineering Company, 1982)
https://corporate.exxonmobil.com/-/media/Global/Files/climate-change/media-reported-documents/03_1982-Exxon-Primer-on-CO2-Greenhouse-Effect.pdf
A warming trend can be quite natural. Just like a cooling trend can be quite natural.
It’s called “natural variability”.
TM,
Really?
After about four and a half billion years of inactivity, a CO2 induced “greenhouse effect” might be detected in 2020?
Due to magic spells cast by SkyDragon cultists, no doubt, in view of the laws of the universe giving no reason for a CO2 induced “greenhouse effect” to suddenly appear!
Do you really believe the nonsense you write, or are you simply pretending?
Questions, questions. Pity you have no answers, isn’t it?
maguff…”This is about the earliest projection of when the temperature might rise the 0.5[C] needed to get beyond the range of normal temperature fluctuations”.
***
Three times since 1998 the global temperature has exceeded 0.5C above the baseline. The article does not indicate, nor does it prove, what is meant by a ‘normal temperature fluctuation’.
More gibberish from Maguff.
What article are you talking about?
If you paid attention you would have learned by now that it is NOT the earth’s shadow which causes the phases of the moon.
https://www.drroyspencer.com/2021/03/uah-global-temperature-update-for-february-2021-0-20-deg-c/#comment-632695
No wonder that Clint R, Flynnson and Robertson all three belong to this blog’s Lunar Spin Denial Squad.
Regardless what they write about: it’s all trash, e.g. Robertson’s endlessly repeated lie about NOAA’s station removal:
https://www.drroyspencer.com/2023/01/urbanization-effects-on-ghcn-temperature-trends-part-i-the-urbanization-characteristics-of-the-ghcn-stations/#comment-1433490
Blogger E.M. Smith aka ‘chiefio’ (wow) is a typical contrarian guy, and has about as much clue concerning station data as has Robertson himself, i.e. 0.000.
Exactly at the time this dumb chiefio wrote his incredible head post in 2009, NOAA was shifting it entire GHCN station data from the V2 to the V3 directory!
*
And that is the kind of blogger Robertson gullibly appeals to the authority of…
OMG.
Bindidon, do these attacks come on gradually, or all at once.
Thats the kind of thing your therapist will need to know.
I understand that Binny’s therapist was Siggy Freud but he died in 1939 leaving him with no guidance.
“There are two problems with attempting to label the cause as increasing CO2. It does not show a smooth upward trend.”
When the climate changes from Winter to Summer, do you see a smooth increase in daily temperatures?
No you don’t. And do you know why?
Weather variability has a much larger variance than climatic variability – more than 10 times as much.
It is exactly the same issue in a warming world. Monthly temperature variation is more than 10 times the trend. Why would anyone expect a monotonic rise in temperature month after month?
Why do ‘skeptics’ have trouble disentangling weather from climate? Even years after it’s been explained to them.
“There have to be other factors that move randomly or episodically.”
Yes, something interferes with a smooth increase in daily temperatures from Winter to Summer.
I guess that means the seasons don’t exist! It’s been a hoax for centuries!
barry, you seem to be struggling to keep the cult nonsense going when it is obviously faltering. We’re going on 7 years now since the 2016 peak. And La Nina may be trying for a 4th year, even with all that “stored ocean heat”!
You should be laughing at the cult nonsense instead of trying to defend it.
It’s get even worse when you learn that there is no science supporting it.
So don’t blame Skeptics for your frustration. Blame your cult for spreading nonsense, and blame yourself for swallowing it.
“We’re going on 7 years now since the 2016 peak.”
So? It was 18 years before the prior annual temperature record was broken (1998). Why should we have expected to see the next record-breaking year in only 7?
But you’ve missed the point, dummy. You’re one who constantly mistakes weather and climate.
We really did have some colder days in Summer just recently than we had last Winter.
‘Skeptics’ would tell us that these cold days mean that Summer is a hoax. If it’s colder in Summer than Winter, then there has been no climate change through the year. Seasons are a hoax!
Going by their daft reasoning, anyway. Any weather that bucks the trend means the trend doesn’t exist. Skeptic “logic” 101.
Barry, it is obvious that you do not understand SPC (or SQC) used for industrial analysis and its relation to scientific data analysis. I was making a valid comparison. It is also obvious that you are not very bright. More likely, making trolling arguments is more important to you than making an intelligent comment. I will end with that.
Appealing to your own ‘expertise’ is a fallacy that might work better if you address the point, Tim, and my point was dead serious. Expecting a smooth rise in temperature with AGW is ignorant and witless. You can read the post again for the reasons why.
Did I touch a nerve? The satellite data show clearly that there cannot be just one effect on any time scale — month to month, year to year, or decade to decade. There have to be many factors including “noise” from random drift (called a random walk) due to the chaotic nature of weather and climate. People claiming a CO2 “signature” using data smoothing are just trying to fool the general public who have no knowledge of the science involved. You spend a lot of time going from comment to comment making almost random trolling arguments. Maybe, if you want some respect, you might try thinking before you type.
“The satellite data show clearly that there cannot be just one effect on any time scale month to month, year to year, or decade to decade.”
And you think this is a revelation? In fact, other influences on various time-scales are discussed at length in the IPCC reports (for example), and have been for decades.
That’s why your insistence that “There are two problems with attempting to label the cause as increasing CO2. It does not show a smooth upward trend,” is a witless straw man, and disinformative to boot.
Let’s be clear – it is only you and other witless ‘sekptics’ that propose CO2 warming should be indicated by a smooth temperature rise. That’s YOUR BS. YOUR straw man. The mainstream climate research community does not make such a daft claim.
TM,
You wrote –
“Put another way, the global warming signal in the bulk atmosphere has risen above the noise of natural variability.”
Well, that’s a pointless piece of nonsense masquerading as a fact, isnt it?
You can’t measure either the “global warming signal”, or the “natural variability”, can you? The Earth cooled for four and a half billion years or so, and you can’t provide a single reason why the planet should miraculously start heating due to the presence of an atmosphere which has existed for a very, very, long time!
I suppose you think that it is due to some recently invented “greenhouse effect”, which is so new that nobody at all can describe what it is or how it works.
Maybe you can resort to some bizarre SkyDragon cult tactics to avoid facing reality? Good luck!
“Well, thats a pointless piece of nonsense masquerading as a fact, isnt it?”
***
Maguff specializes in mindless propaganda.
“Maguff specializes in mindless propaganda.”
Says the man who believes that the earth’s shadow causes the phases of the moon.”
https://www.drroyspencer.com/2021/03/uah-global-temperature-update-for-february-2021-0-20-deg-c/#comment-632695
TM,
Newtons Laws of Motion, and the Law of Universal Gravitation came from a man who believed that base metals could be transmuted into precious metals by means of alchemy, and who calculated the dimensions of the New Jerusalem, based on his thinking about the Temple of Solomon.
Oh well, not everyone is right all the time.
Presumably you don’t care that Newton was a bit “out there” in some respects.
Maybe you are perfect, and have never made a mistake, or got anything wrong. Want to tell me how superior you are, Captain Perfect?
You don’t mind if I have a laugh, do you?
Carry on with the ad homs.
“Maybe you are perfect, and have never made a mistake…”
So you do agree that Gordon Robertson is mistaken in his belief that the earth’s shadow causes the phases of the moon.” Then why don’t you correct him then?
I guess you’d rather have a laugh at his expense!
TM,
“So . . . , then?”
Oooooh! A gotcha!
So, you are admitting that you are not perfect, then?
You may guess what you like. I say what I wish, when I wish, how I wish, and there’s nothing you can do about it.
If you want to keep posting nonsense about “global warming signal[s]”, you are free to do so. I am free to respond as I see fit, and snigger at you as much as I want. That’s fair, isn’t it?
Not a single fact is changed or harmed in any way.
The Earth cooled for about four and a half billion years. If you want to believe that a miracle has occurred to reverse the laws of physics recently, a bit of detail might help.
“So, you are admitting that you are not perfect, then?”
No Swenson, I am not perfect.
I hate to disappoint you, although I’m flattered that you thought I was perfect!
https://www.newsweek.com/climate-activism-isnt-about-planet-its-about-boredom-bourgeoisie-opinion-1773846
The only thing Alexandria Ocasio-Cortez has going for her is a decent pair of boobs, which she likes to emphasize on occasion by wearing tight sweaters. Other than that, she is a major boob.
We had a female Premier here in British Columbia who insisted on displaying her ample cleavage by wearing blouses open to reveal it, even in Parliament. That prompted Richard Branson of Virgin Airlines fame to make her an offer to go skydiving naked.
I am not a misogynist, neither am I an MCP (male chauvinist). I support women in their cause for equality. However, women need to get it that they can use their assets blatantly to gain favour or they can be modest and try to be taken seriously.
AOC is regarded as a Barbie Doll, and she is regarded as such because it seems all she can do is look pretty and play up her physical assets. During the covid crisis, while her fellow New Yorkers were locked down, she was partying at a club in Florida without a mask.
This is typical of the idiots running climate change propaganda. As she states, it’s more important to be morally right, as she sticks out her boobs for everyone to ogle through a tight sweater sized for that purpose.
Clint,
Brilliant essay. With AOC and her acolytes who post here, it is all about the agenda. The irony is AOC believes her evil is moral.
Al Gore at Davos just now – “That’s what’s boiling the oceans, creating these atmospheric rivers, and the rain bombs, and sucking the moisture out of the land, and creating the droughts, and melting the ice and raising the sea level, and causing these waves of climate refugees.”
Another sort of “truth” to join Megan, Harry, and Elon Musk “truth”, by the look of it.
Why worry about facts, when fictional “truths” mean you can reject reality?
The “truth” is out there. Very out there.
swenson…”Thats whats boiling the oceans, creating these atmospheric rivers, and the rain bombs….”
***
Metaphors like atmospheric rivers and bomb cyclones are the latest in climate alarmist terrorism. Here on the ‘Wet’ Coast of Canada, what they now call an atmospheric river had a much friendlier, even affectionate name, ‘the Pineapple Express’.
We laughed about it, but now we are supposed to cower in our homes fearing the weather.
The Pineapple Express had a more formal name, the Japanese Current, along the lines of the Gulf Stream that warms Europe. Now it’s called an atmospheric river.
Have climate alarmists no shame?
Mentioning Al Gore is the climateball equivalent of Godwin’s Law.
La Nia will definitely make it to spring. The Nio Index 3.4 is holding steady at around -1 degree C.
The increase in solar activity will cause La Nia to strengthen, as it will increase the energy of the jet wind.
Jumps in solar activity in this solar cycle cause SOI spikes. Now the SOI will increase again.
A cold front in California and Nevada. Snowstorm in Nevada.
https://i.ibb.co/vvxvWgg/Zrzut-ekranu-2023-01-19-111141.png
The accumulation is just 14 inches away from the total seasonal average of 360 inches, and officials at the Snow Lab say that could be surpassed after a moderate storm moves through the Sierra Wednesday night into Thursday.
Accumulated totals from the lab show that this years snowfall is well above the 30-year seasonal average for this time of year.
Were seeing absolutely astronomical numbers for snowfall this year, said Andrew Schwartz, lead scientist at the lab.
But its not hyper-locally concentrated like last year when the Central Sierra got an abundance of snow in December but the Southern Sierra didnt. This year, the wealth of snow has spread out around the state, including the mountains of Southern California.
https://www.sfchronicle.com/california/article/Sierra-snowfall-totals-pile-up-after-weekend-17723545.php?fbclid=IwAR3sZgm_wa6Ini1xE15RLpaR8iu0o4IKAi7XsUlGv-eoS4kVqZItfiK6dvE
https://cdec.water.ca.gov/resapp/RescondMain
I think we reach average levels soon [updated yesterday}
bill hunter…”There is also the matter of control of the data. As Roy mentions here GHCN is providing less information to the public. Why?”
***
Over at the chiefio site, the owner indicates that 90% of GHCN ‘reporting’ stations have been slashed since 1990.
https://chiefio.wordpress.com/2009/02/24/ghcn-global-historical-climate-network/
NOAA, the owner of GHCN, revealed, circa 2015, they have slashed the number of reporting stations globally from 6000 to less than 1500. Their reason for doing so was never made clear. The reasons they offer in the article make little sense.
That site has since been removed and you have to dig for it.
https://web.archive.org/web/20130216112541/http://www.noaa.gov/features/02_monitoring/weather_stations.html
It turns out, NOAA has been using climate models to replace the station data they have slashed. They take two stations, some 1200 miles apart, then they interpolate actual thermometer readings from those stations to arrive at an averaged value for the synthesized station. Then they homogenize the overall temperature map by adding in the synthesized stations.
For anyone who doubts this kind of chicanery from NOAA, consider their claim that 2014 was the hottest year ever, at the time. It turned out that NOAA made that claim based on a 48% probability the claim was correct. They were outdone by NASA GISS, who made the same claim based on a 38% probability.
Yes it is chicanery.
We don’t need all that adjusting, gridding, and kriging to know if the huge bulk of officially placed thermometers are getting warmer.
Global climate change might affect some areas more than others but the only thing anybody really needs to know is how it has affected them. How can the US be affected by no unnatural change in temperatures when we are being regaled by how those temperature changes has already affected us?
Anybody that buys into that BS has their BS detector turned off.
If they want to tell us how much it has affected somebody else, well use their thermometers to tell us that.
We have the same problem with the angular momentum of the moon. These guys don’t understand mathematics and only believe what their Daddies are telling them.
Hunter
” We have the same problem with the angular momentum of the moon. These guys dont understand mathematics and only believe what their Daddies are telling them. ”
You are such an arrogant and ignorant idiot.
You recently discredited the fantastic work of the astronomer Tobias Mayer he made in 1750 – without ever understanding what he was doing, even though you have read a recent English translation of the most important part of his work.
You dared to denigrate all this as “academic exercise”.
*
Never would people like Robertson, Clint R, Flynnson and you be able to scientifically contradict what hundreds of historical and recent works have shown since centuries.
Some of you even try to cast doubt on Newton’s Principia Scientifica by claiming, despite contradiction, that it was allegedly mistranslated.
Describing the motions of the Moon as like a ball on a string or similar nonsense: that’s all you can do.
This is just plain shameful.
binny…”You recently discredited the fantastic work of the astronomer Tobias Mayer he made in 1750 without ever understanding what he was doing…”
***
I am still breathlessly awaiting a quote from Meyer in which he explains how the Moon rotates on a local axis while keeping the same face always pointed at Earth. He barely touches on an alleged lunar rotation never mind expands on it.
Exactly Gordon. He is so full of shit. Mayer made precise measurements of the moon. The only way that he could possibly think we are refuting Mayer’s work is if he was still unable to grasp the the simple fact that the non-spinner position is: “yes the moon rotates. It rotates on the COM of the earth.”
It is really hard to understand how anybody could fail to grasp this simple fact after having been so long as he has been in the discussion. Is it stupidity or is it just hard to see from that suck up posture he has adopted. It seems his argument has devolved down to trying to throw authority around any way he can dream up. Just more proof of what a suck up he is.
https://www.drroyspencer.com/2023/01/urbanization-effects-on-ghcn-temperature-trends-part-i-the-urbanization-characteristics-of-the-ghcn-stations/#comment-1434955
Pretty amazing how they changed the subject eh Gordon?
Gill, Gill,
Who peddled the Moon in this thread, again?
Too bad Willard. When one is a repeat offender you have to pay a higher price.
In the legal system if you were young when you committed the crime there is a chance to get it expunged from your records. In here there is no chance of that. Your stupidity is recorded for posterity.
Nice try, Gill.
Once again Gordon lies about NOAA ‘slashing’ thousands of data station records. It’s been explained why there is a drop-off at the near-end of the record, but Gordon conveniently ‘forgets’ every few months.
He also ‘forgets’ how the ranking system works for the warmest/coolest years. Yes, NOAA gave a 48% probability that 2014 was the then warmest year. But the next highest year had an even lower probability.
But after dozens of times explaining, it’s more than enough now just to call out his BS.
“Yes, NOAA gave a 48% probability that 2014 was the then warmest year. But the next highest year had an even lower probability.
***
Thanks for confirming NOAA cheating.
How did they cheat? Their ranking system was explained in the handout to the media. It was also explained in their annual report. And this is why you know about it – because NOAA shared that information freely. The media simply didn’t report it.
Here are the briefing notes that the press saw and had explained to them.
https://www.ncei.noaa.gov/access/monitoring/monthly-report/briefings/201501.pdf
Tom Carl explained the uncertainty rankings to the press during a teleconference with them. Starts at 14:05.
https://web.archive.org/web/20150313053244/http://www.noaanews.noaa.gov/advisories/011415-advisory-2014-global-climatehighlights.html
There has been a sudden warming in the upper stratosphere and a weakening of the polar vortex. It promises to be an interesting continuation of winter in the northern hemisphere.
https://www.cpc.ncep.noaa.gov/products/stratosphere/strat-trop/gif_files/time_pres_UGRD_ANOM_JFM_NH_2023.png
ren…the only way this winter will interest me is if it remains mild. Till recently, it has been ridiculously colder than normal.
entropic…”Infrared from CO2 creates a warm surface film which makes it harder for heat to flow from the ocean to the atmosphere. Less heat flow, warmer ocean”.
***
Would you kindly explain how heat can be transferred from a colder atmosphere to a warmer ocean? If you insist on using the concept of a net balance of energy, would you kindly explain how that works?
Please remember, the 2nd law of thermodyamics applies only to heat transfers. It cannot be applied to radiation fluxes. There is nothing in the 2nd law about net energy.
Yes. I made the ocean cooler than the atmosphere(caffeine deficiency). I put up a correction. Evidently you didn’t notice.
I saw your correction. I am still awaiting an explanation as to how radiation from a cooler atmosphere can warm a thin layer of the ocean.
EM,
You wrote –
“Infrared from CO2 creates a warm surface film which makes it harder for heat to flow from the ocean to the atmosphere. Less heat flow, warmer ocean.”
That makes precisely no sense at all. If the surface is hotter than the water beneath it, the colder water has no “heat flow” at all. The cold water does not magically heat up – all by itself. It doesn’t even heat up because it is covered with hot water! The hot water merely radiates its heat away, and cools down in the absence of a heat source like the Sun.
Anybody who has jumped into a cool lake when the sun is shining brightly, and the surface water is nice and warm, gets a shock as they descend into the cold water just below the hot surface. Icebergs have freshwater on their surface, when the sun is bright enough. The icebergs don’t “warm up” from the hot liquid water. As soon as the sunlight goes, the water freezes again.
Your efforts to deny reality through inventing your own physical laws aren’t working.
No GHE. You can’t even describe this mythical effect, can you? Nobody can.
From Bill Hunter’s reference to kriging, a term that describes the averaging of geographic elevations by sampling some and inferring the rest.
Kriging is applied to temperatures as well, as follows…
https://towardsdatascience.com/kriging-the-french-temperatures-f0389ca908dd?gi=0fcb5b071f15
“So how to create a temperature map if the stations do not regularly cover the whole country? The technique to do so is named interpolation in a general way. The global idea is the following: one pixel indicates
-either an exact measured value if a station exists at its corresponding geographic coordinate,
-or an interpolated value otherwise, meaning that the value is guessed, based on what the nearby stations measure”.
There it is folks, the method used by NOAA, GISS, Had-crut, etc., to ***GUESS*** global temperatures.
NOAA has admitted to having used 6000 reporting stations to cover the entire global landmass but have reduced those stations to less than 1500 stations globally. For example, they use only 3 stations to cover the state of California and all three are near the warmer ocean. In the Canadian Arctic, they use only 1 station.
Binny will rush in, without thinking, and claim GHCN has thousands of stations. The thing he fails to grasp is that most are not used. They have been replaced by climate models that synthesize temperatures in lieu of real thermometer readings.
In the Vancouver, Canada area, temperatures during summer can vary from 20C on the coast to 30C inland some 50 miles away. Go 150 miles NE to a desert area and the temperatures can easily be in the 40C range. That’s a difference of 20C over 150 miles.
Let’s look at that globally. The land surface area is 510 million km^2. With 1500 stations covering that area, we have 510 x 10^6 km^2/1.5 x 10^3 station = 340 x 103 km/station.
One thermometer covers 340,000 km^2!!!!!!
The area of British Columbia is about 945 x 10^3 km^2, which would mean, on average, there are three thermometers measuring the entire province. Yet, as I have just pointed out, temperatures can vary 20C during summer between areas that are 150 miles apart.
Heck, temperatures can vary a few degrees in the Vancouver area alone. When I wrote to the federal agency in charge of temperature tracking in Canada, as to why there is one thermometer at Vancouver International area and none on the local mountains at 3500 feet, he seemed amused.
These people don’t care, they are all climate alarmists and only too happy to spread climate alarm propaganda.
Robertson the arrogant ignoramus spreads again his incompetent nonsense.
Beginning with
” Lets look at that globally. The land surface area is 510 million km^2. ”
That is a small mistake with regard to the real problem of the paucity of stations worldwide, but is typical for Robertson.
*
Then comes his further nonsense about Canada’s western province British Columbia, and its capital Vancouver.
In the worldwide station set GHCN daily, Canada has in the sum for the entire measurement period 6354 stations, 1023 of which were active in 2022.
Of the stations in Canada, 1253 are located in British Columbia (189 active in 2022), and therein, 21 (4 active in 2022) are in Vancouver.
*
People like Robertson discredit everything, though knowing nothing of all that.
You don’t need stations everywhere!
USCRN, the set of most pristine stations in the US, has only 133 stations for 9 Mkm^2; nevertheless, their average in the years 2005-2022 gives a pretty good picture of the country, quite similar to what thousands of GHCN daily stations in the US deliver.
*
The best example for the redundancy of worldwide data is a comparison of UAH’s full grid data (9504 2.5 degree grid cells worldwide) to a laughable subset of the grid (256 evenly distributed cells) I made in 2019:
https://drive.google.com/file/d/1Ij_jKmyrBJOMUdwtRP6NYqyGXibNPnRb/view
*
Don’t trust ignoramuses like Robertson, a guy who is not even able to accurately compare NOAA anomalies computed wrt the mean of 1901-2000 with UAH anomalies made wrt the mean of 1991-2020, and discredits the work of those who can do such work!
Unimaginable.
Binny,
You wrote –
” . . nevertheless, their average in the years 2005-2022 gives a pretty good picture of the country, quite similar to what thousands of GHCN daily stations in the US deliver.”
Good enough for a SkyDragon cultist, anyway.
One completely meaningless average close enough to another completely meaningless average.
Still predicting the future by looking at the past, are you?
Good luck with that!
binny…”Then comes his further nonsense about Canadas western province British Columbia, and its capital Vancouver”.
***
Actually, the capital of BC is Victoria.
Once again, you miss the point that over 90% of GHCN stations have not been used by NOAA since 1990.
“Once again, you miss the point that over 90% of GHCN stations have not been used by NOAA since 1990.”
That’s because those stations either no longer exist or do not provide regular updates to NOAA, which actively sought the historical records in the mid-1990s.
Currently, GHCN monthly gets updates from over 3000 weather stations in real time, but has a database of historical records covering more than 10,0000 weather stations.
This is 2000 more stations updating in real-time than 20 years ago, and historical data from 3000 more stations added to the list since 20 years ago.
As usual, Robertson gets it arse-about. NOAA has added stations, not deleted them.
“As usual, Robertson gets it arse-about. NOAA has added stations, not deleted them”.
***
Denial is a bitter pill to swallow. It states right on the NOAA page, circa 2015, that NOAA has slashed global stations from 6000 to less than 1500.
Gordon is not good at maths or statistics. He does not know that the confidence in a global mean temperature is proportional to 1/√n.
Plot confidence in the mean against sample size n and you get a rectangular hyperbola.
Once your sample size is large enough to reach the inflection point of the hyperbole the graph flattens and any further increase in sample size has very little effect on the quality of the mean.
For station temperature data the inflection point is 1500 stations. Hmmm.
” It states right on the NOAA page, circa 2015… ”
One more stupid lie by manipulator Robertson.
The ‘circa 2015’ is the date where Robertson looks at the page in the Wayback machine.
The very first appearance date for the page however is… 2010!
And that is the date of its first saving into the Wayback machine, what means that its original publication date is even earlier, probably 2009.
” Denial is a bitter pill to swallow. ”
Says this blog’s greatest, loudest denial specialist.
He denies virus existence, Moon’s spin about its polar axis, Einstein’s time dilation and gravity addenda to Newton’s etc, results posted by commenters of course included.
All that on the base of single voices like contrarian blogs he regularly appeals to the ‘authority’ of.
“It states right on the NOAA page, circa 2015, that NOAA has slashed global stations from 6000 to less than 1500.”
No it doesn’t. You are delusional.
https://web.archive.org/web/20130216112541/http://www.noaa.gov/features/02_monitoring/weather_stations.html
That’s the page. Let’s see where they said they actively slashed stations.
“The physical number of weather stations has shrunk as modern technology improved and some of the older outposts were no longer accessible in real time.”
Are you delusional?
So did they add stations? On the same page:
“However, over time, the data record for surface temperatures has actually grown, thanks to the digitization of historical books and logs, as well as international data contributions.”
Exactly as you’ve been told countless times. They added historical data from old stations that are not in use or don’t provide data in real time.
So what of the difference between 6000 stations and 1500 stations?
“The 1,500 real-time stations that we rely on today are in locations where NOAA scientists can access information on the 8th of each month.”
At the time that web page was written NOAA only had 1500 weather stations worldwide that sent them data once a month.
Before that there were fewer stations that sent data once a month to NOAA.
So where did the other 4500 stations come from?
From the effort to collect all the historical data from around the world that didn’t and never had updated to NOAA once a month.
Yes, they ADDED historical data. They DIDN’T deliberately delete thousands of stations. They didn’t have them to delete in the first place. They added them. But these stations were not of the 1500 that were updating once a month.
And this is explained in the methods paper from 1997, when all that vast amount of historical data was added.
https://www.ncei.noaa.gov/monitoring-content/monitoring-references/docs/peterson-vose-1997.pdf
Robertson
” Once again, you miss the point that over 90% of GHCN stations have not been used by NOAA since 1990. ”
You are really thick, Robertson, and an absolute ignorant liar.
You don’t know anything about NOAA’s weather stations.
I have explained to you many times that you
– rely on wrong information from contrarian blogs;
– totally misrepresent what NOAA wrote about having given up many weather stations (about 4,500) in GHCN V2 due to the fact that it was impossible to keep using them because they lacked automated transmission.
You intentionally ignore the rest of the text on the page, in which NOAA explained to have replaced them by even more other new stations.
GHCN V3 has over 7,000 stations which were all in use.
GHCN daily has worldwide over 100,000 weather stations, 40,000 of which dedicated to temperature measurements.
GHCN V4 has over 25,000 stations (a subset of GHCN daily).
*
You are such a dumb liar, Robertson.
The very best of the story is that if NOAA had kept using the old 4,500 stations using fax or telex communication, you coward would be the very first one to publicly accuse them of inefficiency!
“totally misrepresent what NOAA wrote about having given up many weather stations (about 4,500) in GHCN V2 due to the fact that it was impossible to keep using them because they lacked automated transmission.”
Yes. It’s a straightforward explanation, it comes from the 1997 method paper that describes the effort to collect all that historical data, and yet Roberson is completely blind to this. He’s been told. He’s been given the paper to read. He just has his fingers in his ears on this. He can’t let facts intrude on his dogma, so he simply ignores them.
bindidon says:
”Dont trust ignoramuses like Robertson, a guy who is not even able to accurately compare NOAA anomalies computed wrt the mean of 1901-2000 with UAH anomalies made wrt the mean of 1991-2020, and discredits the work of those who can do such work!”
If thats the best argument you have you don’t have an argument.
You act like a man with an agenda. Bottom line is nobody is dependable, institutions, corporations, individuals. The only thing that matters is the entire body of knowledge and evidence.
Here is an excellent interview with a great American scholar.
I am starting at a good juncture that talks about institutions.
https://youtu.be/mS5WYp5xmvI?t=298
The important thing to know is none of this is unusual or fraudulent. It just expresses what goes on in this forum of how people defend their positions even when it becomes untenable and the reasons why.
The entire interview is incredibly good because it puts a finger on what we need to pay attention to. Sowell is not anti-institution nor is he all for institutions. You can say that about any special interest group in society and about individuals when it begins to approach what sustains them.
IMO, you posts are illuminating on the issues of gridded vs ungridded datasets. There is no need to do gridding for the purpose of anomalies. Gridding gets to average absolute temperature but what it introduces to anomalies is more bias than more information. The reason for that is obvious to anybody with experience in measuring the accuracy of data. Gridding involves an unlimited number of choices. Do you use average numbers, do you use min-max, do you use hourly data. How big are your grids. What are your unlimited number of choices for kriging.
Anybody that has done any of this work from an independent point of view knows how much bias leaks into the decisions because each choice affects the outcome. NOAA won’t even release unadjusted numbers. Why? Because they are protecting their territory as any normal sane person would do.
Thomas Sowell isn’t scolding the Labor Department so much as pointing out they have a good reason to protect their territory.
You want to change that? Isn’t going to happen. All you can do is shine some light on it so that people become aware of the risks in believing it. In fact, estimating what that risk is likely to be is the first thing an auditor sets out to document from the start of an audit. A fact and circumstances discussion about the motivations of the people preparing the data the auditor is going to inspect. I have seen a few instances of fraud but its a small number compared to everything I have looked at. Now bias? I can’t recall an audit where we didn’t root out some bias that led to some adjustments.
Gordon Robertson says:
”Kriging is applied to temperatures as well, as follows
https://towardsdatascience.com/kriging-the-french-temperatures-f0389ca908dd?gi=0fcb5b071f15
”So how to create a temperature map if the stations do not regularly cover the whole country? The technique to do so is named interpolation in a general way. The global idea is the following: one pixel indicates
-either an exact measured value if a station exists at its corresponding geographic coordinate,
-or an interpolated value otherwise, meaning that the value is guessed, based on what the nearby stations measure”.”
—————-
It really is funny to see the spinners do their whirling dervish imitations any time anybody suggests that the science they are banking on is far from perfect.
The above is actually a strong vote for the satellite approach to measuring the lower troposphere where the measurements are randome and of mixed area in the cone of the sensors. . . .as opposed the record sitting ontop of 1890 brick firestation in a small town urban area. (for the humorless thats obviously just a colorful characterization)
Further, USCRN appears to be a well designed system and the pairwise groundtruthing installed within it is yielding results.
https://journals.ametsoc.org/view/journals/apme/58/6/jamc-d-19-0002.1.xml
Roy says his UAH is very close to it. And since Roy has ENSO smoothing techniques he would know.
worth repeating….
Tim S…”The climate change movement loses credibility in two very important ways. First, the policy statements of the IPCC and other organizations clearly state that redistribution of wealth is an important part of their agenda they are political. Second, and most important is the failure to promote and endorse a complete and open examination of ALL of the science. Science that is limited in scope is not science at all. Dr. Spencer is openly criticized for doing genuine science, and that is shameful”.
***
I might ad that the IPCC are corrupt. They use an ad hoc statistical system for rating probabilities, in which most of their opinions are rated Likely and Most Likely and any facts that disagree with them are rated Unlikely or Most Unlikely.
They claim the anthropogenic theory is irrevocable when it has yet to be proved. There most egregious chicanery, however is reserved for the manner in which they openly falsify the review reports. Ironically, they don’t even try to hide their cheating.
The IPCC reviews feature 2500 reviewers who are appointed by politically appointed Lead Authors. Before the main report is released from the 2500 reviewers, the Summary for Policymakers, written by 50 Lead Authors, is released in advance. Then the main report written by 2500 reviewers is amended to agree with the Summary.
Huh!!!
Absolute corruption!!! The 2500 reviewers can protest but the protests generally fall on deaf ears.
A perfect example of that corruptions occurred circa 2008 when the IPCC claimed it was 90% likely that humans are causing global warming. Richard Lindzen reported that was not the opinion of the 2500 reviewers, many of whom wanted to wait and see what developed. It was the opinion of the 50 Lead Authors who wrote the Summary.
Later, with the greatest of cheek, without proof, they upped the percentage to 95%.
The truth is, the IPCC has not the slightest proof that humans are warming the atmosphere. They lie through their teeth, but the proof remains elusive.
How much misinformation can you pack into one post, Robertson?
For starters you have no idea how reviewers are selected.
https://www.ipcc.ch/2020/12/04/what-is-an-expert-reviewer-of-ipcc-reports/
Short story – anyone can review if they have a relevant qualification in the topic.
If readers just assume that nearly everything you say is nonsense – and it really is – it would save them a lot of time.
“anyone can review if they have a relevant qualification in the topic.”
***
Of course they can, they are just not included in the Summary, which is written by 50 lead authors. Politicians read the Summary. Get it…Summary for Policymakers?
But wait…there’s more. Even if a reviewer gets his/her opinions admitted to the main report, the opinion will be changed to suit the Summary.
The politicians know what they want to hear ahead of time and the IPCC tells them what they want to hear.
The IPCC is corrupt.
“The politicians know what they want to hear ahead of time and the IPCC tells them what they want to hear. ”
Are there many such? Most politicians are very reluctant to subject their electorates to the costs of global warming mitigation. They find excuses not to follow the policy options that the IPCC suggest are necessary to mitigate climate change.
Like Donald Trump, who tried to edit global warming out of government websites, fire the scientists and pack organisations like the EPA and his science advisors with denialists.
One of my measures of a politician is his staff and his advisors. Are they people who will tell him what he needs to know, rather than what he wants to hear?
ent…”Most politicians are very reluctant to subject their electorates to the costs of global warming mitigation”.
***
Au contraire. As witnessed by the recent economic trade conference in Davos, most politicians are only too willing to use the scare of climate change to further a move toward globalization.
Essentially, these idiots are usurping democracy and running their own agendas. Trump was one of the only leaders to call a spade a spade and try to stop it.
“Of course they can”
So you were wrong that reviewers were picked by political masters, but rather than saying so you switched subjects to lead authors.
“they are just not included in the Summary, which is written by 50 lead authors. Politicians read the Summary. Get itSummary for Policymakers?”
The lead authors are scientists from various countries, including countries with governments that (have) downplay(ed) or dismiss(ed) AGW.
“Even if a reviewer gets his/her opinions admitted to the main report”
Reviewers text never makes it into the report. You have no idea how it works. Reviewer suggestions are considered and if they have merit, may influence later drafts.
“the opinion will be changed to suit the Summary.”
You have no idea how this works.
Perhaps read from source instead of your imagination or whatever blog has mistaught you.
https://www.ipcc.ch/about/preparingreports/
At least get the basics right. Then your criticisms might have a chance of being taken seriously.
Barry,
There isn’t any historical evidence that CO2 causes temperature. The basics are that CO2 follows temperature on short and long scales. That’s the evidence. That’s a fact.
Troglodyte,
If your talking point can be refuted with a simple SkS entry:
https://climatechangeconnection.org/science/what-about-lag-time/
you lost.
And no, that wasnt the SkS entry.
It was something even troglodytes could understand.
The main factors which affect average global temperature are plate tectonics, orbital cycles, solar insolation, volcanic activity, albedo, GHGs and land use.
The first five are natural. When you measure them, their effects are neutral or driving slow cooling.
We are changing three of them, in ways which cause global warming.
Albedo is sunlight reflected back into space. Lower the albedo, more sunlight reaches the surface and increases the temperature. We are decreasing albedo directly and indirectly. Reduced fossil burn is decreasing particle density In the atmosphere. Global warming is decreasing ice cover and ice albedo.
Increasing GHGs are reducing heat loss to space and increasing back radiation, causing heat to accumulate.
Land use changes, mostly agriculture and UHI decrease reflection from the surface and increase local temperatures.
The denialist straw man that CO2 is the only warming agent is nonsense. It is the largest contributor and the factor most easily controlled, but it is not the only factor.
Similarly Dr Spencer’s article does not ring true. It is useful to recognise the effect of UHI if you want to separate it from from the effects of changing GHGs and albedo. It is disingenuous to present a subtext that UHI is not a human contributor to global warming and should therefore be edited out.
The reluctance of sceptics to accept the 40.3C RAF Coningsby UK record is also disingenuous. In the warmest UK year on record you would reasonably expect new records, especially where local effects like UHI amplify the warming.
Ent loves to make up crap:
“The denialist straw man that CO2 is the only warming agent is nonsense.”
WRONG again, Ent. What kind of kinky, twisted logic is that? Keyboarding ain’t science.
(Ent is also the one that made up the crap that passenger jets fly backwards.)
“The main factors which affect average global temperature are plate tectonics, orbital cycles, solar insolation, volcanic activity, albedo, GHGs and land use.”
Plate tectonic activity is gradual process which changes geographical features of our world which over millions of year has resulted in our present ice house global climate world.
The main aspect of global climate is the world’s ocean and the changes in geographical features over tens of millions of years has resulted in a cold ocean with average temperature of 3.5 C which has caused our average global temperature of about 15 C.
The average global surface air temperature of 15 C has a average global ocean surface air temperature of about 17 C and average global land surface air temperature of about 10 C.
The ice house global climate temperature is largely about the air temperature outside the tropical region.
The tropical region is warmed the most by the energy of our sun.
The tropical region is about 40% of the Earth’s entire surface, and remains warm despite Earth being in an Ice Age.
The changes in the Ice Age, which called glaciation and interglacial period has large changes in 60% of Earth surface which outside of the tropics.
The tropics remain fairly constant in terms air temperatures and 60% of world can get very cold. Presently it is quite cold: Canada and Russia average is around -3 C, China about 8 C, US is about 11 C, and Europe averages around 9 C. And mostly world’s land mass is in the Northern Hemisphere, India which in Northern Hemisphere and near tropics, has average temperature of about 25 C. Land areas in tropics are more than 20 C and tropical surface ocean averages about 26 C and ocean surface temperature outside of tropics is about 11 C.
Europe would much colder were the ocean not warming it, and ocean in general warms land areas.
And if average temperature of ocean that is about 3.5 C was warmer, it causes the land area in 60% of the world to be warmer.
The warmest times in interglacial periods has an Ocean 4 C or warmer,
and slightly warmer ocean large effect in warming 60% of land area in the world. And this is effected by the orbital cycles.
“The tropical region is about 40% of the Earths entire surface”
If you define, as many do. the tropics as being between 30 North to 30 South then that is 50% of the Earth’s surface, or half.
Well I say tropical ocean about 40% which is fudging it more the 23.5 degrees.
But in terms of tropics absorbing more half of sunlight reaching Earth, it mean 40% of earth surface absorbs more 1/2 sunlight of 100% of the Earth surface.
Or the 60% doesn’t get much sunlight reaching the surface. But at 34.6 degree where I am, it gets enough- at least, when near the summer. Now, it well freezing at night, which doesn’t happen in tropics, unless you at high elevation. I am at about 2000 feet, and LA [though I am part of LA county] which is near the coast, is not freezing.
Oh, I guess sahara desert and other deserts in tropic does freeze.
Anyhow, no snow, yet, despite the cold- when it’s been raining, it warms up and only snows on the hills around here- and not a lot.
gb…”Plate tectonic activity is gradual process which changes geographical features of our world which over millions of year…”
***
gb…the movement of continental plates is a theory. The theory has become a paradigm, it has not been proved.
No one has ever witnessed a plate move. They are located too far under the surface to be observed. One of the bases of the theory is a trench down the middle of the Atlantic where volcanic activity is present. Iceland sits near the trench. Proof of such motion is based on Earth’s magnetic field aligning molecules in molten lava near the trench. However, when the magnetism is followed closer to shore it disappears.
Not only that, the theory is based on convection of solid matter. In other words, molten stone from below is pushed up in the mid-ocean trench then flows toward shore, where it allegedly becomes subducted, that is dragged under the surface. It is alleged that such a motion of one plate under another cause earthquakes and the ring of fire volcanic activity around the Pacific Rim.
The problem with that theory is how does solid stone, cooled by the ocean and under immense pressure, flow at all?
Here’s a decent article on the subject that covers it objectively.
https://arxiv.org/ftp/physics/papers/0510/0510090.pdf
— Gordon Robertson says:
January 20, 2023 at 3:19 PM
gbPlate tectonic activity is gradual process which changes geographical features of our world which over millions of year
***
gbthe movement of continental plates is a theory. The theory has become a paradigm, it has not been proved.
No one has ever witnessed a plate move.–
Well you can’t prove any theory, you only disprove theories, and just take one guy to do.
I know no guy who has.
Gordon,
From your link –
“In plate tectonics theory, basalt rock, observed erupting from the mid-oceanic ridges, is thought to creep slowly across the ocean basin and to subduct, to plunge into the Earth, typically into submarine trenches.”
Not quite my understanding, but I may be wrong.
GPS measurements show that the continent of Australia is proceeding majestically in a north-north-easterly direction at about 7 cm/year. The UK is slowly rolling over, more or less in place, and marine fossils are found at altitudes over 6000 m.
I accept that continents move, bob up and down, and generally do as they wish.
As to theory, nothing completely explains why and how this happens. I have my own ideas.
gbaikie says:
January 20, 2023 at 6:12 PM
Gordon Robertson says:
January 20, 2023 at 3:19 PM
gbPlate tectonic activity is gradual process which changes geographical features of our world which over millions of year
***
gbthe movement of continental plates is a theory. The theory has become a paradigm, it has not been proved.
No one has ever witnessed a plate move.
Hmm, I was wondering. So I think the world has change via plate tectonic activity and related to this, I believe it’s fact that we in ice age,
starting 33.9 million and last few million has the coldest time in this ice age.
But if you don’t think the world has changed over tens of millions, it seems you don’t think we living in Ice Age.
Or, do think Earth has always been this cold?
Is that we are living in an ice age, a fact or not?
ent…”Increasing GHGs are reducing heat loss to space and increasing back radiation, causing heat to accumulate”.
***
You don’t have a clue as to the marked difference between thermal energy and electromagnetic energy.
Heat is lost at the surface as it is converted to EM. 95% of the EM is lost to space and only about 5% is captured by GHGs. Even if EM from a cooler atmosphere could be absorbed by a warmer surface, you are returning 5% of what was emitted and claiming that can raise the temperature of the surface beyond the temperature it is heated by solar energy.
Nasty physics and math.
Swenson wrote: “If you want to keep posting nonsense about ‘global warming signal[s]’, you are free to do so.”
Despite your best wishes, it is not nonsense.
As Dr Roy Spencer stated it is the crux of the issue regarding science and scientists’ duty to warn.
I will keep posting about it because it is on topic and important.
As Swenson stated, you are free to continue.
But the problem Alarmists have is in not wanting more coal burned. We know that emissions from coal can definitely cool the planet. So people that fear global warming should be advocating for more coal.
And, if you don’t like coal, advocate for nuclear. Every comment Alarmists make here should include advocacy for nukes, unless they have a political agenda.
Nobody died and made you King of this sub-thread.
Coal plants emit CO2 as well as two kinds of aerosols, black carbon (soot), and sulfates (sulfur particles).
Sulfates have a cooling effect but they only stay in the troposphere a few days. CO2 stays in the atmosphere several hundred years. Also sulfates hydrate they form sulfuric acid.
Why do you hate science, and clean air?
Correct, burning coal has a cooling effect.
Plus, there’s the benefit of additional CO2 plant food.
Are you saying you prefer coal over nuclear?
some idiot…”CO2 stays in the atmosphere several hundred years”.
***
Proof, Mr. Idiot? Do CO2 molecules come with date labels on them?
Is the insolent tone necessary?
There are no good answers to bad questions.
Care to rephrase in scientific terms?
“Is the insolent tone necessary?”
***
Yes…you alarmist idiots need to be addressed with the disdain your deserve. However, someone like you who asks why we skeptics hate science and clean air deserves special treatment.
We skeptics offer science in our responses and we are met with pseudo-science in return. You nor any of your alarmist friends can offer any proof that any climate change is occurring never mind the catastrophic variety.
Burning coal has been called the Faustian Bargain.
The CO2 strengthens the greenhouse effect and causes long term warming.
The smoke and sulphur increase albedo and causes short term cooling which cancels out some of the CO2 warming.
As long as you keep burning coal, you can fool yourself that it’s not that bad.
As soon as you stop the albedo decreases and you get hit by the full effect of the CO2 warming. The longer you burn, the worse the final warming.
The Warmistas recognise this and want to stop burning coal as soon as possible to minimise the long term damage.
The coolistas want to burn, baby, burn. Take the short term profit and let somebody else cope with the damage.
ent…”The CO2 strengthens the greenhouse effect and causes long term warming”.
***
I am still awaiting your proof of a greenhouse effect in the atmosphere. In a real greenhouse, it is the glass in the greenhouse that causes it. The glass passes SW solar then traps heated air molecules.
Last time I looked there were not glass roofs in the atmosphere.
It’s a metaphor, you gobshite.
Ent, if you oppose coal, gas, oil, and nukes, you’ve just shut down modern civilization.
That was your agenda all along, huh?
ent isn’t worried, they have it covered. They plan to burn down all the trees as biofuel.
Funny how you can add ‘bio’ before a CO2 source and it no longer becomes a GHG.
I’ve no objection to nuclear.
Nor do I want to shut down civilization.I want it to move beyond fossil fuels into nuclear and renewables and survive.
If civilization cannot function without coal, gas and oil it will collapse when they run out. What do you suggest we do about it?
ent…”Nor do I want to shut down civilization.I want it to move beyond fossil fuels into nuclear and renewables and survive”.
***
You are being duped by idiots who are on an entirely different agenda. AOC, the Barbie Doll congresswoman, one of your leaders, thinks it is not important to be factually correct, but morally correct.
As a Barbie Doll, AOC fails to grasp the implication. If it is OK to be morally right, how can it be moral to tell lies about science?
“If civilization cannot function without coal, gas and oil it will collapse when they run out. What do you suggest we do about it?”
China burning more coal than entire world, and paying $400 per ton,
and I think they are at Peak Coal, but I could be wrong, maybe they will never run out coal.
US it is reported, has far more coal than China.
Does any know when Europe going to run out coal- cause it’s burning a lot also, I hear.
We could live somewhere else where it’s warmer, we use a lot energy to keep warm enough.
It seems Mars would be warmer than Earth.
I also think ocean settlements on Earth could use less energy.
I would say we live in the orbit of Venus, but we have failed to test artificial gravity. I would suggest spending more on NASA, but they seem incompetent- never tested artificial gravity and done lots stupid things. Likewise I suggest the Dept Energy which has bigger budget than NASA, though has done far less than the incompetent NASA.
If DOE was competent more money should be spent on determining how to mine ocean methane deposits. That or allow people to own areas where they are methane ocean deposits, so that smarter people could mine it.
One thing about Venus orbit, you would have any governmental monopolies controlling energy, as one really has free sunlight, very unlike living on Earth’s cold surface.
But, don’t have live in space to have endless amounts energy, you just need to lower launch costs.
NASA apparently wants of lower launch cost, but what do, indicates they really want to do it. China, and Russia can do it. Europe at one point in time did it. US military has done it, but NASA has never done it.
NASA for decades said want to send crew to Mars- but had no way to do it. The more they couldn’t do, the more they said they wanted to do- endlessly, and being really stupid.
Starship could a way to do, and now, NASA saying it will long time before crew can sent to Mars.
Government lie.
Considering that, maybe shortage of energy is to make current energy more expensive. Anyhow peak anything has gone out fashion lately.
And it seems peak not enough people as next fashion- China has already started, as has other countries.
So you’d force civilization to shut down now instead of a thousand years when it runs out of fossil fuels? That’s your agenda? Brilliant.
Antman and his ilk will have objections to nuclear once they have wiped out the fossil fuel industry. It is all about the agenda.
Troglodyte wants nukes and wants deregulation.
A 8 yo in a 80 yo suit.
binny…”You dont know anything about NOAAs weather stations.
I have explained to you many times…”
***
Receiving advice from you is like receiving advice from someone in a lunatic asylum. I offer you a link in which NOAA admits slashing their global surface station count from 6000 to less than 1500 and you still rave about 100s of thousands of stations.
https://web.archive.org/web/20130216112541/http://www.noaa.gov/features/02_monitoring/weather_stations.html
“NOAA Weather Stations
Determining Global Temperature
Q. Why is NOAA using fewer weather stations to measure surface temperature around the globe from 6,000 to less than 1,500?
The physical number of weather stations has shrunk as modern technology improved and some of the older outposts were no longer accessible in real time”.
*************
Could they state it any more plainly? Do you want me to translate it to German. Then again, I’d have to translate it to Australian for Barry.
NOAA states…”The physical number of weather stations has shrunk as modern technology improved…”
Duh!!! Translated, it says, as it becomes easier to communicate between stations, we have reduced the number of stations. Only blatant cheaters would summon such logic.
NOAA does not say that they slashed stations in that brief. They say that they added them.
Your ‘translation’ is simply fabrication.
It’s really simple.
NOAA had about 1500 weather stations reporting to them in real time, on the 8th of every month.
The other 4500 stations came from historical records that took several years to collate in the mid-90s. This was all from stations that did not and never had reported to NOAA in real time.
The 1500 stations continued to report in real time. This is why we see larger station counts earlier in the record.
As they say in the webpage you cite, they ADDED stations from historical records.
“However, over time, the data record for surface temperatures has actually grown, thanks to the digitization of historical books and logs, as well as international data contributions. The 1,500 real-time stations that we rely on today are in locations where NOAA scientists can access information on the 8th of each month.”
The great alarmist promoter, Entropic, offers this response to me re proof of the GHE.
“Its a metaphor, you gobshite”.
So, Entropic is admitting the greenhouse effect is a metaphor, meaning it is not literally true.
Thanks…the first honest answer supplied by the alarmist contingent.
BTW, Ent, is the alleged rotation of the Moon a metaphor as well? Is there anything your crowd says that is honest?
So we can add the concept of metaphor to the list of things that Gordon Robertson does not understand.
You were the one who called the GHE a metaphor. I merely pointed out your tendency to propaganda.
I seriously don’t understand how a person claiming to have intelligence could get sucked in by alarmist gibberish.
“I seriously dont understand”
Yes, we’ve noticed.
Anything but answer the question. Prove there is a greenhouse effect. Thus far, all you have corroborated is that the GHE is a metaphor. I know you are frustrated that you cannot explain the GHE, based on your accompanying insult.
Then you accuse me of not understanding a metaphor, you hideous orangitan.
Have you noticed you don’t understand?
Gordon Robertson says:
“Prove there is a greenhouse effect.”
You’re a fine one to be making demands!
Prove the Earth’s shadow causes the Moon’s phases
https://www.drroyspencer.com/2021/03/uah-global-temperature-update-for-february-2021-0-20-deg-c/#comment-632695
EM,
You must be suffering from an attack of “whataboutism”.
Try another diversion, and hope nobody notices that you can’t even describe the GHE!
Or you can just keep whinnying about what you believe other people don’t know.
That might help disguise your ignorance and stupidity, do you think?
Wiltard, McGoofin, and Entman don’t have to prove there is a GHE to achieve their goals. They only have to see their agenda advanced. It isn’t about science. It is about the agenda, which is political. It is an evil agenda.
Troglodytes sooner or later die, usually sooner:
https://www.nbcnews.com/health/health-news/covid-death-rates-higher-republicans-democrats-why-rcna50883
binny…”He denies virus existence, Moons spin about its polar axis, Einsteins time dilation and gravity addenda to Newtons etc, results posted by commenters of course included”.
***
Thanks for inviting me to comment.
I have never denied virus existence. I have merely pointed to articles by an expert in virology, Dr. Stefan Lanka, who also does not deny that a virus exists. In fact, he discovered the first virus in the ocean.
Lanka has gone through papers for each popular virus, as an expert, and found none of the papers have isolated a virus. He proved that the measles virus claimed discovery is bogus, in a German court.
I have proved independently of a different proof by Nicola Tesla that it is impossible for the Moon to rotate on a local axis while keeping the same face pointed at Earth. You have offered no rebuttal, only a list of authority figures who misunderstood the problem.
Einstein’s time dilation theory is a no-brainer. Time was invented by humans based on the rotation of the Earth. Since that rotational period is a relative constant, it is not possible for time to dilate without the Earth changing its rotational speed.
All I have done re Newton is corroborate his claim that the Moon moves with a linear motion that is converted to a curvilinear motion by gravity. Since Newton also pointed out that the Moon keeps the same face pointed at Earth, it is inconceivable that he would make the error of thinking it also rotated on a local axis. Since the translator of Principia seems to suggest he said that, I claim the translator erred.
“He proved that the measles virus claimed discovery is bogus, in a German court.”
Liar.
Put up, or shut up. Your one-word, one-line replies only serve to make you a fool.
Gordon Robertson
You are bringing up the foul dishonest Lanka again, why do you persist in making this vile human a good person.
RLH is correct you are a liar intentionally and without shame.
You still think Putin is a good guy, honest, truthful. He is a dark and evil man with a cold heart and full of lies.
Maybe you need education and quit following liars. Watch this movie when it makes the rounds. Maybe you will see how wrong you are about everything. The Moon, radiation, Einstein etc, all of it.
https://www.yahoo.com/news/journalists-reveal-horrors-murdered-lifeless-023000985.html
You have built a world based on intentional lies. You think Gary Novak is a valid source.
I think you are a complete liar about taking Physics classes at a University level. I think most of what you post are just fabrications and lies. You admire liar and vile people (like Putin the monster that he is).
Norman,
You wrote –
“I think most of what you post are just fabrications and lies.”, which of course begs the question – which of his posts do you think are factual and truthful
Maybe you could name one person who cares what you think?
No? That would make you look like a fool, wouldn’t it?
Dimwit.
Norman, where’s your valid technical reference that two fluxes arriving a surface can heat the surface so that it emits the simple sum of the two fluxes?
Clint R
I have addressed this many times. Roy Spencer did an experiment verifying it, E. Swanson also did an experiment to validate this. You do not care about evidence at all so stop pretending you do.
Wrong Norman, you’ve AVOIDED addressing this many times. No one has done an experiment to verify/validate this issue. You have NO evidence, so stop pretending you do.
Here’s what your cult claims– two fluxes, F1 and F2, arriving at a surface result in the surface emitting the simple sum of two fluxes, ie, F1 + F2. That doesn’t happen! It violates the laws of physics. You’ve accepted fraud as “science”, and still struggle to incompetently support it.
I’ll keep reminding you of this because, as you know, I like exposing fraud and phonies.
Clint R
Wrong. E. Swanson has done it and posted his results.
You do not have a clue about science or physics. You are a Flat-Earther Cultist so nothing every stated to you will be accepted. You will reject everything and then pretend no one addressed your claims. It is the mentality of a Flat-Earth Cultist. You are wired in this way.
You can do an experiment yourself if you want to be scientific. Take two heat lamps. Turn one on to an object you are measuring the temperature of. Get a steady state reading and then turn on the other lamp and see if the temperature goes up. If it does fluxes add and you are proven wrong.
Do science and quit being such a stupid troll. I think most here are tired of your cult stupidity.
https://www.youtube.com/watch?v=wAEwMpS__Tk&t=1052s
This video shows how discussing anything with you is pointless. You are the irrational cult minded Flat-Earther of this video. Most other posters are rational logical science based thinkers like the presenter of the video.
Wrong troll Norman.
Whenever you get slapped by reality, you resort to trolling — insults, false accusations, and misrepresentations.
E. Swanson’s off-topic experiment did not identify any actual flux values. But, if you tried converting the temperatures to fluxes, it would be obvious fluxes do not simply add.
Keep trying to pervert reality. I like exposing fraud, phonies, and trolls.
Clint R
You are a brain dead Flat Earther. Again you are not logical or rational. Fluxes add you are wrong. You can have other heat transfer mechanisms so the fluxes may not equate to a temperature since a given temperature is the sum off all heat transfer going on. This does not logically does not infer fluxes do not add. They do you are wrong and can’t understand why. You are not smart enough to see your ignorance and you lack logic.
Troll Norman, you keep ignoring the difference between “add” and “simply add”. Vector quantities can be added, but they do not “simply add”. But, as you have no knowledge of physics, you can’t understand.
Here’s what your cult claims — two fluxes, F1 and F2, arriving at a surface result in the surface emitting the simple sum of two fluxes, ie, F1 + F2. That doesn’t happen! It violates the laws of physics. You’ve accepted fraud as “science”, and still struggle to incompetently support it.
I’ll keep reminding you of this because, as you know, I like exposing fraud, phonies…and trolls.
Clint R
You should expose yourself, you are definitely a troll, you don’t know real physics, and you are a fraudulent phony peddling your brand of dishonest physics on gullible simple minded.
On your point. Two fluxes say arriving at a blackbody (or near so) with no other energy inputs and in vacuum condition so the only heat transfer is radiant energy, will emit the sum of incoming energy if the geometry is not changed. The surface that absorbs is the same area as the surface emitting. Your endless nonsense will not change this and it DOES NOT violate ANY real laws of physics.
You are wrong.
It does not imply ice boils water. You don’t have enough knowledge of geometry to grasp why this is not a correct logical progression of fluxes adding at a surface. It has been explained to you several times and yet you can’t process it. That is why you should spend the time to watch the Flat-Earth video. You argue the same as the Flat-Earthers on their view. Neither of you have any logical thought but keep repeating worn out points.
Case of point, the Flat-Earth point out you can see object that should be below the horizon. Scientists explain it to them that the atmosphere bends light. They don’t get this and continue with the same point over and over. You are just like that. Everything has been explained in incredible detail to you, all you points and challenges. Not a bit of difference in your Closed Cult mind that rejects science and logic.
Troll Norman, as usual you know NOTHING of the subject and just ramble endlessly. And the more I slap you with reality, the more you go into meltdown.
That’s why this is so much fun.
You’re a phony, with only a “wiki” level of knowledge of physics. Yet you pretend to be an expert. So, here’s a simple question for you:
Fluxes are composed of photons. Since you are convinced that fluxes simply add, then photons must simply add. So, what is the “sum” of two 15μ photons?
Clint R
In similar Flat Earth style you reject what I said.
For your question about sum of two 15 micron photons.
Use this tool:
https://www.calctool.org/quantum-mechanics/photon-energy
The energy of one photon is 0.08265647 electron Volts so two would have the energy of 0.16531294 eV. More photons added the energy simply adds. Not sure what point you are making.
All it seems is you are spinning in circles because you don’t know how to set up an experiment with two heat lamps (which would show you fluxes add, which is why you won’t do it). You are a fraud, a phony and a Cult minded Flat Earth mentality. No amount of logic, evidence, REAL science, or effort will change your endlessly stupid thought process. It is a closed loop of ignorance compiled by half-truth and made up BS.
So challenge to you. Find a valid source of science information (not Claes Johnson) that prove energy from a cold source will not be absorbed by a hotter one. You make this claim and yet you do not support it. You never have. I have asked you numerous times for support but so far you provide none. You big phony.
Troll Norman, just to clarify your beliefs: You’re saying that two 15μ photons will simply add to form one photon that has the energy of the two?
Clint R
No that is not my belief. If you have two photons there is more energy. If this energy is absorbed the surface has the energy of both. I am not saying the photons combine nor do I know why you suggest that I am implying this.
This is what Flat Earth arguments devolve to.
Rather than show valid evidence to support your claim that a hot object will not absorb energy from a colder one you sideling the argument into the absurd. Why do you Flat-Earthers do this. It is a standard argument format for your mental type, but I wonder why you think this is a good thing, why do you keep doing it?
Stop with the diversions and absurd point and provide evidence to support you claims. Why is it so hard for you to do this? What prevents you from finding support for you claims?
Troll Norman, your belief is that two fluxes simply add. Specifically, fraudkerts claimed two 315W/m^2 fluxes arriving a surface would result in the surface emitting 630 W/m^2. But a 2F flux has a completely different spectrum than a F flux. You need higher energy photons. A 2F flux has higher energy photons than an F flux. If fluxes simply add, then photons must simply add.
Quit trying to divert. This all started with your swallowing of fraudkerts nonsense and then claiming that you always support what you claim.
So either support your claim with some valid technical reference, or explain how two photons add to one photon with its energy being the sum of the two.
Clint R
No diversion at all. I note you still have not supported your claim that energy from a cold object can’t be absorbed by a hotter one. Why not answer this?
YOU: “Specifically, fraudkerts claimed two 315W/m^2 fluxes arriving a surface would result in the surface emitting 630 W/m^2.”
Tim Folkerts is correct. Again please consider that he is referring to what is arriving at a surface. You have not yet took the time to understand the difference between absorbed flux and emitted flux.
In your final point: “So either support your claim with some valid technical reference, or explain how two photons add to one photon with its energy being the sum of the two.”
You again are not understanding that absorb and emit are different. When an object absorbs the two photons, they are gone, only their energy remains. The object has twice the energy it did vs only a single photon. Now it will energy.
I think you are really messed up in your understanding of physics. Mostly because you got it from blog sources like the crackpot cult fanatic Joseph Postma and people like Claes Johnson. If you got your information from Wikipedia it would be far superior than blog science and deluded crackpots. I like to get mine from textbooks.
here is a link for a free textbook on Heat Transfer. Much superior source, the text could have mistakes but the source material is much closer to reality than your blogs.
https://ahtt.mit.edu/
Sorry troll Norman, but that’s all diversion. All that blah-blah and you STILL have no science. You are unable to support your nonsense so you just rely on your false beliefs.
In your cult, you believe the world is an imaginary black body. That’s the nonsense that results in ice cubes boiling water. You can’t support such fraud, but you accept it. Reality is your enemy.
https://www.bbc.co.uk/news/world-europe-31864218
“Germany court orders measles sceptic to pay 100,000 euros”
“A German biologist who offered 100,000 (71,350; $106,300) to anyone who could prove that measles is a virus has been ordered by a court to pay up.
Stefan Lanka, who believes the illness is psychosomatic, made the pledge four years ago on his website.
The reward was later claimed by German doctor David Barden, who gathered evidence from various medical studies.”
GR is strangely silent on his ‘put up or shut up’ claim.
Earlier, some SkyDragon cultist wrote –
“Coal plants emit CO2 as well as two kinds of aerosols, black carbon (soot), and sulfates (sulfur particles).”
– no doubt trying to sound sciency and authoritative.
He either doesn’t know that burning hydrocarbons produces, at a minimum, CO2 and H2O, or doesn’t want to admit it, for some strange reason. He also reinvents chemistry, by claiming sulfates are “sulfur particles”. And so it goes.
The man’s a fool. Producing and using energy creates heat – the living human body is a prime example. SkyDragon cultists want to exterminate life from the planet, by reducing CO2 and H2O levels to less than those required to sustain life.
All because they are terrified of a GHE which they cannot describe, and which has never been observed, measured, or documented, in any scientific fashion.
The march of the morons continues.
The morons like to portray smoke stacks belching water vapour as CO2.
“He either doesnt know that burning hydrocarbons produces, at a minimum, CO2 and H2O… SkyDragon cultists want to exterminate life from the planet, by reducing CO2 and H2O levels to less than those required to sustain life.”
Ohhahahahahahahahaha!!
If we reduce emissions from smmokestacks we will reduce the amount of H2O needed to sustain life??
This is planetary level idiocy. Thanks for the laugh.
b,
SkyDragons believe, apparently, that “greenhouse gases” like H2O (and to a lesser degree CO2), make thermometers hotter. Complete nonsense, of course, but SkyDragon cultists are somewhat detached from reality.
“Emissions from smmokestacks [sic]”?
Typical SkyDragon attempts to avoid acknowledging that burning hydrocarbons is just putting back into the atmosphere what Nature had sequestered, reducing CO2 levels to a point barely above that necessary to maintain plant life on the planet. Of course, no plants, no people.
Idiot “climate scientists” and their dimwitted acolytes claim there is a GHE, but they cannot describe it. It doesn’t seem to have had any effect for four and a half billion years or so, as the planet cooled, but this inconvenient truth doesn’t stop the nutters from uttering stupidities like “Stop Climate Change”, “climate catastrophe”, and so on.
In the meantime, the replenishment of CO2 back into the atmosphere has resulted in increased plant life around the globe – a dreadful thing, according to nitwits like you.
Dr Spencer is looking at alternative causes for the rises in temperatures noted roughly since the Industrial Revolutions in various countries, it appears. That’s what real scientists do – even getting it wrong on occasion – phlogiston, caloric theory, the indivisible atom – but that’s how it is.
You may refuse to accept reality, but it will make precisely no difference.
Not a single fact will be changed, will it?
“Typical SkyDragon attempts to avoid acknowledging that burning hydrocarbons is just putting back into the atmosphere what Nature had sequestered, reducing CO2 levels to a point barely above that necessary to maintain plant life on the planet. Of course, no plants, no people.”
Please, hahahaha. “Putting back into the atmosphere what Nature had sequestered, reducing CO2 levels”
Adding CO2 to the atmosphere, reduces the CO2 levels in the atmosphere?
Too funny.
“SkyDragons”
Yeah, you’re definitely off with the pixies.
b,
Nature reduced CO2 levels by taking CO2 out of the atmosphere and turning it into plant material. I assumed you were reasonably bright – I could have been clearer, I suppose.
Where do you think all the gas, oil, and coal comes from?
You dimwit, from the atmosphere! That’s why they call it “fossil fuel”.
Burning it just puts back a little of what was turned into “fossil fuels”. Why would you want less of essential plant food in the atmosphere?
Idiot SkyDragon cultists apparently want to reduce the biomass of plants, cause planet-wide human starvation. That would be idiots like you, who can’t even describe the GHE which you worship.
Go on, tell me why reducing the amount of plant food in the atmosphere is good for humanity – if you can.
Off you go now – how hard can it be
“I could have been clearer, I suppose.”
That was the only honest thing you said.
There is abundant evidence demonstrating AGW, from empirical spectroscopy measurements of greenhouse gases, to physical experiments demonstrating the effect, more than a century of theory behind it and the clear evidence of global warming supporting. There are several fingerprints corroborating, such as the cooling of the lower stratosphere while the troposphere warms. That’s just one of many corroborating pieces of evidence that carry the GH signature.
Your approach is to reject all of this and keep pushing the three talking points you spout over and over and over and over again.
I gave up trying to talk sense to a brick wall with only 3 plays ages ago.
The inadvertent comedy, though? Now that’s fun. Keep it up.
b,
One minor problem you have is that you can’t actually describe the “greenhouse effect”, can you? This would make all your other assertions a bit nonsensical.
Another minor problem is that the Earth has cooled since its surface was molten. So much for your CO2 “warming”. Your “theory”? What “theory” would that be?
Maybe you should pay some attention to Dr Spencer’s most recent post. Maybe thermometers respond to anthropogenic heat – what do you think of that? I assume that you can think for yourself, even though you are not showing much evidence at present.
Maybe you believe the SkyDragon nonsense that CO2 makes thermometers hotter – but only when the Sun is shining, of course!
Describe your GHE, and then defend your description. I will wager you can’t, but I might be wrong. Over to you.
“One minor problem you have is that you can’t actually describe the ‘greenhouse effect’, can you?”
Yes, this is one of your 3 talking points. Another one is to refer to the temperature of the Earth’s surface 4.5 billion years ago.
I’ve explained it to you many times. Greenhouse gases absorb upwelling radiation from the ground, slowing the rate at which IR escapes to space. As the GHG enhanced atmosphere further slows the rate of heat loss from the surface to space, the surface must warm.
So of course it can be explained to you, and has been explained to you in various ways by various people.
It’s not that no one can explain it. It’s that you are a brick wall who simply rejects it, just as you reject any established physics that supports the greenhouse effect. And you reject it with waffle, not with science.
As I said, please stick to comedy. Your blank denial using the same hollow ornaments for arguments is boring.
b,
You wrote –
“Greenhouse gases absorb upwelling radiation from the ground, slowing the rate at which IR escapes to space.”
And the surface still cools, doesn’t it? Slow cooling is still not heating. Just like it has cooled for four and a half billion years.
No, your description doesn’t result in raised temperatures.
Try something that works – at night, for example. How hard can it be?
“And the surface still cools, doesn’t it?”
That was almost funny. You’re losing you mojo.
The surface has warmed over the period that anthro GHGs have been accumulating in the atmosphere.
Which is in line with all the other evidence, empirical and a priori mentioned above.
Please go back to saying sillier things. That’s entertaining at least. Your repetitious non sequiturs are repetitious. And non sequiturs.
Rapid technological innovation not harmful renewables policy key to lighting our energy future
https://judithcurry.com/2023/01/20/rapid-technological-innovation-not-harmful-renewables-policy-key-to-lighting-our-energy-future/#more-29659
“Paradoxically, restricting fossil fuel production in the near term will actually slow down the energy transition, which itself requires substantial amounts of energy to implement.”
Well, it has done this. As said, government are only increasing CO2 emissions and wasting trillions of dollars.
Dollars would better spent mining natural gas in ocean and arctic- the launch Starship, if FAA would allow it, would do more to reduce CO2 emissions anything governments thought of.
All politicians have done, is enriching themselves and causing wars.
> Lanka has gone through papers for each popular virus, as an expert, and found none of the papers have isolated a virus. He proved that the measles virus claimed discovery is bogus, in a German court.
Thank you for inviting me to correct your faulty memory, Bordon:
https://www.thelocal.se/20150320/sweden-doctor-in-huge-measles-court-case-win/
C’mon.
Wonky Wee Willy,
I suppose you think that measles is related to the mythical GHE in some way?
Maybe you could link to the faker, fraud, scofflaw and deadbeat Michael Mann (self styled “climate scientist”), and the court document where he claimed he was a Nobel prize winner.
OK, OK, it was just a case of Michael,Mann being so stupid that he couldn’t figure out whether he was awarded a Nobel Prize, or not. I suppose he could have sent an email to the Nobel Committee, but he probably claimed he didn’t understand things like emails.
No wonder Michael Mann is worshipped by SkyDragon cultists!
Mike Flynn,
Thank you for inviting me to ask you again –
What are you braying about?
Willard, please stop trying to troll.
https://www.drroyspencer.com/2023/01/urbanization-effects-on-ghcn-temperature-trends-part-i-the-urbanization-characteristics-of-the-ghcn-stations/#comment-1434485
As usual, wee willy is quoting old articles. Since that ruling, Lanka appealed to a higher court and they over-ruled the lower court. Bardens got to pay court costs for his dumb effort.
It was so bad that the court appointed expert agreed completely with Lanka, that no evidence existed in the papers provided by Bardens, that any proof of a measles virus isolation existed.
Lanka got off on a technicality. That no ONE paper contained ALL of his requirements.
THE NEW SPACE RACE: With Starshield, SpaceX readies for battle.
“Now that SpaceX has established itself as a leading provider of U.S. national security launches, it is seeking a bigger share of the defense market with a new product line called Starshield. SpaceX quietly unveiled Starshield last month offering defense and intelligence agencies custom-built spacecraft, sensors, and secure communications services leveraging SpaceXs investment in its Starlink network of broadband satellites.”
So, Spacex launches a few Falcon Heavy and now, things have changed?
Or are talking Starship.
Starship is mostly about going to Mars. Though it say also about sub-orbital travel which obviously something US military wants. But Starship isn’t really designed for GEO or the Moon. But just talking about the first stage booster, it’s good for anything- very powerful and can be reused [in theory].
I been interested in this for awhile, everyone knew a larger rocket was better, but the claim was their wasn’t enough market for it.
But now, there seems to be endless market for it.
All that needed was some mad man who wanted go to Mars.
Starship is just Space Shuttle that goes to Mars- a space shuttle which unlike the Space Shuttle, Starship might work.
The Space Shuttle was once upon time, was going to launch everything, they tried to outlaw other rockets [cause that’s govt do] but Space Shuttle was designed wrong. Russia of course made their own Space Shuttle- and it didn’t take them long to determine, it didn’t work.
Anyhow, next:
” We have in the United States by far the most resilient commercial space enterprise anywhere in the world. The Chinese know that, and were going to lean into that, Deputy Secretary of Defense Kathleen Hicks said Dec. 8 at an Aspen Security Forum in Washington. Were going to make sure were working closely with the commercial sector and leveraging all that commercial space capability. ”
China is threat- they are pychopaths. But tend to think most likely they threat because they going to implode.
I would be happy if China mined water on the Moon- but I don’t believe they serious about it, and if tried, they would fail- I would hope they would be wildly successful.
I am certain, NASA can’t mine moon lunar {even if they legally permitted to do it] and I would like any government trying to do, because it would shocking and amazing if they could- the first time ever of having government actually do work, without actually just stealing stuff. As said, it would huge breakthrough, similar to a government not causing any more wars.
That’s what happens to all Marxist regimes; they implode. However, Antman, Wiltard, and McGoofin believe Marxism is nirvana.
Troglodytes will troglodyte:
https://apnews.com/article/politics-new-mexico-state-government-crime-albuquerque-1410b516f5b66c18d62342a0d7a9b60f
Very Objective.
Willard, please stop trying to troll.
I read the post and saw the link.
It shows that the 71 best-sited US stations have a warmer long-term trend than the record from all USHCN weather stations.
https://drive.google.com/file/d/1pbQCHFwTTy1HIns9pDNj6mDQ85Vau7NC/view
So where is the UHI in the official record? Shouldn’t we have seen the opposite result?
That was Bindidon’s point.
And you think the 71 stations “represents the only such stations that NOAA has any control over.”
Wrong. They are just 71 stations that surfacestations gave top rating to. NOAA has no more control over these than the other weather stations in USHCN. You might be mistaking those 71 stations for the USCRN, which only begins in 2005 anyway.
“one would expect it to be a bellweather for global climate change”
The temperature record of America, less than 3% of the global surface, is supposed to be a good proxy for the whole globe?
Ignore – site jumped ne down here when the first attempt was vetoed by the website.
> We skeptics offer science in our responses
Thank you for inviting me to correct two misconceptions.
First, Bordon and his bunch are cranks. They side with contrarians when it suits them.
Second, Bordon has no scientific bone in him.
These ‘skeptics’ offer blather and no substantiation for their crackpot views.
Without substantiation, they are not doing anything like science.
b,
You wrote –
“Without substantiation, they are not doing anything like science.”
Without even a description, what hope for idiot SkyDragons, then?
You have to describe an effect – where it may be observed, measured, and documented – before you can investigate whether it can be explained using known physical laws.
At this point, you are stymied – how do you describe an effect which has been of no effect for four and a half billion years or so? Not easily, I’d imagine.
Keep trying.
Mike Flynn,
You blathered –
Something.
But what?
Willard, please stop trying to troll.
Blathering barry, where’s your substantiation from a valid technical reference that two fluxes arriving a surface can heat it so it will emit the simple sum of the two fluxes?
Without substantiation, you are not doing anything like science. IOW, you’ve got NOTHING.
Barry,
Ed Berry has offered all kinds of substantiation for his views. Also, Happer and Wijngaarden have offered all kinds of substantiation for their views.
Troglodyte,
Ridiculous substantiation does not count:
https://andthentheresphysics.wordpress.com/2017/10/03/a-harde-response/#comment-116929
If he walks like a crank and quacks like a crank, chances are he will ask that we buy his book.
That’s the same idiotic stuff that Antman was spouting. He doesn’t misunderstand residence time and adjustment time. The world of “climate science” misunderstands it. IPCC uses turnover time. He uses e-time or e-folding time as a mathematical solution to the first-order linear differential equation. Stop with your stupid red herring.
Wiki does have its uses.
https://en.wikipedia.org/wiki/E-folding
You could read that comment thread, Troglodyte.
If you not want to sound like an idiot, you should.
The assertion was Berry misunderstood the terms residence time and adjustment time. He doesn’t. He uses the correct mathematical e-time.
Willard, please stop trying to troll.
The assertion was that Ed is completely unreacheable.
If you prefer, Ed is a total crank.
Which is true.
Read that thread, Troglodyte. Educamate yourself.
Willard, please stop trying to troll.
barry says:
”These skeptics offer blather and no substantiation for their crackpot views.
Without substantiation, they are not doing anything like science.”
Sounds like a Freudian projection Barry. What are doing in here?
Gill, Gill,
That is just a silly no U.
Try this:
https://ippc.ch/
Willard,
Please stop trying to troll.
bill…”Sounds like a Freudian projection Barry. What are doing in here?”
***
Freud might claim Bary has an Oeodipus Complex. Since Barry is from Australia, he like has that plus a Platypus Complex.
It’s this kind of response from we willy wanker that assure me we skeptics are on the right track. Not once have I seen a reply from an alarmist that came anywhere near to a scientific explanation of the GHE or AGW.
The other day I pressed Entropic for an explanation of the GHE, and he blurted out, complete with insult, that the GHE is a metaphor.
There you have it, the GHE is a figure of speech aimed at equating global warming with an unrealistic symbol, a real greenhouse.
Even that is above wee willy’s head. He is still trying to understand the difference between rotation and linear motion. You could ask a kid in kindergarten what the difference might be and he/she could explain it. Not wee willy, who likely has trouble chewing gum and tying his shoelaces at the same time.
Gordon Robertson wrote:
“We skeptics offer science in our responses and we are met with pseudo-science in return.”
Where have you offered “science” proving that “the Earth’s shadow causes the phases of the Moon?”
Nowhere.
Why?
Because you made it up!
You give skepticism a bad name.
https://www.drroyspencer.com/2021/03/uah-global-temperature-update-for-february-2021-0-20-deg-c/#comment-632695
I don’t feed the trolls.
No, you just lie.
RLH, please stop trying to troll.
richard claims I lie, but he lacks the academic background to prove me wrong. I don’t know in which discipline he holds his Masters degree, but whatever it is, he has a clear inability to discuss physics and science in general.
Perhaps his degree is in animal husbandry or ornithology. He likes to ape people and mimic them like a parrot, by repeating inane one line responses.
Of course the BBC, which I linked to, lies instead.
https://www.drroyspencer.com/2023/01/urbanization-effects-on-ghcn-temperature-trends-part-i-the-urbanization-characteristics-of-the-ghcn-stations/#comment-1434485
Robertson is an absolute ignoramus who isn’t even able to discuss about temperature anomalies.
And whoever, like Robertson, tries miserably to distort Newton’s original formulations, or their independent translations by various people, so that these formulations correspond to his personal opinion, is an absolute specialist in pseudoscience.
I understand anomalies well, the problem is discussing them with people like you who lack an understanding.
Even when I posted a link to a NOAA article explaining clearly that an anomaly is a deviation from a long term average, you still failed to grasp the meaning.
You still have trouble grasping that a -ve anomaly is a cooling below that average. Since the first 18 years of the UAH record was below the average, it meant the temperatures were cooler. The temps are still barely above the average, meaning we have not experienced much warming the past 40+ years.
By not much warming I mean the following. If you raised the thermostat in a room by the same amount you could not detect it.
TM,
What have phases of the Moon to do with the fact that you can’t describe the mythical “greenhouse effect”?
You are just indulging in a spot of ad-hommery, aren’t you, because you have been exposed as a delusional SkyDragon cultist.
Carry on rejecting reality – the Earth cooled for four and a half billion years or so. Where was your “greenhouse effect” hiding during that time? Alongside Trenberth’s “missing heat”, perhaps?
Got any fresh nonsense to bang on about?
Swenson, you get dumber by the day. ad-hommery?
“the Earth cooled for four and a half billion years or so.”
That’s -0.000008 C/decade. The UAH Global Temperature Update posted January 3rd shows warming of +0.13 C/decade. So the greenhouse warming trend is 16,807 times greater than your cooling trend.
Time for you to shut up about “the Earth cooled for four and a half billion years” if you want to be taken seriously.
TM,
As I said, the Earth cooled for four and a half billion years or so, whether you like it or not.
There is no “greenhouse warming trend”, and there hasn’t been for four and a half billion years, obviously.
If a scientist notices that a thermometer is getting hotter, he might be well advised to cast about for a higher temperature heat source in the vicinity. A “climate scientist” might be delusional enough to believe that CO2 makes thermometers hotter!
By the way, only a really silly SkyDragon would think that an “average” rate of cooling has any relevance to real rates of cooling. Even sillier, such a person would apparently know nothing about half lives, radiogenic heating, and so on. Current rates of cooling of the Earth (according to real scientists, based on theory and measurements) are estimated at between one and four millionths of a Kelvin per annum.
As a matter of interest, I say what I wish, when I wish, and how I wish. The opinions of SkyDragons like you do not affect me unduly. All the SkyDragon opinions in the world (plus $5) will buy a $5 cup of coffee. You can work out what anybody’s opinion is worth, all by yourself.
Accept reality if you like.
“Current rates of cooling of the Earth (according to real scientists, based on theory and measurements) are estimated at between one and four millionths of a Kelvin per annum.”
So between -0.000001 and -0.000004 K/annum. Got it.
McGoofin,
You’re a good little Democrat worker bee. A true died-in-the-wool Marxist. What about Marxism captivates you? Do you just hate the Musks of the world? What about Gates or Zuckerberg?
you alright bud? Sounds like you fell and hit your head.
Water vapor molecules at ground level outnumber CO2 molecules 23 to 1 and have been increasing about 7 times faster than CO2 molecules
The average amount of time that passes between when a CO2 molecule absorbs a photon and when it emits one (called the decay time) is 1.1 seconds. It only takes a few microseconds for absorbed energy to be shared with surrounding molecules (relaxation time) by gaseous conduction.
dan…it has been estimated that atmospheric CO2 absorbs only 5% of surface radiation. Since CO2 emits isotropically, as you have claimed, that means it is also radiating 50% back toward warmer molecules of air, which can’t absorb it due to the 2nd law.
The numbers simply don’t add up to CO2 being a factor in atmospheric warming. I would say the same applies to WV at 0.31% of the entire atmosphere.
I think R.W.Wood had it right back in 1909. He was a world renowned expert on gases like CO2 and he stated that he could not see how CO2 could be a warming factor in the atmosphere. Rather, he thought a better explanation was the warming of nitrogen and oxygen by the surface through direct conduction, that air rising, and being unable to release it’s heat because neither radiates at terrestrial temperatures.
Even at that, it’s obvious that surface temperatures vary markedly from the Equator to the Poles and that WV has a far greater effect in the Tropics, although no better than 4% or so. As Lindzen has pointed out, heated air in the Tropics rises to higher altitudes where it is transported poleward. Also, heated water in the Tropics travels poleward. If that is the case, only nitrogen and oxygen are capable of retaining that heat.
I have the sneaking suspicion that we are missing something very important in the analysis of heat budgets.
If WV and CO2 molecules absorb equally, only 1/23 or 4.3 % of absorbed radiation would be absorbed by CO2. Close enough.
Some of the radiation from the surface is exactly cancelled by radiation from above. The net flow of energy complies with the second law. Yes, at the surface it works the same way with WV as it does with CO2. (I specialized in heat transfer analysis in grad school, have done heat transfer analysis and have written a general purpose heat transfer analysis program).
I did an energy balance which is summarized in Fig 1 at http://consensusmistakes.blogspot.com It shows the convection/conduction value as less than half that for radiation. The biggy is latent heat.
In the tropics up to about 4% of the atmospheric molecules are WV but the global average is about 1%.
Although radiation is omnidirectional from a molecule, because of the population gradient in water vapor (WV) molecules the distance that an emitted photon travels before it encounters another IR active molecule is more when the photon is directed towards space. At 2 km and higher, outward directed photons from WV molecules can make it all the way to space. The result is net energy flux towards space. Gaseous conduction causes energy absorbed by CO2 molecules to be conducted to replenish the energy radiated to space by WV molecules.
dan…”At 2 km and higher, outward directed photons from WV molecules can make it all the way to space. The result is net energy flux towards space”.
***
I am uncomfortable with the notion that gases making up 0.31% of the atmosphere are responsible for all heat dissipation. The focus of the anthropogenic theory is CO2, which makes up only 0.04% of the atmosphere. How can a pithy amount of CO2 possibly be responsible for dissipating the humungous amount of heat input daily by the Sun?
Earlier in your post, you note that a molecule emits isotropically, that is, in all directions of a sphere. That alone casts a serious doubt on the definition of a photon’s existence, wherein the photon is regarded as a particle of EM with momentum but no mass.
Clearly, the quantum of energy referred to as a photon is a wave-like entity from the moment it is emitted. After all, it has a frequency and is made up of an electric field orthogonal to a magnetic field. Fields are generally wave-like in nature, not mass-less particles.
We need to stand back and re-assess the entire theory of energy in/energy out. Clearly, much of the heat dissipated is through a natural process where heated air rises and dissipates it’s heat naturally, with no radiation being required.
Heat is the kinetic energy of atoms/molecules and varies with the density of atoms/molecules. Gravity orders atmospheric molecules by a negative density gradient from the surface upward. Therefore, as air density decreases from the surface upward, a rising parcel of heated air will expand and lose its density, thereby cooling naturally and almost completely by the time it reaches the stratosphere.
Since the Sun has been heating the Earth for billions of years, the Earth has reached a temperature that must be sustained, therefore there is not much in the way of a requirement to dissipate the energy to space. We simply don’t know how much of the internal heat is recycled and lost internally.
It’s possible that the shot of solar energy we receive each day is just enough to maintain the Earth’s average temperature leaving not much to be dissipated to space.
I’d like to see evidence that the energy in/energy out meme is a scientific truth. I don’t think we have researched it nearly enough.
That’s tough for me too, Dan.
You seem to not accept the first law of thermodynamics, conservation of energy. It means that, on average (no temperature change), the energy received from the sun by earth must leave the earth which is in the vacuum of space. The only way that energy can leave the earth is by radiation. The only gas molecules that can significantly radiate are those that are IR active at wavelengths associated with earth temperatures. The energy in N2 and O2 molecules must be conducted to IR active molecules to be radiated to space. Realize that space means the cosmic background temperature at about 2.725 Kelvin. The area of the earth radiating is 4 times the effective area receiving.
Einstein worked out the equivalence of mass and energy. The momentum of a photon is the mass equivalent of its energy times the speed of light. This stuff has all been pretty well worked out and verified by experiment.
Perhaps omnidirectional was a poor choice of words. Radiation does not go in all directions all at once. When a molecule emits a photon the photon has the same probability of going in any direction.
Wiki, Faint young Sun paradox
https://en.wikipedia.org/wiki/Faint_young_Sun_paradox
“The faint young Sun paradox or faint young Sun problem describes the apparent contradiction between observations of liquid water early in Earth’s history and the astrophysical expectation that the Sun’s output would be only 70 percent as intense during that epoch as it is during the modern epoch.”
I tend to be interested various apparent paradoxes, and the attempts of giving answers to them.
Wiki says:
“More recent modeling studies have shown that the Sun is currently 1.4 times brighter today than it was 4.6 billion years ago (Ga), and that the brightening has accelerated considerably.”
And says commonly accepted has to with greenhouse gases.
And gives other attempts at answers to the apparent paradox:
“Other proposed explanations:
Tidal heating
Cosmic rays
Mass loss from Sun
Changes in clouds
Local Hubble expansion”
And over here:
https://phys.org/news/2015-02-sun-wont-die-billion-years.html
“The sun has been increasing its brightness by about 10% every billion years it spends burning hydrogen.”
And if pick a number of 1350 watts per square meter at 1 AU distance:
a 1% present increase of 1350 is x 1.01 = 1363.5
Which roughly where we are at, though I typically round to 1360 watts per square meter, but if round number 100 million years ago it was about 1350 watts per square meter.
Now, wiki also says, Earth has had 5 known Ice Ages and latest one
is called Late Cenozoic Ice Age:
https://en.wikipedia.org/wiki/Greenhouse_and_icehouse_Earth
And not only are we still in this Late Cenozoic Ice Age, but last few million year has been the coldest.
An Ice Age is defined by having Ice Sheet at polar regions, which are stable or called “permanent” for time periods of say…longer than 100,000 years and ice sheets which can develop during what are called glacial periods and during interglacial period these ice sheet melt and in next glacial period they can form again.
So to be in an Ice Age you need one permanent ice sheet in polar regions. And in last few million year we had Greenland develop a second ice sheet which is “permanent” or has survived during warmer periods. And Antarctica has had permanent Ice Sheet for 33.9 million years.
Or it’s formation of permanent ice sheet, began our Late Cenozoic Ice Age. 33.9 million years ago.
But returning the Faint young Sun paradox, thing, we came into this Ice Age during a time when sunlight was increasing by about 10 watts per square meter, and since the Ice Age started in the sunlight increased by about 3 watts per square meter.
And our Ice Age might end after sunlight has added 10 watts since it started. Though Ice Age can last hundreds of millions of years.
And one might say, that is more interesting Paradox than the bigger
“Faint young Sun paradox”. Or more interesting because it’s happening, now.
The answers given so far, that I am aware of has do with plate tectonic activity.
Now, after reading what wrote, I will add another various of having to do with plate tectonic activity.
I just thought of it after reading my post- or can’t say really look at it, much.
Though I have long thought that impactors alter plate tectonic activity [why wouldn’t they??]
So dino impactor increased movement of plate tectonic activity and this increased motion, generated heat and the motion has been slowing down over last 60 million years.
Arr, “I will add another various of having to do with plate tectonic activity.”
Meant:
I will add another variation of having to do with plate tectonic activity.
Now, how can this be disproven. If total motion of plate tectonic activity has increased, rather than decreased.
Though it seems it would be hard to measure, as not a lot difference and I can expect variation within a 1 million year period.
One might start [or already been started] a list of all factors which
do cause increase or decrease to plate tectonic motion.
And if knew anything about it, I would start with increased motion due to impactors- what size, and whether hit ocean or land.
Also angle of impactor could be factor [I was not thinking about that, but now, it seems obvious]. Anyhow small impactor on continental land mass, shouldn’t much effect. Though smaller one hitting deeper ocean in it thin crust, could larger effect than one might imagine.
gb,
The “dim young sun” paradox seems to be due to the fact that Carl Sagan was unaware that the Earth had a molten surface when it was created, and his bizarre conviction that CO2 makes thermometers hotter!
No need for “dim young suns”. The Earth cooled – more quickly at first due to the fourth power law and all that.
No miraculous planet-wide heating and cooling cycles, although it would be nice if you could blow some CO2 onto your cooling coffee, and make it hotter. Ho ho!
Nobody knows why the crust does what it does. Every hypothesis of which I am aware fails to agree with observation to a greater or lesser degree. Chaos seems to rule, as it does down to the quantum level. Maybe the universe is truly chaotic and unpredictable.
dim young sun
***
Isn’t that a dish at a Chinese restaurant?
No, that’s her sister, Dim Yung Sung.
— Swenson says:
January 21, 2023 at 7:11 PM
gb,
The dim young sun paradox seems to be due to the fact that Carl Sagan was unaware that the Earth had a molten surface when it was created, and his bizarre conviction that CO2 makes thermometers hotter!–
Well, that Mars size hit a proto-Earth, is just a theory.
Claim: Heres How Your Cup of Coffee Contributes to ClimateChange
https://wattsupwiththat.com/2023/01/21/claim-heres-how-your-cup-of-coffee-contributes-to-climate-change/
“Global coffee consumption has been increasing steadily for almost 30 years. With a daily average consumption of 2.7 cups of coffee per person, coffee is now Canadas most popular drink. It is estimated that around two billion cups of coffee are consumed daily worldwide.”
Is there anything better than coffee?
Apparently it warms this cold planet.
{I was only on my first cup, but I got more now}
maguff quoting Roy…”Thus, to really get a good signal of global warming in both observations and models we should be examining temperature trends since approximately the 1980s”.
***
Roy is referencing global warming, not what caused it. In all the time I have been commenting here I have never heard Roy endorse the anthropogenic theory. He has claimed only that it is likely that some of the warming has anthropogenic sources.
That’s a stark contrast to the attitude at realclimate, run by Gavin Schmidt of NASA GISS and his buddy Michael Mann. The site is propaganda-central for climate alarmist lies and no one is allowed to comment to the contrary.
SSW in the upper stratosphere has weakened the polar vortex, so the weather will be quite unpredictable in the northern hemisphere. In about a week, there will be strong turbulence within the polar vortex in the lower stratosphere and upper troposphere. The polar vortex will bring Arctic air into the US.
https://i.ibb.co/W0yrf2k/gfs-z70-nh-f240.png
barry…”Too funny.
SkyDragons
Yeah, youre definitely off with the pixies”.
***
Even Barry fails to grasp that ‘Skydragon’ is a reference to climate alarmists, not skeptics. It comes from Slaying the Skydragon, a reference to killing the propaganda that CO2 causes warming.
No surprise. On at least 3 occasions I have had to correct Barry by leading him to the proof of his errors, and even at that, he insisted on moving the goalposts, in a pathetic effort to recover.
I have linked Barry and his buddy Bindidon several times to a NOAA article in which they admit slashing global surface stations from 6000 to less than 1500, yet both still adamantly insist that NOAA has 100,000s of thousands of such stations.
I have no idea what makes an alarmist an alarmist but I cringe at the thought of having my mind saddled with such an infirmity.
Yes, and I linked to the NOAA article, too, and quoted it to prove you wrong on NOAA ‘slashing’ stations.
That article was written in 2010. Yes, NOAA has a database of 100,000+ weather stations – it’s called GHCN Daily. Bindidon constantly uses it to make his charts. This is raw data, unadjusted. ‘Skeptics’ should be happy about it.
There are currently about 26,000 stations in the GHCN Monthly database, which is used for the NOAA global temp records.
Why are there 26,000 instead of 6,000? Because 12 years have elapsed, we’re up to version 4 instead of version 2 of the data, and NOAA has kept adding stations to its list.
https://www.ncei.noaa.gov/products/land-based-station/global-historical-climatology-network-monthly
“Even Barry fails to grasp that ‘Skydragon’ is a reference to climate alarmists, not skeptics.”
CO2 is the ‘skydragon,’ and the ‘slayers’ are the wankers at Principia Scientifica.
Yes, they came up with the infantile rhetoric, and infants regurgitate it elsewhere.
b,
Is that an attempt to divert attention from the fact that no SkyDragon cultist can even describe the GHE which they claim is responsible for the four and a half billion year cooling of the Earth?
No GHE – CO2 does not make thermometers hotter. You are imagining things.
Carry on.
Earlier, someone wrote –
“You are a brain dead Flat Earther. Again you are not logical or rational. Fluxes add you are wrong. You can have other heat transfer mechanisms so the fluxes may not equate to a temperature since a given temperature is the sum off all heat transfer going on. This does not logically does not infer fluxes do not add.”
The important slippery SkyDragon get-out here is “so the fluxes may not equate to a temperature since a given temperature . . .”. Exactly – fluxes, no matter how expressed, generally have no relationship to real temperature, as the deluded SkyDragon has reluctantly admitted.
Hence, the mad attempts by “climate scientists” to try to convince others that their bizarre “energy budgets”, madly adding and subtracting “fluxes”, have some attachment to reality. They manage to convince those of diminished mental capacity – journalists, politicians, and SkyDragon cultists, in the main – that their fantasies are superior to fact.
All good fun. This too will pass.
swenson…”Earlier, someone wrote Fluxes add you are wrong”.
***
Let’s look at fluxes from communications signals that are EM. If they added, communications would not be possible since the signals would be garbled by the time they reached a receiver. The air is full of EM communications energies of a broad range of frequencies and none of the signals add.
The mistake being made here…again…is confusing EM with the final product, once it has been absorbed by a surface or an antenna. The instant an EM comm signal meets an antenna, it is converted into electrical energy. The same with any surface absorbing EM, with the exception that such EM is converted to heat.
In the latter case, it’s the heat quantities that add, not the EM fluxes themselves.
GR, You should know better. Frequencies don’t add but the energy fluxes do.
Some thoughts from Ed Berry…
From Ed Berry, Climate Miracle: There is no climate crisis Nature controls climate
IPCCs so-called science is based upon IPCCs environmental-cult view that nature is good, and human is bad. That is not physics.
The IPCC is a political organization, not a scientific organization.
1. Data show the CO2 level rose to 410 ppm by 2020, an increase of 130 ppm.
2. The IPCC assumes its core theory is true, which forces the conclusion that human CO2 caused all the increase above 280 ppm.
3. IPCC agrees that human CO2 emissions are less than 5 percent of natural CO2 emissions.
4. How can less that 5 percent of all CO2 emissions cause 32 percent of the CO2 in the atmosphere? Answer: It cant.
8.2 Multiple lines of evidence prove IPCCs core theory is wrong.
1. Ice core data prove natural CO2 caused the CO2 increase.
2. Direct CO2 data prove CO2 was much higher than 280 ppm before 1750.
3. Leaf stomata data prove CO2 was much higher than 280 ppm before 1750.
4. Statistics prove human CO2 is not the primary cause of the increase in CO2.
5. IPCCs human carbon cycle is not consistent with its own natural carbon cycle. This is a basic physics error.
6. Inspection shows IPCCs human carbon cycle is based on IPCCs invalid assumption that its core theory is true.
8.3 A simple physics carbon cycle model replicates IPCCs data for its natural carbon cycle.
1. This model easily calculates the true human carbon cycle that is compatible with IPCCs natural carbon cycle.
2. The true human carbon cycle shows human CO2 has
Berry has falsified IPCC’s Carbon Cycle Model. So, if the increase in CO2 is causing all the warming, it is primarily due to nature.
spa,
And the Earth managed to cool – in spite of CO2, H2O, and all the rest of the mythical “greenhouse gases”.
I suppose some deranged SkyDragon cultist will try to say that GHG levels have always been lower than now (to explain the lack of “warming”, but then are faced with explaining where all the carbon in fossil fuels came from, if not from atmospheres containing vastly more CO2 (and H2O) than now.
Oh dear. The SkyDragons seem to be in the same boat as astronomers of old, who had to propose ever more complicated systems of epicycles within epicycles to explain ever more precise observations of celestial bodies. SkyDragons can’t even describe their GHE, so they resort to measuring temperatures in W/m2, claim that the oceans are full of “hidden heat”, and that heat can be “accumulated” or “multiplied”.
Ah well, at least journalists and politicians suck it all in. John Kerry proclaimed himself a “scientist” – he took a political “science” unit once. Only joking, he majored in Political Science – that would make him a major “scientist”, I guess.
Swen,
GB seems to be the forum expert on Earth’s aging process. He sure believes the planet has cooled and that we’ve been in an Ice Age for some time. I sure hope we don’t keep cooling. We can feed people during warm. Cooling is a problem.
We’ve been over this. Berry’s work is not coherent, consistent or consilient. It does not match observed reality, has no mechanism and is entropically suspect.
It only gets as much attention as it does because it feeds the anti-AGW world view you are so reluctant to give up, despite the weight of evidence.
Just because you state that doesn’t make your statement true. It would help if you falsified Berry’s hypothesis. His hypothesis is outflow is proportional to level or concentration.
Also, and you going over this was comical, by the way.
We’ve been over this.
Barry’s hypothesis requires a massive deep ocean inorganic carbon sink for which we don’t have a shred of evidence.
It requires CO2 to diffuse out of this sink into the atmosphere against the concentration gradient at no energy cost, which is physically and thermodynamically impossible.
I mentioned below that the proportion of 13C in atmospheric CO2 is decreasing as CO2 concentration increases. The deep ocean CO2 sink would have the same isotopic composition as the atmosphere, so the proportion of 13C should stay the same as CO2 transfers from the deep ocean sink to the atmosphere.
Marco also mentioned that oxygen concentration is decreasing as fast as CO2 concentration is increasing, which Berry’s hypothesis doesn’t consider at all.
Now consider the CO2 AGW hypothesis.
The carbon sinks are coal,oil and gas deposits which we are extracting and burning. The amount of CO2 matches the increase in atmospheric CO2 minus the amount absorbed by other sinks.
No net energy is required. Indeed extraction and burning has a net energy release. No physical or thermodynamic problems.
The Carbon in coal, oil and gas comes from past photosynthesis. Such organic carbon is low in 13C because photosynthesis absorbs 14C but not 13C. When released by burning, the 14C from fossil fuels dilutes the 13C at a rate expected from the rate of human CO2 release.
When you burn fossil fuels one oxygen molecule is absorbed for each CO2 molecule released. Because half of the CO2 we release goes into sinks, we observe that the 2ppm/year of CO2 we are to the atmosphere is matched by a 4ppm/year decrease in oxygen content.
ent…”Weve been over this. Berrys work is not coherent, consistent or consilient. It does not match observed reality, has no mechanism and is entropically suspect”.
***
A purely ad hominem attack. No scientific fact or attempt to address the claims made by Berry, just an indirect assault on his work.
C’mon, Bordon.
Here’s what EM said:
That’s not ad hom.
I already told you to leave fallacy fluff alone.
It’ll rot your brain furthermore.
Found an online trend calculator for global temps, sea surface temps, sun spots, CO2 and ENSO.
https://jrmilks.shinyapps.io/global_temperature_trend/
The ENSO feature is good to have. Starts in 1950. Sun spots is handy, too, though you could already do that at woodfortrees.
Bindidon says:
”You simply ignore all that, but are brazen enough to discredit those who are really knowledgeable.”
You don’t know how to do it Bin. When you say its 2.5×2.5degree gridding pattern then come back and explain that not what it is. It really does have the appearance you don’t know what you are talking about.
Then you get upset when somebody points it out to you. I learned a long time ago when somebody gets upset its because he himself lacks confidence. If you have confidence like a Tom Brady all you can do is get upset at yourself for doing a lousy job and resolve to work harder the next time.
Bindidon lies:
”Instead of trying to obtain information from really experienced people, you prefer to argue according to your own guessings, like do Robertson and a few other specialists.”
My guess is I have referred to at least a dozen qualified studies here in the past 3 or 4 days and you come in with a ridiculous claim because you handwaved them all away. You are a real joke.
Bindidon says:
”Why dont you think by your own that the problem you correctly assume the relevance of temperatures decreasing with increasing latitudes when building a global average over a sphere has nothing to do with gridding aka area weighting?”
I already said what I think about that. I think that when dealing with temperature anomalies of tenths of degree it is likely any kind of gridding or processing is going to introduce more bias and more error than working with the raw data. When processing data you need specific objectives to expose specific attributes in the data. Averaging it all together is the way a bad cook makes dinner.
As you should know in one place the temperature can be 80F while five miles away it can be 105F.
Yet you feel that say in one grid you average 6 dozen stations together to get the average for that grid. Then in another location you have 1 station for 6 dozen grids. (and don’t BS me its more complicated than that. I am talking about the dominate process) But all you are really doing is weighting the least reliable data far above that of the most reliable and relevant data (on the obvious fact that where thermometers are dense so are people)
So all you are doing is making the data less reliable and less relevant. You aren’t improving the data. Period! You don’t even have a reasonable objective for why you are doing it.
I have been working with information systems for 40 years.
With climate change one cannot reasonably say if the temperature in a moist area is going to rise more than a dry area. Why? Because we don’t understand clouds and clouds tend to be more dense in the moist areas but moist areas have the most greenhouse gases and the largest greenhouse effect from clouds which probably makes up the bulk of the greenhouse effect in terms of watts but counterbalances a lot of it because of shading the sun.
Until you actually learn something about climate change you aren’t going to be able to describe its effects or improve datasets to be informative. I have no idea how many people are out their messing up datasets for no other reason than to produce propaganda and exaggerate warming. Maybe you have a reason. I sort of doubt it.
When you learn what the effects are in each environment then you can tailor a data processing system that is going to spit out relevant information. Not before. In the mean time the concentration needs to be on good data collection and a good understanding of the variables that affect the data. . . .like UHI, clouds, the greenhouse effect, etc. Pretty much everything Roy is dedicating his career to.
Because ultimately you are going to need that data to pinpoint the issues. Instead we are regaled with blind data processing, data adjusting, moving standards, no consistency in data collection, abandonment of some of the longest running databases in a flurry of adding new territory in blind pursuit of what? An average mean global anomaly? What is that good for? How accurate is it? What are the variables? You don’t know the answer to any of those questions.
Burckle Crater
https://en.wikipedia.org/wiki/Burckle_Crater
Or something like, could have effected plate tectonics. Maybe that recent impactor changed things, maybe we will get some global warming, despite all known evidence that it’s not going to happen.
Some words from Marco:
1. Since Richard Courtney [like Ed and Trogolodyte and Bordon] believes he is so smart, I’ll ask him the same question that I asked all those others who believe the increase is a result of ocean outgassing: where’s the sink, Richard? If the ocean is the prime net source, you would need to find a sink that has taken up around 1500 Gigatons of CO2 EXTRA, the cumulative anthropogenic emissions.
2. And another very relevant question you should then answer: why is the atmospheric oxygen concentration dropping faster than the CO2 increase? You will need to find a mechanism that not only explains the increased outgassing of CO2 *and thus also O2* from the oceans (after all, you claim this is due to warming – Henry’s Law applies as much to O2 as it does to CO2), and how this extra O2 is then taken up even more than the CO2 by some sink, somewhere, unidentified.
3. In terms of “consilience of evidence”, I see a “divergence of evidence” underlying your hypothesis. Maybe not surprising you don’t see it, considering your own question on the annual variability in the carbon cycle. It’s not like there aren’t any papers who discuss this. And those papers aren’t exactly new either. Maybe you should read up on some papers by Charles Keeling and Roger Revelle, Richard. And then contemplate on the fact that a complete and total non-expert in climate science is lecturing you on your lack of knowledge on the relevant literature and the obvious problems you cannot solve with your hypothesis (but are solved with anthropogenic CO2 as the main driver of atmospheric CO2 increase).
Nor does Barry’s work explain why the proportion of 13C in atmospheric CO2 is decreasing. If the extra CO2 came from a natural source the proportion of 13C should stay constant.
The Revelle Factor isn’t a factor. It is not a part of his calculations that are based upon the conservation of mass. In his third paper about the carbon cycle model, he uses IPCC numbers to calculate the exchanges between atmosphere and land, atmosphere and surface ocean, and surface ocean and deep ocean. All the natural emission numbers agree with Berry’s calculations. Also, he provides evidence in his most recent paper that C14 returned to its balance level after the bomb tests, and the C12 percentage increased as it should. He doesn’t mention your new C13 red herring, but I’m sure he’d address it if necessary.
I put this upthread. I’ll repeat it here.
” Berrys hypothesis requires a massive deep ocean inorganic carbon sink for which we dont have a shred of evidence.
It requires CO2 to diffuse out of this sink into the atmosphere against the concentration gradient at no energy cost, which is physically and thermodynamically impossible.
I mentioned below that the proportion of 13C in atmospheric CO2 is decreasing as CO2 concentration increases. The deep ocean CO2 sink would have the same isotopic composition as the atmosphere, so the proportion of 13C should stay the same as CO2 transfers from the deep ocean sink to the atmosphere.
Marco also mentioned that oxygen concentration is decreasing as fast as CO2 concentration is increasing, which Berrys hypothesis doesnt consider at all.
Now consider the CO2 AGW hypothesis.
The carbon sinks are coal,oil and gas deposits which we are extracting and burning. The amount of CO2 matches the increase in atmospheric CO2 minus the amount absorbed by other sinks.
No net energy is required. Indeed extraction and burning has a net energy release. No physical or thermodynamic problems.
The Carbon in coal, oil and gas comes from past photosynthesis. Such organic carbon is low in 13C because photosynthesis absorbs 14C but not 13C. When released by burning, the 12C from fossil fuels dilutes the 13C at the rate expected from the rate of human CO2 release.
When you burn fossil fuels one oxygen molecule is absorbed for each CO2 molecule released. Because half of the CO2 we release goes into sinks, we observe that the 2ppm/year of CO2 we are to the atmosphere is matched by a 4ppm/year decrease in oxygen content. “
You’re such a dingbat. I thought you were a biologist, or are you drunk? You can’t even get the propaganda straight.
All four of my points are well covered in the literature, from the size of the deep ocean carbon sink, through the carbon budget and the the oxygen decline to the dilution of 13C. They falsify Berry’s hypothesis.
As Berry’ amenuensis here and a supporter of his minority views, I would expect you to answer my points.
I notice that you insult me rather than debate the evidence.
This does your credibity, and Berry’s, no good at all.
EM,
You wrote –
“This does your credibity, and Berrys, no good at all.”
As Feynman said “It doesn’t matter how beautiful your theory is, it doesn’t matter how smart you are. If it doesn’t agree with experiment, it’s wrong.”
What do experiments show? There aren’t any?
That would mean people are just speculating – just like SkyDragons fantasize about the GHE.
Willard says:
”Ill ask him the same question that I asked all those others who believe the increase is a result of ocean outgassing: wheres the sink, Richard? If the ocean is the prime net source, you would need to find a sink that has taken up around 1500 Gigatons of CO2 EXTRA, the cumulative anthropogenic emissions.”
Actually thats not the question that needs answering. You are just selectively listening to the propaganda of your daddy.
As I recall a decade and a half ago your daddy was saying the sinks were filled to capacity and thats why needed to stop all emissions.
Yet here a decade and a half later the total increase in CO2 from all sources natural outgassing and anthropogenic is only half of what was emitted in the last 27 years.
So the formula is:
A) Increase in CO2 in the atmosphere
B) Minus what outgassing would have occurred from a warming ocean.
C) Equals mankind’s contribution to CO2 in the atmosphere.
Of course propagandists circle around that by attributing all ocean warming to the emission of CO2. And that is despite the fact we know for certain some of the warming of the deep ocean dates back to the Medieval Warming Period, much less the LIA recovery.
And no doubt even that fact feeds the fears of the afraid. Despite the fact that mankinds contribution to CO2 in the combined ocean and atmosphere is so miniscule as to hardly be a drop in a very large bucket. When the ocean does its work we will have added about 3ppm from all our emissions to date and we have no handle on how much that would remain in the oceans and atmosphere.
And of course we have practically no handle whatsoever on how much the ocean is warming. We have some clues that the surface ocean is warming. . . .or was.
Yes indeed the surface ocean has warmed some over the decades. Its probably somewhere around half of what the surface of the land has warmed over the industrial age. Like maybe .25 to .5 degrees?
But we have no idea how much the deep ocean has warmed which makes up 90% of the ocean. We don’t even know for sure if it has warmed or if it has cooled. If it has cooled it would be somewhat responsible for atmospheric warming as that is where 90% of ocean cooling has to go first.
The Revelle Factor has everything to do with the rate of ocean uptake. Mostly between the layers of the ocean. Something we still know little about and will know little about it for another couple of decades as we are just now building a sampling program to find the correct answers. And if history repeats itself we will quickly find ourselves polluting those new records with older discredited technologies to keep myths alive. After all one cannot change the narrative as long as those with large grants based on the older technologies, like firemen on Diesel engine trains all die of old age.
And with the IPCC not being reasonably confident that almost half the warming of the surface is due to anthropogenic emissions. And being minimally confident that half is.
Those confidence levels are based upon the minimum statistical audit standard of 95 to 98% confidence levels of being materially right. (and yet audit failures still occur).
And of course then we have people that look at the Revelle Factor and see it as being the smoking gun. . .when Revelle himself didn’t find it convincing but instead worthy of robust scientific pursuit for truth.
Judith Curry gets lambasted for being a darned good auditor in terms of estimating risk; because they claim it plants seeds of scientific denial. Sounds way too much like the demands to ignore what differences men and women have between them. Sounds like hoards of so-called academic experts smoking way too much weird stuff.
Gill, Gill,
You say:
That’s not quite correct.
Why do you keep making the same blunders Bordon does?
Willard,
Who cares about additional CO2 being put back into the atmosphere by mankind?
Nature removed it, we’re putting it back.
CO2 has precisely no heating capability, in spite of the delusions of people like Gavin Schmidt, Michael Mann, John Kerry, and all the rest.
You can’t even describe the GHE, can you? That’s no doubt why you try your silly diversions, and your inept attempts to troll.
Your silly reference to “climate science” shows the depth of your SkyDragon cult beliefs. Climate is just the statistics of historical weather observations – 12 year old capabilities only required. Too hard for you, obviously.
Carry on dreaming.
swenson…we have it from Entropic, a climate alarmist, that the GHE is a metaphor. 35 years of IPCC bs and Ent nails it. Why can the IPCC not admit the same and why are politicians and alarmists so stupid they cannot see that for themselves?
Example of a metaphor…’Life is a highway’.
Fool.
Mike Flynn,
Who cares what you are braying about?
In fact, what are you braying about?
Carry on braying.
Willard, please stop trying troll.
If you know of a good paper. I would read it.
so far the two I read really don’t even understand the issue. They pick a proxy out of the sky and go with it. You see a lot of papers like that. Somebody is a favored institution they want a grant to do a paper and they get it. IMO, its primarily because of allowing non-independent outsiders into the decision processes. I have seen a lot of that first hand too. Next thing you know you have some polar bears are going extinct paper that is just nonsense. I have had a few of those come into some of my projects . Fortunately I don’t have to waste my time dealing with them usually as all the touchy feely megafauna stuff isn’t my bailiwick but it does distract resources from more important stuff and slows progress and makes it all around more difficult when the political backlash hits and its like a science stinks backlash.
I can closely identify with that as a professional in a trade that goes as far as it can to inspire public confidence vengefully rooting out the nutcases and the unethical.
So what ever paper you suggest should be at a minimum a 2020 paper or later. For all I know Roy might publish the first one. Maybe there are some out already. I don’t have a free account to see stuff not being offered up in my area of work.
The American Meteorology Society Journal I sent you appears to be a game changer in terms of analyzing urban encroachment and building a solid CRN.
If CRN is going to be your gauge I am good with that. Just that the database is still very short. But I have a lot of confidence that the Civil Service at NOAA is absolutely dedicated to making it the best database possible. That paper I sent you is going to help them do that. Their original site selection was designed to avoid allowing an urban encroachment trend to creep in. Yet they discovered it had from some of the ground truthing experiments they set up in it. The paper describes a farming operation with greenhouses nearby.
If you understood where I was coming from you would better understand my position. I have been working around data very similar to this for a very long time. I have nearly 25 years experience as either a fulltime or part-time consultant to federal agencies on projects that extend out to 3 decades or more in the evaluation processes of available information. I am involved in regulatory processes to collect the data, symposiums to discuss what data is needed, etc.
CRN should be a great gauge for the other temperature services. There is no way to evaluate a very large percentage of foreign data. Clean up our own act and it will be a fine tool to help build a network of systems under a single roof. Nowhere in the world is there an opportunity like here to do that.
> I have nearly 25 years experience as either a fulltime or part-time consultant to federal agencies on projects that extend out to 3 decades or more in the evaluation processes of available information. I am involved in regulatory processes to collect the data, symposiums to discuss what data is needed, etc.
Gill, Gill.
You are Bordons sidekick.
Besides, you realize that without any auditing accomplice Enron could never have happened, right?
The firm was Andersen. They destroyed more than one ton of documents. Where we ou back then?
Enron? No need to go back that far.
This was just filed:
SAExploration Sues Auditor for Malpractice, Negligence, Seeks $45M January 17, 2023.
Houston oilfield services corporation SAExploration is suing its long-time former auditor for allegedly failing to detect a $100 million fraud scheme operated by the company’s former top executives for several years. SAE accuses Pannell Kerr Forster of Texas of negligence, malpractice and “dereliction of duty” that resulted in SAE being forced into bankruptcy, subjected to multiple federal investigations, being delisted by Nasdaq and targeted for class action lawsuits.
And you are a leftist propagandist whose sole function is to cause chaos, nothing more.
You and Wiltard.
No U, Troglodyte.
In this house we believe in the laws of thermo.
What does the law of thermo have to do with the propaganda you are spreading?
Gill, Gill,
Why should anyone care about your JAQing off?
Obviously Willard cannot or doesn’t want to support his claim.
Willard, please stop trying to troll.
<:
Gill obviously has not been following along.
Willard, please stop trying to troll.
Willard if ENRON had an auditing accomplice it was never established. You have to understand how audit firms are constructed to understand that if they had an auditing accomplice it would be one guy that managed to the pull the hood over his partners.
A firm like Anderson didn’t make enough money from ENRONs audit assignment to take such a risk. ENRON was failing and the audit firm failed to detect it early enough to save the Board of Directors and ENRONs investors from going bankrupt. That is known as an audit failure.
The failure was caused by failing to detect that ENRON was keeping two sets of books and transferring investment failures into a hidden account. And yes a person committing such fraud will use all sorts of tactics to hold off the auditor.
I don’t know the finer details of how Anderson got convicted for destroying documents. All I know is destruction of documents is a normal policy. Its a bit like what is going on with Biden and Trump classified documents. While auditing the auditing team will get reams of computer read outs, ledgers, journals, of transactions to do their work on. Individual auditors can also generate a lot of ‘notes’ to remind themselves. All this is supposed to be destroyed after an audit but like Trump and Biden some of it sits around auditor desks in filing boxes and some auditors I know store a lot of that stuff in their own garages at home.
It is all confidential data in accordance with an audit firms responsibility to not publicly release any information they learn about the firm that is not in the auditors report. Thus that policy is in place. The audit itself has a report that is publicly released and it has the audit files, which are copies of all documents used to arrive at the conclusions of the audit. Those documents are not destroyed. I can’t remember how long they are supposed to be retained but its a long time.
So its possible that when the auditors finally did detect problems they ordered the individual auditors to destroy any records not in the audit firm filing system and likely after a court order to not destroy any documents. They would not have ordered the destruction of the documents that supported the audit as that is their only defense, the body of their work, that could show they might have done the audit in accordance with audit standards.
The destruction of documents in the possession of individual auditors neither support the process of internal review of audit findings as they are never part of that review so individual auditors are supposed to destroy any extraneous documents in their possession once the audit is over. but a lot of individual auditors dream of creating a business themselves and retain documents that they view informative on how to run a business, thus the practice of storing documents in their garage. Its there for potential personal use in a business scheme.
Wiki says they lost their license to practice because of the document destruction. I can’t say if they otherwise might have been able to prove an adequate audit beyond the fact that it failed. At best thats a difficult job to do in face of the ENRON losses. But failures occur and auditors by the body of work and documentation in the ‘audit files’ they can demonstrate the audit procedures met auditing standards. It is sometimes the case an auditee through forgeries and other means can avoid detection. But it gets more difficult to do so as the fraud gets bigger.
I can sympathize with Andersen in that ENRONs form of business was surrounded by a lot of government meddling and was a unique business that arose out of that meddling. The firm I did work for had several firms fail and our firm was the one who detected the impending failure. All the failures were the result of government programs where regulations were being promulgated so fast that the firms could not keep up. Those regulations were requiring the firms meet more and more financial standards required by the government. We worked our tails off to be sure we were auditing in accordance with those government standards and found our clients were not in compliance and were not meeting the ever changing benchmarks that the government was requiring.
So each firm became faced with the prospects of seeking investment from the owners to keep the firms solvent. But it was clear that the government was intent on putting the firms out of business so investors declined to throw good money after bad money. These firms were our savings and loan customers. Today there is no savings and loan type financial institution so the investors made the right decision. Its actually a shame. The great Christmas movie ”Its a Wonderful Life” was a story of a small savings and loan that failed because of predatory practices by a big bank. So today the Big Banks have won and it is the government that is owning all the loans for them and guaranteeing the big banks. Of course that resulted in 2008 for practically the exact reasons why the earlier failures of the small institutions occurred. . . .government meddling. Stuff like lending standards. Lets make it so anybody can buy a house (affordable housing, low underwriting standards-legalization of phantom security sales to move the paper into investor markets). . .lets allow investors to shelter their income with paper losses (tax shelters for the rich – Whitewater-legalization of phantom security sales to move the paper into investor markets). . . .stuff like that.
IMHO, most of all that if not all that was out of good intentions by people that just didn’t know what they were doing. You had smart people taking advantage of it and dumb people investing in it. And of course if the banks and S&Ls don’t go along with it they are out of the lending business as actually charging rates commensurate with risk was considered to be predatory lending practices.
As to me I have said here before I left financial auditing 25 years ago. A few years before the ENRON scandal and developed my own consulting service and I never worked for Andersen but I got tired of financial auditing and wanted to use my skills for a better environment as I am an lifelong outdoorsman. . . .love working outdoors and now I can do it for fun and profit.
Gill, Gill,
You are an incompetent fraud:
https://en.wikipedia.org/wiki/Enron_scandal
Bordon needs a better sidekick.
Revise and resubmit your backstory.
read it again Willard thats exactly what I said. Stupid is as stupid does dude.
I didn’t even sugarcoat it because I didn’t see that the Supreme court overruled the pulling of Andersens license. I don’t know why the Supreme Court did that or what doctrine they relied upon to do it.
What is important to note is the document destruction policies in place at audit firms isn’t for the purpose of avoiding liabilities. They are supposed to have avoided those liabilities via firm review of the audit files and determining that those audit files supported audit standards. They destroy papers to maintain confidentiality regarding client operations because a paper in somebody’s office/cubicle is part of the audit firms opinion.
If that review by firm partners determines the retained audit files are lacking the audit isn’t closed and more work is done to bring the files up to snuff.
Like I said I was out of the business when this happened and didn’t follow it closely like I would have if I was still doing that kind of work.
Since my post I read an LA times article that says Andersen executives were getting concerned by the size of the audit and the fact revenues from it were rising to about 1.3% of Andersen’s revenues. Auditors take independence very seriously. What a huge audit might trigger for an audit firm is either to resign to maintain independence or a merger with another firm to increase the size of the audit firm to keep revenues from the audit immaterial.
Myself knowing first hand how an audit firm operates the chances of a conspiracy are slim, not impossible. Independence is discussed all the time in audit firms out of abundance of caution. So discussion of the matter is routine also.
Conspiracy is slim because a managing partner making say $400,000 a year isn’t likely to place a bet on a failing company to survive the rest of his career to make an extra 10 grand a year by auditing the firm. Generally audit firms only hire people a lot smarter than that.
You though seem to have drawn some conclusions about that out of total ignorance of audit firm practices. But whats new?
It was the Big 8 firms when I was auditing. Today its the Big 4. That is likely a result of these firms too big to fail needing audits. A trend I don’t like at all. I am a big advocate for small business.
Gill, Gill,
Gill.
Not another Bordonian rant.
Give me a break.
Here’s you:
Here’s thy Wiki:
IF you are or were a real auditor, you’re just a fraud.
Your best bet now is to accept that you’re Bordon’s sidekick.
Leave rants to him.
And the Supreme Court voided that voiding of Andersens license to practice?
Why did they do that?
You’re almost making it interesting, Gill:
https://www.drroyspencer.com/2023/01/urbanization-effects-on-ghcn-temperature-trends-part-i-the-urbanization-characteristics-of-the-ghcn-stations/#comment-1435526
Time for another Bordonian rant!
Willard, please stop trying to troll.
Yep the Supreme Court unanimously overturned the Andersen conviction. It would have been possible to retry the case without the improper jury instructions but that was never undertaken.
The law itself is a bit blurry regarding at what point one should suspend document destruction under a firm’s document retention policies. Apparently there does not need to be a court order, or notice. It is supposed to be when the defendant believes an action is imminent whatever that means.
Personally, I don’t believe there was any ”accountant” conspiracy. As I said above generally public accounting firms hire smarter people than that. If a key accountant was bribed and there is no evidence of that; it isn’t likely the bribed accountant would have had evidence of that laying around the accounting office.
bill h…”I have a lot of confidence that the Civil Service at NOAA is absolutely dedicated to making it the best database possible”.
***
I am not questioning the NOAA database per se, I am questioning why they are ignoring it and going with climate models to interpolate and homogenize a small subset of the station data they have.
NOAA also completely ignores the data from their own satellites. They were hiding it away till UAH approached them to get the data.
“NOAA also completely ignores the data from their own satellites. They were hiding it away till UAH approached them to get the data.”
Until you provide some substantiation for this, I’m going to assume you made it up or got it from a blog that made it up.
Actually, if you look into the history of UAH, as related by Roy and John Christy, they make it clear that NOAA wasn’t using the data and they asked for it and got it.
Well I’m sure you are going to provide me a link any minute rather than tell me to go look for myself.
”I am not questioning the NOAA database per se, I am questioning why they are ignoring it and going with climate models to interpolate and homogenize a small subset of the station data they have.”
There you go Gordon. The Civil Service doesn’t approve its own budget.
Instead they seek advice on that from the academic community and it is the politicians that make the final decisions on budgets with the academic cover.
When one works for or is consulting directly with the civil service one has a good view into how these processes work.
I am nothing but a pro-science guy who gets it that if we follow good science it will work out the best for the general public. Its the good science part where it gets sticky. I am also conservative in nature and understand how politics can get out of hand no matter which party is in power. So the American experiment from the start has differentiated itself by broad restrictions on government power at the federal level. This provides some opportunity for the states to compete with the federal government having the job of trying to keep that competition fair.
Government is a necessity over the commons but the standard needs to be like a 95% confidence level or better in science. So what is the estimate of IPCC confidence? Half of warming is manmade?
Using UAH thats about .7 degrees per doubling of CO2. Are we going to get our panties in a twist over that. You betcha a lot of people have an interest in doing just that. Where is the line? Same for the science surrounding extinctions. Its really messy with huge extrapolations about what the natural rate of extinction is for bacteria from natural variation which appears to be at least a couple of degrees of fluctuation itself even it that isn’t occurring right now. Thats why the 2 degree standard was put in place and because it really doesn’t appear to be solid science we will reach that obviously a lot of people want to move it down as much as possible for whatever reason they have.
Some are a bit more pragmatic about what constitutes ‘destroying the world’ or ‘negatively changing it’. Thats why I recommend reading Hard Green by Peter Huber so as to pay a bit more attention to a more intelligent point of view. I don’t agree with everything Huber writes but there is an important lesson in that book that everybody should give their own thought to. And a corollary to that about when one might be going over the line in thinking they have the answer for what is best for everyone else. . . .which is the definition of fascism and communism the point where a limited number of people make that decision on virtually everything. . . .right down to altering the definition of some of the most basic characteristics of the world. The point where anarchy meets authoritarianism in a very dark place.
And oh back on topic again. Does anybody know of a major university that doesn’t run a surface weather station?
Perhaps there will be a new trend in place where they run a CRN station that they have to take a field trip to. Some universities have enough land to have one on campus.
As I said Gordon when you say NOAA this or that, its important to know which NOAA you are talking about.
There is NOAA the Civil Service and there is the NOAA Academia. Two completely different organizations with completely different loyalties. It would be nice to label them as such with NOAA-Civil having the career scientists of civil service in charge of science. And NOAA – Academic.
I am not claiming one is necessarily better than the other. It only becomes very clear when an issue gets politicized as to where loyalties lie.
“If you know of a good paper. I would read it.”
This paper, the methods paper that describes how USHCN v2 was compiled, refers to work done to address UHI from 1988 and also in the paper itself.
They adjustment algorithms are tested on fabricated data that has deliberately been infected with the sorts of biases the method is designed to weed out. This is one of many tests done to see if the method works. The urban heat influence is corrected by pairwise analysis, which you can read about here.
“An automated homogenization algorithm based on the pairwise comparison of monthly temperature series is described. The algorithm works by forming pairwise difference series between serial monthly temperature values from a network of observing stations. Each difference series is then evaluated for undocumented shifts, and the station series responsible for such breaks is identified automatically. The algorithm also makes use of station history information, when available, to improve the identification of artificial shifts in temperature data. In addition, an evaluation is carried out to distinguish trend inhomogeneities from abrupt shifts. When the magnitude of an apparent shift attributed to a particular station can be reliably estimated, an adjustment is made for the target series. The pairwise algorithm is shown to be robust and efficient at detecting undocumented step changes under a variety of simulated scenarios with step- and trend-type inhomogeneities. Moreover, the approach is shown to yield a lower false-alarm rate for undocumented changepoint detection relative to the more common use of a reference series. Results from the algorithm are used to assess evidence for trend inhomogeneities in U.S. monthly temperature data.”
Another way they test the algorithms is to invert the sign of every datapoint and see if they get a mirrored result. If so, this means that there is no warm or cold bias inherent in the method.
It really is worth investigating the methods that the compilers use, rather than ignoring and dismissing them with a wave of the hand.
“They pick a proxy out of the sky and go with it.”
Yeah, waving your hand like that.
Here is a 2013 paper that estimates and tests for correction of UHI using several independent methods.
https://agupubs.onlinelibrary.wiley.com/doi/full/10.1029/2012JD018509
The issue has been known about for decades. The temperature record compilers have been researching it for decades. I don’t see any evidence that Fall et al inspired the compilers to modify their approach, and nor should it, as Watt’s peer-reviewed work offered nothing new, just a bit more detail.
Has Watts given up on surfacestations? That was the one great thing he has done for research on this subject.
b,
From your first link –
“Adjustments for undocumented changes are especially important in removing bias in minimum temperature records.”
Why the need to remove supposed bias which has not been documented?
Do you bother reading your references?
Climate is the statistics of historical weather observations. If the observations are incorrect, derived statistics will likewise be incorrect. Observing thermometer temperatures is meaningless in almost all cases.
Reading a thermometer tells you what the thermometer temperature is – not what it “woulda, shoulda, coulda” been. If a thermometer is showing a higher temperature that what you think it “should be”, either the thermometer has failed in its job, or your “thinking” is fantasy.
Facts are facts, Get used to it.
“Do you bother reading your references?”
Yes, the whole thing. You should try it, so you actually know what you’re taking about.
But that’s not what you’re interested in, is it?
The paper you cite using several independent methods says:
”Urban sites were defined as those characterized by a 19302000 population growth of ≥10 people/km2, which yields similar-sized numbers of urban and nonurban stations, as shown in Table 1. While there is no available justification in the literature for this or any specific 19302000 population growth cutoff as a proxy for urbanization, this value was chosen to be reasonably conservative and to produce an urban/rural division generally in line with the other urbanity proxies.”
I would assume that Roy is going to test this assumption and has 20 more years of data to use.
The excuse for such an assumption has gone by the wayside (too much work to do it right). Today with the amount of data in GIS mapping (while they have been doing it for 5 decades it has only been a bit more than 2 decades that this software has been widely available for desktop computers) and USGS itself greatly accelerated the use of the software by providing an online platform. Back in 2000 we hardly had an internet and very few available online databases.
Thats why I said I would love to see a post 2020 study. The 2019 paper I provided to you shows unexpected UHI effects from an encroachment not expected to yield UHI. I don’t think Roy is going after that but I don’t know for sure. What is for sure is that in the past 2 decades there are orders of magnitude more information in databases to work with.
“The 2019 paper I provided to you shows unexpected UHI effects from an encroachment not expected to yield UHI.”
Again, you falsely report.
“During one of these annual visits, site technicians noted encroachment at the Kingston, Rhode Island, Plains Road Site station. From discussions with the site host, there were plans to expand a parking lot, reroute a road, and move a heated greenhouse all within 100 m of the station. Rather than remove this station prior to construction, it was decided to leave the station in place and record the nature of the air temperature changes caused by the encroachment. This decision was feasible because of the existence of a second Kingston USCRN station (Peckham Farm Site) only 1.4 km to the south that assured continuity of the climate record at this location, and provided an unbiased observation set for comparisons.”
https://journals.ametsoc.org/view/journals/apme/58/6/jamc-d-19-0002.1.xml
What is wrong with your mind? They didn’t negligently place the station, they noted the burgeoning encroachment and decided to use it as a case study on UHI!
This is a pattern with skeptics. Invent a story about climate researchers that is the opposite of what actually happened.
Gordon does exactly this with his “they deleted thousands of stations,” BS. In fact, the reason that there are fewer stations in the most recent past is the retrospective addition of historical data that doesn’t update automatically to NOAA.
Seriously, ‘skeptics’ get it back-asswards all the time, and you have just demonstrated this brilliantly, Bill.
That study, by the way, is written by NOAA employees who work on the US temperature record. Just as NOAA has been doing for years.
It’s great that you’re aware of a lot of research on UHI.
But the narrative you have on it is misguided. The effect on the temperature records has been assessed and addressed in multiple ways for many years. The paper I linked you shows only several of these.
There is a paper list on it that goes up to 2013.
https://agwobserver.wordpress.com/2009/12/27/papers-on-urban-heat-island/
If you’re excited about UHI, you should acquaint yourself with these.
I know you’re looking for the post-2020 bombshell, but you might as well inform yourself of the state of the science. Roy is not helping you with that, and nor is Anthony.
If you want to help, you could go to that web page and offer suggestions to the compiler to update that list, as I’ve done on other topics there. I might even do it for UHI and get the list up to date, when I have time. But I’m traveling tonight.
Here’s a post 2020 study:
https://journals.ametsoc.org/view/journals/clim/33/20/jcliD200118.xml
They find UHI affects minimum temperatures more than maxima, corroborating most other studies.
The largest difference of min/max av. temp trends between rural stations and all stations is 0.032 C/decade.
All stations: 0.388 C/decade
Rural stations: 0.356 C/decade
How does Berkeley Earth assess the same trend for the same region?
0.0335 C/decade
So Berkeley’s assessment is even lower than the rural result.
The BE study I saw used the linear assumption also using lights seen from a satellite to divide rural and urban. Same problem as Hausfather the study you previously provided.
the Chinese study you provided isn’t any better. They used a percentage of developed areas over a 10km2 around the station and adopted the linear assumption.
then you claim: ”What is wrong with your mind? They didnt negligently place the station, they noted the burgeoning encroachment and decided to use it as a case study on UHI!”
You are losing your mind. I never said they negligently placed the station there. I read how this came about.
I am not the least big concerned about CRN and have said so more than once in this post’s comment section. Further Roy think he is very close to CRN. Since I know Roy has and uses ENSO smoothing algorithms for comparisons and looking at your data comparison of UAH to CRN I can just eyeball the ENSO relationships and see he is going to a lot closer than your trend lines indicate. So I have no concern there either.
One point I was trying to make is the CRN standard of trying to keep development 100 meters away. I followed Anthony’s work and he wasn’t calling out 100 meters. I don’t remember the number but I think it was about 10 meters. So that’s leaving a lot to be desired in the ‘good’ station network. And my gawd, what do they do in foreign countries? Its got to be a mess.
Next time I am in Tijuana I will have to visit their weather site.
“You are losing your mind. I never said they negligently placed the station there. ”
Oh yes? Then please explain what you meant by this.
“The 2019 paper I provided to you shows unexpected UHI effects from an encroachment not expected to yield UHI.”
You are saying they placed the station without anticipating any UHI effect from encroachment.
That is completely wrong, as quoted above from the paper.
They went ahead with the station placement in full awareness of the UHI encroachment in order to measure the UHI effect.
You do not report the science faithfully is what I’m saying. I don’t think you read it carefully, or you read it through some mental filter.
“the Chinese study you provided isn’t any better.”
You’re welcome. Remind me not to help you find papers in the future. how is your own search with post-2020 papers on UHI coming?
By the way, do you think Roy is going to use linear trend analysis or something different? Previous of his posts on UHI suggest he will use linear trends to test for divergence over time. He has also used the pairwise method used by NOAA.
Now you are mocking using linear trends? You can’t be serious. You aren’t really that dumb are you. You just playing a role here right?
If UHI isn’t linear you will be able to show a linear difference in warming rates between ‘properly binned’ stations. . . .that will be a UHI component attributable to those stations.
And since urban areas are grossly over representative compared to the land area they take up warming in the raw mean then gets multiplied in the process of gridding and kriging.
I assume when you talk about USCRN being close to USCHN you mean in raw data form right? Then that would be the explanation of why when Bindidon grids the data the trend steepens. That steepening IMO is a huge red flag.
Roy notes that only 13.2% weather stations show less than 5% urbanization meaning 86.8% are urbanized at more than 5%. I would be surprised to learn that more 10% of the land has 5% urbanization.
You can show me a thousand UHI studies that assume UHI is linear with percentage of urbanization and you could miss UHI totally if Oke is right that the UHI effect is most pronounced at low levels of urbanization.
The question that Roy is pursuing is whether the trend is 1.4c/dec
1.7c/dec, or 2.0c/dec, or 2.3c/dec.
A lot of scientists are betting on 1.7c already.
opps I use century number rather than decades. so its .14c/dec; .17c/dec etc.
“Now you are mocking using linear trends?”
What on Earth are you talking about? I’m saying Roy is using them because you are saying that they aren’t good enough for studying UHI.
“I assume when you talk about USCRN being close to USCHN you mean in raw data form right?”
I mean the homogenised data set that NOAA use for their national US temperature record is virtually identical to USCRN.
https://www.ncei.noaa.gov/access/monitoring/national-temperature-index/time-series/anom-tavg/ann/12
In fact, the homogenised data set has a very, very slightly cooler trend than USCRN.
Good to see you’ve stopped wrongly claiming that the station in the 2019 paper was placed with no awareness of UHI. It was placed knowing UHI would encroach, as a case study on the effect.
Barry continues to lie after being corrected. The man is destroying his own credibility.
I never said the crn station that was encroached after its establishment was wrongly placed.
Earlier, some troglodyte wrote –
The Revelle Factor isnt a factor.
Denial was strong in that troglodyte.
If the ocean is the prime net source, you would need to find a sink that has taken up around 1500 Gigatons of CO2 EXTRA, the cumulative anthropogenic emissions.
Also, why is the atmospheric oxygen concentration dropping faster than the CO2 increase?
Wiltard the propagandist,
You’re not worth responding to most of the time, including now.
Do you see the Revelle Factor anywhere in the continuity equation for CO2? It is in countless Atmospheric Physics textbooks. Learn some physics.
How is that a response, Troglodyte?
You are just pouting.
What he is saying Willard since you can’t interpret it. Is provide some support for your imaginations. Like you know support for a model for the moon translating like in:
https://www.youtube.com/watch?v=ey1dSUfmjBw
Gill, Gill,
That’s not what Troglodyte says.
That’s you peddling your crap:
https://andthentheresphysics.wordpress.com/2017/06/16/peddling/
Troglodytes like you believe they don’t need to provide support for their opinion.
Gill, Gill,
It’s ninja, and I just did.
Willard, please stop trying to troll.
So where is your support for your opinion. Seems that support is a one way street here in this land raided by Troglodytes.
What opinion, Bill, when do you ever support any of your rants?
I don’t think you understand. The Revelle factor defines the rate at which the ocean can release CO2 to the atmosphere.
Including CO2 absorbed by various sinks, Berry’s hypothesis requires that the ocean release the equivalent of 4ppm/year to the atmosphere. That is 31.2 gigatonnes/year.
Can you demonstrate that this is possible?
The details of the calculation are above my pay grade but I’ve managed to pull two conclusions from the literature.
1) The Revell factor is currently about 11.
2 The amount of dissolved CO2 is low enough that the net flow of CO2 is from the atmosphere to the ocean, so the Revelle factor is actually defining the rate of uptake from the atmosphere to the ocean.
Once again Berry is claiming net CO2 release from the ocean when the physics describes net uptake. Falsified again.
EM,
As there is no GHE, and CO2 does not make thermometers hotter, what is the point of your comment?
Is it another SkyDragon cultist diversionary tactic, implying that mankind’s efforts to put back some of the CO2 removed by Nature, are somehow bad, or sinful?
Any hypothesis remains speculation or fantasy, unless it can be expressed in a way that allows falsification by experiment. Until then, it may be a case of one expert expressing a different speculation to another. All well and good, but as Feynman said “Science is belief in the ignorance of experts.”
Speculate away. Call yourself an expert if you wish. The sound you hear is me laughing at a SkyDragon cultist.
Extremely cold air from Siberia is moving south. North China (Mohe region) is reporting temperatures below -50 C – one of the lowest during the measurement period.
https://i.ibb.co/qM0HMwm/326933976-724978299017832-560587358069662243-n.jpg
bill h…”It really does have the appearance you [Bindidon] dont know what you are talking about”.
***
That’s not an appearance, it’s a fact.
Yep you need to lump willard into that one too. He is dumber than a rock with a vocabulary.
Gill, Gill,
How many rocks with a vocabulary do you know?
Willard, please stop trying to troll.
One
So I’m dumber than I am, Gill?
Good grief.
Whacky Wee Willy,
You wrote –
“So Im dumber than I am, Gill?”
If you say so, Willard, if you say so.
No Willard there are lots of rocks.
All rocks are dumb.
There is one rock with a vocabulary
Therefore: The rock with a vocabulary is dumb.
Gill, Gill,
You said:
“He is dumber than a rock with a vocabulary.”
You need to work on that comedian skill.
It wasn’t intended to be comedy.
Index Nino 3.4 down again.
https://www.tropicaltidbits.com/analysis/ocean/nino34.png
Confirmation of NOAA’s cheating.
https://www.ncei.noaa.gov/access/monitoring/monthly-report/global/202213/supplemental/page-4
“Evaluating the temperature of the entire planet has an inherent level of uncertainty. The reported global value is not an exact measurement; instead it is the central value within some range of possible values”.
“…a reported global value of +0.86C 0.15C indicates that the most likely value is 0.86C warmer than the long-term average, but, conservatively, one can be confident that it falls somewhere between 0.71C and 1.01C”
Note…the global temp is ***MOST LIKELY*** to be 0.86C warmer.
Note…one can be ‘confident’. The word ‘confident’ in statistics is nothing more than a platitude. It could be totally wrong, even though it may be unlikely. Before Australian researcher Barry Marshall discovered that duodenal ulcers are caused by the bacterium h. pylori, I am sure scientists would have claimed a 95% confidence level the ulcers were caused by stress and excess stomach acid.
There is no precision in ‘confident’, a guess is still a guess. This is not as if someone had taken 10 measurements using a thermometer and estimated the error as +/- of a certain measurement, it is an outright guess. In other words, NOAA is not estimating the error on each thermometer reading as +/- 0.15C, they are estimating the error in guessing at the global average.
If you were reading a standard thermometer graduated in 0.1C intervals, a standard error in reading the instrument would be no more than 0.05C. If you summed all the thermometers globally, the error should be no more than 0.05C, and that’s being generous.
The +/- 0.15C error is a guess because they use only 4000 buoys to cover 70% of the planet’s surface area in the oceans. They have also admitted to using less than 1500 thermometers to measure the other 30% which is the solid surface.
I made a mistake the other day and reported Earth’s land surface area as 510 x 10^6 km^2. I feel exonerated since all the alarmists missed it as well. The land surface area is 148.9 x 10^6 km^2 and the oceans are 361.1 x 10^6 km^2, for a total of 510 x 10^6 km^2. Those are approximations.
Anyway, 4000 buoys will cover 361.1 x 10^6 km^2/(4 x 10^3 buoys), giving us 90.3 x 10^3 km^2 per buoy. That buoy is also drenched with sea spray and I am pretty sure Argo buoys submerge between readings. Therefore NOAA’s claim of a +/- 0.15C error margin is absolute bs. It is, as I claimed, nothing more than a guess.
The area covered by that 1 buoy is approximately 100,000 km^2. That’s about the area of South Korea. Yet NOAA is claiming you could stick one thermometer in Korea and estimate the temperature of S. Korea with an error of only 0.15C? You’d be lucky if you could estimate it within +/- 2.5C.
We have already been introduced to the chicanery of NOAA when they announced 2014 as the hottest year ever, using a probability factor of 48%.
Barry has claimed their website admission, that they slashed the global land surface database to less than 1500 thermometers, is a lie. I have supplied a link to the site confirming it, yet Barry insists it is a lie. What is the likelihood NOAA is lying about that when they have proved themselves to be unreliable climate alarmists? It’s not like an alarmist to understate the number of thermometers they use.
C’mon, Bordon.
wee willy is rendered almost speechless, an encouraging sign.
It’s just too dumb for words, Bordon.
C’mon.
Willard, please stop trying to troll.
We’ve already been over this. Th confidence limits of the global average temperatures depend on:-
1) The internal variability of the mean of the data, which sets minimum confidence limits For the GISS data this is about +/-0.6C
2) The sample size n. Confidence limits improve in proportion to measurement uncertainty*1/√n.
Plot confidence limits against sample size and you get a rectangular hyperbola. Confidence limits decrease rapidly at small sample sizes, but you reach a sample size at which the graph flattens and further increases in sample size have very little further effect on confidence limits.
In practice the useful limit on sample size is when the confidence limits due to sample size are the same as the confidence limits due to internal variability.
For the temperature data the crossover point is 1500 stations.
It is not a coincidence that NOAA,GISS, Berkeley and others use 1500 well distributed high quality stations for global average calculations.
Extra stations give some redundancy but do not improve the quality of the means. Please give the old denialist meme that there aren’t enough stations the recent burial it deserves.
ent…”Th confidence limits of the global average temperatures depend on…”
***
Sorry, in science, you don’t need a confidence level when you have real thermometers. In that case, the error margin is the degree of error in reading the thermometer graticules.
Confidence levels come into play when you don’t have enough thermometer readings to accurately cover an area. In that case, you must rely on not only statistical averaging but statistic homogenization. In other words, you need to use data from real thermometers to infer temperature within a certain distance of the thermometer then clean up (homogenize) the sum.
NOAA owns GHCN, and GHCN has well over 100,000 stations available to them. Why then, does NOAA admit to using less than 1500 thermometer globally for surface temperatures? Adding the 4000 Argo ocean buoys, that is less than 2000 thermometers to cover the entire planet.
Gavin Schmidt at NASA GISS gave a glimpse into the problem. GISS can’t afford to process more than 1500 stations monthly. So, they use the 1500, or less, in a climate model, and fudge the rest of the temperatures. Same with NOAA, and that’s why they are offering a lame +/- 0.15C error probability globally.
Given the use of a 38% probability of 2014 being the warmest year ever, GISS outdid NOAA’s 48%. The way they play with statistics, it’s a no-brainer that even the +/- 0.15C global error probability is bs as well.
That’s why UAH is far more reliable than either NOAA or GISS. The sats cover 95% of the planet with bazillions of data points generated per orbit. Plus, the sats cover all of the oceans as well.
> you dont need a confidence level when you have real thermometers
C’mon, Bordon.
Confidence intervals were invented for measurements.
Thermometers are M E A S U R I N G D E V I C E S.
How can you be that stupid?
Confidence intervals are for statistics that CAN be used for measuring devices and measurements they take.
There are three kinds of lies: Lies, Damned Lies, and Statistics
No willard confidence intervals were not invented for measurements.
Confidence levels are for statistics when ‘sampling’ ‘representative populations’.
If there was one thermometer in south korea it would be sufficient if and only if the temperature was the same throughout south korea.
One might go about that by randomly spreading 100 thermometers around south korea and seeing if they all read identically in relationship to the accuracy you are seeking.
Then if the climate never changed then you can use one thermometer for south korea.
Of Course that is what Al Gore told us was true before mankind started messing up stuff.
. . . .which once again proved the saying at the top of my post.
You’ll have to fight that one with Neyman, Kolmogorov, Borel, Lévy, Fréchetchet, and others.
Statisticians need an estimation method in general, but they sure need one for measuring stuff.
My last comment was obviously for Richard.
Gill’s rant is just that, a rant.
Weepy Wee Willy,
You wrote –
“Confidence intervals were invented for measurements.”
Wikipedia says –
“In frequentist statistics, a confidence interval (CI) is a range of estimates for an unknown parameter.”
In other words, a guess. Hopefully, a good guess, but a guess nevertheless.
When I board a plane, I dont expect the pilot to express anything other than certainty that the plane will arrive at its destination intact. A 99% confidence interval is not good enough for me.
For SkyDragons like you, you would accept Gavin Schmidt’s assurance that a year was the “hottest ever” with a probability of 38%. What do you assess his “confidence” as?
You are truly stupid, aren’t you?
What are you braying about, Mike?
Willard, please stop trying to troll.
https://www.youtube.com/watch?v=jAuBGNwIn6w
Artificial Gravity: From Cinema to Reality – Jan 18, 2023
Linked from: http://www.transterrestrial.com/
re Revelle Factor. Even though Roger Revelle produced this factor for the ocean, circa 1990, just before he died, he wrote a paper with Fred Singer cautioning people not to read too much into global warming propaganda.
His announcement drove Al Gore ballistic. He studied under Revelle at one time and in his infinite stupidity, he interpreted Revelle as being an alarmist, like him. Gore inferred that Revelle had become senile and that Singer had taken advantage of his alleged, reduced mental capacity.
These days, Gore is preaching his mantra of climate gloom and doom with no evidence that it is happening anytime soon. Meantime, he is making lots of money preaching the propaganda.
C’mon, Bordon.
Not that Revelle story again:
http://rabett.blogspot.com/2007/04/roger-revelle-was-right-eli-because-he.html
You never pay due diligence to any of this.
Ask your sidekick how that’s supposed to work.
Woeful Wee Willy,
Talking in tongues again?
How are you going, finding a sensible description of the GHE? Maybe thermometers react to heat – as Dr Spencer seems to be surmising. Anthropogenic heat.
Mike Flynn,
Braying again?
It has been a while – tell us your molten Earth bit.
Wondering Wee Willy,
Because you grovel so nicely, I’ll repeat –
The Earth cooled from its initial molten surface over the last four and a half billion years or so, to its present temperature.
Obviously, no “greenhouse effect”, making the surface hotter, operated during this time. Otherwise the surface would no5 have cooled – and it did.
Additionally, at night, it can be observed that the surface cools, losing all the heat of the day, plus a little of the Earth’s internal heat. No “greenhouse effect” in evidence.
Either short term or long term, no “greenhouse effect” to be observed.
Anything you don’t understand? Rhetorical question, of course, you dont understand any of this, and you refuse to accept reality into the bargain. Go back to trying to troll – with a lot of effort, you might be able to annoy somebody.
Give it a try, if you like.
[laughing at dimwit with his masturbatory “JAQing off” insult attempt earlier]
Well done, Mike!
Bray again about deserts.
Willard, please stop trying to troll.
Let me bring you up to date on Eli, aka Josh Halpern. He has a degree in physics but he teaches chemistry. Go figure.
Eli co-authored a paper under his real name, Halpern. The aim of the paper was to discredit the paper by Gerlich and Tscheuschner who wrote a paper falsifying the GHE. When G&T quoted the 2nd law re heat transfer being only from hot to cold, Halpern et al responded that with a radiative transfer, that would mean one body was not radiating.
That is typical of climate alarmists who have no idea what the 2nd law means, or the difference between thermal energy and electromagnetic energy. Halpern et al thought that two bodies radiating at each other had to transfer heat in both directions. The truth is, even with radiative transfer, heat is transferred in one direction only.
As I have explained here many times, no heat is physically transferred via radiation. So, not only did Halpern et al not understand how heat can be transferred by radiation, they did not even understand the 2nd law.
When Halpern quotes Revelle and makes insinuations about Fred Singer, excuse me while I snicker up my sleeve.
C’mon, Bordon.
Eli does not insinuate anything.
He’s accusing Fred of being an opportunistic tool:
http://rabett.blogspot.com/2014/09/a-note-about-roger-revelle-julian.html
Which he was:
https://tobacco.ucsf.edu/climate-denier-fred-singer-complains-about-merchants-doubt
You ranted for something like 5K words today.
That should be enough even for a pathological liar like you.
Willard, you wrote –
“That should be enough even for a pathological liar like you.”
Please stop trying to troll.
Gordo,
In Berry’s third paper, he tests his model using IPCC’s Natural Carbon Cycle data, and they agreed. However, they disagreed when he used his model to test IPCC’s Human Carbon Cycle. This demonstrated how the IPCC treats Human and Natural carbon differently, violating the Principle of Equivalence. Equivalence Principle says nature cannot tell the difference between Human CO2 and Natural CO2. They both consist of a single carbon and two oxygen molecules.
Sorry, a single carbon and two oxygen atoms.
Also, there is no Revelle Factor in the continuity equation which fits the IPCC’s natural carbon cycle data.
Gill, Gill,
Are you new to all of this?
The Auditor peddled that story for years, and you never studied it?
Does Andersen exist as an auditing firm anymore?
Willard, please stop trying to troll.
CO2s Part in Global Temperature Rise
Not having the skills of a disciplined researcher my laymans understanding of how CO2 behaves is that the IR radiation from earth (average temperature 60 degrees F) is absorbed by atmospheric CO2 molecules thus attaining the same temp ie 60 degrees F. The CO2 molecules in turn re radiate the same IR temp in all directions. That directed at earth because it is at the same temp has no effect on earth temp. The CO2 molecules are just a relay to outer space.
Transfer of heat to the oxygen, nitrogen and argon in the atmosphere would have to be by conduction/convection. As the molecular mass of CO2 is only about 1/1500 of the mass of the three other components it seems to be improbable much of any change in temperature would be possible.
Water vapor and condensed water (clouds) are another matter. This is the real GHG. Further water vapor in the atmosphere acts with positive feed back. As temperature rises so does the caacity of the atmosphere to hold more water. This could explain the gradual increase in global temperature that has been recorded.
A role CO2 could be playing is that increased levels of CO2 in the atmosphere is promoting greater plant growth which in turn through expiration by plants of water into the atmosphere is adding to the atmospheric waters GHG inpact. I have no idea if this would be significant or not. A greener earth does have added capacity to absorb atmospheric CO2. One might balance the other!
Do I make any sense?
dennis…”…water vapor in the atmosphere acts with positive feed back. As temperature rises so does the caacity of the atmosphere to hold more water. This could explain the gradual increase in global temperature that has been recorded”.
***
That may be regarded as a positive feedback but it’s not the type of PF that can lead to a catastrophic tipping point, as it is known by alarmists. Officially, that kind of PF has the formula..
G = A/(1+AB)
where G = overall gain
A = gain of an amplifier
B = feedback percent.
It’s important to get it that A is a real amplifier that is capable of amplifying an input signal. There is no such amplifier in the atmosphere and there is no such thing, in general, as an amplification in the atmosphere. In other words, the PF to which you refer is not related to an amplification of heat.
Water vapour makes up only 0.31% of the entire atmosphere and at that level there simply is not enough to create a warming that is significant. The Ideal Gas Law makes that perfectly clear.
The type of PF to which you refer is a linear arrangement that has no gain. In other words, there is simply not enough WV or CO2 to warm the atmosphere.
I suggest you reject that kind of propaganda. Gavin Schmidt, who is now head of NASA GISS, has a degree in mathematics. He could not offer an equation for PF with gain yet he programs that crap into climate models.
Tim Folkert says no. Much too simple. Climate Science is much more complicated, and there is a lot we don’t understand. However, many posters, mostly propagandists, will tell you the science is SETTLED!
wee willy burps…”If the ocean is the prime net source, you would need to find a sink that has taken up around 1500 Gigatons of CO2 EXTRA, the cumulative anthropogenic emissions.”
***
Have you looked at the size of the oceans, or the atmosphere? All those gigatons you mention make up only 0.04% of the atmosphere. They would make up even less of the oceans. Plenty of volume for sinking or sourcing.
Dammit Bordon,
You say:
Why do you insist in making the same mistake as Gill just made?
C’mon.
C’mon Weird Wee Willy,
Try making some sense, or please just stop trying to troll
Mike Flynn,
What are you braying about?
Willard, please stop trying to troll.
Thanks Gordon for the response. What do you think about my conclusions about CO2?
Neighbor on the Island
dennis…tried to send you a reply but I am encounter server errors on Roy’s site. Will try later.
Bill Hunter: did you know urban heat influence could have messed up the temperature record?
NOAA: has 50 years of research on urban heat influence on the temperature record.
b,
And NOAA still dont know what the influence might be. In any case, why does it matter?
NOAA is part of the Department of Commerce. Their role is “To understand and predict changes in climate, weather, ocean, and coasts, . . .”.
Official fortune tellers for the commercial world!
NOAA cant even predict the tides with any accuracy. They dont seem to realise that if they manage to predict the weather, the climate is included, as the climate is just the statistics of past weather observations.
Truly did someone say that nobody ever went broke underestimating the intelligence of the American people. And others, such as SkyDragon cultists, of course.
“They don’t seem to realise that if they manage to predict the weather, the climate is included”
You don’t need to predict the weather through Summer to estimate it will be warmer than Winter. You can use physics alone for that.
Poor ‘skeptics’ can’t even articulate the issues let alone address them.
Try thinking instead of reacting for change, Swenson.
b,
Well, that’s a fatheaded attempt to divert attention away from NOAA’s silly statements, isn’t it?
I don’t think you are really trying to say NOAA can’t predict the future any better than a 12 year (or me, if you prefer), but that is what you imply!
You poor deluded SkyDragon cultist, you can’t even bring yourself to admit that the surface cools at night – maybe the undefinable GHE runs away at night, because it is scared of the dark? That’s about as good a reason as any you can come up with, I guess.
Go away and take a reality acceptance pill. Be prepared for a shock.
barry says:
”They dont seem to realise that if they manage to predict the weather, the climate is included”
You dont need to predict the weather through Summer to estimate it will be warmer than Winter. You can use physics alone for that.
——————-
Yes you can Barry. But not to much less than one degree. And thats the point isn’t it? We understand well the influence of the angle of the sun, particularly when it darkens the poles. We have insolation charts. We don’t even have a blueprint of how cold CO2 warms the surface yet you believe in that.
“Yes you can Barry. But not to much less than one degree. And thats the point isnt it?”
No, that is not the point. You’ve lost the thread of the conversation.
Bill, the GHE is well explained and referenced for over a century. If you want to join in with the cranks here on that, Roy and I will have to leave you to their lunatic theories.
Roy Spencer:
“Please stop the “no greenhouse effect” stuff. Its making us skeptics look bad. Ive blogged on this numerous times… maybe start here…
The second law can be stated in several ways, but one way is that the net flow of energy must be from higher temperature to lower temperature. This is not violated by the greenhouse effect. The apparent violation of the 2nd Law seems to be traced to the fact that all bodies emit IR radiation… including cooler bodies toward warmer bodies. But the NET flow of thermal radiation is still from the warmer body to the cooler body. Even if you dont believe there is 2-way flow, and only 1-way flow… the rate of flow depends upon the temperature of both bodies, and changing the cooler body’s temperature will change the cooling rate (and thus the temperature) of the warmer body. So, yes, a cooler body can make a warm body even warmer still… as evidenced by putting your clothes on.”
https://www.drroyspencer.com/2014/04/skeptical-arguments-that-dont-hold-water/
You went completely off topic with this reply.
We went through this in detail with the discussion of that other guy that publishes on a different blog (I can’t recall his name). The point was that when one makes a diagram of a greenhouse effect with a ‘mean’ viewfactor of 1 and then expects a greenhouse effect to result by putting colder objects in the view that is what is meant by the adding of fluxes that you cannot do.
We were regaled with this stupid model of a greenhouse effect endlessly a decade ago trying to promote multi-layered models of a greenhouse effect with uniform colder layers on top of warmer layers. Then you get on a blog that believes in that impossible model who then starts preaching it, obviously you are going to get some push back.
The problem I see with the greenhouse effect is simple. Dr. Trenberth’s estimate of the backradiation seems too high in his radiation budget model. He recognizes it as a plug figure and has never supported the figure empirically.
His failure to do that says one giant hole in the greenhouse theory exists whereby the proponents of the CO2 model simply cannot explain how it works.
That model is where still mythical beasts like hotspots arose to explain how warming could be measured to confirm the model. None of those proponents talk about hotspots any longer near as I can tell. Now they talk about cold spots. Which of course gives rise to the mocking of boiling water with ice.
If you can go back and rectify that omission and change of course in a logical way you will get my attention.
“You went completely off topic with this reply.”
No, Bill, you changed to this topic, not me, when you said:
“We don’t even have a blueprint of how cold CO2 warms the surface yet you believe in that.”
Please keep up with the conversation, especially your own inputs.
Roy Spencer understands the GHE, and has gone to some trouble explaining it on this very blog.
If you’re going to join in with the crackpots that say the GHE doesn’t exist, or breaks the 2nd Law of thermo, then Roy and I (and Anthony Watts, John Christy, Richard Lindzen and Judith Curry) will leave you to their nonsense.
Its off topic to deny a 100% true fact. You come back with how its ”well explained”. Yammering about how you think it works is not a blueprint. A blueprint contains quantitative physics in like x +y =z. We are talking about complicated systems here were feedbacks are not well explained. If you believe they are you are an idiot.
“why does it matter?”
Ask Roy. That’s the topic of his article above.
b,
Telling somebody to ask someone else for an answer you can’t supply, just confirms your lack of knowledge.
You dimwit. I asked you – if you don’t know the answer, just man up and admit it.
Or keep wriggling and twisting, pretending that you know what you are talking about.
If you don’t know why UHI matters when it is the main subject of the article and has been discussed here ad nauseum, then nothing I could say will help you.
It’s good that you’ve admitted you don’t understand the issue. That’s the first step.
b,
Here’s what you wrote –
“NOAA: has 50 years of research on urban heat influence on the temperature record.”
Well, that’s a nonsensical piece of word salad, isn’t it? Yes, heat affects temperatures. That’s what thermometers measure. If the idiots at NASA want to pretend that temperatures need “adjusting”, that is their decision.
50 years of research to establish that thermometers respond to heat? That’s as silly as saying that NOAA can predict the weather!
You really are a gullible wee SkyDragon, aren’t you?
Maybe you should actually read what Dr Spencer wrote. Here’s a sample – “Current homogenization techniques can remove abrupt changes in station data, but cannot correct for any sources of slowly-increasing spurious warming.”
Still convinced that NOAA’s adjustments achieve anything useful?
I can’t tell whether you’re incredibly dense or belligerently sarcastic, but the result is the same. You babble like a drunk.
“Maybe you should actually read what Dr Spencer wrote.”
I did. But I also read researches doing what he says can’t be done.
https://agupubs.onlinelibrary.wiley.com/doi/full/10.1029/2012JD018509
His remark isn’t credible.
You going to read the paper through, or let Roy tell you what to think?
b,
Just a sample from your appeal to authority –
“UHI does not appear to represent a significant contributing factor in the homogenized CONUS-average maximum and minimum temperature signal over the past 5080 years.”
You and Zeke Hausfather are free to deny reality if you wish.
Even Berkeley Earth (nothing to do with University of California, Berkeley), says “the urban heat island effect on our global estimate of land temperatures is indistinguishable from zero.”, totally ignoring the fact that an average reflects the numbers from which it is derived. Increasing some temperatures increases the average.
Nearly as inept as Gavin Schmidt claiming a 38% likelihood meant “near certainty”!
Carry on being a gullible wee SkyDragon.
Why read the paper to find out how they came to this conclusion when you’ve got Roy to tell you what to think?
b,
You wrote –
“Why read the paper to find out how they came to this conclusion when youve got Roy to tell you what to think?”
You didn’t want me read your nonsensical “paper”? Why post it, then?
I’m not aware of Dr Spencer telling me what to think. Did you just make that up?
I think what I wish, when I wish. Why not?
I think you are sloppy and incompetent, and attempting to be gratuitously offensive. You can’t even do that effectively! How sad is that?
barry…you reference a paper published by climate alarmists then claim it is right whereas Roy is wrong.
You insult Swenson as being ‘incredibly dense or belligerently sarcastic’. but it you who comes across as such. You are a narrow-minded climate alarmist who offers obtuse replies that are aimed at diverting and obfuscating the post to which you are replying.
Several times, I have posted direct inks to NOAA sites where they admit slashing the number of reporting stations from 6000 to less than 1500, yet you deliberately obfuscate what they said to make it appear as if they had in fact increased the number of stations. That’s dense.
Then, when I posted a link to the IPCC to prove they had claimed a flat trend from 1998 – 2012, you replied with a deliberate obfuscation of what they said to make it appear such a 15 year flat trend as perfectly normal. One year may have been normal, maybe two, but not 15 years in the middle of a period claimed to represent anthropogenic warming.
“you reference a paper published by climate alarmists then claim it is right whereas Roy is wrong.”
No I didn’t. For ‘skeptics’ everything is tribal.
I pointed out that Roy said correcting for a long-term gradual change couldn’t be done. He made on mention of any attempts, so I showed just one.
His omission is why his remark has no credence. He’s making flat statements in a blog, instead of what a proper scientist would do and refer to previous work on the matter, and explaining its strengths and weaknesses.
But you and Swenson don’t need to bother your pretty little heads with that level of detail when you have Roy to tell you what to think.
“deliberately obfuscate what they said to make it appear as if they had in fact increased the number of stations.”
Obfuscate? I quote the page you cite.
“However, over time, the data record for surface temperatures has actually grown, thanks to the digitization of historical books and logs, as well as international data contributions.”
Clearly you have a comprehension problem.
Barry says:
”His omission is why his remark has no credence. Hes making flat statements in a blog, instead of what a proper scientist would do and refer to previous work on the matter, and explaining its strengths and weaknesses.”
You mean statements like the moon rotates on its own axis in a motion separate from its orbital motion without referring to previous work on the matter, and explaining its strengths and weaknesses?
barry says:
”NOAA: has 50 years of research on urban heat influence on the temperature record.”
As Roy points out in his article here that is what he is banking on.
He says nothing of the kind, fabricator.
” But the seminal study by Oke (1973) showed that UHI warming is non-linear, with the most rapid warming occurring at the lowest population densities, with an eventual saturation of the warming at high population densities.”
Hmmmm, 1973 is exactly 50 years ago.
bill h…”1973 is exactly 50 years ago”.
***
Please tell me it isn’t true.
Just as I thought. Roy refers to one study, and you equate that with “50 years of research.”
You are not genuine, Bill.
Barry you are making an irrelevant point. Your complaint is that UHI has been estimated many times over the past 50 years. Thats true but the question at hand is not that. Roy is pursuing a technique proposed 50 years ago and AFAIK has never been pursued.
Roy notes this: ”But the seminal study by Oke (1973) showed that UHI warming is non-linear, with the most rapid warming occurring at the lowest population densities, with an eventual saturation of the warming at high population densities.”
Whereas the 2013 Hausfather study, the one you provided, does not address this issue. Hausfather’s used a linear relationsip. And thank you for the link.
Hausfather says regarding his work on population increases:
”Urban sites were defined as those characterized by a 19302000 population growth of ≥10 people/km2, which yields similar-sized numbers of urban and nonurban stations, as shown in Table 1. While there is no available justification in the literature for this or any specific 19302000 population growth cutoff as a proxy for urbanization, this value was chosen to be reasonably conservative and to produce an urban/rural division generally in line with the other urbanity proxies.”
No support for a linear relationship just a guess?
Hausfather sources Oke But on other matters than the UHI curve Roy says Oke validated in a study.
Oke claims the relationship is like an inverted parabola rather than linear. Using a linear relationship and splitting the database in half would cancel out some unknown amount of UHI trend influence. As it was Hausfather didn’t find much.
We will have to wait to see what Roy comes up with.
“Your complaint is that UHI has been estimated many times over the past 50 years. That’s true but the question at hand is not that.”
My complaint is that Roy implies that no work has been done to account for gradual change due to UHI.
The study I linked uses 4 different metrics to classify urban/rural stations. It utilises pairwise analysis for abrupt shifts (which can also assess inhomogeneities in gradual change when trends are included in the analysis), and rural networks to look for gradual change biases through trend comparison.
“Roy notes this: ‘But the seminal study by Oke (1973) showed that UHI warming is non-linear, with the most rapid warming occurring at the lowest population densities, with an eventual saturation of the warming at high population densities.’
Whereas the 2013 Hausfather study, the one you provided, does not address this issue. Hausfather’s used a linear relationsip.”
If this is really what Oke is saying (I’ve read the paper and disagree with Roy’s interpretation, see below), then rural stations should show more warming than urban stations.
But they don’t. Accounting only for TOBs, US urban stations have warmed more than rural. This is also the case if raw data is used, but the TOB bias is strong in the US, so this result should be treated with caution.
Let’s quote Oke, by the way, on Roy’s point.
“This means that for a given increment in P, TΔᵤ₋ᵣ increases more for a town than for a large city.”
The literal meaning is that for each equal unit increase in population, the temperature difference is greater with smaller populations than larger. This is tested between different populations, as Oke’s study wasn’t done over time.
But whether this equates to an actual greater increase over time for rural stations depends upon the actual increase in population for a given location. Rural areas do not accumulate residents at a higher rate than cities, in general.
That may be why rural stations on average show a lower trend than urban stations.
This is consistent looking at the 1895 to 1960 data, and the data from 1960 onwards.
If there is a UHI ‘parabola’ for cities, the inflexion point is not 1960.
So perhaps a useful test would be to do a multiple regression for urban and rural datasets, and find out if at some point the rural trend becomes greater than the urban.
That would lend credence to Roy’s supposition, and would yield an inflexion point that could be used in his analysis.
Barry says:
”The literal meaning is that for each equal unit increase in population, the temperature difference is greater with smaller populations than larger. This is tested between different populations, as Okes study wasnt done over time.”
And where are these studies that you claim have eluded Roy? Did your daddy just tell you they exist and you don’t know for sure?
Maybe you got that from the SS.
Thats why the Berkeley Earth study failed to produce any significant UHI.
They ignored the science as warmist inclined folks seem to tend to do and compared ”rural/low density to medium density urban” against the ”medium high to high density urban”. It should come out a near wash if Oke is right. Seems the correct split might be rural/high density urban vs the low to medium high density urban.
Anyway Roy has done his binning of population density work above. Coming is to compare rates of warming versus his allocation of bins.
Landsat data provides rich information via GIS software of the attributes of fine resolution areas allowing one to pinpoint geospatial characteristics down to a few meters. People especially under the supervision of the US Geological Survey have been filling data into these maps now for 5 decades. Great stuff for research purposes.
Berkeley Earth as I recall used satellites too. But they went by light density. Low light vs High light and split the proverbial baby in two, not paying attention to Oke’s findings.
Apologize please.
Marxists don’t apologize. They regroup. You have to extinguish them.
A lot of mean folks on blogs
“Thats why the Berkeley Earth study failed to produce any significant UHI.
They ignored the science as warmist inclined folks seem to tend to do..”
Berkeley Earth was established by climate ‘skeptics’, including Steve Mosher, who was working on surfacestation data in the late 2000s, Richard Muller and Judith Curry.
They did a study on whether UHI infects the Berkeley record.
https://static.berkeleyearth.org/papers/UHI-GIGS-1-104.pdf
They cite multiple groups and papers on UHI.
You just say false stuff, Bill. They’re not alarmists, they don’t ignore the science.
“Berkeley Earth as I recall used satellites too. But they went by light density.”
Nope, satellite imaging of urban land area. It’s in the paper above, MOD500 urban mapping.
You just report this stuff incorrectly. Because you probably understand it incorrectly.
And you never admit it when you’re wrong. Here is a ripe opportunity.
“Apologize please.”
For what?
Berkeley do not correct specifically for UHI, as they believe their methods likely correct for it, which was borne out by the tests they made in the study above.
Always worth checking out their methods, which were based on the criticisms ‘skeptics’ made about the official temp records.
https://web.archive.org/web/20160312021936/http://berkeleyearth.org/about-data-set/
A less well-known skeptic group also tried their hand at doing a better estimate of global temperature.
https://noconsensus.wordpress.com/2010/03/24/thermal-hammer/
Not peer-reviewed, but they went to great lengths to get it right over many months. Some of their work influenced Berkeley Earth’s methods.
Well Barry Roy is getting significantly different classification of very rural than did BE.
BE found globally 42% of the sites were very rural.
Roy is finding less than 5%.
Of course BE uses a different database than GCHN. And BE used a different time window as well. Results were BE found a lot of UHI in the old global data and likely used that to increase the warming trend by down adjusting the old data. But they found negative global development from the 1950’s forward. . . .so did they warm the data from that finding?
Or at least that is what has been seen to be going on. Slight upward adjustments of data from the 60’s forward and a considerable amount of cooling of data prior to that.
BE has a graph supporting that point of view in the study you reference.
We will have to see what Roy comes up with because BE didn’t even reference Oke 1973 and Roy is basing his approach on that.
barry…”NOAA: has 50 years of research on urban heat influence on the temperature record”.
***
I doubt that, no one was worrying about global warming in 1973. The bs did not begin officially till 1988. Even at that, NOAA was still publishing their temperature data graphs in 2012, showing a flat trend since 1998. Then, when the IPCC announced the flat trend in 2013, they went back and changed their own records to produce a trend.
I’ve posted the links to research on the UHI from fifty years ago.
Your ‘doubt’ becomes your full-fledged belief. You’re not a skeptic.
Gordon,
“Barry has claimed their website admission, that they slashed the global land surface database to less than 1500 thermometers, is a lie. I have supplied a link to the site confirming it, yet Barry insists it is a lie.”
Your ‘interpretation’ is the lie. Nowhere on that page do NOAA say they have actively deleted anything.
Here is the quote.
“Q. Why is NOAA using fewer weather stations to measure surface temperature around the globe from 6,000 to less than 1,500?
The physical number of weather stations has shrunk as modern technology improved and some of the older outposts were no longer accessible in real time.”
There is no mention of active deletion of anything. That is YOUR lie. Furthermore, the 1997 paper that describes how the extra 4500 weather stations data came to be included in the database reveals that none of them were deleted.
Next on that webpage:
“However, over time, the data record for surface temperatures has actually grown, thanks to the digitization of historical books and logs, as well as international data contributions. The 1,500 real-time stations that we rely on today are in locations where NOAA scientists can access information on the 8th of each month.”
https://web.archive.org/web/20130216112541/http://www.noaa.gov/features/02_monitoring/weather_stations.html
For the billionth time, the 4500 stations you think were ‘slashed’ were actually added retrospectively when they collated old data from around the world in the mid 90s. From defunct weather stations to historical data collections given to NOAA by meteorological institutes in various countries.
They were never part of the 1500 that reported data once a month, and so they weren’t slashed’, deleted or expunged from the record. They were a one-time addition to the database.
You’re promulgating a lie.
For example, one station in the South of France ceased operations in 1973.
How exactly did they ‘slash’ this station’s data if it hadn’t been collecting any for 20 years before they collected its data?
It’s still in the database, but you would see that the data stops in 1973 and claim that the post-73 data was deleted.
This is precisely your error of understanding, right here.
Furthermore, Gordon, not even Chiefio claims that they were deliberately deleted.
Chiefio: “First, that there is no person actively pruning thermometers. While the “spin” put on my position has tended to say there is active intentional removal of thermometers for malicious effect; I have gone out of my way to point out that I can not know any person’s intent, only the result.
https://chiefio.wordpress.com/2010/02/22/kusi-coleman-tv-show-discussion/
b,
The SkyDragon cult fascination with thermometer temperatures is a wonder to behold. Is there a point to this obsession? The temperature of an object is precisely what it is – it is no hotter or colder than it should be.
Are you actually trying to insinuate that CO2 in the atmosphere makes thermometers hotter?
Maybe you could find an experiment to support such a ludicrous flight of fancy.
Only joking – there are no such experiments. I’m just laughing at your gullibility.
Aaah look!
Blathering stalker Flynnson finally asks again:
” Are you actually trying to insinuate that CO2 in the atmosphere makes thermometers hotter? ”
But… Flynnson?!
barry doesn’t simply try to insinuate that: he is at least 101 % ‘convinced’ of this fact.
Why not, after all? Aren’t some not even ‘convinced’ that the Moon moves like a ball-on-a-string?
*
Un conseil, Flynnson: si vous n'êtes pas satisfait de mon anglais: apprenez donc le français, cela vous ira comme un gant.
Binny,
Your English is quite good for a sour Kraut. You could improve your expression, and colloquialisms.
Why should I use French on an English language blog? Why would you advise such a silly thing?
Are you trying another SkyDragon attempt to divert attention from the fact that you can’t even describe this GHE that cultists worship?
As to barry being “101%” convinced, good for him. Why should I take notice? Would you take notice if I said that I am 500% convinced that both you and barry are quite mad?
Still no GHE. Keep pretending there is, if facing the reality of four and a half billion years of global cooling is too much for you. Oh, and the fact that the surface cools every night.
From EM Smith of chiefio via Barry…”I have gone out of my way to point out that I can not know any persons intent, only the result”.
***
Of course, he can’t know the intent but it is plainly obvious. NOAA through GHCN has slashed 90% of the GHCN stations since 1990. They have openly admitted to slashing at least 1 – (1500/6000) x 100% = 75% of the stations they use to create their temperature data base globally. And they offered 2014 as the hottest year ever based on a 48% probability.
NOAA, GISS, and Had-crut have gone back and retroactively changed temperatures to produce a temperature record more favourable to an interpretation of anthropogenic global warming. For example, when the IPCC announced in 2013, a flat trend from 1998 – 2012, NOAA retroactively changed the SST to show a trend.
GISS was caught by Steve McIntyre of climateaudit, changing a US temperature record set in 1934 with the global average of 1998. They changed it back when caught. In the climategate email scandal, Phil Jones, then head of Had-crut, was caught in an email admitting he had used Michael Mann’s trick to hide declining temperatures. In another email he threatened to block papers from skeptics to the IPCC reviews.
Gavin Schmidt, head of GISS, runs the uber-alarmist site realclimate with his buddy Michael Mann. The site is full of alarmist propaganda and no skeptics are allowed to comment. Unlike Schmidt and Mann, Roy allows alarmists like you to comment, even to the point of being defamatory about his work at UAH.
It all adds up Barry, and the sum = cheating. Smith doesn’t have to offer proof of cheating, he simply supplies the evidence of it, leaving the rest of us to form our own opinions. What other opinion could a logical mind reach?
You’ve spent years just swallowing the contrarian narrative wholesale, and never bothered to check for yourself.
Whack-a-mole yet again.
“GISS was caught by Steve McIntyre of climateaudit, changing a US temperature record set in 1934 with the global average of 1998. They changed it back when caught.”
A mistake, mot deliberate, they said, fixed the next day and publicly thanked McIntyre for the correction.
I know what you’re thinking, it’s the sheer number of shady moments that tip the wheelbarrow. But almost all of these ‘scandals’ are manufactured and swallowed wholesale by ‘skeptics’. You demonstrate this with your very next words…
“In the climategate email scandal, Phil Jones, then head of Had-crut, was caught in an email admitting he had used Michael Mann’s trick to hide declining temperatures.”
It was Keith Briffa’s ‘trick’, not Mann’s. You’ve perfectly remembered the elided quote spun out by anti-AGW media. Here’s the full quote.
“I’ve just completed Mike’s Nature trick of adding in the real temps to each series for the last 20 years (ie from 1981 onwards) and from 1961 for Keith’s to hide the decline.”
The reason you don’t know that it Keith’s trick is that you’ve swallowed a media tagline, which misquotes the original.
The media’s false elision was, verbatim, “Mike’s Nature trick to hide the decline.” They omitted Keith’s name because Mann has presence and is a juicier target.
And you just regurgitate this same mistake years later. Blithely unaware. This is the true level of your understanding.
“In another email he threatened to block papers from skeptics to the IPCC reviews.”
Described as hyperbole, the papers mentioned actually ended up in the IPCC report. So what did Jones actually do about these papers apart from rant?
Is your explanation going to be about facts, or will it be suppositional again?
Gordon,
“NOAA through GHCN has slashed 90% of the GHCN stations since 1990.”
But they didn’t. They added data from history. Data that wasn’t being updated on a regular basis.
If a weather station in France ceases operation in 1973, but NOAA collect the data prior, how is that deleting the weather station?
A government hands NOAA 12 boxes of records from its weather stations. The data therein goes up to the day that NOAA collected it, in 1996.
How has NOAA deleted any data when this gets added to the pile?
And yet you would look at the weather station data from this country in NOAA’s records and claim that the data from 1996 onwards was deleted.
I’m not making these things up. This is actually what happened in the mid-90s. I’ve provided the 1997 study to you that explains this, many times.
barry
Thank you very much for this and other contributions concerning Robertson’s eternal lies.
I’m currently really sad of endlessly replying the same stuff to his insanities.
The very best is his incredible post on this thread about anomalies
https://www.drroyspencer.com/2023/01/urbanization-effects-on-ghcn-temperature-trends-part-i-the-urbanization-characteristics-of-the-ghcn-stations/#comment-1434883
You just need to have a look at my recent reply to his usual brainless nonsense:
https://www.drroyspencer.com/2022/09/uah-global-temperature-update-for-august-2022-0-28-deg-c/#comment-1365217
That IS Robertson’s REAL ‘knowledge’ about it.
binny…”The very best is his incredible post on this thread about anomalies…”
***
You idiot, I am quoting verbatim from NOAA on anomalies. I have no idea what perverted understanding you might have about anomalies but whatever that might be, it is seriously in error.
Robertson
As usual, you continue to lie and lie and lie.
Here is what you ignorant idiot wrote some months ago:
” Take a look here at the NOAA global land and ocean bar graph and tell me ho there is a relationship between it and UAH data.
https://www.ncei.noaa.gov/access/monitoring/climate-at-a-glance/global/time-series
For one, NOAAs graph takes off on a distance linear trend from 1980 onward. The UAH graph is in a negative anomaly phase till 1997 then it is flat from 1998 2015.
The NOAA graph shows 8 years of global temps above 0.8C, including 2022, from 2015 2022, while UAH shows nothing close to that. UAH maxed out at 0.7C in 2016 and one year was 0.6C, the rest were 0.5C or below and recently, more typically around 0.3C. ”
*
You idiot still didn’t understand that you were comparing NOAA anomalies wrt the mean of 1901-2000 with UAH anomalies wrt the mean of 1991-2020!
Here is what dumb ignoramuses like you see:
https://i.postimg.cc/ncDph2XL/UAH-6-0-LT-vs-NOAA-surf-1979-2022.png
No wonder that you tell that NOAA’s data shows too much warming.
*
And here is what experienced people see:
https://i.postimg.cc/xT6mR007/UAH-6-0-LT-vs-NOAA-surf-1979-2022-wrt-1991-2020.png
because unlike you, they understand that only anomaly comparisons wrt the same reference period make sense.
*
Robertson, the guy who says time dilation doesn’t exist (though even Flynnson corrected you about that!), who says Einstein is wrong, who says Newton’s translator was wrong though there were many translators of his work, who denies lunar spin without having ever understood how it is computed, etc etc.
*
And commenters like Dennis trust brainless idiots like you… OMG.
“you were comparing NOAA anomalies wrt the mean of 1901-2000 with UAH anomalies wrt the mean of 1991-2020”
How can someone have been discussing the temperature data sets for years and yet make this absolutely basic dumb mistake?
Either it’s wilful ignorance or he just doesn’t have the mental capacity. I could understand a complete greenhorn making the mistake, but Robertson has no excuse.
Robertson’s incredible stupidity is best shown when he 100 % gullibly repeats chiefio’s absolute nonsense:
” In the Canadian Arctic, they use only 1 station. ”
Frogs like to say in such cases:
” Plus bête tu meurs. ”
Robertson’s endless appeals to EM Smith’s pseudo-authority are typical for him.
He loves contrarians, especially those who brazenly lie on their blogs.
binny…”obertsons endless appeals to EM Smiths pseudo-authority are typical for him”.
***
Em Smith has done stellar work researching NOAA, GISS, and Had-crut, then revealing their chicanery. Binny, an uber-alarmist doesn’t like having his authority figures revealed as the cheaters they are.
E.M. Smith didn’t do any ‘stellar work’ at any time, Robertson.
He was all the time just guessing, exactly like you.
And that is the reason why you permanently appeal to his pseudo-authority.
barry…[NOAA]”The physical number of weather stations has shrunk as modern technology improved and some of the older outposts were no longer accessible in real time.
[Barry]There is no mention of active deletion of anything.
***
Duh!!! What does ‘shrunk’ mean? What does ‘no longer accessible’ mean? NOAA admits to skrinking [their word…shrink] the database from 6000 to less than 1500 and Barry claims there is no mention of ‘active deletion’.
No matter how you interpret NOAA’s words, they have openly admitted to using less than 1500 stations globally to produce their land surface temperature record.
Once again, in NOAA’s own words, from a recent, former site…
Q. Why is NOAA using fewer weather stations to measure surface temperature around the globe from 6,000 to less than 1,500?”
Barry’s denial runs deep.
I am willing to bet they have taken that site down based on what I have posted here about it.
Gordon Robertson
Where did you get the information that NOAA uses 1,500 temperature stations around the globe.
Here is a current site:
https://www.ncei.noaa.gov/products/land-based-station/global-historical-climatology-network-daily
They have more than 100,000 stations. Half of those only record precipitation but the rest record temperature.
Here is a map of all the global weather stations.
https://databasin.org/datasets/de8f7f71e3334eba863ff6003484364f/
Right here, Normie…
https://web.archive.org/web/20140115053259/http://www.noaa.gov/features/02_monitoring/weather_stations.html
Read it and weep.
Norman,
The 100,000 stations are from GHCN Daily database.
The database Robertson is referring to is GHCN Monthly, a database with long enough records of min/max temperature (and other components like precipitation) to compile a global temperature.
In 2009 there 1500 weather stations that reported data to NOAA once a month. The other weather station data that made up the 6000 stations was collected from archives and added to the database retrospectively.
Robertson is, after Clint R, really the most ignorant poster on this blog.
He refers with this elder NOAA page saved on the Web Archive, to GHCN V2.
Its successor, GHCN V3, contained 7,280 stations worldwide from the very beginning.
I downoaded that data during years, what he would never have been able to.
It is in between deprecated and has been replaced by GHCN V4, with over 27,000 stations.
Near these station sets, NOAA has the GHCN daily station set.
Norman’s link shows only the entire station directory.
I still use the ftp link for download, which ‘normal’ browser users no long can access.
Here is the link for everybody:
https://www.ncei.noaa.gov/pub/data/ghcn/daily/
There you see the station list
ghcnd-stations.txt
and the station inventory
ghcnd-inventory.txt
which tells you which station offers which kind of measurements over which period.
*
Robertson is a contrarian ignoramus who has never been even able to download UAH data into a simple spreadsheet calculator.
But claims he would be (or have been) an engineer.
In my native tongue, we use to name these all-time boasting Robertson guys ‘ingénieurs d'opérette’.
“What does ‘shrunk’ mean? What does ‘no longer accessible’ mean? NOAA admits to skrinking [their word… shrink] the database”
Is English not your first language?
“The physical number of weather stations has shrunk”
It plainly says there are fewer actual weather stations around the world – something NOAA has no control over.
‘Has shrunk’ is passive. There is no language here suggesting NOAA actively did anything to these physical weather stations, or deleted their data.
Your ‘interpretation’ of this is pure fabrication.
“The physical number of weather stations has shrunk as modern technology improved and some of the older outposts were no longer accessible in real time.”
That sentence is probably missing a comma after ‘improved’. Whatever the case, none of the language here suggests NOAA did any deleting, but rather refer to events beyond their control.
And if parsing the language from that website isn’t enough, we have the 1997 paper that describes how the data was added retrospectively, and not deleted.
https://www.ncei.noaa.gov/monitoring-content/monitoring-references/docs/peterson-vose-1997.pdf
I’ll quote the relevant bits from that paper.
Because most instrumental networks were established to monitor local weather and not the long-term climate, there are practical problems in using these data to study climate change. For instance, the records are often not digitized and/or are not readily available outside of the country in which they were measured…
Because numerous institutions operate weather stations and because no single repository archives all of the data for all stations, we employed five acquisition strategies to maximize the available pool of data: 1) contacting data centers, 2) exploiting personal contacts, 3) tapping related projects, 4) conducting literature searches, and 5) distributing miscellaneous requests…
When possible, we tapped related projects for potentially useful data. For example, N.C.D.C recently collected and processed station normals for the period 196190 as a contribution to WMO. On occasion, a WMO member country supplied year/ month sequential data in addition to the 30-yr means and other statistics. Upon receipt of such records, the member country was contacted in regard to contributing the time series data to GHCN. The Colonial Era Archives initiative was also tapped in this regard (Peterson and Griffiths 1996). Started as a GHCN subproject to acquire data in very data sparse regions, this initiative digitized early temperature and precipitation records for stations operated by various European countries in their respective overseas colonies. Data for hundreds of early African stations have been incorporated from this source and the digitizing effort has been expanded to Asia and South America (Peterson and Griffiths 1997).
So they collected old paper record and archived records and digitised them.
And they did this in the mid 90s, which is when the station count drops away. It’s not that they deleted stations, they added them retrospectively.
And if you read the paper you will see the familiar graph of station count, and underneath it they write:
“The reasons why the number of stations in GHCN drop off in recent years are because some of GHCN’s source datasets are retroactive data compilations (e.g., World Weather Records) and other data sources were created or exchanged years ago. Only three data sources are available in near-real time.”
This was explained in 1997, 12 years before Chiefio wrote on the March of the thermometers.
If only he’d read the source material and shared the information, he wouldn’t have caused people to “spin” (his word) his position into a claim of active deletion.
Such a polar vortex pattern in the lower stratosphere will be at work in late January in North America.
https://i.ibb.co/J3kS2y5/Zrzut-ekranu-2023-01-23-104529.png
Gordon Robertson
“G = A/(1+AB)
where G = overall gain
A = gain of an amplifier
B = feedback percent.”
My maths is a bit rusty, perhaps others could critiqie my logic.
G=A/(1+AB)
G+GAB=A
G=A-GAB
G=A(1-GB)
G/(1-GB)=A
Applying this to global warming G is the rate of warming, 0.2C/ decade and B is climate sensitivity with a mmidrange value of 3.
A=0.2/1-0.2*3=0.2/0.4=0.5
The initial gain in the climate system is 0.08C/decade.
This raises three questions.
1) Is this a valid use of the gain formula? If not, what formula should be used to calculate gain in the climate system?
2) Is this a reasonable estimate of the initial gain, and what proportion is due to CO2?
3) If it is not due to CO2, can the sceptics explain the gain using other factors?
Skeptics don’t have to explain the gain. They only have to falsify CO2. Ed Berry has. The gain is inexplicable.
ent…”My maths is a bit rusty, perhaps others could critiqie my logic”.
***
It’s not your math, it’s you understanding of physics that is your problem.
The A in G = A/(1 + AB), is a real amplifier that is capable of amplifying the input signal. Normally, without the feedback parameter, B, the amplification, A, with an input voltage of Vi and an output voltage of Vo, would be A = Vo/Vi. However, with B added we must modify the equation to allow for the change in the Vo/Vi factor due to B, hence the addition of G = overall gain.
How you can apply that to the atmosphere is beyond me. Where is the amplifier?
Gordon Robertson
That’s my point. You cannot apply formulae from electronics to the physics of climate. Your “electronics englineering” is worth diddly squat in the climate debate.
That’s why you and Stephen Anderson sound so pathetic. You have no relevant knowledge base at all.
ent…”Thats my point. You cannot apply formulae from electronics to the physics of climate”.
***
Yes, you can. When alarmists steal a definition of positive feedback from physics, that requires an amplifier to make the equation viable, then it is perfectly fine to call them on it.
There is no such thing as heat amplification in the atmosphere, or anywhere else for that matter, that involves a positive feedback with gain. The electrons PF is one of the only ones that involves such a gain.
There are rare occasions when a natural phenomenon occurs involving positive feedback, like the one that took down the Tacoma-Narrows Bridge. That involves a natural resonance in a structure whereby the entire structure begins to vibrate and the vibration is naturally enhanced through resonance.
In essence, the guy wires supporting the bridge deck were activated by a powerful, sustained wind, and their vibrations were transferred to the bridge deck, which oscillated on its own.
You could experience that on an acoustic guitar if you could pluck it fast enough on a note that caused the body to resonate. However, the strings lack the power to pull the guitar apart, Not so with a bridge. A resonance that affected a guitar would be far too small to destroy the guitar but with a suspension bridge, a relatively innocuous vibration could destroy the bridge as it did with the Tacoma bridge.
There is no equivalent process available in the atmosphere. We are talking about heat gain, so how does one increase the heat in a system in response to an input signal? The feedback signal in the AGW theory is back-radiation from CO2 in the atmosphere. It is presumed the energy back-radiated can be converted to heat in the surface, causing a feedback that causes the surface temperature to increase beyond the temperature it is heated by solar energy.
The flaw in the argument is the 2nd law. Heat simply cannot be transferred from a colder atmosphere to a warmer surface THAT WARMED IT!!! Even if it could, only about 5% of surface radiation is absorbed by CO2. Of that 5%, several percent are likely lost through the inverse square law and the fact that CO2 has to emit more laterally and upward than it can radiate down the way.
So, out of the 5% captured by CO2, only 2%, for argument’s sake, makes it back to the surface, and that 2% is claimed to raise the surface temperature higher than it is heated by solar energy. We don’t need to refute the PF argument, common sense does it for us.
Gordon,
What these SkyDragon cultists dont seem to accept, is that even if 100% of the energy emitted by the surface is somehow returned by a miracle to the surface (a physical impossibility), the best case situation is that the surface would not cool – receiving back just as much energy as it emitted.
In fact, without an external heat source like the Sun, the surface will cool. Nighttime is an example of this.
Four and a half billion years of history is an example over a longer period.
The Earth cooled, and continues to do so. Ephemeral manmade waste heat will raise the temperature of thermometers, possibly on a large scale. For example, air heated by exposure to the heat from a nuclear power station may result in higher thermometer temperatures at some distance, as the heated air moves due to wind. Heated river water from a heat exchanger may travel some distance, warming air by radiation, which my be measured as having raised the temperature of distant land based thermometers.
Due to the chaotic nature of the atmosphere, it is impossible to determine the effects of waste heat released within the system in detail. In still clear air, with low humidity, radiation will rapidly proceed to space, with only thermometers directly in the line of sight being affected.
Simple, but not amenable to calculation.
“Heat simply cannot be transferred from a colder atmosphere to a warmer surface”
Pretty well every physicist on the planet disagrees with this statement, and can provide evidence that in such a system heat can flow in both directions.
Can you “prove” what you claim?
Entropic man says:
”Can you ‘prove’ what you claim?”
Of course it would be most silly to even ask that question if you could prove yours.
And since we are talking about cold moving to hot to warm hot more, it seems pretty reasonable that you prove it first. . . .and who agrees with you doesn’t mean squat.
“Heat simply cannot be transferred from a colder atmosphere to a warmer surface THAT WARMED IT!!!”
But that is not what is being described as the greenhouse effect.
If you can’t articulate what it is you object to, then you cannot possibly argue against it.
“Pretty well every physicist on the planet disagrees with this statement”
No, every physicist agrees that a cool object cannot transfer its heat to a warmer one.
Every physicist agrees that energy can be transferred between hot and cold objects via IR.
The resulting temperatures is the NET balance of that exchange of energy.
barry says:
” ”Heat simply cannot be transferred from a colder atmosphere to a warmer surface THAT WARMED IT!!!”
But that is not what is being described as the greenhouse effect.
————————–
Interesting!
barry says:
If you cant articulate what it is you object to, then you cannot possibly argue against it.
———————-
I suppose you are here to articulate how it works right Barry. One cannot possibly argue against a phantom or one who changes his story every five minutes. Back a few centuries ago they burned such folks at the stake as witches.
Sure, Bill.
GHGs influence the rate at which thermal radiation leaves the Earth’s climate system. More GHGs slow this rate.
A system receiving continual energy input that has its rate of thermal emission slowed becomes warmer.
Simple.
Barry says:
”GHGs influence the rate at which thermal radiation leaves the Earths climate system. More GHGs slow this rate.”
I agree with the first sentence if indeed there is a greenhouse effect that is produced by such means and I do favor that position. However I measure it by what the surface actually sees. which mostly is a just a few meters above the surface AFA CO2 is concerned.
Once beyond that first layer what has to be warmed isn’t warmed by radiation because what it does in response to absorbing radiation is it expands and rises via diffusion and convection. So it appears that any GHG beyond the direct view of the surface is heat on its way to space. I certainly would be interested to see a demonstration that proved otherwise. But if you could you have to recognize that expansion response is pretty robust negative feedback.
Now I am open to the idea of a fluctuating greenhouse effect because water is not evenly distributed and if it became more evenly distributed it might close that window space. But we know that CO2 doesn’t absorb in those window frequencies but water does.
So I am on record repeatedly over a long time saying I can accept a single layer GHG model. But there is no evidence a multi-layered model would work.
Curses.
“A=0.2/1-0.2*3=0.2/0.4=0.5
The initial gain in the climate system is 0.5C/decade. ”
That’s nonsense. Clearly Gordon’s formula does not transfer from electronics to climate.
Mathematics from a biologist. Where did you get the amplification in the atmosphere, is there a heat amplifier somewhere? Why don’t you stick to amoeba and leave the physics to people who understand it?
He’s a peat bog specialist. Do they still use peat as fuel in the UK? Hey, I hear they’re regulating the thermostats in Europe now. It is a felony if caught setting your thermostats, not within Government regs. Do they give the children rewards for turning their parents into authorities?
The climate is warming at 0.2C/decade. Ask most people in the trade and they reckon that the amplifier is increasing CO2. They can give you numbers too (5.35ln(C/Co).
You of course believe the amplifier is “natural variation” but you can’t be more specific and you can’t give us numbers.
Just foolish waffle from an “engineer”.
Most think it’s mostly natural variability. No one has number for the amount which would caused by higher C02 levels which supported by evidence.
No one has claimed global air temperature would stay the same, or they has always variation in local and global air temperature.
The only thing which seems constant is the entire ocean temperature, but likewise local parts of ocean have changes in temperature and there would change in the entire ocean. What keeps so constant is the inability to accurately measure it, and it’s mass heat sink or has 1000 times more heat as the atmosphere.
Or if one had an atmosphere 1000 times more massive as our atmosphere, it also would appear to not change over decades or centuries of time.
What they cannot do is explain how the CO2 warms the atmosphere. They can produce all the equations they like, till they actually prove in an experiment that a gas in a container the size of the atmosphere, containing 0.04% CO2, can cause the gas to warm significantly, they are whistling in the wind.
The main problem is the GHE, which is based on a faulty presumption that a greenhouse traps infrared energy. That’s not how it warms. That fact has been known since 1909 when R. W. Wood, an expert on gases, doubted that CO2 could warm the atmosphere.
There is no reason why infrared energy trapped by the glass in a greenhouse should raise the temperature. When SW solar heats the soil and infrastructure in a greenhouse, the heated surfaces produce SW infrared. Since glass is presumed to block that IR, it is suggested the IR bounces around inside the structure and somehow gets re-absorbed to raise the temperature in the greenhouse.
Such a recycling of energy to raise temperature would be invaluable for cheaply heating a home. It has never been employed. Why? Because it doesn’t work. It represents perpetual motion.
As Wood demonstrated, a greenhouse warms because heated molecules of air rise and get blocked by the glass. As proof, if you get into a car sitting in the sun on a hot day, it can be stifling inside. Simply rolling down the windows alleviates much of the heating by allowing trapped molecules of air to escape.
EM,
You wrote –
“The climate is warming at 0.2C/decade. Ask most people in the trade and they reckon that the amplifier is increasing CO2. They can give you numbers too (5.35ln(C/Co).”
0.2C/decade is 2 C per century, 20 C per thousand years. I dont beehive the seas will boil in less than 5000 years. When do you think the “trend” will stop, and why? By the way, the climate is just the statistics of past weather observations – it has no independent existence.
“Most people in the trade . . .” is just a mindless appeal to your own authority. What “trade”, which “people” and what do the minority think about the “amplifier” if they disagree?
How does CO2 “amplify” heat. Thats just SkyDragon nonsense without any experimental support, isnt it?
Throwing out meaningless numbers wont help. The Earth has cooled for four and half billion years, regardless of what your unidentified “people in the trade” “reckon”!
Accept reality – if you dare.
January 21, 2023
“I couldnt really picture that weight. Its like five circus elephants. Or 50-something grand pianos.”
“It was a beautiful tree, it really was, but I kind of have a difficult feeling about it right now.”
….
“Should the city have planted all these trees? Did it make sense at the time and now the wonderful “salvation” has been ruined by climate change or were all these trees always vulnerable to toppling with an unlucky combination of dryness and rain?”
https://althouse.blogspot.com/2023/01/i-couldnt-really-picture-that-weight.html
linked for https://instapundit.com/
HISTORY SHOWS AGAIN AND AGAIN HOW NATURE POINTS UP THE FOLLY OF MAN: It was a beautiful tree, it really was, but I kind of have a difficult feeling about it right now.
I think a redwood makes a good park bench- so, they are fine, you just have to log them every once in a while.
As I’ve said and demonstrated thousands of times, if you control for the Urban Heat Island and Water Vapor, you get no warming.
Here is a link to hundreds of weather stations showing no warming. Having just 1 that shows no warming should raise concerns, but this many proves there is something wrong with the CO2 causes warming theory. CO2 is 1 out of every 2,500 molecules, man created 1 out of every 10,000. If you believe vibrating 1 out of every 10,000 molecules can materially impact the kinetic energy of the other 9,999, you will simply believe anything.
Here is the link to all the data: https://imgur.com/a/CDasqHH
“Here is a link to hundreds of weather stations showing no warming”
Many, if not most of those weather stations show warming, including in the raw data. Pretty much all of them show warming after accounting for TOBS (I see many stations picked from the US).
Flaming skeptics!
You just make stuff up!
Wrong, you clearly have never seen a statistically significant uptrend. Many show an Oscillation, but all show that relatively recent values are at or below the levels of much earlier times. CO2 would cause a trend, not an oscillation. What you are observing volatility, not a trend. CO2 won’t cause volatility, the physics of the CO2 molecule are constant. Once again, unless you can explain how CO2 can cause and oscillation, of how recent temperatures can be below below levels of a much earlier time, then you are the one “just making stuff up.” BTW, the first charts use the data from this website and clearly show Antarctica cooling. Please explain that.
In just the top South Pole charts, 7 out of 12 of the charts have a positive trend. The next 3 charts of different locations all have positive trends – it’s very easy to see.
Is you argument that a year or three at the end of the charts are not the warmest? And that proves no warming?
Really??!!
You clearly don’t know what a trend is. A trend is a series of higher highs and higher lows, or lower highs and lower lows. A regression line that you appear to be referring to has its validity determined by its R-Squared. Clearly the R-Squared of those trend lines is near 0.00, and basically meaningless. Almost 100% of every chart clearly shows that temperatures during a relatively recent period are below levels from the early part of the chart. If temperatures 5 years ago are below temperatures sent in the 1930s or so, you don’t have an uptrend, you have volatility. Also, CO2 is a near linear variable, the quantum mechanics of a CO2 molecule are constant, so CO2 can’t cause the volatility observed in the temperatures. Most data sets show a cooling into the 1970s, and then warming afterwards, that is an osicllaion, not a trend caused by CO2. I’m pretty sure those oscillatoins can be tied to the oceans which are warmed by incoming visible radiation, not outgoing IR.
Judith Curry seems to enjoy the approval of the ‘skeptic’ community.
She writes about SkyDragon Slayers:
“The skydragons continue to expect me to debate them, their preferred forum is a radio debate. While I will never shut the door on skeptical challenges to the science and encourage contributions from those from different areas of expertise, this group beggars belief. I will continue to (barely) follow Claes Johnsons work to see if he is able to come with anything interesting or publishable. IMO, this group has damaged the credibility of skepticism about climate change and provides a convenient target when people want to refer to ‘deniers’ and crackpots.”
https://judithcurry.com/2011/10/15/letter-to-the-dragon-slayers/
b,
Is that supposed to be some sort of appeal to authority?
Facts dont need approval from anybody, you fool.
The fact that you cant even explain why the GHE vanishes at night is not subject to anyones “approval”.
Maybe you could try to describe the GHE, but you know the result would be version rather than applause. Bad luck for you.
It’s hard to understand why anyone would apply much credence to Curry. She’s only got a degree in geography followed by more indoctrination in Earth sciences. There no evidence she understands radiative physics or advanced thermodynamics, which are both necessary to an understanding of Earth’s climate.
The comments to her nonsense were interesting. Willis E. nailed it:
https://judithcurry.com/2011/10/15/letter-to-the-dragon-slayers/#comment-122621
Willis, seeming to be angry, believes that the East Anglia emails revealed disturbing correspondence between researchers that prove they are corrupt.
He doesn’t argue for this conviction. He persuades by belittling and berating those who disagree with it.
This is your champion?
I read the next quote. On a value per word ratio I rate this one a bit higher.
Your post is written in the style of AGWers: anybody who doesnt agree with me is either lying like a dog or clueless.
Yes barry, that’s why you’re so quick to call someone a “lying dog” when they point out how absurd your beliefs are.
I feel no constraints on language when you lie about me. Glad you’ve remembered.
Sorry barry, I can imagine how much truth annoys you.
You believe that fluxes simply add. You believe in the simple math presented by fraudkerts. Such nonsense would result in ice cubes being able to boil water.
But, you realize ice cubes can not boil water, so you rationalize the conflict by claiming Im lying rather than your cult.
A cult has no constraints about any action necessary to protect the cult.
I’m glad you’ve stropped lying that I believe IR from ice cubes can boil water. You’ll notice I haven’t called you a lying dog since you quit doing that.
A good dog can learn a simple behaviour with enough encouragement. Unfortunately, they can’t learn about the physics of IR, and therefore don’t understand why it is that fluxes irradiating a surface are summed, yet ice cubes can’t boil water. It doesn’t matter how many times you explain it to them, they just don’t have the cognitive capacity.
October 15, 2011 is SO last decade.
barry says:
”Judith Curry says: I will continue to (barely) follow Claes Johnsons work to see if he is able to come with anything interesting or publishable.”
Dr Curry understands that the greenhouse theory is not well stated. She wouldn’t give encouragement to Johnson if it was.
She is open to other ideas for climate change. But her work has always centered around trying to understand climate sensitivity to changes in the gaseous atmosphere.
There is a robust amount of holes in current greenhouse theory to allow for some climate change that has nothing to do with CO2. However, I recognize that Greenhouse gases are a necessary condition for a greenhouse effect but may not be a sufficient condition.
So Dr. Curry is talking about still half-baked theories. If you see this as a contest between the poorly stated greenhouse theory and another theory with less support, why engage in a debate?
Its a waste of time. It doesn’t end up being a debate about science.
Dr Curry has changed her stripes like good scientists should as more data rolls in.
She has called out the models for not reacting to observations which for decades has under performed model expectations. The obvious reason is people are trying to dupe people.
But I am happy that you are promoting her as she is right about that.
“She wouldn’t give encouragement to Johnson if it was.”
Encouragement for Johnson…
“IMO, this group has damaged the credibility of skepticism about climate change and provides a convenient target when people want to refer to ‘deniers’ and crackpots.”
Bill, you talk rubbish. You’re a classic hand-waver.
I take it you didn’t have a logical response to anything I said. what did I handwave away Barry?
Evidence says offshore wind development is killing lots of whales
“The recent deaths of seven whales off New Jersey, mostly humpbacks, got a lot of attention. The federal NOAA Fisheries agency is responsible for whales. An outrageous statement by their spokesperson got me to do some research on humpback whale deaths.
The results are appalling. The evidence seems clear that offshore wind development is killing whales by the hundreds.”
https://wattsupwiththat.com/2023/01/23/evidence-says-offshore-wind-development-is-killing-lots-of-whales/
The Left always projects- they were blaming lobster fisherman for killing whales.
Ohhh gbaikie…
David Wojick is best known at WUWT for his continuous, very ‘interested’ fights against warming, sea level rise and the like.
Are you sure he is the best guy to inform us about whales?
*
During the last years I repeatedly have read news concerning stranded whales – and that not at all in regions where offshore wind farming is developed!
Here is a somewhat less ‘one-sided’ info:
https://www.whalefacts.org/why-are-whales-endangered/
*
By the way: do you know how many 100,000 dolphins, tuna and sharks are killed every year by global large-scale fishing?
— Bindidon says:
January 24, 2023 at 6:00 AM
Ohhh gbaikie
David Wojick is best known at WUWT for his continuous, very interested fights against warming, sea level rise and the like.
Are you sure he is the best guy to inform us about whales?–
So, David doesn’t know we are in Ice Age and is against warming to say nice average global air temperature of say 18 C.
I don’t think it’s going to warm enough, for him to worry about.
I don’t think humpback are endangered, but there is some species of whale some are worried could go extinct, and it claimed lobster fisherman were killing them in this same region as a a lot useless oceanic wind mills are going to be made- which of course going to ugly and cause all kinds environment damage because that what governmental projects always do.
“By the way: do you know how many 100,000 dolphins, tuna and sharks are killed every year by global large-scale fishing?”
Well I know Chinese are doing large scale fishing projects in waters no where near China, and China has already wreck it’s water [because it’s totalitarian government run thing- or government controled just like wind mills.
US still has super clean up areas they ae failing to deal with and and Soviets were worst than US government in this regard.
One advantage is Chinese like to eat shark and dolphins- so it will not be a waste of food.
Thank you for this absolutely intelligent answer.
I don’t know about whales. Seems biggest problem with whales is ship strikes. But hardly anybody wants to take that gorilla on.
Windfarms? Well we know these windmills kill a lot of birds and there are a lot of endangered seabirds.
But mostly this is just like land wind farms. When they started handing out massive loans and incentives the financial prospectus information fed to the public would have never passed an auditor’s muster.
Everything was being measured at peak performance levels with ridiculously low or zero maintenance costs. As such many farms aren’t making it on land. Put them at sea in one of the most corrosive environments on earth is very likely to be a much larger boondoggle.
Then there is maintenance. Windmills are probably the most dangerous form of energy with regard to the safety of maintenance workers. Boat owners on the ocean spend huge amounts of money on maintenance and it requires major down time every year. Building them is one of the cheaper costs.
Gill,
We certainly should do something about birds. Speaking of which, did you know that glass skyscrapers killed more than a billion birds in the US per year? This is more than cars, but less than cats, the worst enemy of birds.
https://climateball.net/but-renewables#birds
Indeed. But putting in offshore windmills isn’t doing anything for the birds. Quite the opposite. Might be good to test solutions with the current wind farms first.
This is the reality for quite some time, gbaikie, and not something posted by some well known anti-renewable guy on a blog 100% funded by fossil fuel supporters Heartland and GWPF (i.e. the Koch brothers):
https://www.lemonde.fr/planete/article/2023/01/24/sur-le-littoral-atlantique-une-surmortalite-des-dauphins-intense-et-precoce_6159029_3244.html
*
” Hundreds of dead dolphins, sometimes mutilated and gutted, wash up on the French Atlantic coast
For cetaceans, the stranding season is off to a bad start on the French coast. Between Christmas 2022 and January 15, nearly 300 of them 90% of common dolphins were found dead on the coasts all around the Bay of Biscay, up to twenty on some days.
Scientists from the Pelagis Observatory (University of La Rochelle-CNRS), who examined these animals and autopsied some of them, note that ‘the majority showed traces of capture in fishing gear’. “
I think lobster fisherman use traps.
I am not sure why the French are killing dolphins.
France’s first commercial-scale offshore wind farm starts full operations
https://www.reuters.com/business/energy/frances-first-commercial-scale-offshore-wind-farm-starts-operations-2022-11-23/
Hmm, I wonder if Chinese are doing this:
“The city of Chaozhou, in Chinas Guangdong province, is going to build an offshore wind farm so large that it is expected to provide more power than all of Norways power plants combined.
The city intends to start work on the 43.3-gigawatt (GW) offshore wind farm before 2025, according to the citys five-year plan, which is published online. The plan does not disclose how much the offshore wind farm is expected to cost.”
https://electrek.co/2022/10/22/china-offshore-wind/#:~:text=China%20connected%20more%20offshore%20wind,in%20the%20last%20five%20years.
They are planning. But it seems related to war planning.
“October 25, 2022 Chaozhou a city in China’s Guangdong province has revealed ambitious plans for a 43.3 gigawatt facility in the Taiwan Strait.”
Everyone seems to want to kill whales.
Gordon Robertson
Your post of Jan 23 6:40pm answers my question concerning CO2’s ability to add heat to the earths which had heated the CO2 in the first place. Thanks!
I wonder what the Global Temperature Satellite Variance Graph would look like placed in a 500 year span with the high and low being the temperatures measured someplace on Gaia. Say -90 C to +60C.
I watch the graph every month, for years, to see what is going on. I enjoy reading some of the comments, especially the ones that are over my head in science. In all, I have yet to be convinced warming is a problem. Quite the opposite. If it gets much colder we will have an agriculture problem and mass starvation shortly thereafter. If Milankovitch was correct, and I see no reason he is not, CO2 may have given us some lag time, but won’t fix the problem. If CO2 can fix the problem, then I say keep adding. Toward that end, I do my part.
CO2 has no significant effect on climate. The slight warming contributed by human activity has been from increased water vapor. About 90% of the extra water vapor (above that from just feedback from planet warming) is from irrigation.
The radiation from the IR gases in the atmosphere does not add heat to the surface, it counters the cooling so the surface needs to be warmer for the same heat flux. The net heat (energy) flux is from warmer to cooler, as the 2nd law mandates. Apparently it takes a Mechanical Engineer to understand some of this stuff.
Perhaps you can persuade Gordon and Swenson to accept this.
This is widely known among physicists, engineers and even biologists.
But not if your name is Gordon or Swenson. For them, denying such physics is a belief they can’t demonstrate.
Dan, water vapor has more heat capacity than other atmospheric gases. You’re maybe confusing “heat capacity” with “heat source”. More heat capacity does not mean higher temperatures.
Consider a box with 5 bricks inside. The box and bricks are all at the same temperature. If a sixth brick, also at the same temperature, is added the temperature does NOT increase. More heat capacity has been added, but the temperature is not higher.
CR, Heat capacity only matters in a transient. The time constant for the planet is about 5 years so assumption of steady state in heat transfer analysis is valid. Adding more WV is like adding another blanket over your pile of bricks.
As the radiation flux rises through the atmosphere, it travels from IR active molecule to IR active molecule at the speed of light in the atmosphere but the energy resides in each IR active molecule for the dwell time (AKA decay time) of 1.1 s. The accumulation of dwell times in WV molecules slows the energy flux producing the Greenhouse Effect. The measured increase in WV molecules has slightly increased the total of dwell times and contributed to planet warming.
It seems you’re making the same mistakes as is done with the CO2 nonsense, Dan.
It doesn’t matter how long it takes a photon to leave the atmosphere. Billions of 15μ photons cannot raise the temperature more than one 15μ photon. Photons don’t simply add. If they did you could boil water with ice cubes.
Your own example, “Adding more WV is like adding another blanket over your pile of bricks”, makes my point. The blanket would not increase the temperature of the bricks.
Clint R
You are saying total garbage! Horrible physics! Millions of 15 micron photons will produce a much higher temperature in a receiving surface than one. The energy adds. Your Flat Earth Anti-Science posts seem to have no limits. Rational thought and logic are not able to limit your endless stupid points. This may be one of the dumber ones.
That’s what you believe, troll Norman. That’s the nonsense that supports ice cubes boiling water.
You can’t support ANY of your false beliefs. You reject science. That’s why you’re just a troll.
Norman,
You wrote –
“Millions of 15 micron photons will produce a much higher temperature in a receiving surface than one. The energy adds.”
Well, no, it doesn’t. 15 microns is the peak frequency emitted by a black body at about -80 C – about the maximum temperature of frozen CO2 (dry ice).
Now try and raise the temperature of liquid water using dry ice. Use as much as you like. Sing the secret SkyDragon songs of power, while you dance naked around a picture of the bearded, balding, bumbling buffoon called Michael Mann.
Doesnt work, does it? Heat travels from hot to cold. The Earth has cooled over the last four and a half billion years. You are a delusional SkyDragon cultist.
Carry on regardless.
“Billions of 15μ photons cannot raise the temperature more than one 15μ photon”
Are you saying there is no more energy in billions of photons than just one?
norman…”Millions of 15 micron photons will produce a much higher temperature in a receiving surface than one”.
***
Only if the 15 million alleged photons come from a hotter source than the receiving surface.
Bazillions of these alleged photons from the Sun bombard the Earth’s surface and cause it to warm. However, billions from a source like an iceberg promote no warming in the same surface. If you are standing on that iceberg it will not warm you, rather it will cool you.
2nd law, Norman.
rlh…”Are you saying there is no more energy in billions of photons than just one?”
***
No. Swenson is saying that billions of photons from a cooler source have no effect on a hotter object. Basic quantum theory and the 2nd law. Also, a fact in physics: energy cannot be transferred from a state of lower potential energy to a state of higher potential energy.
“Swenson is saying that billions of photons from a cooler source have no effect on a hotter object.”
Swenson did not say how warm the receiving object was.
RLH wrote –
“Swenson did not say how warm the receiving object was.”
And why should I? Radiation from a cooler object cannot be used to raise the temperature of a warmer.
There are some idiots who think they are with clever by pointing out that liquid nitrogen can be warmed with dry ice – which is warmer of course!
So whoever said “Swenson is saying that billions of photons from a cooler source have no effect on a hotter object.” has put words into my mouth (otherwise they would have quoted what I wrote), but I am not complaining.
You cannot raise the temperature of say, water, unless you have a sufficient supply of heat at a higher temperature. Try warming liquid water at any temperature, with water ice of any temperature, and see how you go. No thermometers, formulae, calculations, or knowledge of the laws of thermodynamics required – you still cant do it, no matter how clever you think you are.
Still no GHE. The surface cools at night. Energy goes to space, and cooling results.
Its easy to see through the BS.
The proponents of the mainstream greenhouse affect flip back and forth between a vacuum radiation model and a gaseous insulation model. The reason is they don’t even know how it works.
And they come in here with their arguments that are all over the place like a soup sandwich and expect anybody to believe it. One minute the greenhouse effect is like insulation and an convection break. Well there is a single layer convection break at TOA so that provides a lot of evidence of an insulation effect.
But a single layer model isn’t sufficient they explain because that model would be saturated. So they switch to vacuum cleaner models that have no convection and as a result they can construct multi-layered models as if panes of CO2 were suspended above earth’s atmosphere with layers of vacuum between the layers creating more convection breaks.
They are fooling themselves and don’t have a single model on which they can hang their hat that isn’t believed to be saturated AFA CO2 goes. Its possible water vapor isn’t saturated at least it appears to be warmer than CO2 emissions as it is not evenly distributed, So it could be variations clouds or water vapor that causes the climate to change as some scientists not in a feeding frenzy at the hog trough believe.
“Radiation from a cooler object cannot be used to raise the temperature of a warmer”
Did I ever say otherwise?
No you didn’t but if it high level atmosphere GHG many layers above the bottom layer how does it prevent the surface from cooling? We know from experimentation that you need a convection break to slow cooling in a gaseous atmosphere and there is just one of those in the atmosphere at TOA and it has been there forever. Seems you need another break when one break is already saturated AFA CO2 is concerned.
dan…”As the radiation flux rises through the atmosphere, it travels from IR active molecule to IR active molecule at the speed of light in the atmosphere but the energy resides in each IR active molecule for the dwell time (AKA decay time) of 1.1 s”.
***
Dan… I tend to support you with your scientific comments because you state them on a scientific basis. However, there is no proof for what you claim above.
Gerlich and Tscheuschner, who both have expertise in thermodynamics, claimed the obvious. The movement of EM through the atmosphere is far too complex to be described as a one to one relationship between photon and molecules. They claimed that such a study would require Feynman diagrams that would become hopelessly lost due to complexity.
We have no idea what happens with individual molecules in the atmosphere, and simplifying them to the extent simplified is simply not science.
We’d have much better luck dealing at the macro level with a study of bulk gases. To understand the relationship of CO2 to the rest of the atmosphere we could apply the Ideal Gas Law in a generalized form, assuming steady state conditions and the atmosphere as a constant volume of gas.
However, we must recognize the negative pressure gradient produced by gravity and note that the value ‘n’ in PV = nRT varies with altitude. Therefore, as is done in calculus, we could break the atmosphere into smaller concentric layers where ‘n’ and pressure are likely to remain constant for a time. Or we could project an ideal atmosphere with no turbulence.
If we do that and apply Pv = nRT to those layers, since V is a constant we can write it as P = (nR/V)T, which means pressure and temperature have proportional relationship. That is verified by the fact that temperature and pressure both reduce with altitude.
Since the atmosphere is a mixed gas, we must apply Dalton’s law of partial pressures. It states that the pressure of a gas is the sum of the partial pressure of its constituent gases. It follows that if that is true, and pressure and temperature are proportional, there must be an equivalent partial temperature contributed by each gas.
It doesn’t take a degree in science to understand the meaning. If CO2 has a concentration of 0.04% then it can deliver no more than 0.04C per 1C warming of the entire gas.
WV is not much better. At sea level, in the Tropics, it can account for about 3% to 4% of the atmosphere. At higher altitudes, and in the polar regions during winter, it has little or no effect. The only significant effect it would have is in the Tropics where there is little or no global warming anyway.
I think we should be looking for the source of warming elsewhere.
Dan,
You wrote –
“Adding more WV is like adding another blanket over your pile of bricks.”
The pile of bricks will still cool, wont it?
Add as much WV as you like, heat your pile of bricks during the day, leave them out at night and watch them cool.
insulation just slows the rate of heat transfer. Final temperature is unaffected.
Swen, Its not that complex a concept. If the bricks cool they must be warmer than the surroundings. If they are at constant temperature and warmer than the surroundings there must be a source of heat to
the bricks equal to the heat loss. If you now add a blanket over the bricks you reduce the heat loss and the bricks will warm.
Its a good analogy to the earth. The heat source is the sun and the surrounding is the cosmic background at about 3 Kelvin. Increase the blanket of added IR active gas (water vapor) and it contributes to the earth getting warmer. The increase in WV became substantially steeper around 1960 coincident with a substantial increase in the irrigation increase trend.
Dan,
At night the surface still cools. The Earth has cooled over the last four and a half billion years, maximum temperatures on the airless Moon are about 125 C, much higher than anywhere on Earth.
Do your hypotheses support these facts?
Mine do, and they don’t include any silly GHE.
Over to you.
Yes, Except the earth stopped cooling eons ago.
I don’t want to steal Ireneusz Palmowski‘s thunder, but he may be delayed in posting his daily Polar Vortex update, so I’ll only post the headline and link here…
A strong Stratospheric Warming event is about to start, impacting the Polar Vortex as we head into the final month of the Winter Season.
https://www.severe-weather.eu/global-weather/strong-stratospheric-warming-event-polar-vortex-january-forecast-united-states-europe-fa/
Although your post is of scientific interest, and I thank you for posting it. I hope it’s not a cheap shot at inferring the ‘strong stratospheric warming’ is related to anthropogenic warming.
The warming referenced is caused by natural disruptions in the flow of the vortex, apparently by Rossby waves that allow warmer air to temporarily penetrate the stratosphere.
The stratospheric warming is temporary and due to natural causes.
Monterey Park shooting: 11 died
Half Moon Bay shooting: 7 died
Yakima shooting: 3 died
*
I love my Second Amendment!
Indeed! 2nd amendment stays.
Assault weapon mass deaths hardly registers on the scale. Some facts. there are so many other priorities. the 2nd amendment was in place to allow for the citizenry to oppose tyranny. first thing the British did was try to confiscate the weapons of the colonists as protests began to elevate. The Don’t Tread on Me flag was a warning to tyrants.
Some facts:
There were 40,000 gun deaths in 2022. Half were suicides.
617 gun deaths were mass shootings.
In 2020, 12,179 Black Americans were killed with guns, compared with 7,286 white Americans.
In 2020, while Black Americans made up 12.5 percent of the U.S. population, they were the victims in 61 percent of all gun homicides.
Black offenders account for about 90% of homicides on blacks.
Black women are twice as likely as white women to be fatally shot by an intimate partner.
American Indian and Alaska Native women are killed by intimate partners at a rate of 4.3 per 100,000, compared with 1.5 per 100,000 for white women.
One should be able to find many better options to reduce gun deaths as opposed to gun confiscation by going after the specific problems themselves. Welfare doesn’t work. idle hands are the devil’s workshop and welfare promotes idle hands.
Thomas Sowell opposes minimum wage because it reduces employment. Everything you see with computers taking jobs is heavily promoted by minimum wages. This is an excellent interview. https://youtu.be/mS5WYp5xmvI?t=339
How else are conservatives going to thin the ranks of the unbelievers?
b,
By killing 42,000 of them a year with motor vehicles?
what about the 100,000 dying from fentanyl that the Chinese are poisoning us with- let’s more of the global free trade via criminal cartels
gb,
You are right. US manufactured fentanyl is far safer. According to the DEA “Clandestinely-produced fentanyl is primarily manufactured in Mexico.” Those blasted foreigners – probably stealing US intellectual property!
In its prescription form, fentanyl is known by such names as Actiq, Duragesic, and Sublimaze.
Obviously, there needs to be a law against supplying foreign fentanyl, and taking money away from poor starving US drug companies. Or maybe the US is full of scofflaws?
Gee, maybe the Government should declare war on “drugs”. That might work.
Only joking.
pure fentanyl is like pure LSD, except fentanyl is stronger and a lot cheaper than making LSD
“LSD belongs to a group of drugs known as psychedelics. When small doses are taken, it can produce mild changes in perception, mood and thought. Larger doses may produce visual hallucinations and distortions of space and time.”
“In its pure state, LSD is a white odourless crystalline substance. However, LSD is so potent that an effective dose of the pure drug is so small, its virtually invisible. As a result, its usually diluted with other materials.”
So, pure fentanyl is stronger than the pure state of LSD- one takes pure LSD. Enough pure LSD could used terror weapon by putting a relative small in water reservoir, same applies with pure fentanyl but you need less of it and much cheaper.
Now have idiots cutting it- and they are probably high and criminals,
of course.
The US road toll was more than 42,000 in 2021. Little chance of banning motor vehicles, even though is no constitutional right to drive same.
Murder is murder – gun, knife, poison, flying airplanes into buildings, truck bombs, blunt instrument – the dead are dead.
Apart from one county that I know of, people are not required to own a gun. I understand that home invasions and burglaries have dropped markedly in this county. I dont know how many lives have been saved, nor how many serious personal injuries have been avoided due to the drop in crime.
In the meantime, nobody has managed to change the US constitutions Second Amendment. Majority rules?
The road toll per capita in the US has been brought down by enacting road laws. You can see the inflection point in per capita road fatalities from 1968, when the Department of Transportation was created and laid down a bunch of laws to prevent them.
Same could happen for gun deaths in the US, but…
“Murder is murder gun, knife, poison, flying airplanes into buildings, truck bombs, blunt instrument the dead are dead.”
Murder is fine by Swenson and conservatives.
Does anyone know why it is only the US that has regular mass shooting at schools?
“There is no solution in taking away every firearm from every person who has one.”
Like clockwork a blowhard utters a position no one holds.
It’s easier to burn down straw men that come to grips with complexity.
barry, the murderers are people that deny reality. If you were to honestly review every case, the murderers are denying reality.
It’s not that far away from you trolls that deny reality here. When you called me a “lying dog” because I explained to you that your beliefs resulted in ice cubes boiling water, what did you do? You overreacted, to save your false beliefs. You denied reality.
Gun violence is related to mental illness aka denying reality, not guns. At our last family gathering, we counted 53 guns between 8 adults. Five of the weapons might be considered “assault weapons”. Three of us carry concealed weapons. No one has been murdered, but we enjoy our hunting, shooting range, and freedom.
You need to spend a couple of years in reality.
“At our last family gathering, we counted 53 guns between 8 adults”
At our last family gathering we counted 0 guns. But we live (safely) in the UK.
“You need to spend a couple of years in reality.”
You think that anecdotes about your family represent the issue of gun violence in the US.
All the best to your family, but you are a f’kin idiot.
yes but if you exclude the black population in America the murder rate in the US is only a little ahead of the UK.
Gun control could have some effect but better effect would be achieved by a concerted social effort to change the culture of violence in the black community. Trump is the only President that made headway in that area. Since then it has been once again regressing.
No doubt about the racial disparity in gun violence, but white people also commit homicides with guns, so eddicatin’ the blacks isn’t going to solve the problem, though it may mitigate it.
I believe the majority of school shootings are done by white people, and domestic terrorism in the US is primarily carried out by white people.
You understand that I look at the US from my country where there is not a national gun culture, and 2nd Amendment and low gun ownership, low homicide rates compared to the US, and no school mass shootings.
If we can live without guns, why can’t Americans?
Because of the culture, I guess.
“Gun control could have some effect but better effect would be achieved by a concerted social effort to change the culture of violence in the black community. Trump is the only President that made headway in that area.”
I’m regularly checking things you say because you regularly get things wrong.
In the years 2016 to 2019 incl, gun homicide committed by African Americans rose.
https://en.wikipedia.org/wiki/Race_and_crime_in_the_United_States
Trump did NOT make headway.
One must first understand the violence. As your article points out it is believed to have roots in socioeconomic problems.
It is pretty well understood that the massive increase in black violence arose after the 1964 Civil Rights protections at a time that black households were becoming better off.
So what happened and why so much violence increase in a time of socioeconomic advancement for black people?
The answer is fairly well understood. Not everybody advances at the same pace. A significant amount of that advancement occurred in the less successful sectors of the black community. That was due to the infusion of welfare and a requirements that chased fathers out of homes. Before that it was imperative to have a man in the house with children to provide some income to take care of the children even if it only bought beans and hamhocks. Suddenly with food stamps, welfare and the health care that came with it; the man became an obstruction.
More than anywhere one needs a strong father figure in the household in the lower socio-economic brackets. I took my wife and her child from another marriage (to a dead beat who had a court ordered child support requirement but never paid it) off welfare when I married her. So I knew the issues well.
Trump made headway on the socio-economic side to an extent beyond any other President. If that hadn’t been thrown out the window by incompetence of the current administration it would have resulted in a positive effect on violence. But it was too short timewise of an effort because you need .
Here is the evidence. Trumps Presidency saw the greatest reduction in mother only households.
https://www.census.gov/content/dam/Census/library/visualizations/time-series/demo/families-and-households/fm-1.pdf
Note the uptick starting 2020.
Here is a story on the need for what Trump did.
https://thehill.com/blogs/congress-blog/politics/137831-the-last-trump-card-for-conservatives-helping-the-fatherless-child/
Suddenly it was imperative that a family have a man in the house and ofte
lower economic sectors of
What happened then? A huge increase in single parent families with the large increases in welfare that chased men out of the house. We now have nearly 3 generations of violent young men being bred.
Look at the frustration level of people around the world due to things like covid and global warming bs. It is compounded in the US by idiotic politicians who are openly stepping on peoples’ freedoms they had come to expect.
This has nothing to do with firearms per se, it’s about anger and frustration. It just so happens that firearms offer a convenient way to express that anger and frustration.
I get it that firearms in the hands of an emotionally distraught person is not a good mix. We could fix a lot of that by taking steps to heal the anger and frustration. By listening to people.
There is no solution in taking away every firearm from every person who has one. Such an action is a gross denial of the the cause of such violence. Plus the fact it leaves those people vulnerable to predators with illegal firearms.
What the 2nd amendment is about.
“A well regulated Militia, being necessary to the security of a free State, the right of the people to keep and bear Arms, shall not be infringed”.
Note the reference to a well-regulated militia. The definition of militia is open to interpretation.
What happens in the event of a major disaster or something like a nuclear war, where anarchy can prevail? Should citizens be left helpless to defend themselves?
We put far too much trust in our fragile democracies, presuming they will always be there and cannot be undone overnight.
Militia arguments aside, it would make sense that Chicago not have to govern the same as Denver. Many talk about the beauty of governing local then have no problem tossing that aside to score political points and feed paranoia. No government is coming to take your guns unless you’re a threat to society. Not when 99.9% of gun owners aren’t committing crimes with them. Yet that doesn’t mean bazookas are legal. You can expect regulation of anything that can kill other people, whether cars, abortions, or guns.
The problem is that law abiding citizens in cities should have the right to protect themselves.
And we have seen how Afghans and Vietnamese have done with RPGs and assault rifles in preventing empire builders from consuming their culture no matter how much that culture is seen as being abhorrent. Did we sign a social contract to surrender those rights? Just asking. I admit it is difficult to answer.
I agree nobody foresaw rpgs. But Cannon, mortars and howitzers made up the three types of artillery used at Yorktown by the Americans, French and British. . . .they were well aware of that.
dan…”The net heat (energy) flux is from warmer to cooler, as the 2nd law mandates”.
***
Clausius wrote the 2nd law and he said nothing about net heat (energy) flux. He stated the 2nd law in words, ‘Heat can NEVER be transferred, by its own means, from a colder body to a warmer body.
Just after he wrote that, he mentioned entropy, which he named. He stated that entropy is the sum of infinitesimal changes in heat at temperature, T, over a process.
Later he offered the equation for entropy intended as a mathematical representation of the 2nd law:
S = entropy = integral dq/T
Since T is a constant, it can be pulled outside the integral sign and we are left with:
S = 1/T.integral dq.
There you have it Dan, the 2nd law and entropy are about heat (q), aka thermal energy.
There is no mention in the 2nd law about a net anything especially not a net flux. The word flux refers only to electromagnetic energy in this context and EM is not heat.
In particular, heat is not a flux, it is an energy representing the kinetic energy of atoms. It needs to be pointed out to some, that KE is not energy per se but a descriptor for energy in motion. With reference to atoms in motion, that energy is known as heat.
Gordon,
A comet or meteoroid in deep space may be really close to absolute zero, but zipping along at 70 km/sec. Lots of kinetic energy, not much temperature.
Heat and energy are tricky things. Even at absolute zero, atoms retain their structures – plenty of energy available to stop electrons “falling” into the nucleus etc., it seems.
Prof John Tyndall wrote a book over a century ago called “Heat – a mode of motion”. I suppose what we perceive as heat is due to motion of a sort. “Heat” doesnt really exist – you cant weigh it, bottle it, store it, or anything of that sort.
Heat is just the result of photons interacting with electrons, not a cause of that interaction.
Still no GHE, though, and the photons radiated by ice wont warm water, no matter how many there are.
Well this is excellent.
Yes, EM radiation is not heat.
So when warmer objects absorb IR from cooler objects, they are not absorbing heat.
And the NET result of the two-way exchange of energy is a distribution of heat between the two surfaces we regularly talk about.
So when the green plate is emplaced by aliens in the shady side of the blue plate, it receives energy from the blue plate causing it to warm.
Now the green plate gives of IR in both directions, half of it towards the blue plate.
Now both plates are emitting and absorbing the energy from the other.
Notice that they are not absorbing each other’s heat, because, as you said yourself, Gordon, “EM is not heat.”
So when the warmer object absorbs EM from the cooler object, it is not absorbing its heat.
Heat is the energy that is transferred from one body to another as the result of a difference in temperature.
When you account for all the energy going between blue plate and green plate, the blue plate always imparts more energy to the green plate than the green imparts to the blue. Thus the flow of heat is maintained from hot to cold, satisfying the 2nd Law.
This condition is still satisfied when the GP is introduced.
Does Clausius mention such a condition? Yep.
“in the immediate interchange of heat between two bodies by conduction and radiation, the warmer body never receives more heat from the colder one than it imparts to it.”
Clausius used the word ‘heat’ for energy here. Because radiation, as you point out, Robertson, is energy, not heat.
How do we know Clausius meant IR energy instead of heat in the classic sense in this quote?
Because infrared radiation was observed and defined in 1800 by William Herschel. He called it ‘radiant heat, and that terminology was used until someone coined the phrase ‘infrared radiation’ in 1880, 30 years after Clausius wrote the 2nd Law.
https://www.americanscientist.org/article/herschel-and-the-puzzle-of-infrared
The GPE, and AGW, do not violate the 2nd Law. Because it is about energy transfer not heat transfer. And the cooler body never imparts more ‘radiant heat’ to the warmer body than it receives from it.
This is what is meant by the NET exchange of energy.
“EM is not heat.”
Remember what you’ve said here, Robertson.
barry,
If you are trying to say in a roundabout way that the mythical “GPE” does not violate the second law, you would be right. Presumably,, you meant the mythical GHE, but you were just a little sloppy.
Notice that the surface cools each night. The surface radiates energy, which goes to space, resulting in the surface cooling. You dont have to agree – the surface doesnt care,, and cools anyway.
As I said,
“The GPE, and AGW, do not violate the 2nd Law.”
GPE is “green plate effect” we have discussed here for years and is referred to in some detail in my post. Please stop being dense, deliberately or otherwise.
The sun going down at night is not an argument against AGW. It is an infantile observation, though, so well done.
barry,
Sorry, I am unaware of a “green plate effect” in physics. There is likewise no “greenhouse effect” (in the SkyDragon sense) in physics, either. Both are equally non-existent.
You wrote –
“The sun going down at night is not an argument against AGW. It is an infantile observation, though, so well done.”
Who said it was? Did you just make that up? I pointed out that there is no “greenhouse effect” raising temperatures at night. As you point out, a child knows this, but SkyDragons like yourself refuse to believe that sunlight heats the surface during the day, and the surface cools in the absence of sunlight – as it has done for four and a half billion years!
If thermometers get hotter, there is a heat source (hotter than the thermometers) heating the thermometers. AGW (anthropogenic global warming, I suppose) is most likely due to AGH – anthropogenic global heat. You prefer SkyDragon magic, I prefer known physics and reality.
The green plate effect may hav been covered in Pee Wee’s Adventure.
C’mon, Bordon.
Please stop being unkind to Joe.
the GPE is like a magic trick. It fools the observer into believing the surface of the earth is like a greenplate that emits from both sides of the plate.
The GPE is not an example of insulation.
And insulation is the only possible greenhouse model. The RW Woods experiment shows that either there is no insulation or that the insulating effect of the greenhouse effect was already saturated at least for the time of day of his experiment.
Science actually suggests that CO2 is saturated as a single layer model very near the surface and that the greenhouse effect might not be saturated in the water frequencies.
The last possibility is clouds are clearly not saturated but are not thought to have a net greenhouse effect in general but I don’t see any evidence of that one way or the other.
And finally it is possible greenhouse gases provide a net greenhouse effect as a result of convection ending at TOA. But that is a single layer model.
So the problem really is nobody even has a blueprint of how all this works. They had that hotspot model for a while but now nobody talks about it. The problem seems to be that the hotspot can’t be located and how does the hotspot get hot hasn’t been explained just like how the surface gets hot hasn’t been explained.
> It fools the observer into believing the surface of the earth is like a greenplate that emits from both sides of the plate.
The blue plate is the Earth, Bill, which does emit from two “sides”, the sunlit one and the dark one.
It’s only magic to cargo cult Dragon Cranks, to the rest of us it’s just well-understood physics.
brandon you are way behind on that conversation. i don’t have time to catch you up.
I responded directly to your most recent comment in this thread, Bill. If that point is out of date why did you make it.
Brandon the GPE experiment is a vacuum experiment. I am on record saying that 1) it may or may not be insulation model in a vacuum, and 2) it is not an insulation model in an atmosphere without a convection break.
I have further noted in this comment section that TOA may represent a convection break and that I actually favor that view point.
All this stuff is testable with a well designed experiment. We haven’t seen one in here. I have played devils advocate on the vacuum experiment noting that a false reading can be obtained by not paying close attention to view factors.
And then I have said of the vacuum model that if you get a result from the test they result of the insulation will be limited to insulation rules which for two sided plates and point source lights is half the mean insolation.
So I think I stated that correctly.
“Brandon the GPE experiment is a vacuum experiment.”
The sole purpose of the GPE is to demonstrate that the 2nd Law isn’t violated when a cooler body (GP) is introduced and the the warmer body (BP) warms.
If you agree that 2nd Law isn’t violated with the GHE then there is no need for you to think about GPE.
Barry you don’t understand what is happening in the GPE. The 1st plate is cooling out both directions from the plate. Put a plate behind it and more has to go out the front of the plate so it warms.
The plate in the GPE works like you were taught by mainstream ghe theory of what the temperature would be of a gas that could lose radiation out of both sides. Except that it actually does in the GPE because the front side cooling view factor is less than 1.0. And it doesn’t with the gas layer as you were taught precisely because the view factor is 1.0 and zero heat of the atmosphere is lost to the surface in that overly simplified model of the atmosphere. That is the correct answer per SB equations where the emissions of the gas back to the surface is less than the emissions of the surface.
So it must warm up . . . .except that since the system is only absorbing 240w/m2 it need not warm more than a total of 200w/m2 as 40w/m2 of the surface goes straight to space.
Of course near surface atmosphere will be the same as the surface much of the time because of heating of the atmosphere by conduction and transport by convection and diffusion. Conduction is the primary cooling mechanism of the surface giving up much more heat than via net radiation per the Trenberth budget.
swenson…good points.
Atoms retain their structure because the energy binding them is both electrostatic and nuclear. Temperature has no effect on either of those form of energy. Since heat is the energy of atoms in motion, reducing the motion to zero will stop the heat energy from acting.
We have to understand as well that the model of an electron orbiting a nucleus like a planet around the Sun may not be entirely correct or not correct at all.
I have read Tyndall’s book but I will read it again. As I recall, I was pretty much in agreement with him on heat. We need to remember, in respect of Tyndall, that he put out that book as a series of lectures before the electron was discovered, and even more earlier than Bohr’s discovery of the relationship between electrons and EM. Tyndall as well as Clausius thought heat flowed through space as heat rays.
I think what we perceive as heat is the increased vibration of atoms in our skin. No one knows what energy is, and that applies to any energy, not just heat. So, the increased vibration of skin molecules could be due to absorp-tion of EM from the Sun (radiation)or from the direct heating (conduction) of a heating pad.
Heat can be described as the interaction of photons interacting with electrons but there are other means of heating as well. For example, applying a flame to a mass has nothing to do with photons, it is a direct exchange of heat from a hotter body’s material to a cooler body’s material. In that case, electrons absorb the heat directly.
Speaking of heat pads, I use a small electrical heat pad on occasion. No photons anywhere. None that I have ‘seen’ anyway.
barry…”Yes, EM radiation is not heat.
So when warmer objects absorb IR from cooler objects, they are not absorbing heat.
And the NET result of the two-way exchange of energy is a distribution of heat between the two surfaces we regularly talk about”.
***
Barry, old chap, you fail to grasp what you just stated, that EM radiation is not heat. Maybe you were being facetious.
Bohr explained it in 1913. He claimed, when EM of a certain frequency is absorbed by an electron, the electron jumps to a higher energy level. In other words, it had a lower level of KE at the lower orbit and when it absorbed the EM, it gained KE and had to jump to a higher orbital energy level.
However, a higher orbital energy level means a higher velocity, since KE = 1/2mv^2, therefore the electron orbits faster and has a higher frequency. In this case, frequency is not a reference to an electron vibration but to the number of times it orbits per second.
The point is, the photon that excited it had to have a frequency the electron would respond to. That means it had to come from a hotter body than the body containing the electron that was excited. A photon from a cooler body simply lacks the frequency to affect an electron in a higher body.
Therein lies the basis of the 2nd law.
The basis of Bohr’s theory was the emission and absorp-tion lines for hydrogen which had been well documented. Since hydrogen, and all elements, emit and absorb at discrete frequencies, and not over a band of frequencies, Bohr suddenly got it that the electrons in matter must be restricted to certain energy levels that re related to Planck’s quantum constant, h.
He reasoned further that a quantum of energy with energy = E was related to quantum energy levels as E = hf. He defined E as the energy difference between orbital energy levels and f as the frequency of the quantum. The frequency,f, is also related to the angular frequency of an electron orbiting in an orbital.
An electron has a charge therefore it has an electric field around it. As it moves in its orbit, it creates a magnetic field. When it drops to a lower energy level, E2 – E1, it generates a quantum of energy with an electric and a magnetic field with the frequency of its orbital angular frequency. The intensity of the quantum is E2 – E1.
Now consider that in reverse. You have a cooler body and the electrons in that body are orbiting at a lower kinetic energy, meaning f is lower. Therefore, E2 – E1 is lower. If an electron emits that energy it will have a lower energy intensity, E2 – E1 and a lower frequency.
If that quantum now encounters an electron at a higher energy level in a hotter body, moving with a higher frequency, it will be ignored. That’s why there is no two-way transfer of EM between bodies of different temperatures.
Note that no heat moves between bodies with a radiative transfer. The energy moving is EM. However, when the EM is produced by an electron, the kinetic energy of the electron is reduced and that means heat is lost. If the EM is absorbed by a cooler body, and absorbed, the electron gains KE, which is heat. All heating and heat dissipation is local.
“The point is, the photon that excited it had to have a frequency the electron would respond to. That means it had to come from a hotter body than the body containing the electron that was excited. A photon from a cooler body simply lacks the frequency to affect an electron in a higher body.”
This is where you go off the rails.
A blackbody emits at a range of frequencies, not just one. The warmer object emits at a range of frequencies that overlaps with the cooler body. So the cooler body can send EM at frequencies above the average of the warmer body and the warmer body can emit EM at frequencies lower than the average of the cooler body.
Therefore, both bodies can absorb photons from the other, because both bodies emit photons across a broad spectrum of frequency range.
It is because you imagine that these bodies emit at a single frequency that you get this wrong.
barry…”A blackbody emits at a range of frequencies, not just one. The warmer object emits at a range of frequencies that overlaps with the cooler body”.
***
Blackbody theory does not apply here. To get the EM spectrum, Planck visualized a series of oscillators each emitting a specific frequency. The theory was essentially a thought experiment he manipulated to make the math work.
Ironically, Planck later admitted that had he known about electrons it would have made his life far easier.
Electrons are not theoretical entities and their properties have been well documented in electronic, electrical, and chemistry molecular bonding theory.
You need to understand that an element like hydrogen or sodium emits and absorbs only at discrete frequencies. For example look up the Balmer or Lyman series for hydrogen. Were it not for such unique properties, Bohr would never have discovered quantum theory.
Bohr credits a friend for urging him to bone up on the discrete lines in hydrogen, and doing that produced the insight he needed. He managed to connect the discrete frequencies emitted/absorbed to orbital energy levels and the theory worked. As Feynman put it, no one knows why it works.
Gordon,
> You need to understand that an element like hydrogen or sodium emits and absorbs only at discrete frequencies.
Same for molecular gasses like CO2 at normal atmospheric temperature. Like barry says, the key point is that two masses of CO2, one warm the other cool, will be emitting across the same spectrum, but at different intensities for each wavelength due to their temperature difference a la Planck.
Your statement, “A photon from a cooler body simply lacks the frequency to affect an electron in a higher body” is simply wrong. The warm CO2 mass receives the same frequencies of from the cool mass as it emits, and by Kirchhoff happily absorbs them.
Brandon said what I was about to say. Gases emit and absorbv at discrete frequencies, and those frequencies remain the same regardless of temperaturee. All that changes is the intensity.
Therefore a gas 10C will emit and absorb at the same frequencies as a gas at 1C, and both bodies of gas will absorb the IR from the other, because the frequencies match.
barry…”in the immediate interchange of heat between two bodies by conduction and radiation, the warmer body never receives more heat from the colder one than it imparts to it.
Clausius used the word heat for energy here. Because radiation, as you point out, Robertson, is energy, not heat”.
***
With respect to Clausius he did claim in the same chapter that heat transfer by radiation must obey the 2nd law. He must have known something was wrong with his inferred two way transfer but lacked the information we now have to see the problem. I am sure he was frustrated by the implication.
In the days of Clausius, all scientists believed that heat flowed as heat rays through space. It was not till 1913 that Bohr offered the correct interpretation of radiation and heat that the truth came to light. Clausius was a brilliant scientist who broke ground in thermodynamics. No one can expect him to have understood the relationship between electrons and EM, however, since the electron was not discovered till after his death.
The fact that you would quote him as you have indicates an utter misunderstanding of quantum theory as offered by Bohr.
As I have offered in the past, there are still anachronisms in science today. In electrical engineering courses at university, student are still taught an idiotic paradigm for the 1920s, that electrical current flows from positive to negative. In thermodynamics, we are still stuck with the insanity that heat and electromagnetic energy are one and the same. We are taught that entropy is a measure of disorder, when Clausius defined it as a measure heat.
Whenever a scientist speaks of ‘heat radiation’, or implies that heat can be physically transferred by radiation, it indicates he/she has no understanding of the real relationship between heat and radiation. I fear, based on what I have witnessed by modern science writers that is the norm rather than the exception.
I have whined here for some time about time. There is not one scientist anywhere who can point to an example of a phenomenon called time. The reason is simple, time is an invention of the human mind. We invented it based on the rotation of the Earth, and even early time pieces were based on the position of the Sun in the sky. Same thing.
“With respect to Clausius he did claim in the same chapter that heat transfer by radiation must obey the 2nd law.”
He says exactly that in the quote provided.
“in the immediate interchange of heat between two bodies by conduction and radiation, the warmer body never receives more heat from the colder one than it imparts to it.”
‘Heat by radiation’ is basically EM radiation, which as we know, is not heat. Clausius did not have the language for infrared radiation in the 1850s. That understanding would come 30 years later.
Clausius is clearly saying, here and elsewhere, that both bodies receive and transmit from each other (heat) energy in the form of radiation.
And he clarifies per the 2nd Law that the warmer body may not receive more (heat) energy from the cooler one than it imparts to it.
Eventually you’re going to have to argue that Clausius was wrong, because the language is not obscure. He is definitely saying that both bodies exchange radiant energy. This is the “simultaneous double heat exchange” he refers to elsewhere, which is also specifically about radiative transfer.
Your objection that warmer bodies can’t absorb photons from cooler ones is just flat wrong. I explain why here.
barry,
“It doesn’t matter how beautiful your theory is, it doesn’t matter how smart you are. If it doesn’t agree with experiment, it’s wrong.” – Feynman.
Try heating water with ice.
You are deluded if you think you can.
If you try really hard you can comment on topic.
barry…”He says exactly that in the quote provided.
in the immediate interchange of heat between two bodies by conduction and radiation, the warmer body never receives more heat from the colder one than it imparts to it.
Heat by radiation is basically EM radiation, which as we know, is not heat. Clausius did not have the language for infrared radiation in the 1850s. That understanding would come 30 years later.
Clausius is clearly saying, here and elsewhere, that both bodies receive and transmit from each other (heat) energy in the form of radiation”.
***
I have read Clausius cover to cover. He stated the 2nd law in words long before he wrote the chapter you are reading. He stated the 2nd law as…”Heat can never be transferred, by its own mans, from a colder body to a hotter body”. Then he spent a paragraph explaining ‘by its own means’. He later claimed the transfer of heat from cold to hot requires compensation. You won’t find anything about compensation in the chapter you are reading.
That is a general statement for all energy if you substitute for colder body and hotter body, lower potential energy to higher potential energy.
By the time he got to your chapter, he was focusing only on radiation. That’s where things went awry because like any other scientist in his time, he thought heat flowed as a substance through an aether in space. That’s why he was confused about heat flowing both ways.
Barry, heat cannot flow through space, especially through a vacuum. EM can flow through a vacuum. An insignificant amount of heat can flow through air but the molecules are so far apart the transfer is almost totally inefficient. Clausius had no way of knowing that even though he did stellar work predicting the behavior of heat in atoms, re internal energy.
I get it that he was saying heat flows both ways between bodies by radiation, but he was wrong and I have tried to explain why. He knew nothing about the interaction between electrons in atoms and how electrons convert heat as kinetic energy to electromagnetic energy with a specific frequency.
As predicted you had to argue that Clausius was wrong.
And you are forced into that position because his words are at odds with your (mis)understanding.
He was talking about radiation when he used the word ‘heat’ by radiation. This is the language that was used in his time, for the phenomena discovered 50 years prior by William Hershell – infrared radiation (though it was not called that for another 80 years).
So, Clausius understood that objects give off radiation, and he understood that while this energy was transferrable between objects of different temperature, heat in the classic sense is transferrable only from hot to cold (ignoring heat pumps).
Your objection that warm objects can’t absorb radiation from cooler objects because the frequencies don’t match is completely wrong.
A gas at 1C emits the same range of frequencies as a gas at 10C, all that is different is the intensity of the radiation.
So the electrons in each body of gas is receiving the right frequencies to have its state changed, and radiation is thus absorbed by both the cool and the warm body of gas.
barry…”The GPE, and AGW, do not violate the 2nd Law. Because it is about energy transfer not heat transfer”.
***
What is GPE and AGW about??? Heat!!! No one cares about radiation, heat is the energy of focus.
What is the 2nd law about??? Heat!!! It says nothing about radiation and in the development of the 2nd law, Clausius invoked heat engine theory related to pressure, temperature, and volume. No mention of radiation. In heat engine theory involving P, V and T, you hold one constant while you vary the other two. No radiation anywhere.
In your statement above, what energy is being transferred??? Heat!!! However, heat is directly related to atoms: no atoms, no heat. You cannot have heat in a vacuum because a vacuum lacks the atoms to which heat is related. So, how would heat get here from the Sun?
You claim AGW is about energy. What energy? Which energy is capable of melting the ice in the Arctic and the Antarctic? Heat!!! EM cannot melt ice as EM. It can transfer energy but that energy is no good till it is absorbed. If it is absorbed.
Therefore solar heat cannot travel 90 million miles through empty space and warm us. All the warming is created locally after solar EM is absorbed and CONVERTED to heat by electrons in atoms.
If that was not the case, why does all the ice in the Arctic and Antarctica not warm the planet?
Yes, AGW does violate the 2nd law, because it implies a transfer of heat from a colder atmosphere to a warmer surface that allegedly warmed GHGs in the atmosphere. Furthermore, the AGW implies that GHGs in the atmosphere can trap heat, That is an egregious error that confuses infrared energy with heat.
When IR is radiated from the surface, any heat related to it is gone, lost in the conversion from heat to EM. It can be absorbed or whatever, absorbing makes no difference to surface heat. Only 5% of surface radiation is absorbed by CO2, making even less of a difference. Doesn’t matter how much is slowed down, the heat is gone.
The cheating employed by alarmists that a net energy, being positive, does not violate the 2nd law, is nonsense. There is no reference to net energy in the 2nd law as stated by Clausius. And he made no mention of radiation being exempted when he invented the 2nd law.
“What is GPE and AGW about??? Heat!!! No one cares about radiation, heat is the energy of focus.”
What on Earth are you talking about? The direct mechanism for AGW is the radiative absorp.tion of IR by GHGs. The GPE is a model of radiative transfer to rebut the 2nd Law objection.
It’s ALL ABOUT radiative transfer.
“In your statement above, what energy is being transferred??? Heat!!!”
Via EM radiation, which is not heat. I thought we covered this?
But – check it out – when the blue plate and the green plate exchange energy and both get warmer, at no time does the green plate lose heat to the warm plate. If that were the case, the green plate would get colder. But it doesn’t.
There is no transfer of heat from the cooler body to the warmer one, so the 2nd Law isn’t violated in the GPE.
What is transferred from the cooler body to the warmer body is EM radiation, and, as we know, EM is not heat.
The cooler atmosphere doesn’t transfer heat to the warmer surface, because at no time does the surface gain heat at the expense of the atmosphere. They warm together.
What DOES happen is that surface and atmosphere transfer EM radiation to each other. And as we know, EM is not heat.
In order for the 2nd Law to be broken, cold must lose heat to warm. This never happens with AGW or GPE. Both bodies gain heat because the rate of heat loss for the system is slowed.
Like putting on a sweater, a colder object makes a warmer object warmer – not because the colder object lost heat, but because it slowed the rate of heat loss from the warmer body, and both bodies warm to compensate. Your sweater gets warmer as your skin temperature gets warmer until the sweater emits enough energy away to match what is being supplied by the body.
barry,
You wrote –
“Like putting on a sweater, a colder object makes a warmer object warmer not because the colder object lost heat, but because it slowed the rate of heat loss from the warmer body, and both bodies warm to compensate.”
Don’t be an idiot. Put as many sweaters as you like on a corpse (or a cooling body like the Earth), and no heating results. Or, if you prefer, surround your naked body with 100% CO2, and see how hot you get. See how irrelevant analogies just make you look stupid?
Slowing the rate of cooling is not heating, you fool.
That’s one of the reasons you can’t describe the greenhouse effect – you arent connected to reality.
Keep avoiding admitting that you can’t actually describe the GHE – let others see the depth of your delusional thinking for themselves.
barry…”If that were the case, the green plate would get colder. But it doesnt.
There is no transfer of heat from the cooler body to the warmer one, so the 2nd Law isnt violated in the GPE.
What is transferred from the cooler body to the warmer body is EM radiation, and, as we know, EM is not heat”.
***
That makes no sense then. Swannie claimed heat from the GP was warming the BP. I don’t think Swannie’s GP/BP experiment is about the 2nd law. He claims it is, I think it’s entirely about blocked radiation from the BP. If the GP is metal, it will absorb and block EM and if it is close enough to the BP, it will block EM radiation from the BP and cause it to warm, since reducing the radiation from the BP causes it to warm naturally.
After all, the temperature of the BP (in a vacuum), before the GP was raised in front of it was entirely dependent on radiation to cool it and it’s temperature would have been lower than if all radiation was blocked. When the GP blocked one half the BP, it reduced its ability to radiate away heat and it warmed.
***************************
“Both bodies gain heat because the rate of heat loss for the system is slowed.
Like putting on a sweater, a colder object makes a warmer object warmer not because the colder object lost heat, but because it slowed the rate of heat loss from the warmer body, and both bodies warm to compensate”.
***
Newton’s law of cooling states the rate of cooling of a body depends on the temperature difference between the body and its environment. We know that to be true. If you heat a mass and let it cool in a room at 20C it will cool more slowly than it will if you take it outside when the temperature is below 0C.
The surface is the same. It is the temperature of the entire atmosphere in contact with the ground that governs the rate of cooling of the surface. Since the entire atmosphere is 99% nitrogen and oxygen, it stands to reason it is the N2/O2 governing the rate of cooling, not a trace gas making up 0.04% of the atmosphere.
“That makes no sense then. Swannie claimed”
You’re not talking to Swannie, you’re talking to me, and what I said makes perfect sense. EM radiation flows both ways, heat only one way.
In order for the 2nd Law to be violated, a cool body must lose its heat to a warm body.
This absolutely does not happen with the GPE or the GHE. Because the cooler body does not get cooler as the warmer body warms. The cooler body gets warmer.
Cooler body is losing none of its heat to warmer body
2nd Law not violated, can we move on?
barry…”EM radiation flows both ways, heat only one way.
In order for the 2nd Law to be violated, a cool body must lose its heat to a warm body”.
***
EM does not ‘flow’ both ways Barry. Alternating current flows both ways. EM is radiated isotropically from a body and is not headed any way in particular. If another body is in the way of its radiation flux, the radiation will impinge on it.
Whether that impinging radiation makes a difference depends on the temperature of the emitting and receiving body. If the emitting body is a hotter and the receiving body is cooler, the cooler body will absorb the EM. If the receiving body is hotter, it will ignore the EM.
You cannot go on what Clausius wrote about that. Scientists in his day had no idea of the relationship between EM and electrons, believing that heat could flow through the atmosphere as ‘heat rays’. When Bohr introduced that theory in 1913, many scientists were skeptical.
Your statement about the 2nd law is not accurate. A cooler body can never lose it’s heat to a hotter body unless considerable effort is made to make it happen. Energy is not transferred from the cooler GP to the hotter BP.
With an air conditioner, a compressor is required with external power to drive it. Also, an easily compressible gas is required. Heat is transferred cold to hot by extracting heat from a room into a low pressure gas, compressing it, then exhausting the heat to a hotter target. The transfer is accomplished via the compression.
The heat transfer is accomplished by playing with pressure, volume, and temperature. The amount of pressure required to compress the gas is simply not available in the atmosphere.
Again, the 2nd law as stated by Clausius is…’Heat can never be transferred, by its own means, from a colder body to a hotter body’. There is nothing in there about an exception for radiation.
The reason is simple. No energy can be transferred from a lower energy potential to a higher energy potential by its own means. Water can be pumped uphill but not by its own means. A bolder can be lifted onto a cliff, but not by its own means. Transferring heat, by its own means. from cold to hot, is a no-no.
Earlier, barry attempted to imply he can describe the greenhouse effect. He wrote –
“But that is not what is being described as the greenhouse effect.”
He’s right, though. Precisely nothing is described as the “greenhouse effect”.
A pity, because other mythical creatures can be described in some detail – the unicorn, phlogiston – but description for the GHE!
Maybe barry can try, but he will probably claim someone else did, and he is far too busy to paste the description here. Oh well.
I think Earth has two greenhouse effects, ocean and sky.
So, to re-cap, global warming is about having Earth have a more uniform temperature. Global cooling is about having polar regions much colder and globally less uniform temperature.
The original use of term “global warming” was relate to rapid warming and rapid sea level rise, when Earth transition from a Glaciation period into an interglacial period. Recently that occurred over 10,000 years ago.
The global warming of our interglacial period {the Holocene] was weaker the past global warming periods. There various ideas of why this was different. But I would say a point about this, is the holocene has been cooler than past interglacial periods.
And roughly instead sea level rising 4 to 9 meter higher, than our present sea level, it only rose about 1 to 2 meter higher.
In the past interglacial period average global air temperature was about 18 C. Which doesn’t mean Earth was hotter, but rather in meant there was a more uniform global temperature, places like Germany were “semi- tropical.
A major aspect of tropics is a more uniform temperature- it gets the most sunlight, it has the most “greenhouse effect” and has the most uniformity of temperature.
So Germany spent thousands of year without freezing weather during time of the peak interglacial periods. And during our peak Holocene
Germany had more freezing weather, but was not as cold as it is, now.
gb,
You wrote –
” . . . it [the tropics] gets the most sunlight, it has the most “greenhouse effect” and has the most uniformity of temperature.”
The problem is that nobody can actually describe the “greenhouse effect”.
It obviously doesn’t exist on the Moon, where temperatures reach in excess of 125 C, so making surfaces hotter doesn’t seem to be part of its description. It doesn’t seem to have any heating effect at night, and apparently hasn’t had any heating effect for four and a half billion years.
I note that many people believe in Gods that they cannot describe, who have mysterious powers. I can only assume that “greenhouse effect” believers share the same mindset.
Humanity has offended the SkyDragon cultists, so their GHE is going to wipe nasty humans from the face of the planet, by boiling, roasting, grilling or toasting us.
What a load of rubbish! SkyDragons are free to believe anything they wish, but they seem to take offense if I choose not to participate in their fantasy. Just like religious fanatics everywhere.
–The problem is that nobody can actually describe the greenhouse effect.–
Increasing thermal mass of greenhouse, increases the greenhouse effect- which means greenhouse stays warmer after the sun goes down.
Of course with more thermal mass, it requires longer to warm up.
A greenhouse main function is prevent freezing [which can kill some plants]. Water require a lot energy to freeze. Water in gaseous state
requires a lot heat loss to become a liquid. The resistance to reach freezing temperatures is a greenhouse effect.
The cargo cult global warming ignores everything other than radiant aspects of greenhouse gases- and radiant aspects have nothing to do with an actual greenhouse.
But they might say it’s similar to a greenhouse effect. No one can say how much this radiant effect only aspect, causes any warming of Earth.
But this radiant effect [however much it is] can’t make Earth hotter- it might make Earth have a more uniform temperature.
One reason I say the radiant effects of greenhouse gases, might make Earth have a more uniform temperature, is there all kinds of factors which wipe out any warming effect- particularly when talking about CO2, which everyone agree is a weak greenhouse gas.
gb,
The atmosphere definitely smooths out the highs and lows. As you imply, slower to heat, slower to cool.
More CO2 and H2O in the atmosphere – the less the diurnal range. Less CO2 and H2O, the greater the diurnal range.
Still no greenhouse effect – just known physics at work. Any observed hotter thermometers are due to increased heat, pure and simple. Man-made, presumably, given that the planet cooled in the absence of mankind and the presence of an atmosphere containing both CO2 and H2O.
All the SkyDragons can do is pout, pose witless gotchas, and complain that people ask them to describe their silly object of worship. All good fun, but ultimately pointless.
“Still no greenhouse effect just known physics at work. ”
Well people have been looking at Moon for a long time.
You also had fad of making greenhouses and an interest in how to make a better greenhouses.
Questions of how is Earth different than the Moon and other planets- as I have said, Venus is a mystery which related to cargo cult of global warming.
And Venus doesn’t really have a Greenhouse effect- it would be colder
than Earth, at Earth’s distance from the Sun.
Venus surface is not heated by sunlight. Venus is more like the heating of Earth’s ozone or it would be like if Earth’s clouds warmed by sunlight heated Earth surface by a significant amount.
gb…”You also had fad of making greenhouses and an interest in how to make a better greenhouses.
Questions of how is Earth different than the Moon and other planets-”
***
If you put a greenhouse on the Moon, you’d have two weeks of severe sunlight followed by two weeks of dark and serious cold. Unless your greenhouse had an internally-controlled environment, and artificial sunlight, you couldn’t grow anything.
“If you put a greenhouse on the Moon, youd have two weeks of severe sunlight followed by two weeks of dark and serious cold. Unless your greenhouse had an internally-controlled environment, and artificial sunlight, you couldnt grow anything.”
I know how to keep it warm for 2 weeks- it involves water. But if copper is cheaper than water, I could use copper.
A large amount of copper or water will also keep it cooler, but making things cool or very cold is quite easy on the Moon- shade.
gb…”I think Earth has two greenhouse effects, ocean and sky”.
***
Do you mean there is a glass greenhouse in the sky and another in the ocean? You can’t have a greenhouse effect without a greenhouse.
The ocean is more transparent than glass and you could have greenhouse on Earth with tall walls which are 20 km tall, but it’s far cheaper not to have such tall walls- just make walls say 15 to 20 feet high and have glass ceiling/roof.
More than 80% of sunlight reaching Earth surface, passes thru the oceanic greenhouse. You can roughly ignore the 20%, except humans live on the land surface.
A simple rule is ocean area warms Earth, and land are cools Earth.
The average ocean surface is about 17 C and average land is about 10 C. The land would have a lower average temperature than 10 C, if it wasn’t warmed from the tropical ocean heat engine and the rest of the ocean.
Europe is extreme example of this, and the ocean warms the land area of Europe by about 10 C more than Canada. Canada is also warmed a bit by the ocean. And where you live, the temperature are strongly effect by the marine environment- that is well known. But Alberta is also warmed by the ocean.
Using the analogy of the greenhouse it seems probable that the atmosphere at TOA operates in some way as a greenhouse with a convection break as a greenhouse operates.
Often proponents of the greenhouse effect in their confusion about how the greenhouse effect of their daddy’s operates; they argue about this convection break and it does seem probable as a insulating barrier. The arguments about the GPE are whether the effects viewed are spurious due to view factors as the GPE purports to prove that the GHE is not purely insulating but is an active amplifier of heat. So you get this stupid arguments that float back and forth between insulator and amplifier.
To me it is not an amplifier. Insulation never amplifies. To amplify you need an additional energy source. Reflection can do it via magnification. But the greenhouse effect is not reflection so it doesn’t magnify.
The single layer greenhouse effect is not embraced by science as adequate.
Enter the multi-layered model where you have many ‘virtual’ convection breaks throughout the atmosphere. Problem with that is there is no empirical evidence it works.
A few years ago and I don’t have the source handy some researchers were looking at the CO2 effect and claiming only a couple of tenths of degree could come from the widening of the shoulders in the single layer model.
So its important to know that there is uncertainty here. And its isn’t just a tiny bit of uncertainty that can be discarded. We don’t understand the climate. And anybody that says we do is just simply lying and pulling it right out of their arse.
As Dr. William Happer has said, a truly visionary scientist who teaches at Princeton University. I don’t have the exact quote but he explains science that is well understood is easy to explain to an eager freshman class of students. It only gets hard when people refuse to listen.
Dr Curry even hosts a guy that posts about random walks around Milanovich cycles on her blog. The only thing about skepticism she objects to AFAIK is denials that greenhouse gases aren’t part of the equation. A lot of stuff is still on the table.
bill h…”To me it is not an amplifier. Insulation never amplifies. To amplify you need an additional energy source. Reflection can do it via magnification. But the greenhouse effect is not reflection so it doesnt magnify”.
***
That’s right, to amplify the current heat on Earth you’d need another nearby star, or the Sun would need to increase its output. I mean as conditions stand currently.
Magnification will only work via a lens if the source has the required power. Otherwise we’d be able to amplify the IR from ice and get it to heat objects.
Re Happer…I have changed my mind about him in a positive direction. I am making a new post and providing a link. Heck, I’ll post it here as well.
https://co2coalition.org/media/princeton-physicist-climate-change-is-not-a-problem-co2-a-good-thing/
When I put a sweater on there is no introduction of a new energy source, yet my skin gets warmer.
Why is this different to a thicker layer of GHGs? In both examples there is one energy source, which is required for the effect.
barry…”When I put a sweater on there is no introduction of a new energy source, yet my skin gets warmer”.
***
For the same reason the BP warms. Your body is continually supplying heat to your body by burning calories. Without the sweater, more heat can escape, so your body temperature drops. With the sweater, less heat escapes and your body warms due to the generation of internal energy. The heat is not coming from the sweater, it is coming from your body burning calories.
There comes a point, hypothermia, where adding the sweater will do nothing. Once your body temperature drops to a certain point, you simply cannot re-warm naturally. To re-warm someone in hypothermia, drastic measures are required.
BTW… one of the worst things you can wear if you’re in the bush is jeans. If you get into trouble, and the jeans get wet, you’re in trouble. Jeans are terrible for holding moisture and sapping valuable heat.
I read an article on that and the recommendation was to get out of the wind and find a place to minimize heat loss. The combination of wind and being wet can be deadly.
https://www.sciencenews.org/article/earth-inner-core-reverse-rotation
–By Nikk Ogasa
January 23, 2023 at 11:00 am
Our planet may have had a recent change of heart.
Earths inner core may have temporarily stopped rotating relative to the mantle and surface, researchers report in the January 23 Nature Geoscience. Now, the direction of the inner cores rotation may be reversing part of what could be a roughly 70-year-long cycle that may influence the length of Earths days and its magnetic field though some researchers are skeptical.
We see strong evidence that the inner core has been rotating faster than the surface, [but] by around 2009 it nearly stopped, says geophysicist Xiaodong Song of Peking University in Beijing. Now it is gradually mov[ing] in the opposite direction.–
linked from: https://instapundit.com/
Also new interview of Valentina Zharkova at her site:
https://solargsm.com/
I watched it a day or so, ago. Both were making me wonder about potential volcanic activity.
Generally it seems, we going thru a long period of “not much” geological activity. Long period = about century. And could continue for another century, but maybe, not.
Interesting stuff. Astrometeorologists have a 70 year cycle. (those that use astrology to predict the weather). Also there is some evidence of a physical 70 year climate cycle that affects the oceans or something is affecting the oceans that in turn affects the climate. The warming peak of 1944 comes 72 years before the record annual temperature coming off a super El Nino. Now we have scientists talking about a 70 year cycle for the molten metal core of the planet rotating at a different rate than the crust.
Add it all up and it would seem there is enough deep physical indication of changing magnetic fields for of such a cycle whatever the cause and people are struggling to match that signal up.
A lot of people believe magnets only work with iron. But thats not true it interacts at different levels of force with virtually everything. In the new century science has detected unprecedented changes in the earth’s magnetic relationship with the sun.
https://www.researchgate.net/publication/222817231_Are_there_connections_between_the_Earth's_magnetic_field_and_climate
In 2009 two solar scientists detected some magnetic weakening in the sun. Livingston and Penn noted that sunspots had a magnetic connection leading some speculation about an impending end to sun spots possibly in some way like noted in the Maunder Minimum. However after a while the magnetic activity returned to normal as solar cycle 24 progressed.
We have a lot to learn.
bill…the thing I enjoy so much is that we don’t have a clue what is going on in much of science. I have made a career based on electrons and no one has a clue what they are or how they work.
We have great theories for everything but I am beginning to wonder how much we really know when it comes right down to actuality.
The more I hang around in this life the more I learn I really don’t know what is going on. I sometimes wonder if there isn’t something weird and wonderful going on that we humans know nothing about.
It’s fun trying to work things out and trying to explain phenomena but I get it that we really don’t know a lot about anything. I would love to understand what an electron is and how it works. So simple, yet so elusive.
Thats the big prize! The Theory of Everything. The big and the small.
Just FYI – The German Die kalte Sonne site, and then later Klimanachrichten now presents its climate and energy news videos in English at its new YouTube channel: World Climate News.
World Climate News
https://www.youtube.com/watch?v=bBbMIbpj5Os
The Moon and GPE issues clearly prove the cult does not want to understand. They reject/twist/distort/pervert reality and science to protect their cult beliefs. There are example after example of their tricks.
Just recently I was trying to debunk the GPE nonsense for barry. I explained that in the perfect situation described, both plates would reach the same temperature and be emitting 200 W/m^2 to space. But barry couldn’t accept that because if didn’t help his GHE nonsense. So he claimed that more energy would be required for both plates to be emitting 200 W/m^2. I pointed out that with the two plates together, both would be emitting 200 W/m^2, and there was no additional energy needed. barry then “left the building”. He didn’t learn anything. He just went off with his same false beliefs.
I’ve been commenting here about 3 years now and not one of the cult has learned anything. Not one. I have shown, with simple physics problems, that NONE of them know anything about the subjects. They know NOTHING, and they can’t learn.
It turns out that photons and orbital motions are both obscure sciences. Very few people understand either, let alone both. The most common mistake people make with photons is believing that more photons mean higher temperature. That’s why the cult believes ice cubes can boil water. They won’t admit that, but that is exactly what their false science indicates.
The Moon issue has taught me a lot. If the cult does not want to change their beliefs, they won’t. They find ways to pervert reality to fit their beliefs. Just like the ball-on-a-string. The simple model clearly indicates an orbiting object that is not spinning will always keep the same side facing the inside of its orbit. But the cult either ignores or perverts the simple model.
We Skeptics add to the problem by not being organized. It’s a fact of nature that Skeptics do not organize well. We’re too independent. We think for ourselves. Trying to organize Skeptics is like trying to herd cats.
But a cult sticks together like glue.
Gordon Robertson
G = A/(1+AB)
where G = overall gain
A = gain of an amplifier
B = feedback percent.
“Yes, you can. When alarmists steal a definition of positive feedback from physics, that requires an amplifier to make the equation viable, then it is perfectly fine to call them on it.”
“I think we should be looking for the source of warming elsewhere. ”
“We Skeptics add to the problem by not being organized. Its a fact of nature that Skeptics do not organize well. Were too independent. We think for ourselves. Trying to organize Skeptics is like trying to herd cats.”
Interesting statements from your posts in recent days.
The Earth’s land, ocean and atmosphere are gaining heat.UAH shows atmospheric temperatures increasing by 0.13C/decade, Surface temperatures have increased by 1.2C since 1880 and are increasing by 0.2C/decade. Ocean heat content is increasing by 10^22 Joules/year.
Here is your opportunity to unite the sceptics.
Get together with other sceptics such as Richard Lindzen and Judith Curry.
Find a way of applying your gain formula to heat content. Identify the heat equivalents of G,A and B for the climate and show clearly that the current gain in heat content can be explained by an alternative to GHGs.
The sceptics won’t change the AGW paradigm by presenting lots of contradictory ideas. History shows that you overturn an existing paradigm by producing something better.
You have to unite behind one alternative paradigm and convince the rising generation of climate scientists that it is better than AGW.
Ent, I just explained that Skeptics are all individuals. So then you try to lump us all together.
You just can’t stand reality. You MUST pervert it. Just like you claim passenger jets fly backwards. You cult idiots try to murder reality.
Pup,
You’re a crank, not a skeptic.
When you’ll grow up you’ll become a real contrarian.
But for now you’re just a crank.
ent…”Find a way of applying your gain formula to heat content. Identify the heat equivalents of G,A and B for the climate and show clearly that the current gain in heat content can be explained by an alternative to GHGs”.
***
Fibber McGee!!! The A in G = A/(1 + AB) is an amplifier capable of increasing the input signal’s amplitude/power. There is nothing in the atmosphere capable of increasing heat. The only heat we get is induced by the Sun and you cannot increase that heat by recycling it.
Even an electronic amplifier cannot summon energy out of the blue. A transistor operates by using a small input signal to control a higher current produced by an external power supply.
You can’t get something for nothing, although you can use smoke and mirrors to make it appear as if you can.
For an understanding of the connection of temperature to photons, it’s necessary to understand temperature. What we measure as temperature is due to the kinetic energy of molecules. Within an object, or substance, the kinetic energy tends to equalize. That equalization represents a mean kinetic energy, with can be measured.
Molecules vibrate due to the frequency of the energy they contain. The higher the frequency, the higher the faster the vibration. The faster the vibration, the higher the kinetic energy. The higher the kinetic energy, the higher the temperature.
This is all well established, and fairly easy to understand.
For those that don’t understand physics, the problem arises when a photon with frequency F arrives the molecule that also has a frequency F. The cult believes the photon will be absorbed, increasing the frequency of the molecule. That violates 2LoT.
When a photon arrives a molecule with the same, or higher, frequency it gets reflected. When a photon arrives a molecule with lower frequency, it gets absorbed and the molecule vibrates with the new frequency.
In a nutshell, that is why ice cubes can NOT boil water.
Now, the cult will bring up microwave ovens and lasers. Microwave ovens and lasers are designed to do what nature can not do. Remember 2LoT contains the qualifier “by itself”. As in “Cold can not warm Hot, by itself. Microwave ovens and laser combine design and energy to do what nature can not do.
A simple analogy (because the cult hates simple) is a simple nail. A nail is used to hang something from a wall. So to hang something on the wall you must have a nail, a hammer, and know how to use the hammer. The nail does not go into the wall by itself. It requires intelligence and energy to install a nail. The cult would tend to believe that nails can pound themselves into a wall!
clint…”Molecules vibrate due to the frequency of the energy they contain. The higher the frequency, the higher the faster the vibration. The faster the vibration, the higher the kinetic energy. The higher the kinetic energy, the higher the temperature”.
***
Excellent point.
We still need a driver to make the molecules vibrate and Clausius claimed that driver is heat. That suggests, if we have a mass at temperature, T, we need another mass at temperature T’ > T to transfer heat to the mass.
Another way of saying that is this. Since heat is the kinetic energy of atoms, by definition, it is kinetic energy that is causing the vibrations. If you increase the KE, the atoms vibrated faster and have a higher frequency.
Another way of looking at it…if you remove the KE as heat, till the temperature drops to 0K, the atoms stop vibrating.
clint…”The nail does not go into the wall by itself. It requires intelligence and energy to install a nail”.
***
Don’t know about intelligence. Many a time I have whacked my fingers with a hammer while hammering a nail. Of course, I blame it on the hammer, or the nail. Or the picture.
Clint R
That sounds like a Claes Johnson point. Not valid science and mostly based upon his ignorance. All these Crackpots want to be the next Einstein. Rather than the rigor of science they come up with a bunch of bogus BS and act like experts in a field they have little knowledge of. To kick it off they are also extremely arrogant and will not listen to anyone who challenges their made up opinoins.
Big problem with your post and Claes Johnson view is that nearly all molecules are in ground zero vibrational state so nearly all surface molecules are able to absorb the incoming energy from external or internal sources. Also molecules do not remain in higher vibrational states very long before emitting a photon and moving to a lower energy state.
Since you asked:
https://chem.libretexts.org/Courses/University_of_California_Davis/UCD_Chem_110B%3A_Physical_Chemistry_II/Text/18%3A_Partition_Functions_and_Ideal_Gases/18.4%3A_Most_Molecules_Are_in_the_Ground_Vibrational_State_at_Room_Temperature
Clint R
Why ice cubes will not boil water but will add energy to a surface.
If and ice cube has a side that is 2″ square or one side is 25 cm^2
So one ice cube close to an one square meter surface, that has no other source of input energy other than the ice, will receive about 0.787 Watts from the ice. If you keep the ice at constant temperture it will keep adding energy to one square meter surface (insulated on back so only the surface receiving energy from ice will also be the emitter).
With one ice cube as the sole source of energy the 1 m^2 surface will reach a temperature of 61 Kelvin, that will be a steady state with the ice cube.
If you add another ice cube the 1 m^2 surface will receive 1.574 Watts from the two ice cubes and reach a higher temperature at 72.6 Kelvin.
Add 10 ice cubes for a total ice surface of 250 cm^2 or which would be 2.5% of the receiving surface area. The temperature goes up to 108 Kelvin. As you can see adding ice does increase the temperature of the receiving object. It will continue to increase in temperature until you have one square meter of ice at 0 C close to the receiving surface. Now the temperature of the receiving object will rise to that of the ice or 273 Kelvin.
Now the reason why your point is lame and considered very stupid by thoughtful people is because once you have a one square meter surface of ice the receiving object cannot receive any more energy from the ice. The view factor is one, the maximum. You can’t go past that. If you add 10,000 more squre meters of ice the one m^2 object cannot “see” this ice. It receives no energy from this ice.
You do not understand any of this though it has been explained to you. The sad thing is not that you don’t understand this explanation at all but you CAN’T understand it. You do not possess logical thinking that would allow your brain to process what I posted. I am sure any science minded poster grasps this, you can’t. You are a Flat-Earth mentality. Stuck in deep ravine of blind stupidity where you repeat your stupid ideas over an over and they bounce of the ravine walls back in your head. Over an over the same stupid points. L
Troll Norman, it’s always fun when you find another link you can’t understand. That link refers to diatomic molecules, not CO2, H2O, objects or substances. You don’t understand any of this.
Ice cubes can NOT boil water, but you believe fluxes simply add, which means ice cubes could boil water. You don’t understand your own cult nonsense.
You don’t seem to be able to understand ANYTHING.
Just keep trolling, that’s all you can do.
“Now the reason why your point is lame and considered very stupid by thoughtful people is because once you have a one square meter surface of ice the receiving object cannot receive any more energy from the ice. The view factor is one, the maximum. You can’t go past that. If you add 10,000 more squre meters of ice the one m^2 object cannot “see” this ice. It receives no energy from this ice.”
I’ve been trying to explain this to Clint but he just doesn’t get view factors.
Clint R
https://climaterx.wordpress.com/2013/04/10/thermal-behavior-of-co2/
About 8% of CO2 molecules are in excited vibrational states at 300 K
Now what do you say?
Trolls barry and Norman, fluxes ARRIVING at a surface are NOT affected by view factors. View factors have already been taken into account. What ARRIVES is what arrives. Neither of you understands ANY of this.
Your false beliefs mean that ice cubes can boil water. And Norman believes all molecules are diatomic. Idiots.
That’s why this is so much fun .
Clint R
Are you really this illogical? What arrives is what can arrive. I have demonstrated exactly how the energy of ice adds with each ice cube added increasing temperature until the surface can receive no more energy (surrounded view factor of one). How much do I have to dumb down my posts before that light turns on in your very dim brain? You are really stupid and what is sad you are unable to see it.
Wrong troll Norman.
Your cult says that fluxes simply add. So two fluxes, 315 W/m^2 each, would result in a surface emitting 630 W/m^2, by your cult’s own belief. That violates 2LoT, and would lead to ice cubes being able to boil water.
You don’t understand your own cult’s nonsense.
Find some more links you can’t understand….
Clint R
The problem is not with science (that you falsely call a cult…you do not know the meaning of cult) the real problem is with you and your lack of reasoning ability. I think when Barry posts to you he does not grasp how little rational thought you are able to generate.
Two fluxes add their energy at a surface. Ice can only add 315 watts to a 1 m^2 surface regardless of how much ice you have. You can’t understand view factors. You are not rational. Your posts are stupid and demonstrate a total lack of any thinking ability. You can’t see it but you are an idiot incapable of understanding.
Troll Norman, believing nonsense that results in ice cubes boiling water is NOT facing reality. And not accepting reality is NOT logical.
Your cult says that fluxes simply add. So two fluxes, 315 W/m^2 each, would result in a surface emitting 630 W/m^2, by your cult’s own belief. That violates 2LoT, and would lead to ice cubes being able to boil water.
Clint R
You are a complete idiot.
Glad to see you’ve taken my advice Norman:
You don’t seem to be able to understand ANYTHING.
Just keep trolling, that’s all you can do.
I think you’ve be much happier. Trying to fake it makes you so frustrated.
“Just recently I was trying to debunk the GPE nonsense for barry. I explained that in the perfect situation described, both plates would reach the same temperature and be emitting 200 W/m^2 to space. But barry couldnt accept that because if didn’t help his GHE nonsense.”
How about being honest and laying pout the point I made?
Which is that BPO receives 400 W/m2 from the sun, and GP receives 200 W/m2 from BP.
How on Earth can both plates be at the same temperature when one receives radiation at half the rate the other one does?
You did not explain that. You can’t.
“So he claimed that more energy would be required for both plates to be emitting 200 W/m^2. I pointed out that with the two plates together, both would be emitting 200 W/m^2, and there was no additional energy needed.”
Both plates together do not emit from both sides any more, only from one side each.
You’ve essentially removed the GP and now have one plate.
In order to refute the model you’ve changed the model. Doesn’t work like that, Clint.
But please explain how a plate receiving 200 W/m2 gets as warm as a plate receiving 400 W/m2.
I don’t think you’re even going to answer that.
“Both plates together do not emit from both sides any more, only from one side each.
That’s your false beliefs again, troll barry. You don’t understand any of this and you can’t learn. You’re a braindead cult idiot posing as an anonymous troll.
What happens if this year has no El Nino?
IOCAS ICM seems to think it will be so.
https://iri.columbia.edu/our-expertise/climate/forecasts/enso/current/?enso_tab=enso-sst_table
It will be another cold, miserable year here in Vancouver, Canada. Also, wet.
ps. Of course, they alarmists will blame it on climate change.
Entropic man January 23 at 5:14 PM
I find the approach shown below more intuitive. What do you think?
Let:
g=[overall] gain= ΔT_total/ΔT_0
f= feedback=ΔT_feedback/ΔT_total
ΔT_total= ΔT_feedback + ΔT_0
Where:
ΔT_total= global mean surface temperature change as a result of a radiative forcing.
ΔT_feedback= the net feedback portion of the temperature change.
ΔT_0= reference temperature change, i.e. of the system without feedbacks.
Combining the three eqs. together we get:
g=1/(1-f).
Sense check:
If f<0 then g decreases because of negative feedback.
If f=0 you get the reference system.
If 0<f1 you get a physically unrealistic (impossible?) g.
The case for f=0 has been colloquially referred to as a tipping point, but its more nuanced than that.
Edit:
If 0<f<1 then g increases due to positive feedback.
The case for f=1 has been colloquially referred to as a tipping point, but its more nuanced than that.
The general formula g=1/1-f works for any feedback system. I think you’ll find it in control theory and in biological studies of homeostasis.
The more detailed form
ΔT_total/ΔT_0 = 1/1-ΔT_feedback/ΔT_total
looks incomplete.
Put in some numbers for the 1.2C warming since 1880.
289.2/288=1/1-(0.0041/288)
or 1.0041 = 1/1-(0.0041/288
See the problems?
1)The gain is the new temperature as a multiple of the old temperature.
We might fix that.
ΔT_total/ΔT_0 -1 = 1/1-ΔT_feedback/ΔT_total
Now the gain is the fraction added to the original temperature.
2) ∆T feedback becomes the total forcing as a fraction of the original temperature. We distinguish between forcings and feedbacks. Forcing being externally induced changes in net energy flow (eg. Increased CO2) and feedbacks being internal responses which amplify or damp the forcing.(eg. increased water vapour.
We need to separate the external forcing from the feedbacks.
ΔT_total/∆T_0 -1 = 1/1-(∆T_forcing + ΔT_feedback)/ΔT_total
It still needs further work. Some ∆Ts are temperatures and others are dimensionless changes as fractions of original temperatures.
( I just re-read this and I think I’ve made several logical mistakes. Nevertheless, as we/re brainstorming I thought I’d put it up for you to critique.
EM,
First, I hadn’t intended to include forcings in the eqs. since it’s hard enough to quantify feedbacks and gains already.
Second, by using deltas (Δ) I wanted to simplify the task of selecting inputs. So for example if we say ∆T_0=1.2C as you say, and then say ΔT_total= 3C (climate sensitivity to doubling of CO2), we could estimate the feedback parameter as f=0.6.
Lastly, yes I think this form of the gain equation came from the field of biology. I’ve also read recently that James Croll was the first to introduce the concept of climate feedbacks in a paper titled “On the Physical Cause of the Change of Climate during Geological Epochs” from 1864. Arrhenius, of course, followed in 1896 with his calculations of the water vapor feedback.
With all your two’s brilliant work, maybe you can tell us what the temperature will be in August 2028? we’d very much like to know.
ent…”The general formula g=1/1-f works for any feedback system. I think youll find it in control theory and in biological studies of homeostasis”.
***
g=1/(1-f) will not produce a feedback. It is strictly an attenutator since you have no means of amplification. What you have is a negative feedback only. There is no way to make (1 – f) > 0 without an amplifier.
We need to back up here. Control theory in electronics does not involve an amplification factor. In fact, there is no gain stage in your equation. You could never get a runaway effect using control theory.
Here’s the reason. Feedback in a control circuit is strictly based on the sign of the voltage. If amplification is used it is simply to make up for losses over copper conductors. If you are trying to control the speed of a motor, you would use a tachometer to monitor the speed of the output shaft. The tach would have a means of sending an error signal based on how much the output shaft RPM varied from a desired RPM.
At the motor driver side, you’d have a voltage or current controller that could reduce or increase the current to the motor. Increasing the current increases the RPM and vice versa. If the tach is set to deliver a positive voltage when the RPM is too high, the error is sent back to the motor controller and it reduces the motor current accordingly. If the RPM is too low, it send a negative voltage whose amplitude indicates how much the RPM is too low.
A control circuit does not represent the type of feedback claimed by Hansen when he talked about a runaway greenhouse effect. He was talking strictly about feedback with gain and there is no gain in a control circuit.
You need an amplifier to get a runaway-inducing feedback.
sorry..brain fog.
“There is no way to make (1 f) > 0 without an amplifier”.
Should read…”There is no way to make (1 f) < 0 without an amplifier".
In G = A/(1 + AB), we have to be careful. For the longest time, I thought it was the sign of B, the feedback, that affected (1 – AB), but that was wrong. I was simply not thinking clearly. In an amplifier, B is an alternating current and has no sign. It does have a phase difference relative to the input signal, however, and that makes the difference as to whether it will be added or subtracted from the input signal.
The determination of the phase of B is made in the mixer that mixes the feedback signal with the input signal. In the mixer, the signal is multiplied by -1. Therefore, the value AB is determined in the mixer.
You simply cannot arbitrarily use an expression like (1 – f) and apply it as a positive feedback in the atmosphere. There is no PF in the atmosphere that affects heat gain. In fact, there is no heat gain amplifier.
The dog at my minus signs for 1 – f.
ent…”ΔT_feedback= the net feedback portion of the temperature change”.
***
Can you explain how that works, to get heat out of nothing? We only get so much heat induced by the Sun, how can you recycle heat via a feedback to increase the heat quantity?
In an electronic amplifier, the gain in current/power between input and output is due to extra current supplied by a power supply on the output side of a transistor. The transistor does not magically manufacture current inside the transistor it simply provides an impedance match between input and output that causes more current to flow in the output circuit than in the input circuit.
When you use a positive feedback signal, you sample the output and feed it back to the input in phase with the input signal. Therefore, during each amplification cycle, the feedback signal increases and the amplification becomes exponential in nature.
The signal can only increase till no more current can be supplied by the power supply. That’s the limiting factor. How could such a runaway amplification work in the atmosphere? There is only so much heat induced by the Sun, so how can you exceed that amount?
I have a question concerning “heat trapping gasses”. For the sake of argument (none of that here) let’s assume the earth has warmed 1 deg. C. How much heat is that? For perspective, how many hours of sunlight have been “trapped” in 40 years?
Most of it (over 90%) goes into the oceans.
https://www.climate.gov/news-features/blogs/enso/role-ocean-tempering-global-warming
It’s far more complicated than that. The Arctic and Antarctic see little or no Sun for most of the year. Meantime the Tropics get most of it.
Although most of the heating may go into the oceans, that heating is temporary. Furthermore, most of it goes into the tropical oceans from where it needs to be redistributed.
And, how much of that warming is actually a re-warming from the LIA? Once glaciers and surface ice grow during a mini ice age, its takes a long time and a lot of heat to melt the ice. That’s especially true when the ice gets replaced each winter to various degrees, depending on location.
There is a glacier on Everest around 18,000 feet called the Khumbu glacier. There’s no sign of it disappearing since it is constantly fed from the Western Cwm above it. Furthermore, temperatures at that altitude year round are around 0C, or less.
Talking about the Tropics, here is UAHs current view
https://climatedatablog.files.wordpress.com/2023/01/uah-tropics.jpeg
This is the one I like…
https://www.nsstc.uah.edu/climate/
I realize the white regions indicating no warming are not representative of warming over 40 years, but just one month.
However, each time I have looked at a UAH contour map, most of the Tropics have been white. If you take that back to 1978, does it not suggest the white regions represent no warming? I am not talking of the Tropics overall per se, I am talking about the spaces between 23.5 N and 23.5 S that have remained white.
Don’t know if any area has remained white.
Is it possible that some parts of the planet have not warmed at all the past 40+ years?
“Is it possible that some parts of the planet have not warmed at all the past 40+ years?”
Yes, there is a section of the Northern Atlantic Ocean that shows no warming or even cooling over the last 40 or 50 years.
Parts of the Antarctic also show no warming over a similar period, and according to UAH the Ocean South of 60S has not warmed.
On the other hand –
“Summary. Oceanic hotspots are the surface expression of rising mantle plumes from the Earth’s interior and are responsible for much of the intraplate volcanism observed in the ocean basins.”
And the hotspots wander chaotically.
I suppose some SkyDragon cultists will claim that “climate scientists” adjust temperatures to get rid of these natural variations?
How would they do that?
More than 90% of warming is warming our cold ocean which has average temperature of about 3.5 C.
No one thinks the ocean has warmed as much as .1 C, so for upper limit you can assume .1 C
It’s a lot heat- millions of nuclear bombs worth.
Or 100 times more than 1 C increase in atmosphere temperature.
Or per C, ocean is 1000 times more.
If ocean warmed by 1 C, it’s the CAWG- meter rise in Sea Level, 3 to 4 C in global air temperature.
A nicer world, and still in an Ice Age.
gb,
When water heats, it floats to the top, and at night it cools.
No heat accumulation or storage.
All nonsense and SkyDragon fantasy.
Heat is one of the only energies coming to mind that can dissipate without being converted to another form of energy. It belies the conservation of energy postulate.
Heat can simply disappear in a gas if the pressure is allowed to abate to zero.
“Heat can simply disappear in a gas if the pressure is allowed to abate to zero.”
Heat and cold “disappears” the vacuum of space has no temperature.
Mars air has no temperature and it’s not that close the zero- it’s got an atmosphere with mass of 25 trillion tons. But similar to the Moon which atmosphere is… about 100,000 kg??
And since Earth is cold, Moon and Mars are warmer, despite both having a much lower average temperature.
At least for humans, but a robot which is as active as a human, would need a cooling mechanisms on Mars or Moon [as do humans}.
Gordon, I think you are describing the Joule-Thomson effect. It does not violate the #1 law. In those processes where a temperature effect is observed, the lose in temperature is related to work being done on the surroundings by the gas. This is also covered by the #2 law which some of you seem to not understand, and the # 3 law.
https://en.wikipedia.org/wiki/Joule%E2%80%93Thomson_effect
tim s…I’m actually talking about a parcel of air rising into the atmosphere from the surface. It rises because it has a lower density than the air above it.
As it rises, higher and higher, it moves through layers of air that is constantly decreasing in density. Therefore the air expands more. As it expands, it loses heat naturally.
The point is, the heat does not need to convert to another form of energy, simply allowing it to expand cools it. I can’t think of another form of energy where that applies.
If the atmosphere was not graded by gravity into a negative pressure gradient, I doubt that would apply.
Gordon, and that is where the #2 law fails to model the atmosphere completely. The greenhouse gases radiating to outer space cool the upper atmosphere. It is the same process as the back radiation that slows the cooling of the surface. The radiation is omnidirectional. It is basic physics.
I need to clarify that the energy in the form of heat (Enthalpy) is not “lost” during expansion. It is converted to work. An expanding gas is doing work on the surroundings.
“As it rises, higher and higher, it moves through layers of air that is constantly decreasing in density. Therefore the air expands more. As it expands, it loses heat naturally. ”
No! Expansion during convection does not cause heat to be lost.
The heat content of a parcel of air is calculated by
E=nRT
E is the heat content.
n is the quantity of gas in moles or kilograms.
R is the gas constant.
T is the temperature.
This equation is also part of the Ideal Gas Law.
PV=nRT or PV/T=nR
This an equation of state, or an equilibrium. For a given mass of dry air the heat content remains constant, though the combination of P,V and T may change.
Consider a parcel of dry air convecting. It starts as a bubble of air warmed by the surface. The heat content is nRT at the initial pressure and initial volume.
The parcel starts to convect. As it rises pressure decreases, volume increases and temperature decreases.
nR remains constant and PV/T remains constant as the parcel of air rises from the surface to the tropopause at 10km.
The pressure drops from 1013mb to 260mb. The temperature drops from 288K to 223I and the volume increases threefold. PV/T remains constant and nR remains constant.
The heat content is unchanged.
EM,
A parcel of air, if hotter than its surrounding environment, will lose energy, and cool.
SkyDragon cultists have some odd ideas. They believe, for example, that matter can somehow “accumulate” heat, or energy, or something, without becoming hotter than its surroundings.
Or, if it does become hotter, it somehow loses the ability to radiate the excess energy away, and cool. These dimwits believe that the Earth is currently being continuously by some magical principle, but stubbornly refuses to cool at night, during winter, and so on.
All completely nonsensical, of course, as four and a half billion years of history shows – or every night, if you find four and a half billion years a bit much to cope with.
By the way, a parcel of warm air at the surface will not necessarily rise, regardless of what your imagination tells you. A stiflingly hot tropical day, with no wind at all, is an example. A high pressure zone suppresses convection, as density is greatest at the base of the air column – so is temperature.
Maybe you should try for a better means of diverting attention from the fact that you can’t even describe the wondrous GHE, let alone explain which laws of physics have changed to give CO2 magical heating properties recently.
Go on, when did this CO2 induced “global warming” start? Don’t know, do you?
What a delusional SkyDragon you are!
— Swenson says:
January 25, 2023 at 5:57 PM
gb,
When water heats, it floats to the top, and at night it cools.–
And surface water cools and becomes denser and falls, being replaced less dense warmer water.
Water is constantly evaporating and condensing, when it imbalanced,
it cools by evaporation heat loss.
Due to high tropical ocean surface temperature and rest of world’s cold dry air, there difference in water vapor pressure- which is the tropical ocean heat engine.
Without this, the heat in tropics would be far more limited to the tropics.
Such warming of the rest of the world is a greenhouse effect.
Water [and ice] is constantly evaporating, the warmer it is, the higher the pressure of evaporation.
A square km of warm water has enormous amount of force.
tim s…”Gordon, and that is where the #2 law fails to model the atmosphere completely. The greenhouse gases radiating to outer space cool the upper atmosphere. It is the same process as the back radiation that slows the cooling of the surface. The radiation is omnidirectional. It is basic physics”.
***
There is no scientific proof that GHGs radiating to space cool the upper atmosphere. It is presumed to be the case based on the theory that energy in must equal energy out. That goes back to modelling theory, which, of necessity, features only radiation theory. The presumption is that only radiation can cool the atmosphere therefore it must be CO2 and WV doing the warming/cooling.
That is not good enough science for me. We simply don’t know enough about nitrogen and oxygen, that make up 99% of the atmosphere. We know that oxygen radiates in the microwave band and there is evidence that nitrogen is radiating in the infrared band but, overall, not enough is known about it because everyone has a fetish for CO2.
Besides, you’d have a hard time proving your theory since gravity causes cooling in the entire atmosphere. Your theory is a basis of the AGW theory and it’s nothing more than theory. AGW theory has corrupted the fact that gravity orders the atmosphere as a negative pressure gradient and that results in a negative temperature gradient. AGW theory insists that the negative PT gradient is caused by temperatures reducing as air rises, which is nonsense.
At best, CO2 absorbs no more than 5% of surface radiation, meaning 95% of surface radiation bypasses CO2. The notion that a trace gas is responsible for heating or cooling the atmosphere is absurd.
R.W. Wood, an expert on gases like CO2, claimed in 1909 that he could not see how CO2 could warm the atmosphere. He based that on the GHE theory that a greenhouse warms due to trapped infrared because the glass blocks IR from escaping. No explanation has ever been offered as to why blocked infrared should warm a greenhouse. The notion is absurd.
Wood went on to prove, via experiment, that a greenhouse warms due to blocked convection. Pratt tried to repeat the experiment but committed a grievous error. He substituted plastic wrap for glass. Nahle also repeated the experiment in great detail and got the same result as Wood.
Wood went on to hypothesize that the major gases, N2/O2, are heated by direct contact with the surface, then rise. Because they cannot emit radiation at terrestrial temperatures, they retain the heat for lengthy periods of time. That explains the GHE better than CO2 and it also offers insight into why heat islands are warming the atmosphere around major cities.
https://en.wikipedia.org/wiki/Vapour_pressure_of_water
This chart indicate at 0 C : 0.0060 atm
1 atm = about 10,000 kg per square meter
0.0060 times 10,000 = 60 kg per square or in terms lbs x 2.2 =
132 lb per square meter. In terms psi, atm = 14.7 psi x 0.0060 =
0.0882 psi. Or 1 sq meter there are 1550 square inches: 132/1550 =
0.08516129 psi [sloppy conversion numbers, but roughly].
0 C : 0.0060 atm
10 C: 0.0121 atm
30 C: 0.0419 atm
So, if have lake on Mars with 10 C water, it going to have pressure
and going to evaporate.
“At ground level the Martian atmosphere has a pressure of 6.518 millibars or 0.095 psi”
“The average surface pressure is only about 610 pascals (0.088 psi) which is less than 1% of the Earth’s value.”
And pressure about partial pressure of water vapor [not CO2].
So Mars dry with only 210 ppm of water vapor, and Earth the water planet never get this dry, but the cold bare dry deserts of Antarctica can get fairly dry.
Anyhow if have lake, it will wetter above the lake- could be say 500 ppm of water vapor, but even if has 500 ppm [or more] it will still
have that pressure, [0.0121 atm or 0.17787 psi of pressure, but amount evaporates will be less, if air is wetter.
So make a lake and it snows around like and snow being colder evaporates slower- or snow could be say -30 C and further away from
lake having colder snow.
The practical purpose of making a lake is it make land in and around the lake more valuable.
So, rather than wasting water, having land with snow on it, is more valuable than land without snow on it.
And seems more practical than land with lawns in it. And from orbit it should be easy to see.
tim s…”I need to clarify that the energy in the form of heat (Enthalpy) is not lost during expansion. It is converted to work. An expanding gas is doing work on the surroundings”.
***
Tim…glad you raised the issue, I had to dig deep and push myself beyond my understanding of why heated air rises. I don’t profess to be an expert on such matters just a curious student of science.
I had to ask myself, how can air that is not contained in a container do work on air? In general, can air do work on a non-solid surface like air, or another gas? Seems to me that pressure is defined based on a gas acting on a solid surface.
Work is a force over a distance. Force, of course, wrt to a gas in a container, is the force an air molecule exerts on the container wall. Pressure is the sum of all the molecular forces on the container walls. Because a gas under pressure has the molecules in closer proximity, there are more collisions per second, therefore the temperature increases.
Put away your definitions for a moment and try to visualize this. You have a container containing a gas under pressure and at higher temperature than air outside the container. Suddenly you make the walls disappear. A solid surface was holding back the molecules but suddenly it’s not there. What do the molecules formerly under pressure see?
They would essentially see nothing but individual molecules formerly outside the container. The distances between them are immense compared to the diameter of each molecule, and although there would be collisions between the expanding molecules and the cooler ones outside the former walls, what work would be done and on what surface? I claim any work done would be insignificant and very temporary.
If you put a solid surface outside the former walls, like the surface of a wind turbine, the expanding gas would definitely do work on that surface, maybe even turn it. I just don’t see the expanding molecules doing significant work on molecules formerly outside the container walls.
Depending on the pressure difference, you may get a brief out-rush of air during which each air molecule can exert a force on another air molecule. With the walls no longer containing them, how long can each molecule do work on molecules that were outside the wall? I suggest that equilibrium will be reached very quickly.
Now consider the case where air is rising from a heated surface, where 99% of the molecules are N2 and O2. N2 and O2 cannot radiate heat away at terrestrial temperatures, although I question that theory. The explanation for rising air is that the heated air expands therefore is less dense. That suggests it is more buoyant therefore essentially floats through the cooler, more dense air above.
This explanation from NOAA offered a deeper understanding. It’s not just that heating air causes it to rise, it’s the fact that cooler, more dense air from above gets under the heated air, due to gravity, and forces it upward. I take that to mean the heated air is more energetic and able to work against gravity, therefore it pushes upward as a parcel of air and cooler air gets under it.
https://www.weather.gov/jetstream/parcels
That also explains the convection which we experience as breezes on a warm day.
As they explain in the article, the rising air parcel cools at 9.8C/1000 metres. That suggests that by the time an air parcel reaches the peak of Everest at over 8000 m, it should cool by about 78C. They do point out in the article that the cooling is a ROT, not an absolute value. It depends a lot on the air humidity.
Still it is apparent that the cooling is due to a reduction in air pressure and nothing to do with work. Again, if you visualize it, air molecules are spreading out with increasing altitude and that translates directly to a natural reduction in both pressure and heat.
“A parcel of air, if hotter than its surrounding environment, will lose energy, and cool. ”
Yes, by conduction of heat and by radiation a parcel of air may export energy to other regions.
I’m talking specifically about Gordon Robertson’s odd idea that a parcel of air which convects will have less energy afterwards due to internal heat loss.
ent…”Im talking specifically about Gordon Robertsons odd idea that a parcel of air which convects will have less energy afterwards due to internal heat loss”.
***
You don’t seem to understand what heat is. It is the kinetic energy of atoms. If you have a whole lot of atoms crammed into a smaller space, they interact and the temperature rises. Conversely, if you allow the volume to expand to a much larger size, the atoms spread out and the temperature drops.
That’s the basic reason why temperature declines with altitude and decreasing pressure.
The same applies to an air conditioner. If you take a low pressure gas that is in a container in a colder region and you draw the air into a compressor and compress the gas, it become a high pressure, high temperature liquid. If you run the liquid through a radiator exposed to the atmosphere, the high temperature is dissipated to the atmosphere leaving you with a high pressure, low temperature liquid.
The hi-P, low-T liquid is exposed to an expansion valve where the pressure is released and the liquid is aerated back to a lo-p, lo-T gas and the cycle repeats.
You don’t need an external power source in the atmosphere because gravity reduces air pressure naturally and the temperature follows.
You keep talking about dissipation of heat.
This does not happen once convection has begun.
Convection is adiabatic. Adiabatic processes take place in effective isolation, with no exchange of energy between the thermodynamic system and it’s surroundings. Thus a parcel of air of a given mass obeys the Ideal Gas law and arrives at the tropopause carrying the same amount of energy it carried when it lifted off the surface.
ent…”You keep talking about dissipation of heat.
This does not happen once convection has begun.
Convection is adiabatic. Adiabatic processes take place in effective isolation, with no exchange of energy between the thermodynamic system and its surroundings”.
***
So you are suggesting the atmosphere is an adiabatic process??? An adiabatic process requires insulated walls, or at least, walls that resist the flow of heat through them. How does air form in a column and how do you make that column so it cannot allow heat to enter or leave?
Convection is not adiabatic. a rising air parcel loses heat as it rises. Heated air has particles that are more energetic and they move generally laterally and upward. No way to contain them to produce an adiabatic situation.
Adiabatic means essentially ‘occurring without a loss or gain of heat’. However, as air expands it must lose heat. Therefore, the use of adiabatic as applied to the atmosphere is used incorrectly.
The lapse rate in the atmosphere is 9,8C/1000 metres. How then can a heated air parcel rise without cooling? With a ot air balloon, you need a heat source to keep the air warm. If the heat source is turned off, the balloon will descend rapidly.
ent…”Im talking specifically about Gordon Robertsons odd idea that a parcel of air which convects will have less energy afterwards due to internal heat loss”.
***
GR did not say that. HRH only said that as a heated air parcel rises into less dense air it expands and cools naturally.
I think it is worth pointing out that rising air somewhere is balanced by air falling elsewhere.
the point Barry is the all CONUS stations posted by Bindidon here:
https://drive.google.com/file/d/1pbQCHFwTTy1HIns9pDNj6mDQ85Vau7NC/view
only shows a very nominal amount of warming in the last 90 years.
Bindidon describes that graph as the difference between the surfacestations 71 best-sited stations and the CONUS stations using USHCN Daily data, which is unadjusted.
The result is that the best-sited stations according to surfacestations have a higher warming trend than all stations in CONUS.
The “nominal amount of warming” occurs in the data that is contaminated with lots and lots of badly sited weather stations.
Bindidon’s original point was – what UHI is present if the best-sited station according to surfacestations have a warmer trend than all stations?
Exactly, barry.
A tiny correction: … the CONUS stations using GHCN Daily data. I didn’t use the USHCN data set, only the USHCN stations in GHCN daily.
*
And
” Bindidon’s original point was what UHI is present if the best-sited station according to surfacestations have a warmer trend than all stations? ”
is 100 % correct.
*
My remark about the best sited USHCN stations versus the rest is by the way confirmed by the fact that a comparison of the most pristine stations in the US (the USCRN stations) to all GHCN stations located in the same 1 grid cell shows a very similar result:
https://drive.google.com/file/d/1TMOQUj5OxTHktCJpINMpVbgam4z9E5TA/view
When you consider TMIN only, you obtain this:
https://drive.google.com/file/d/1RGwr8nFzrsodYvhvJgamXAhcOd3KnN3o/view
But the higher trend for the 828 stations around the USCRN locations seems to be due more to lower values at the beginning of the series.
Finally, TMAX:
https://drive.google.com/file/d/1qaU581pPZi9QPmQmrLYHxQCE0gx5aqPV/view
*
Funny is that the reason for having excluded, out of originally 920 stations near the USCRN locations, those within airports, was that their trend in the spreadsheet was a lot higher than the rest and hence would distort the comparison.
But… a look today at the graph comparing the 92 airport stations to the 133 USCRN stations was really surprising:
https://drive.google.com/file/d/1_ks_hrM8XR8JKDU2pfVoy2JYWx1IPnoj/view
Here too, we see when looking at the filter smoothing that the trend difference is concentrated on the beginning of the chart.
*
It is evident: we observe here less than 20 years.
But nonetheless I would have expected a much higher UHI impact for the stations around the USCRN locations: because their selection was due only to their location within a 1 degree grid cell, without taking anything else into account.
It’s of course correct to say that UHI happens during the night; but this is no reason not to consider the whole picture.
barry
Moreover, I’m always wondering about these people here who think it’s enough to look at the US (tiny 6 % of Earth’s land surface) to obtain a picture of the global warming.
So what.
Or Europe for that matter
Yurop? Whas’ that? C’n I eat it?
https://drive.google.com/file/d/1Si1bNPeiJ_QGZ2Zr0fsurKeflCCQBht_/view
How to see the difference between Conterminus US and the rest of the world
A comparison of some terrestrial regions, using a slight extension of an idea of John Christy, based on the maximum/minimum measurements recorded during a given period by all stations active during that period.
1. CONUS
https://drive.google.com/file/d/1xN-DgoLq29rsYsxR4BlR9cJdjtgxs_sZ/view
2. Globe
https://drive.google.com/file/d/1veLI9gYJCDEWvyhux5zF0BfBaBHhoa6-/view
3. Europe
https://drive.google.com/file/d/1p1mkPAzR9xGu6ebT1izETC4ues181mrB/view
Addendum
” by all stations active during that period ”
means all stations active during the entire period, and not simply those which were active during some part of that period.
Otherwise the comparison is automatically flawed.
And the total results of this is quite nominal warming over the past 90 years. Thank you Bindidon.
Maybe the Hunter boy looks at what happens since the 1980s.
Indeed we can see a repeat of historical patterns. One can see such a period in the early parts of both the 18th and 19th centuries as well as the early part of the 20th century. Natural climate change so far has not be differentiated from anthropogenic climate change and anthropogenic science quality control.
And of course you need to balance that cherry picked period with other cherry picked periods to determine if your cherry picking might be uh deceptive.
So while looking at 1980 to present you should compare that to 1935 to 1980 and to the period leading up to 1935. And what do you discover? You discover that cherry picking can produce some odd results. Peak to peak analysis isn’t cherry picked because the peaks are in the data. I don’t have your raw data but it does appear if you do a full record trend you might be spanning a valley to a peak which is something else you would like to avoid when accessing a causation that has greatly accelerated toward the end of the record. In other words if you are looking for the maximum trend in the data and fail to note that such trends exist naturally in the data then you are a piss poor analyst, period.
Should we be concerned about warming since 1980. Certainly. But the concern should be focused on actually finding the causes of natural climate change before comparing it to our worst nightmare. The latter is what stupid people do.
And none of the above is meant as an insult. Like all motions being perturbed in the real world everybody does stupid stuff from time to time. Some evil people do what is stupid for their own benefit in a calculating manner.
Some good people make mistakes and do stupid stuff. When they learn they can chalk it up to their ignorance or lack of experience rather than stupidity because stupidity is the lack of ability to learn. Ignorance is merely not having learned and every single one of us started out as ignorant.
I was critical in a reply to Ken about Will Happer. After watching an interview with him in the link below I have changed my mind in a positive direction. Happer is well-spoken and well-informed. Furthermore, he has a physics back-ground related to the atmosphere that bests climate alarmists of the day.
I think it is possible to be overly critical by nit-picking points made by a person while missing the overall message of the person. Whereas I was critical of Fred Singer for mindlessly knocking skeptics voicing opinions on the 2nd law, I never lost my support for him overall.
Although I was happy to see Trump defeat Hillary Clinton, I never really understood what he was up against. Happer set the record straight without being political.
https://co2coalition.org/media/princeton-physicist-climate-change-is-not-a-problem-co2-a-good-thing/
Yes. But virtue of the fact that William Happer is the recognized inventor of the sodium guidestar he is likely the only one of the whole bunch of copycat climate scientists that have actually discovered something about the interaction of light and the atmosphere.
His invention was not revealed until another had discovered years later and his classified invention was declassified as a result of a subsequent discovery.
Another strong wave in the upper stratosphere and a spike in temperature.
Earlier, gb wrote –
“Water is constantly evaporating and condensing, when it imbalanced,
it cools by evaporation heat loss.”
That’s the 19th century terminology.
Briefly, electrons emit protons, resulting in matter having less internal energy – actually, less mass, believe it or not, even though photons have no rest mass at all. This is perceived as a lowering of temperature.
The concept of heat being some type of fluid transferred from body to body, or moving within a body, persisted until the late 19th century as caloric theory.
Water, like everything else, cools if allowed to do so. No greenhouse effect. Just nature doing her thing.
swenson…”electrons emit protons, resulting in matter having less internal energy actually, less mass…”
***
I know you meant that electrons emit photons, not protons.
With regard to a reduction in mass, I know that is claimed by Einsteinians, but I’d like to see the proof that an electron loses mass each time it emits a photon of EM. That would imply that an electron has a variable mass and electron mass is usually stated as a constant.
Of course, I visualize an electron as a tiny particle with mass carrying a negative electric charge. That model could be completely wrong but it’s better than the non-model related to e = mc^2 which was proposed initially before electrons were discovered. Einstein picked up on the theory and produced e = mc^2 before he was aware of electrons and their relationship to EM, as far as I know.
Einstein produced e = mc^2 in 1905, about 7 years after the electron was discovered and 8 years before Bohr produced his quantum theory relating electrons to EM. He must have been aware of the electron because he produced his theory of photo-emissivity around the same time.
” Gordon Robertson says:
January 26, 2023 at 5:57 PM
swensonelectrons emit protons, resulting in matter having less internal energy actually, less mass
***
I know you meant that electrons emit photons, not protons.
With regard to a reduction in mass, I know that is claimed by Einsteinians, but Id like to see the proof that an electron loses mass each time it emits a photon of EM. That would imply that an electron has a variable mass and electron mass is usually stated as a constant.”
And I am talking about evaporation which H20 molecules.
And mass reduction is nuclear reaction- Ie, fusion or fission.
photons are very close to mass less [if not mass less} just round it it off and count it as mass less- especially because Earth is in Ice Age and is it bloody cold.
gb, Gordon,
Sorry – yes, I meant photons not protons.
As to mass increase, if e=mc2 (and it seems to be so), then yes, when an electron absorbs a photon, its mass increases – by a very, very, small amount. And of course, when an electron emits a photon (possibly a photon of the same energy it absorbed, but probably not – the remaining momentum imparted to the atom “owning” the electron), the a mass decrease takes place.
However, when lots of electrons are emitting lots of photons, as in just a few tens of tonnes of matter within the Earth being converted directly or indirectly into photons of varying energies per year, about 47 TW of power results.
The flame from a candle, the heat generated in your body – all come back to e=mc2.
According to NASA, sunlight increases the Earth’s mass at about 1.9 kg/sec, but of course the Earth reduces its mass by slightly more than this each night. Atmospheric escape results in the Earth losing thousands of tonnes per year – and gaining thousands of tonnes per year from space dust!
That’s a real energy balance – not the fake “energy balance” used by SkyDragons to “prove” the Earth has become hotter since it had a molten surface!
End of digression. Apart from me, who cares?
[laughing at self]
“According to NASA, sunlight increases the Earth’s mass at about 1.9 kg/sec, but of course the Earth reduces its mass by slightly more than this each night.”
This is a cherry-picked obfuscation!
What NASA really says:
“The problem is that the earth is in thermal equilibrium with the sun at this distance”
Earth is radioactive and started very hot. Some might even say it’s a star. Others say often, it’s cooling.
Others say Earth is a spaceship.
And others say it’s natural fate is to merge with our sun.
Billions believe humans are not natural, created in image of God- and nature is stage we play on.
If true and “humans are not natural, created in image of God- and nature is stage we play on,” then the relationship between humans and nature is one of stewardship, where humans are responsible for taking care of and preserving the natural world. This belief system influences attitudes towards environmental conservation, and views on issues such as climate change and the use of natural resources.
“then the relationship between humans and nature is one of stewardship, where humans are responsible for taking care of and preserving the natural world.”
This would seem to be the Human’s job.
And space cadets think it’s our task to bring life beyond Earth.
But whether they think this or not, it’s necessary. Human can’t live without bringing life with them.
Or it seems it was designed that way.
TM,
You dimwit, the Earth has cooled over four and a half billion years!
That’s why I didn’t go out of my way to point out that whoever wrote the NASA words which you quoted was deluding themself. There is no “net gain”. The planet cooled. Get used to it.
The Earth is not in “thermal equilibrium”. Otherwise, it would neither get hotter – nor cooler.
Obfuscate, twist and turn all you want.
No GHE. You can’t even describe such a mythical creature, can you? That’s sad – I can describe the mythical unicorn better than than you can describe the SkyDragon cult GHE!
You can’t even pick nits with any success – you obviously need to put more effort in.
Carry on.
Swenson writes [again]: “You dimwit, the Earth has cooled over four and a half billion years!”
I should remind readers that he recently wrote:
“Current rates of cooling of the Earth (according to real scientists, based on theory and measurements) are estimated at between one and four millionths of a Kelvin per annum.”
https://www.drroyspencer.com/2023/01/urbanization-effects-on-ghcn-temperature-trends-part-i-the-urbanization-characteristics-of-the-ghcn-stations/#comment-1435056
Yes, that’s correct, between -0.000001 and -0.000004 K/annum. Compare that to the current rate of warming which is +0.2 C/decade.
Swenson, I ask you, which is greater?
Swenson, Whats heavier a kilogram of steel or a kilogram of feathers?
https://youtu.be/-fC2oke5MFg
[laughing at you]
TM,
You persist in appearing dimwitted – as Dr Spencer is apparently wondering, are hotter thermometers due to a GHE which you cannot even describe, or anthropogenic heat – or maybe some other form of heat, which has been created recently.
The Earth has cooled much faster in the past, due to a much higher surface temperatures (fourth power law and all that), plus much greater radiogenic heat.
Hence, the slower rate now – as absolute surface temperature drops, and exhaustion of shorter half life radioactive occurs – after four and a half billion years. I am surprised you didn’t realise that cooling is not linear.
I guess you are trying to insinuate that a GHE has suddenly appeared, after not existing for four and a half billion years – of course, you can’t even describe this GHE, can you?
You can twist and turn, and try to troll by asking stupid gotchas, but it won’t help you. Thermometers respond to heat, not SkyDragon fantasies, nor CO2.
Maybe you should learn some physics, preferably of fairly recent origin. You might even accept that the Earth initially had a molten surface, but does not have one now. Or you can stick with your SkyDragon fantasies about a GHE which didn’t exist for four and a half billion years, but has miraculously appeared in answer to SkyDragon cultist prayers!
Over to you, dimwit.
tim s…I replied to you at the original thread above but I am responding again in a different context.
Gordon, and that is where the #2 law fails to model the atmosphere completely. The greenhouse gases radiating to outer space cool the upper atmosphere. It is the same process as the back radiation that slows the cooling of the surface. The radiation is omnidirectional. It is basic physics.
***
The 2nd law was never intended to model the atmosphere. It is simply a statement that restricts the direction of heat transfer in general. The only application I see for the 2nd law as related to the atmosphere is in rebuttal to the claim that heat can be transferred from a colder atmosphere to a warmer surface.
The idea that back-radiation warms the surface, or slows the cooling, is a direct contravention of the 2nd law. Back-radiation has absolutely no effect on the surface since it cannot change the temperature of the surface. The only exception I can see is if there is an inversion and a parcel of air becomes hotter than the surface.
We need to keep in mind that heat is not physically transferred from one body to another. There is an intervening 2-part conversion from heat to EM and back to heat. I realize this likely sounds like major nit-picking but I am doing it for a very good reason.
Today, scientists talk of heat or thermal radiation, which is not only an oxymoron, it is an anachronism. Heat cannot be radiated physically as heat, it must be converted to an entirely different form of energy to be radiated.
During that conversion heat is lost completely. The theory that it can be radiated dates back to the 19th century when scientists believed heat could be radiated through an aether as heat rays.
That inane theory has led to modern climate alarmists claiming that the 2nd law is not contravened as long as a net energy balance is positive. What they mean by a net energy balance is a net flow of infrared energy. They classify surface radiation as positive and back-radiation as negative then claim because the surface radiation is larger, hence positive, that the 2nd law is not contravened.
That stems from the notion that infrared energy and heat are one and the same energy. They are not, heat is the kinetic energy associated with atoms and IR is an electric field moving in phase with an orthogonal magnetic field. EM can move through a vacuum and heat cannot. That means heat cannot move through the vacuum of space between the Sun and the Earth.
Therefore, a net balance of energy cannot be applied to heat, ergo, the 2nd law is contravened with the notion of a balance of energies involving only EM.
Climate modelers have seriously messed up physics with their unscientific claims. According to modelers, heat dissipation in the atmosphere can only take place by trace gases. Furthermore, they have perverted the 2nd law and the S-B equation with their pseudo-science.
The thermodynamic definition of “heat” is “the transfer of thermal energy from hot to cold”. An object does not “contain heat”. An object “contains thermal energy”. “Heat” is the transfer of that thermal energy to a colder object.
This does not sound like Clint, it’s more like someone impersonating him.
The notion that heat is energy in transit is a modern interpretation that comes from climate alarmists in general. Here is the same contradiction from Britannica which is normally reliable.
https://www.britannica.com/science/heat
“heat, energy that is transferred from one body to another as the result of a difference in temperature. If two bodies at different temperatures are brought together, energy is transferredi.e., heat flowsfrom the hotter body to the colder”.
Then they contradict themselves…
“It is incorrect to speak of the heat in a body, because heat is restricted to energy being transferred. Energy stored in a body is not heat (nor is it work, as work is also energy in transit)”.
***
If energy in a body is not heat, then what energy is being transferred? They already said in the other paragraph that heat is energy that is transferred. What energy is being transferred? You can’t have an unnamed energy in a body, transfer it and call it heat, then claim the energy transferred is not heat.
Clausius spelled this out long ago and it his interpretation of internal energy that is the definition of internal energy, U, in the 1st law. He claimed that heat is the kinetic energy of atoms. On the Net today, many sites still offer that definition. He also defined internal energy, U, as the sum of internal heat and internal work.
Clausius was more specific. He explained that the internal vibrations of atoms is work. It has to be, it’s a mass moving over a distance. However, atoms won’t vibrate on their own, they need an energy to make them vibrate. Clausius claimed that internal energy is heat.
The idea that internal ‘energy’ is a reference to a mysterious energy is bs. In the 1st law, when you relate heat and work to internal energy, that internal energy must have reference to both external and internal energy. Clausius is the only scientist I have read who has spelled that out clearly and it his definition of U that is in the 1st law.
An even greater contradiction. If I transfer heat from a flame into a much cooler metal, they claim it’s OK to call the transfer heat, but it’s not OK to claim heat is being transferred, then why does the temperature of the metal rise?
The atoms in the metal will vibrate much harder, and if the energy transferred is high enough, the atoms will break apart. What energy is causing this, we have to name it? Internal energy is insufficient, if there is energy acting it must be named. So, what is the name of the energy that causing the temperature to rise?
If we split hairs and name internal energy as thermal energy, and not heat, then what happens to the thermal energy when it is transferred out of the metal? Does it simply disappear and re-appear as heat externally? If so, that is about the silliest thing I have ever heard.
Gordon,
You wrote –
“If we split hairs and name internal energy as thermal energy, and not heat, then what happens to the thermal energy when it is transferred out of the metal?”
Well, it goes away! Until it interacts with an electron – which it may or may not do.
For example, all sorts of radiation is passing through your body without being absorbed, continuously. Radio waves, TV, pass through many types of matter without noticeable attenuation. A 1W SW Ham radio transmitter signal can be picked up on the other side of the world – traversing at least 20,000 km of atmosphere along the way. And of course, that 1 W initial power has spread out in all directions, has been refracted, diffracted, reflected, along the way.
So emitted radiation flees into the infinity of the universe, unless and until it interacts with an electron along the way.
All pretty mysterious and bizarre, but that’s reality.
swenson…”So emitted radiation flees into the infinity of the universe, unless and until it interacts with an electron along the way”.
***
I understand what you’re saying but we need to understand that the radiation is no longer heat. When an electron drops to a lower orbital energy level, it gives up that heat as a lowering of kinetic energy. The result is an energy made up of an electric field orthogonal to a magnetic field, neither of which represents heat.
The point is, the body emitting the EM has heat. Authority figures like Britannica are redefining internal energy as thermal energy and external energy as some mysterious energy whose transfer is called heat.
The derivation of the word heat comes from the Greek word therme. Is Christos reading this to confirm the translation? That is also the derivation of thermal, so thermal energy has to be a reference to heat.
I got my ideas about this from reading Clausius, The title of his book is The Mechanical Theory of Heat, not The Mechanical Theory of Thermal Energy. Somewhere along the line, authority figures have decided to redefine the meaning of heat from something that makes good sense to something that makes no sense at all. Britannica is one of them and I plan to write and ask why, however, I expect nothing in return except some smart ass comment like the one I got from NASA re the Moon’s alleged rotation.
Tyndall also wrote a book as a series of lectures and titled it ‘Heat: A Mode of Motion’. Funny how all the learned scientists understood the meaning of heat but we in modern times have suddenly forgotten the meaning.
Here’s another reference from Enrico Fermi in his book (page 22 of 167) ‘Thermodynamics’. He is talking about raising the temperature of water by rotating paddles in it. “We are thus led to the fact that heat and mechanical work are equivalent; they re two different forms of the same thing, namely energy”.
Fermi got that idea from the scientist Joule, who first did that experiment circa 1840. So, we have 4 major scientists who had no problem referring to heat as energy, and not some obscure idea that heat is not energy but energy in transit.
Finally, Clausius put the boots to the modern notion of internal energy. It is the definition offered by Clausius that underlies the U in the first law for internal energy. He claimed that internal energy is comprised of internal work and internal heat. He explained further that the vibration of atoms in a solid is work, and it is. He added, however, that internal heat causes the internal vibrations.
That has to be true. If we add heat to a solid, the atoms vibrate harder. Britannica does not talk about adding thermal energy to the body, they are quiet about what is added, referring to it only as ‘energy’. However, it suddenly becomes thermal energy according to them when it is located inside a solid.
Double talk.
Gordon:
“The derivation of the word heat comes from the Greek word therme.”
–
Yes, that’s right. We use in modern Greek the ancient Greek word therme as you use in English the word heat.
Even more contradiction…the word thermal comes from the Greek therme, meaning heat. Therefore, thermal energy must be translated to mean heat. It can have no other meaning.
C’mon, Bordon.
Thermals referred to hot springs.
Must we translate thermal energy to heated water?
Willard please stop trolling.
Bordon,
Come on:
https://climateball.net/but-modulz/
ent…”[GR]A parcel of air, if hotter than its surrounding environment, will lose energy, and cool.
[Ent]Yes, by conduction of heat and by radiation a parcel of air may export energy to other regions.
***
You are missing an understanding of the process. With any gas, if you reduce the pressure the temperature is automatically reduced. By simply reducing the number of molecules, they have fewer interactions, which translates to a lower kinetic energy for the gas, and a lower temperature.
Remember, temperature is the average kinetic energy of a gas. If you reduce the number of air molecules, you reduce the average KE, and the average temperature.
You could do that with N2 and O2 that don’t apparently radiate at terrestrial temperatures. You don’t need to conduct the heat anywhere, it simply disappears as the number of molecules are reduced.
That’s why the atmosphere’s temperature and pressure reduces with altitude. The higher you get the less air molecules there are and the lower the pressure and temperature.
Gordon,
You wrote –
“You could do that with N2 and O2 that dont apparently radiate at terrestrial temperatures.”
Everything “radiates” at above absolute zero.
SkyDragons are quite delusional. They are infatuated with “air” temperatures (air being mostly nitrogen and oxygen), whilst simultaneously claiming that nitrogen and oxygen have no temperature, ie radiating infrared!
What a pack of weirdos! Thermometers merely reflect how much radiation impinges upon them – hence enclosing them in a screen (under still conditions) just means they are indicating the temperature of the interior screen walls – not the air temperature at all!
It is remarkably difficult to measure air temperature. Luckily, SkyDragon cultists are a gullible and simple lot, so they have no problem dismissing reality as not being relevant.
All pointless, anyway. Historical temperature observations are a curiosity, providing no information about the future. Still no GHE.
swenson…”Everything radiates at above absolute zero”.
***
I agree. However, it is tough finding up to date science on nitrogen and oxygen. For example, O2 radiates in the microwave range which is just below the IR range. Therefore O2 radiates!!! Alarmists are not looking for it don there.
It radiates enough to be the basic for UAH temperature data, yet according to the alarmists it doesn’t radiate at all in the terrestrial range. Is the microwave range not terrestrial?
Over at chiefio, he gave an example of nitrogen radiation in the IR range. It shows up in the night sky.
Gordon,
Just measure the temperature of an oxygen or nitrogen gas cylinder – full, empty – it makes no difference. At equilibrium, the contents and the container are at precisely the same temperature, regardless of pressure.
SkyDragons don’t believe it, but measuring the temperature of a SCUBA tank, for example, won’t tell you whether it is full, empty, or somewhere in between. Weighing it will tell you, and measuring the pressure will tell you how it will last at a given depth.
Even SkyDragons will reluctantly admit that dry air, purged of CO2, has a temperature exactly the same as “normal” air, before H2O and CO2 have been removed. All ordinary matter obeys the Stefan Boltzmann law – no black bodies needed. Of course, the radiative intensity depends on emissivity, so there is not necessarily a direct correlation between say, W/m2 and temperature, regardless of the fantasies of delusional,SkyDragon cultists.
Still no GHE.
The problem is that scuba tanks are made of metal. When you first fill the tank, the temperature will rise in the gas as you fill it. However, the metal allows the heat to bleed off therefore the heat gained is lost. Since the tank is metal, the heat is likely lost as fast as you can fill it.
Don’t know if you have worked with bicycle pumps that have a metal cylinder. The kind where you stand on pedal either side of the pump base while driving a piston in and out of the vertical cylinder. If you feel the rubber hose connector at the base of the pump after using it for a while, it can get quite hot.
This effect is along the lines of the work done by Joule, He set up small paddles in water and drove them mechanically. The water heated up. It’s the same if you drive a piston into a cylinder filled with air. As the air is compressed it warms.
— Swenson says:
January 26, 2023 at 7:56 PM
Gordon,
You wrote
You could do that with N2 and O2 that dont apparently radiate at terrestrial temperatures.
Everything radiates at above absolute zero.–
Also very little goes directly up- about 40 watts per square meter.
If have a flat surface, most radiated energy goes sideways rather straight up. Or radiation from a point goes in random spherical direction, but from flat surface, a hemisphere- and poles of hemisphere are a small area of sphere/hemisphere.
This also why direct sunlight is different kind of radiation- only the portion of sunlight going directly at Earth, hit Earth.
” You dont need to conduct the heat anywhere, it simply disappears as the number of molecules are reduced.
Thats why the atmospheres temperature and pressure reduces with altitude. The higher you get the less air molecules there are and the lower the pressure and temperature. ”
The ideal gas law is
PV=nRT
Note n. That is the measure of the quantity of gas involved in the parcel. That could be measured in moles or grams.
Convection does not reduce the heat content of the convected parcel by reducing the number of molecules. You conserve heat because PV=nRT applies to the same number of molecules throughout. They just spread over a greater volume as they rise.
Oh, so now you claim to understand the IGL? However, you didn’t understand it as applied in Berry’s first paper. Sounds like convenient science, which ain’t science.
Remind me. How did Berry apply the IGL?
ent…”Convection does not reduce the heat content of the convected parcel by reducing the number of molecules. You conserve heat because PV=nRT applies to the same number of molecules throughout. They just spread over a greater volume as they rise”.
***
Convection doesn’t do it, gravity does. Gravity causes the pressure to reduce with altitude hence the reduction in the number of molecules per unit volume. A reduction in molecules produces a reduction in temperature.
PV = nRT
T = (nR/V) P/n
We are assuming V is constant. If that is hard to imagine over the entire atmosphere, visualize smaller bands of concentric circles, which can be summed. Lower the area between circles till you are satisfied the volume is constant.
That leaves us with P/n. Pressure is directly proportional to n. Therefore the ratio P/n gets smaller as n gets smaller. As P/n gets smaller, T gets smaller.
Or, as P/n -> 0, T -> 0. Eventually, T disappears.
V is not constant. The volume of a convecting mass of gas increases with altitude. Ask any glider pilot what happens to the volume of a thermal as it rises.
EM,
Can this glider pilot describe the GHE? You certainly can’t, can you?
By the way, how much “volume” do you think a “thermal” has? Lots? Not much at all?
You really are a silly diverting SkyDragon cultist, aren’t you?
Questions, questions. Pity you don’t have any answers. Oh well.
“By the way, how much volume do you think a thermal has? Lots? Not much at all? ”
An fun question.
A vortex ring thermal is about 500m across and 200m deep. It has a volume of about 40 million cubic metres and at 1.3 kilograms per cubic metre weighs about 50 thousand tonnes.
At a specific heat capacity of about 730Joules/kg/K a thermal 3 C warmer than the air around it would be carrying a “payload” of 1 billion Joules.
Oops, power of 10 error.
Make that 10 billion Joules.
Willard, please stop trying to troll.
Whoops! Wrong place, but Weepy Wee Willy will get the message, I’m sure.
What are you braying about, Mike Flynn?
EM,
You wrote –
“A vortex ring thermal is about 500m across and 200m deep.”
I asked a glider pilot – here’s his response –
“Argument about the possibility of rotating thermals has been going on since at least the 1930s. Letters and articles have appeared at intervals in various gliding magazines ever since. Attempts rave been made to establish whether there is rotation or not by such expedients as throwing out from the glider, quantities of confetti and even toilet roll streamers. None of these trials, so far, has proved anything very convincingly. One reason for inconclusive results is the difficulty of observing the pattern of any such air motions from an aircraft that is, necessarily, itself moving and possibly also circling.”
It seems you are making stuff up, or just believing the fantasies of another delusional SkyDragon. If you wish to throw in diversions to try to obscure the fact that you can’t describe the GHE, at least try to be diverting by saying something that makes sense.
You could always start nit-picking about definitions, I suppose. Or you could try describing the role of the GHE in four and a half billion years of planetary cooling.
Only laughing at you, of course. There is no GHE, which is why nobody can describe it!
Swenson wrote:
“I asked a glider pilot here’s his response “
Readers might prefer to read the source of your cherry-picked quote and judge for themselves.
See Rotating Thermals by Martin Simons on page 98 here: https://keepitsoaring.com/wp-content/uploads/2018/10/the_collected_speight_papers_full.pdf
There are two traditional models of a thermal.
One is the vortex ring, in which the thermal rises while circulating like an invisible smoke ring. There is a core of rapidly rising air which spills over into a more slowly rising outer ring and then pulled into the bottom of the core again.
Flying in a vortex ring you find a core with very high climb rates(10+ft/second) surrounded by an outer ring of less rapidly rising air. Its all very turbulent. The thermal has a definate floor. If you aren’t flying efficiently it is possible to drop out of the bottom of the thermal.
The other model is the column, in which steady heating at ground level produces a continuous column of rising air between ground and cloudbase. You get a smooth moderate rate of climb right up to the cloudbase.
There are advocates of both models. I look at photos of nuclear explosions and see a mushroom cloud with a vortex ring and a stalk. I suspect that if we could see thermals they would look like mushroom clouds.At the top is a vortex ring and below is a column.
You know the story of the blind men and the elephant. Each feels a different part of the elephant and gives a different description.
If you encounter a thermal which has just just formed, or the top of a rising thermal, you are flying in the vortex ring. Once th thermal has become established you are more likely to fly under the vortex ring and into the column.
They’re both right. Thermals are vortex rings and columns.
Tyson McGuffin
Even worse, the article was about tornado-like rotation of a thermal around a vertical axis, rather than the rotation around a horizontal axis seen in vortex rings.
Sometimes I think that Swenson disagrees just for the sake of disagreeing. Sometimes rationally, often irrationally.
EM,
Good luck with trying to stop your ideal gas from cooling, as it radiates energy. The ideal gas law seems remarkably silent about that, doesn’t it?
Anyway, you are just trying to avoid admitting that the Earth has cooled over the last four and a half billion years, rather than getting hotter – as the seriously deluded SkyDragon cultists wish to have us believe.
Admit it, you can’t even describe the GHE in any way that accords with reality, can you?
Maybe you could pose another silly gotcha, and try and avoid addressing the impossibility of even describing the GHE?
Swenson
“Good luck with trying to stop your ideal gas from cooling, as it radiates energy. The ideal gas law seems remarkably silent about that, doesnt it? ”
A breakthrough. Swenson recognises the existence of the greenhouse effect!
EM,
You idiot. Your SkyDragon fantasy has addled your brain! Are you really so stupid as to think that the “greenhouse effect” is the fact that gas cools if allowed to?
Or are you really trying to say that the “greenhouse effect” is responsible for the Earth cooling over the past four and a half billion years?
You dont know what you are babbling about, do you?
Don’t worry, others will have noticed that your efforts to avoid admitting that you can’t even describe the “greenhouse effect” just make you look like the usual inept SkyDragon cultist who can’t face reality, so you reject it. Good luck with that – reality doesnt care what you think.
I’m on reality’s side, as you may have guessed.
Go on, try to describe the “greenhouse effect”. How hard can it be?
Mars settlement and terraforming Mars.
I think a town on Mars, starts with making a lake and to terraform
Mars, one makes lots of lakes. And you stop Mars global dust storm from occurring. Another aspect of terraforming is finding underground
caves and making tunnels. Adding tunnels to natural underground tunnels and perhaps tunnels connecting other underground tunnels. Both Mars and Moon have visible lava tubes, and seems to me, both Mars and Moon could have far more underground areas than Earth has.
What mars settlements are going to do, is massive amounts of exploration of Mars- because it will be profitable to do this.
The idea that NASA will do a lot exploration of Mars is a bit crazy- NASA is likely to explore Mars like it explored the Moon, which was not really exploring much.
I think the purpose of NASA exploring lunar poles, is to prove NASA can explore the lunar poles, and so suggest NASA might be capable of exploring Mars- which much harder to do, than exploring a small area of the small lunar area. And also to determine whether the Moon has mineable water- which could be million to trillions of tons of water
that one could mine. But to start mining the Moon one would start where it’s thought is cheapest site to mine lunar water could be square km area with estimated amount of water which is less than 100,000 tons of mineable water.
NASA may find such area or few of such area, but after NASA has explored the Moon, other better areas might be discovered which are more mineable. Or NASA doesn’t find mineable lunar water, which might mean, other exploration the Moon to find mineable water is not “encouraged” a lot. But main thing is NASA does it’s job well, not the results- which to prove or disprove there in lunar mineable water. And exploration often finds stuff “unexpected”- and finding stuff out, might takes years, after the exploration is completed.
And NASA similarly explores Mars- it’s looking for sites which would have mineable water. And 100,000 tons is not enough water on Mars, one looking for a site with millions of tons of water which the easiest to mine. And at the moments there are hardly any clues of where this would be. Or you narrow it down to area as small as lunar polar regions.
The lunar polar regions has two advantages, could have mineable water, and there sites where one can get sunlight more than 80% of the time- or same amount of water at lunar equator, is less mineable because it get sunlight 50% of the time.
Mars is similar, one can get more sunlight when near it’s polar regions.
And I would say Hellas Basin is close enough to polar regions for this purpose. So you narrowed it down to area with is about size of the US- polar regions are like Oregon,
But one argue there better place other the Hellas Basin- one might pick someplace which could likely have caves or more likely have more
water. But key beginning aspect is finding the safest and easiest place to land on and be able to leave from. Which might be Hellas Basin, but could be somewhere else. The safety of crew is a high priority.
Anyhow, one lake on Mars is not terraforming Mars, but hundreds of lakes would have global effect.
Once one has mine water on the Moon and Mars, you make mining lunar or Mars water, more mineable. You will find more mineable water, and areas not mineable can become mineable.
This also applies to the entire solar system
“The idea that NASA will do a lot exploration of Mars is a bit crazy…”
NASA’s Perseverance rover has spent almost two Earth years on Mars, which is just a single Martian year.
Perseverance is equipped with seven major scientific instruments, including the MEDA (Mars Environmental Dynamics Analyzer) which includes sensors that can monitor temperature, pressure, wind speed, humidity, and dust concentrations.
In Jezero Crater which is near the planet’s equator the average temperature is -67 degrees Fahrenheit (-55 degrees Celsius), but the temperature swings wildly throughout the day, with temperatures between 50 and 60 degrees Celsius warmer during the day than at night.
Perseverance recorded strong winds moving to the southeast during the day, reaching speeds of 55 mph. In the afternoon, winds dropped to just 10 mph, and the wind often died completely from 4 to 6 a.m. local time.
While it’s nice to have a weather report from another world, a better understanding of the Martian atmosphere will help NASA plan future automated missions, as well as hypothetical future crewed Mars landings.
https://www.ehu.eus/en/web/campusa-magazine/home/-/asset_publisher/a7TL/content/the-rich-meteorology-of-mars-studied-in-detail-from-the-perseverance-rover
https://www.youtube.com/watch?v=QY4238uT4to
SpaceX Starship COMPLETES Full WDR, 33-Engine Static Fire Next Week! S24 Scrapped?
What happened this week. It doesn’t seem to me S24 will scrapped.
It maybe possible that some one other than spaceX will get first methane rocket to orbit.
And it didn’t mention Vulcan launch, which is schedule…
1st Quarter Vulcan Centaur Peregrine
But with such vague launch date [like Starship, uncertain launch date- and both first time they are launched] things can slip.
I didn’t hear about asteroid mining mission thingy.
A year ago, I thought we have more lunar mission in 2022, but it
seems it 2023 is going to the year of some robotic lunar exploration-
things are in space and going there, and some more launching soon.
Also the private Venus exploration mission is getting closer to happening.
What chance there is alien life [or earth related, life] on Venus?
It seems unlikely to find out, in first attempt to look for it, but
who knows.
GB,
You must be Star Trek’s biggest fan?
Has they been a better TV show?
I liked Firefly also.
–THE NEW SPACE RACE: Blue Origin plans to fly an all-FEMALE crew into space next year led by Jeff Bezos girlfriend, Lauren Sanchez.
Its a cute stunt, but when is Blue Origin going to get serious about launching payloads into orbit for money?
Posted at 2:50 pm by Stephen Green–
https://instapundit.com/
Probably this year.
Though I thought Starship would launched last year.
But you count Vulcan Centaur as Bezos is connected to and related
to New Glenn rocket. So, Blue Origin’s New Glenn rocket is pretty exciting as far I am concerned, and could launch by summer or before end of year.
I have crazy idea which call a pipelauncher, and New Glenn would fairly easy to,,, pipe launch from the Ocean.
Whereas it’s harder with massive Starship.
But without considering this, New Glenn could have advantages related to lunar crewed exploration.
Anyhow, Blue Origin making significant progress in terms it’s infrastructure at KSC and pieces of New Glenn are being seen.
Bezos and Musk have different approach, cautious vs the madman approach. I like madman path, but Bezos is quietly making progress.
Or if wasn’t for SpaceX, Blue Orgin progress could appear quite fast- and with Starship delays, Blue Orgin apparent glacial slowness, appears faster.
After a somewhat violent jump, our Sun is apparently exhausted for the time being and has now calmed down again:
SSN
https://drive.google.com/file/d/1inP5t0ohVZCQ1T1xOkAuQbgpAdnNowh0/view
F10.7
https://drive.google.com/file/d/1Oz2MSO-6reKY5ThzMBlJrP_h8pZEFnET/view
Mg II ci
https://drive.google.com/file/d/1l9AJ9T5d2ZXq5HPKjbNu9j0nOvlyWNfN/view
*
It will now ‘go sideways more or less for the next two years’, won’t it?
That’s why we’re quietly moving on now, like our beloved Sun :–)
Solar wind
speed: 517.6 km/sec
density: 10.15 protons/cm3
Sunspot number: 104
The Radio Sun
10.7 cm flux: 151 sfu
Updated 27 Jan 2023
Thermosphere Climate Index
today: 19.13×10^10 W Warm
{thermosphere has warmed up a lot}
Oulu Neutron Counts
Percentages of the Space Age average:
today: -0.4% Below Average
It’s lower, but not really Solar Max lower
levels. And nearside has medium size coronal hole-
again not really Solar Max type thing]
I think it will go sideway starting with Feb for a month or 3 and then take off again rising fast, again, and well above, Jan or it’s
sideways direction.
And it’s not to stay long at such higher levels- say, 6 months.
Solar Polar Field Strength.
http://wso.stanford.edu/gifs/Polar.gif
http://wso.stanford.edu/gifs/north.gif
http://wso.stanford.edu/gifs/south.gif
This are from July 8 2022 ?
Yes.
http://wso.stanford.edu/
Answering my own question as to whether an expanding gas does work when there is nothing for it to work against. After all, we normally regard work as a force acting over as distance, however, it also usually means something useful is being done.
I just read in Enrico Fermi’s book, Thermodynamics, that the following is a derivation of work done by a gas operating in an isothermal atmosphere.
L(work) = integral (v1 -> v2) Pdv
= nRT.integral (v1 -> v2) dv/V
Note…they have substituted nRT/V for P in Pdv. With an integral sign you can move constants outside the sign. So, they are integrating dv/V from v1 to v2.
So, L = nRT log V2/v1, where log V2/V1 is the solution to the integration of P dv from volume 1 to volume 2.
However, Boyle’s Law, which is part of the IGL, tells us that P1V1 = P2V2, therefore log V2/V1 can be written as logP1/P2.
L = nRT log P1/P2
Good…math out of the way, what does it mean? What work is being done on what surface?
When we reference pressure in the equation above, it is not the sum of forces exerted on container walls. It is a pressure due to a varying gravitational field. In other words, gravity attracts air molecules with a greater force near the surface and that force diminishes with altitude, therefore a negative pressure gradient is created.
If any work is being done, it is individual molecules doing work against a gravitational force and not against other molecules. The work, L, above is obviously based on a container containing a gas.
It’s not necessary for heat to be converted to work or anything else, however, simply allowing gas to expand into a lower pressure environment allows heat to dissipate naturally.
Gordon Robertson
An ideal gas does not cool when it expands into a vacuum (a real gas does slightly). The kinetic energy of the molecules does not decrease because of expansion. Joule did an experiment to prove this.
https://phys.libretexts.org/Bookshelves/Thermodynamics_and_Statistical_Mechanics/Book%3A_Heat_and_Thermodynamics_(Tatum)/10%3A_The_Joule_and_Joule-Thomson_Experiments/10.02%3A_The_Joule_Experiment
A gas cools when expanding in air because it is doing work on the surrounding air. This is well known and accepted physics.
Norman,
I suppose this is just a distraction to make people overlook the fact that you can’t describe the GHE, is it, nor describe the role of the GHE in allowing the Earth to cool over four and a half billion years?
Maybe the GHE only exists while enough SkyDragons dance in a circle naked, chanting “The GHE is real, I tell you!”
It doesn’t seem to exist if anybody wants to observe it, document it, or measure it, does it?
Think up some more diversions – try posing a few stupid gotchas, perhaps?
Blather, blather, blather…
As usual, Stalker Flynnson has nothing relevant to say, so once again says something insignificant.
How boring!
Binny,
In other words, you can’t describe the GHE, either.
Oh dear, hoping nobody will notice, are you? You don’t seem to be aware of the Streisand Effect. Unlike the Greenhouse Effect, it exists, has been described and documented.
Carry on trying to avoid admitting that you can’t even describe the Greenhouse Effect.
Maybe you could claim that the GHE is really irrelevant and insignificant!
[chortling at dimwitted sauerkraut]
#2
Blather, blather, blather
As usual, Stalker Flynnson has nothing relevant to say, so once again says something insignificant.
How boring!
Swenson he is doing the same thing with me explaining how the GHE is ”well explained” but himself not being able to explain it nor refer to anyplace where it is quantitatively explained in complete detail.
Dr. Curry is calling out the same intransigence with the climate modeling community in failing to even acknowledge observations nor provide any support for explanations as to what is going on.
Climate science is exactly like a failing institution. Its full on cover up after cover up trying to forestall the fall. . . .that essentially one guy set them off on with his models provided to the politicized National Academy of Science and published in the Charney Report in 1979
norman…”An ideal gas does not cool when it expands into a vacuum …”
***
Surely you jest. Take a canister of gas into space and open it. See if it cools or not.
Gordon Robertson
No jest. Experimentally verified. The molecules do not slow down just because you increase the volume. They slow down when pushing against surrounding air and moving it. Read my link and research the topic.
Norman,
You wrote –
“The molecules do not slow down just because you increase the volume. They slow down when pushing against surrounding air and moving it. Read my link and research the topic.”
Really? Even when surrounded by warmer, denser air – say, the “heat dome” phenomenon?
You really don’t understand any of this, do you?
Your demands that others dance to your bizarre cacophony are just an excuse to avoid admitting that you can’t actually describe the GHE (which you presumably think was responsible for planet-wide cooling over the last four and a half billion years).
There is no GHE, you fool. You, and other delusional SkyDragons just don’t want to admit how gullible you have been.
I”ll keep trying to present you with inconvenient facts. Maybe you can find some for yourself.
Over to you.
Rising air ‘here’ is matched by falling air somewhere else.
rlh…that descending cooler air apparently lifts the hotter air. It flows underneath and provides a lift. It also provides convection, without which, according to Lindzen, surface temps would reach 70C.
Gordon,
Actually, in a properly constructed solar pond, temperatures can reach maybe 90 C by suppressing convection.
Seems like a good idea to extract energy from the Sun, but every commercial attempt so far has failed. Taking the advice of experts doesn’t necessarily help. You are assuming that the experts actually know what they are talking about, and often they are so convinced of their own brilliance that they reject reality as being unimportant.
Scientific experts are sometimes even worse, responding to any challenges by claiming the questioner is “anti-science” (whatever that is supposed to mean).
As Feynman said “It doesn’t matter how beautiful your theory is, it doesn’t matter how smart you are. If it doesn’t agree with experiment, it’s wrong.”
Computer modelling and appeals to authority are not experiments. “Science” does not teach – experience does.
As I indicated in a post above, I am reading Fermi on thermodynamics. That’s the same Enrico Fermi who helped developed the nuclear theory behind nuclear bombs. A lot of scientists like Fermi earn their salaries by giving lectures to undergrad students.
I am becoming increasingly annoyed with Fermi as I read on. He is revealing why we are now getting distorted views in physics. He has already completely misquoted Clausius on the 2nd law and now he has become totally arrogant by redefining entropy, a concept invented and defined by Clausius. Between the era of Clausius circa 1850 – 1879, and the time Fermi wrote his book, circa 1935, he has completely distorted the words of Clausius and between 1935 and now, physicists have managed to distort the rest.
The understanding of this distortion of heat theory is vital to this blog. We are essentially discussing global warming and it’s cause and that means a discussion of heat theory. How can we do that if we are discussing concepts that have changed drastically in the past 170 years without proof?
Here are examples from Fermi’s book. In his chapter on entropy, he has very loosely redefined entropy as follows: The property expressed by (67) enables us to define a new function of the sate of a system.
No, Enrico, it doesn’t help us do anything, Clausius not only developed that equation he also stated it in words as: the sum of infinitesimal changes in heat over a process at temperature,T. The meaning is clearly in the words and we don’t need someone coming along 80 years later and taking credit for it. Not only taking credit, but distorting the meaning.
During the ensuing 85 years, entropy has been distorted to the point it is now taken to represent a measure of disorder. There is nothing in the equation for entropy, S = integral dq/T, but heat. Clausius alluded to the interpretation that entropy is an indicator of disorder but that was not the main message. Entropy is a measure of heat.
Another example. For the 2nd law, Fermi quotes Clausius as follows: A transformation whose only final result is to transfer heat from a body at a given temperature to a body at a higher temperature is impossible.
A postulate is defined in one definition as “a thing suggested or assumed as true as the basis for reasoning, discussion, or belief”. Clausius was not postulating, he was stating a law and the meaning was far more to the point than Fermi’s version.
Long pause…I was researching something and got carried away…to be continued.
Final note…came across a paper critical of the modern attitude toward thermodynamics. Like other forms of science, thermodynamics has become a closed shop featuring paradigm junkies.
Sir, this is a Dunkin Donuts.
Gor, contrary to your comment regarding my posting at https://www.drroyspencer.com/2023/01/urbanization-effects-on-ghcn-temperature-trends-part-i-the-urbanization-characteristics-of-the-ghcn-stations/#comment-1436669 my statements appear to be adequately proven.
Gor, (cont) P.K. Cheo of Bell Labs calculated the decay time for CO2 from the level for 15 micron radiation using Einstein A coefficient to be 1.1 sec. This is found in Table 10 of his article on CO2 lasers found in the wayback machine.
The speed of light in the atmosphere is 0.03% slower than the speed of light in a vacuum; GOOGLE speed of light in the atmosphere.
Feynman diagrams are for subatomic particles.
I anticipate my own big laugh when looking later on reactions to the GHE experiment described below:
Experimental Verification of the Greenhouse Effect (short version)
Hermann Harde, Michael Schnell (2021)
http://hharde.de/index_htm_files/Harde-Schnell-GHE-m.pdf
Abstract
We present quantitative measurements for the greenhouse gases carbon dioxide, methane and nitrous oxide under comparable conditions as in the atmosphere and we compare them with radiation transfer calculations.
Our experiments allow clear detection of the atmospheric greenhouse effect, at the same time they show its limited influence with growing concentration of these gases.
*
On page 7 we read:
” Again there are objections from GHE opponents who argue that the radiation from a cooler body cannot be absorbed by a warmer body, as this would violate the 2nd law of thermodynamics.
A simple measurement, in which the temperature of the atm-plate is gradually increased and the warming of the earth-plate or its reduced heating capacity is measured, is clear evidence of a wrong interpretation of this law, which explicitly includes ‘simultaneous double heat exchange by radiation’ (Clausius).
In a closed system, ‘the colder body experiences an increase in heat at the expense of the warmer body’, which in turn experiences a slower rate of cooling.
In an open system with external heating, the back-radiation from the colder body clearly leads to a higher temperature of the warmer body than without this radiation. ”
*
Those who have real interest will miss H2O in the experiment.
On page 15 we read about technical reasons why it is absent:
” Water vapor as the by far strongest GH-gas in the atmosphere could not be investigated in our set-up. This would require some systematic modifications to realize a similar vapor density profile over the lapse rate as in the atmosphere, and in particular, to avoid condensation at the cold plate.
But it would be highly desirable to realize also for this GH-gas quantitative measurements, together with CO2 as a mixture, to study the interdependence of these gases in their overlapping absorp-tion spectra and by this to collect more reliable data about their impact on our climate.
Based on a set-up as presented here but with a further developed equipment, particularly with well stabilized components and an improved temperature recording such investigations would be very helpful for objectification of the further climate debate. ”
*
I’ll enjoy their future results.
**
Alarmists won’t like their work! Look why:
” The presented measurements and calculations clearly confirm the existence of an atmospheric GHE, but they also demonstrate the only small impact on global warming, which apparently is much more dominated by natural impacts like solar radiative forcing (see, e.g., Connolly et al. 2021 [16]; Harde 2022 [17]). ”
Yeah.
Binny,
You seem to be appealing to the authority of SkyDragon cultists who couldn’t get their nonsense published in a real scientific journal.
The journal “managers” –
“The Scientific Council of the Norwegian Climate Realists is at the moment working on a plan for the management of the journal from 2023.”
From the paper intro –
“Fossil fuel emissions are made responsible for a climate emergency with catastrophic consequences for our planet, when worldwide anthropogenic emissions are not rapidly stopped. The basis of these forecasts is the atmospheric Greenhouse Effect (GHE).”
Well, that’s scary enough – but they somehow manage to avoid pointing out that the GHE is supposedly responsible for four and a half billion years of planetary cooling, without actually managing to describe the GHE anywhere!
What a pile of rubbish! These donkeys even start off saying “We present quantitative measurements for the greenhouse gases carbon dioxide, methane and nitrous oxide under comparable conditions as in the atmosphere and we compare them with radiation transfer calculations.” Presumably, their calculations would also reflect the reality of four and a half billion years of cooling, do you think?
Just provide a useful description of the GHE, which accords with observed fact, and that’s a start. Just appealing to other deranged SkyDragon cultists’ fantasies won’t help much.
Try harder.
binny…” Again there are objections from GHE opponents who argue that the radiation from a cooler body cannot be absorbed by a warmer body, as this would violate the 2nd law of thermodynamics.
A simple measurement, in which the temperature of the atm-plate is gradually increased and the warming of the earth-plate or its reduced heating capacity is measured, is clear evidence of a wrong interpretation of this law, which explicitly includes simultaneous double heat exchange by radiation (Clausius)”.
***
More pseudo-science along the lines of Swannie’s GP/BP experiment. We are not arguing that heat cannot be transferred from a cooler region to a hotter region, it is a fact. Since the times of Clausius, it has been corroborated by Bohr, who explained why.
Clausius thought, like other scientists of his time, that heat could flow both ways through air as heat rays. Bohr revealed the error in that ideology, proving that any radiation effect that produces heat between two bodies of different temperature can only occur from the hotter body to the colder body.
The people doing the experiment at your link still live in that anachronism, that heat flows both ways between bodies of different temperatures by radiation. It has gotten so bad, that authority figures like Britannica are playing the same game. They have redefined heat as the transfer of thermal energy between bodies of different temperatures.
Since when has thermal energy not been heat?
Besides the proof supplied by Bohr, it is a common understanding in physics that energy cannot be transferred from a state of lower potential energy to a state of higher potential energy. With a transfer of heat, the colder body represent a lower potential energy state and the hotter body a higher potential energy state.
There is no explanation offered by the opponents of the 2nd law as to how it is possible for a hotter body radiating in the vicinity of a cooler body to receive energy from the cooler body and warm. Anyone claiming that can happen does not understand the mechanics of atomic interactions.
C’mon, Bordon.
Not that other Sky Dragon talking point again.
Willard, please stop trying to troll.
” Bohr revealed the error in that ideology, proving that any radiation effect that produces heat between two bodies of different temperature can only occur from the hotter body to the colder body. ”
Source, Robertson?
Or is this another of your inventions to distort the history of science?
Binny,
Are you trying to imply that heat can travel from a colder to a hotter body, or are you posing some strange, meaningless, gotcha for no good reason at all?
test
As predicted, the usual ignoramuses were at work.
The dumbest of all being of course Flynnson who didn’t even read more than a bit of the paper’s intro: simply because his scientific education is way way below what is needed to understand the paper.
More later…
Binny,
Claiming that your mind-reading abilities are real? How do you know what I read – or don’t read?
You idiot – you are just making yourself look like an fool, because your appeal to authority has been shown to be just another SkyDragon declaration of faith.
Accept reality, the Earth has cooled for four and a half billion years. Nobody has satisfactorily described the GHE – because it’s nonsense. Keep carrying like a petulant little sauerkraut – lash out with your riding crop, stomp around in your jackboots threatening your opponents with death by electric shock, lingering fatal disease, or whatever.
It won’t do you the slightest bit of good. No matter how hard you try, Nature can’t be fooled – particularly by a deranged SkyDragon cultist like you.
Carry on trying.
Yeah…
What else than this redundant 5 o-clock tea blathering could one expect from Flynnson?
Denial of the GHE is not necessary to demonstrate that CO2 has no significant effect on climate. Sec. 4 and Ref 51 in http://globalclimatedrivers2.blogspot.com show why CO2, in spite of being IR active, has no significant effect on climate.
Demonstration that the planet is warmer than it would be without a GHE is a trivial problem in engineering heat transfer analysis. The fact that water vapor is an IR active gas has been demonstrated by laboratory measurements.
Dan,
No offense intended, but before the first liquid water appeared on the planet’s surface, the atmospheric concentration was at the highest point it would be in four and a half billion years – all the free H2O on the planet was in the atmosphere.
The surface cooled anyway – that’s fact.
How do you explain this? Are you possibly saying that regardless of surface temperature, the temperature is “warmer than it would be without a GHE . . . “?
The temperature would seem to be whatever it is, whether it is hotter than molten rock, hotter than the boiling point of water, or its present range of roughly -90 C to +90 C.
We dont seem to have any “should be” thermometers, only “is” thermometers, showing the degree of hotness of the thermometer.
Still no description of the GHE, is there? Care to try?
Swe, I did a little calculation, partly out of curiosity: The 332.5E6 mi^3 of water spread over the 196.9E6 mi^2 of earth would be 8916.2 ft deep so the pressure at zero altitude would be 3356 psi. The critical point of water is 3206.2 psi & 705.4 F. When the temperature at zero altitude got down to 705.4 F the water would start condensing there. Water would have condensed right away at high altitude forming full cover, high reflectivity (low energy gain) but high emissivity (high energy loss) cloud cover. At some high altitude it probably rained and then at a slightly lower altitude evaporated augmenting the heat loss. It took about 200 million years for the earth to cool down enough for life to begin.
Yes, the average global temperature is warmer than it would be without a (misleadingly named) GHE. That is the way I define GHE. It is a simple calculation in engineering heat transfer analysis. The measured average global temperature is warmer than the calculated temperature if there is no GHE.
Dan,
The way I see it, if the measurement differs from your calculations, your calculations are wrong.
My point about the H2O in the atmosphere before the first liquid water appeared, was that even that vast amount of H2O gas was unable to prevent the temperature dropping. No GHE, as far as I can see.
I haven’t checked your calculations, but if your 705.4 F is correct, was that a real temperature, or a “should be” temperature? It seems to have made precisely no difference in practice – the atmosphere cooled, liquid water appeared, temperature eventually dropped to below 100 C, and away we go.
Increasing the amount of H2O between the Sun and the surface makes the surface cooler, no5 hotter. Tyndall, being a keen alpinist, was aware of this, and wrote about it at length. His research, and subsequent meticulous experiments support my view – no GHE.
Please do account for phase change energy requirements in all this. Gas/liquid/solid.
This will almost certainly be larger than energy requirements within each phase.
RLH,
I’m not sure whom you are asking, nor why you are asking.
The surface cooled over four and a half billion years.
What have “phase change energy requirements” to do with the observed cooling?
Are you trying for a gotcha? I get the impression that you are, because you imply you already know the answer when you say “This will almost certainly be larger . . . “.
I suppose you prefer to imply that you are very clever, rather than demonstrating the depths of your ignorance by not being able to describe the GHE in any way that accords with observed fact. Just another devout SkyDragon cultist, are you?
Long on faith, but short on fact.
“What have ‘phase change energy requirements’ to do with the observed cooling?”
Because change of phase requires energy, even though no cooling takes place.
RLH,
You wrote –
“Because change of phase requires energy, even though no cooling takes place.” Gee, so you do know what I know, after all!
However, cooling did take place for four and a half billion years, so trying to ignore reality by telling me something I already know, won’t achieve much.
Tell me something I don’t know – a sensible description of the GHE, for example. How hard can it be for a clever fellow like you?
“cooling did take place for four and a half billion years”
No-one disputes that. Your point was?
Swe, Is it really necessary to point out that there were no measurements?
The cooling was from the top ‘surface’ of the WV. The fact that WV is IR active is part of why it took so long for the earth to cool; about 200 million years.
705.4 F is the critical point of water. I didn’t measure it, look in any reference. Yes it is real.
Water changes phase at 100 C only if the pressure is 1 atm.
Condensation is at top of atmosphere where it radiates to the cosmic background which is at about 3 Kelvin.
Apparently you do not understand this stuff very well.
Nice one, Dan.
Dan,
Is it your theory that CO2 energy gets thermalized before it is emitted as radiation? Is that correct?
Ste, By CO2 energy I assume you mean radiant energy absorbed by CO2. At low altitude all absorbed energy is thermalized. At zero altitude there are about 23 times as many water vapor molecules as CO2 molecules. At about 2 km and higher, outward directed photons from WV molecules can make it all the way to space. The result is net energy flux towards space. Gas phase conduction at the molecule level causes energy absorbed by CO2 molecules to be conducted wrt wave number to replenish the energy radiated to space by WV molecules. Near the tropopause and above, radiation from CO2 and other noncondensing IR active molecules can also make it all the way to space so the energy from non-IR molecules is also conducted to them. This is all explained further at Ref 51 in (click my name).
Dan,
At night the temperature drops, regardless o& atmospheric composition.
No GHE, apparently.
Swe, the fact that at night the temperature drops more and faster where water vapor is lower (in a desert) than it does where it is humid demonstrates not only that there is a GHE but that water vapor is IR active.
Mike Flynn has been told that for more than ten years, Dan.
He keeps braying.
Dan,
And the fact that during the day the temperature rises more and faster where the water vapour is lower (in a desert) than it does where it is humid, demonstrates that there is no GHE.
Saying that water vapour is IR active is a bit silly. Everything is IR active. All matter above absolute zero emits and absorbs IR.
Not only that, but in deserts, water vapour is markedly absent, so its alleged heating properties are conspicuous only by their absence.
No, the presence or absence of any GHGs does not stop a surface from heating or cooling. The moon has no GHGs at all, and gets both hotter and colder than Earth.
Still no GHE. You can’t even describe this mythical effect, can you?
Willard, please stop trying to troll.
Wiltard,
Dan’s theory means that CO2 isn’t an issue and never will be, even if all the fossil fuels on the planet are combusted.
Troglodyte,
Dan’s not a Sky Dragon crank.
Sorry not sorry.
Willard, please stop trying to troll.
Swe, The fact that during the day the temperature rises less and slower where water vapor is higher is because it fell less the night before because of the GHE.
Saying that everything is IR active suggests that you dont know what it means. You should know better. It doesnt mean that non IR active things dont emit at all, it means that in gas phase their emissions are not thermally significant at IR wavelengths and the Stephan-Boltzmann (T^4) law doesnt apply. Satellite based instruments determine the temperature of the atmosphere by radiation from non-IR-active oxygen. That is how AMSU works.
You are right that the presence of GHGs does not STOP a surface from warming or cooling but they certainly SLOW the part of the process involving radiation. Most of the larger temperature range of the moon is because days and nights are about 14 days longer there. The lack of a significant GHE there lowers the average of the temperature range there compared to earth.
You wont understand how the GHE works until you at least understand how IR active gases work. A good understanding of engineering heat transfer analysis easily demonstrates that the planet is warmer than it would be without the presence of IR active gases in the atmosphere. An understanding of how IR active gases work explains why. A key factor is the one in a billion or so probability that an IR-active molecule will immediately emit a photon after it absorbs one. What happens instead is that the absorbed energy is shared with surrounding molecules within microseconds.
stephen…”Dan…Is it your theory that CO2 energy gets thermalized before it is emitted as radiation? Is that correct?”
***
Good point, and good gotcha.
Gor, Try to keep up. The fact is that, in the troposphere, energy absorbed by CO2 molecules gets redirected to replenish energy radiated to space by water vapor molecules. That is part of what Sect 10 in https://watervaporandwarming.blogspot.com explains.
Very strong SSW.
https://i.ibb.co/XSGXfvn/pole10-nh-1.gif
https://i.ibb.co/0rXj3Xv/pole30-nh.gif
It’s going to be a long winter.
https://i.ibb.co/VTNj0Lw/Zrzut-ekranu-2023-01-28-194504.pngIt's
From a GHCN daily weather station in ND Fargo
USW00014914 46.9253 -96.8111 274.3 ND FARGO HECTOR INTL AP
some pretty cold days for the March month:
USW00014914 54-33 1948 3 10 -36.7 (C)
USW00014914 54-33 1948 3 11 -33.3
USW00014914 54-33 1948 3 9 -32.2
USW00014914 54-33 1962 3 1 -30.6
USW00014914 54-33 1980 3 1 -30.6
USW00014914 54-33 1952 3 4 -30.0
USW00014914 54-33 1997 3 5 -30.0
USW00014914 54-33 2019 3 3 -28.8
That’s what they probably mean in ND by ‘a long winter’.
We’ll see how 2023 behaves.
Do you know what a strong SSW is in the middle of winter? You’ll soon feel it for yourself. Don’t try to play the fool.
Most of your endless scary storytelling was wrong for our region.
Binny,
Yes, predicting is difficult – particularly where the future is involved.
Except for SkyDragons of course – they just call it projections or scenarios or probability distribution functions. Delusional fools, all of them.
This is what a similar SSW looked like in 2009, and it is not a “prediction.”
https://youtu.be/bminxfVGa5w
Delusional fools one can deal with like one can deal with guys screaming doomsday from atop a soap box in Pershing Square.
Its a shame that it has to involve academics at major institutions but they burnt their credibility with the public with the declarations of settled science, 97% consensus, and attacks on skeptics.
And you know what happens when you clearly destroy your credibility. You never get it back.
Gill, Gill,
https://climateball.net/but-consensus/
Scientists are still trusted.
Not sure about auditors.
Want me to check?
Willard, please stop trying to troll.
ren…Binny is not trying to play the fool, he is a fool.
christos…”Gordon:The derivation of the word heat comes from the Greek word therme.
[Christos]Yes, thats right. We use in modern Greek the ancient Greek word therme as you use in English the word heat.
***
There you have it from Christos, whose native tongue is Greek. Heat is still referred to as therme in modern Greece, and therme is the root word for thermal.
Therefore, I conclude that thermal energy is the same as heat.
The word heat has been is use since Ancient Greek times and I’ll be damned if I sit by and allow modern dweebs to redefine what heat means.
Gordon,
I like this definition – “the quality of being hot”.
Seeing how thermometers measure “degrees of hotness”, it’s good enough for me.
Why are you talking about me, Mike?
Willard, please stop trying to troll.
The thermodynamic definition of “heat” is: “the transfer of thermal energy from hot to cold”. An object does not “contain heat”. An object contains “thermal energy”. “Heat” is the transfer of that thermal energy to a colder object.
On net, Pup.
On net.
Just like hockey.
Willard, please stop trying to troll.
clint..still not convinced this is you. There are idiots impersonating people.
When you first started posting about the Moon having no local rotation, I had a gut feeling you were right but I was not sure. I still defended your right to claim that. It was not till I started researching your point scientifically that I became convinced you are right.
I am challenging that definition just as I challenged the fallacy of the GHE and the Moon rotating on a local axis. The notion that heat is not thermal energy, but a transfer of thermal energy, is plain idiotic.
That’s not aimed at you, it is aimed at the idiots who thought up the fiction.
Look anywhere on the Net for a definition of heat and you will find something like this…
“Temperature…the degree or intensity of heat present in a substance or object esp. as expressed according to a comparative scale and shown by a thermometer or perceived by touch”.
I have recently spent hours reading Clausius, Fermi, Tyndall, Maxwell, and Planck. Not one of them has a problem calling heat what it is…energy.
What else could it be? Britannica splits hairs between heat and thermal energy, reserving the latter to describe internal energy. That’s idiotic. What happens when you need to transfer that internal energy between bodies? When it is mid-transfer, you need to change the definition and call it plain energy. Then, when it’s back inside the destination you call it thermal energy again.
The problem with the Britannica definition is its omission of ‘thermal’ to the energy being transferred as ‘heat’. They claim heat is not stored in a body, however, if you look elsewhere, they define internal energy as thermal energy. There is no ands, ifs, or buts that thermal energy refers to heat.
I just checked it with Christos, whose native language is Greek. Thermal comes from the Greek word therme, which is Greek for heat. The word heat has been in use for thousands of years, albeit in different languages. I am not about to sit back and watch as pseudo-scientists try to rename the meaning of heat arbitrarily without scientific proof.
Hot springs are called thermal springs for a reason.
As Swenson put it, “I like this definition the quality of being hot.
Seeing how thermometers measure degrees of hotness, its good enough for me”.
Gordon, you need to consult a 1st-year engineering thermo book, like Fundamentals of Classical Thermodynamics (Van Wylen, Sonntag). From page 73:
Heat is defined as the form of energy that is transferred across the boundary of a system at a given temperature to another system (or the surroundings) at a lower temperature by virtue of the temperature difference between the two systems. That is, heat is transferred from the system at the higher to the system at the lower temperature, and the heat transfer occurs solely because of the temperature difference between the two systems.
clint… we are challenging this kind of pseudo-science, are we not? Do you really believe that crap just because it’s written in a textbook?
I am an engineer. I was taught that heat is energy, thermal energy. I was taught, not that long ago, that thermodynamics is a study of heat and heat processes. No one in those days had the slightest problem talking about the quantity of heat in a body or that heat flowed as energy.
More recently, idiots have emerged who are trying to turn science on its ear. Gravity is no longer a force, it is a space-time anomaly. The entire mass of the universe occurred out of nothing in a Big Bang. The atmosphere is heated by a trace gas making up 0.04% of the atmosphere. A greenhouse warms due to glass trapping IR. A photon is a mass-less particle of EM with momentum yet momentum still equals mass x velocity.
We have challenged the nonsense that the Moon rotates by applying science. I am encouraging you to apply the same science to this problem. It is sheer bs that heat is nothing more than a means of transferring energy.
Please…throw that textbook on the garbage heap where it belongs, along with books advocating the GHE and lunar rotation. If you read deeper into the book, they will start talking of a two-way transfer of heat between bodies of different temperatures, without explaining how that is possible.
In my EE books they still talk about electrical current flowing positive to negative. I became an electronics tech right out of high school and returned to university a few years later to study EE. I learned as a tech that current flows from negative to positive.
When I went back to the uni, they did not teach us that current flowed +ve to -ve, it was the textbooks that claimed it. I went to my prof and told him my dilemma re current flow. He laughed and told me he understood but for whatever reason the textbooks taught +ve to -ve, which is a convention dating back to 1925.
He advised me not to worry, that it did not matter in circuit analysis which way I applied the voltage, as long as I was consistent with voltage drops in the circuit.
I could never figure out in electronics why the arrows in diodes and transistor pointed in the opposite direction to the direction we were taught as techs. It was only after getting to EE classes at the uni that I got it. The arrows point in the direction of a mysterious positive test charge.
As a tech, I simply ignored the arrows and visualized current running into the arrows. Never had a problem.
It appears that mechanical engineering text books go even further back to a time before heat was defined as a caloric, a liquid-like material that represented what heat was believed to be. What they print is rubbish, throw them out.
clint…if we disagree on this, no big deal. Right?
Independent thinkers can disagree Gordon. That’s not a problem. It happens all the time. But when independent thinkers agree, that’s a problem for the cult.
But, in this case, I’m right.
What do you call the “transfer of thermal energy from hot to cold”?
A “tuna sandwich”?
clint…”What do you call the transfer of thermal energy from hot to cold?”
***
A transfer of heat from hot to cold.
I explained that via Christos, who speaks Greek. Thermal in Greek is therme, and in Greek, Christos confirmed the word therme means heat.
I have no idea how this got started, where heat is suddenly a transfer of heat and not heat.
Thermal energy = heat and it always has meant that.
What are thermal baths? Heat pools. What is a thermal blanket? A heating pad. What is thermal energy? Heat.
If you use a thermal blanket it heats you up. Your temperature increases.
Temperature is a measure of thermal energy, aka heat.
clint…Answer me this, what is internal energy? It is comprised of a thermal component and a mechanical component as atomic vibration. You cannot exclude mechanical energy from internal energy.
Clausius pointed out circa 1850 that internal energy is the sum of mechanical energy, as work, and heat. His definition of internal energy, as U, was adopted for the 1st law. He was gracious enough to step aside and allow internal energy to be labeled according to Thompson, who suggested the simple word energy for internal energy.
However, the word energy is misleading since it does not describe the kind of energy available internally. It’s like using the description kinetic energy, which does not describe the type of energy either. These days, scientists are thoroughly confused about that to the point where the definition of heat is even in question.
The thermodynamic definition of “heat” is: “the transfer of thermal energy from hot to cold”. An object does not “contain heat”. An object contains “thermal energy”. “Heat” is the transfer of that thermal energy to a colder object.
The thermodynamic definition of “internal energy” is: “All the energy within a system”.
Wiki gives a longer definition:
https://en.wikipedia.org/wiki/Internal_energy
But you know me, I like to keep things as simple as possible.
Clint R,
I wonder if some definitions tend to give the impression that heat is “caloric” in nature. From Wikipedia – “The caloric theory is an obsolete scientific theory that heat consists of a self-repellent fluid called caloric that flows from hotter bodies to colder bodies.”
These days, it seems people just replace “caloric” with “energy”, more or less.
Even the term “temperature difference” is a bit woolly. So is “the boundary of a system”, in relation to energy.
Given that two bodies have the same temperature, they both exhibit a degree of hotness, and apparently aren’t exchanging energy (or are they?), but of course the bodies “contain heat”, which they can transfer to a colder body. When all three bodies reach the same temperature, there is no “heat” flowing, but the total energy in “the system” remains the same.
I might seem picky, but to me “heat” is just a convenient way of describing a phenomenon which may occur when photons interact with electrons. People will give equations showing how much “heat” is in a body, which is nonsensical (at least to me). About as nonsensical as SkyDragons claiming that “heat” is hiding in the oceans, or that “greenhouse gases” generate, multiply or accumulate “heat”!
What the Hell, who cares what I think? Probably about as much as I care about the opinions of SkyDragons in general.
Bodies contain “thermal energy”. Heat is the transfer of that thermal energy from “hot” to “cold”.
swenson…”to me heat is just a convenient way of describing a phenomenon which may occur when photons interact with electrons. People will give equations showing how much heat is in a body, which is nonsensical (at least to me)”.
***
We need to remember that heat can be added to a body by conduction and convection. The photon is related specifically to radiation. If you heat a body with a torch, heat is transferred both by conduction and convection directly to the body. Thence, its temperature rises.
If you use an acetylene torch, the flame has a long orangy coloured part but the part you want is the bright blue pencil near the torch head. You use it as the target part of the flame to heat the metal so you can braze or weld. If you just use the orangy part, the metal will heat but it won’t get red hot.
So, heat is being transferred by conduction straight from the bright-blue flame to the metal. The metal is bathed in this flame, leaving no room for radiation. In welder parlance, you are heating the metal. If you claimed you were applying thermal energy to the metal, someone would slap you up the side of your welding helmet, if you were wearing one. If you were just gas welding, you’d be wearing goggles and a hard hat, and you’d get slapped up the side of your hard hat.
That’s what scientists need who insist on referring to heat as a transfer of heat.
What is this temperature thing then, as they’d say in Monty Python? It’s a relative measure of heat content. It is based usually on two set-point: the freezing point of water and the boiling point of water.
Again, anyone is free to claim it is a relative measure of thermal energy. Makes no never-mind to me. I find it much easier to say heat.
When it comes time to transfer this internal energy to another body, why is the thermal energy suddenly called plain old energy? The reason is simple, if you called it heat then heat would have to be defined as the transfer of heat. As it stands, the energy being transferred is thermal energy, so why don’t they call it that? Then heat becomes the transfer of thermal energy.
But, someone from Greece might come along and ask, “Hey…why are you calling heat a transfer of heat”?
swenson…”People will give equations showing how much heat is in a body, which is nonsensical (at least to me)”.
***
The amount of heat can be calculated using the initial and final temperatures. It’s all relative using a Celsius or Fahrenheit thermometer and I presume to know the actual amount in calories, you’d have to relate it an amount defined based on absolute 0K.
However, I get what you mean, that what is being measured cannot be identified.
They don’t usually offer equations showing the quantity of heat, since in any process you can only show the beginning and ending temperatures. You can calculate the heat capacity, or the specific heat, but those too are relative terms.
Actually, no one can show the amount of any energy in a body since no one knows what energy is. Take electrical energy for example. We know there is something forcing charges around a circuit but no one knows what the energy is. A difference in charge potential across a voltage source can be measured, or the amount of charge running through a circuit, but no one can measure the energy producing the electromotive force involved.
We can measure the amount of energy per unit time in an electrical circuit but what we are doing is measuring the aforementioned potential difference and the current over a period of time. The measure of energy is the kilowatt-hour and the watt is defined as the voltage times the current. But, what are we measuring>…an unknown entity.
Energy in heat is defined on the calorie. Using the watt is ingenuous since it is a mechanical work-equivalent value. The calorie is defined as the amount of thermal energy required to raise the temperature of one gram of water by 1 degree C, from a temperature of 14.5 C, at a pressure of 1 atm.
Clint R,
No offense intended, but I don’t know of any “non-thermal” energy.
Matter is energy. Einstein said e=mc2, and it seems this is true – quantum electrodynamics theory is the most thoroughly tested theory of all time, and nobody has managed to show that it is wrong.
Luckily for me, Feynman said “I think I can safely say that nobody understands quantum mechanics.” I am not embarrassed to be in that category. QED does not necessarily reflect commonsense, and often makes no sense at all, but its predictions turn out to be right to the limits of measurement.
It makes sense that “heat” can be transferred from “hot” to “cold” – as does the transfer of “caloric”, but Nature doesn’t care about common sense. Terms such as “hot” and “cold” are pretty meaningless. Even “hotter” and “colder” are subject to human interpretation. The thermosphere is “hot”, some thousands of degrees. Outer space is “cold” at almost absolute zero. The thermosphere blends into outer space via the exosphere, but the “temperature” is irrelevant, it seems.
The fact is that the Earth’s surface is no longer molten, and neither the atmosphere nor anything in it, stopped the surface cooling. Certainly not the prayers and supplications of SkyDragon cultists!
The GHE is a myth – regardless of what many would like to believe.
swenson…”Matter is energy. Einstein said e=mc2, and it seems this is true ….”
***
Einstein had a fetish for the speed of light. The equation is a little too cute for my liking. According to it, I can take a kilo of matter and covert it directly to electromagnetic energy. Or in the form m = e/c^2, I can take a quantity of EM (light) and convert it to a kilo of matter. Or, in the case of the Big Bang, you can take nothing and convert it into all the matter in the universe today.
Smacks of the Big Bang nonsense. Mark Twain would have had a heyday with that. Take a pound of gold and sit it in the Sun, and over a course of time it will double its mass.
************************
“Feynman said I think I can safely say that nobody understands quantum mechanics. I am not embarrassed to be in that category. QED does not necessarily reflect commonsense, and often makes no sense at all, but its predictions turn out to be right to the limits of measurement”.
***
I am sure Feynman was right. However, there is science based on quantum theory, like molecular chemistry and electronics. Both work. It’s when you get off into the fringes of quantum theory that I tune out, theories like entanglement theory, where an electron can allegedly communicate with another electron a mile away.
Basic quantum theory is fairly simple as a theory, it’s the math describing it that gets hairy. Bohr based it on an electron orbiting a proton in the hydrogen atom. That presents a problem in that you can make no measurements on the electron since using any kind of instrumentation dislodges it from its path.
So, electrons were treated by Schrodinger as waves. The wave does not have to be linear, like a sound wave spreading out from a source, a wave can be represented as a particle orbiting a nucleus. Projecting the orbital motion onto an x-axis creates a sine wave if a time element is introduced to extend the motion along a vertical time axis.
In other words, if the projection of the orbital motion of the electron is projected onto the x-axis, it moves back a forth across the axis. If you can make that projection move along an orthogonal time axis at the same time, it produces a sine wave along the orthogonal time axis.
There are differential equations representing such a motion and Schrodinger applied DEs as a wave equation to seek solutions to Bohr’s quantized orbitals.
That presents another problem, the solutions to such equations are many and some of them don’t work. The equations represent theorized orbits of electrons orbiting a nucleus. As Feynman claimed, it works, but no one knows why.
“…but I don’t know of any “non-thermal” energy.”
Just to name a few — Electrical, kinetic, mechanical, chemical, potential, nuclear.
Thermal energy is most associated with climate discussions. Thermal energy is the type of energy associated with molecular vibrations which are associated with infrared absorp.tion/emission. Molecular vibrations also influence temperature, as previously discussed.
By using the correct thermodynamic definition of “heat”, confusion can be avoided. For example, we know “cold” can NOT heat “hot”, just by the correct definition. No confusion.
I thought nuclear power plants where thermal power stations, Pup.
Please advise.
Wandering Wee Willy,
You wrote –
“I thought nuclear power plants where thermal power stations, Pup.
Please advise.”
Where? Who cares where they are?
clint…”we know cold can NOT heat hot, just by the correct definition. No confusion”.
***
According to Britannica, thermal energy is reserved for internal energy. If we have a hotter body transferring ‘energy’ to a colder body, what is the ‘energy’ being transferred?
If you call that transfer ‘heat’ you are inferring the transferred energy is heat. It makes no sense to call the transfer process heat and call the source thermal energy and the target thermal energy.
Consider two bodies in contact, one hot, one cooler. At the contact point, which is so thin it can only be measured in atoms, what is going on? You have labelled the hotter body as containing thermal energy and the process at the atomic contact as heat. Where does one start and the other end?
Now look inside a mass where one end is hot and the other end is cooler. The mass is metal and you are heating the hotter end with a torch. What is being transferred from the flame to the surface? The temperature of the metal rises and is becoming hotter, but according to the new theory we can no longer call that an increase in the heat content of the body. Temperature is a measure of heat, if it rises, the amount of heat is increasing.
Mike Flynn,
What are you braying about?
Gordon Robertson says:
”According to Britannica, thermal energy is reserved for internal energy. If we have a hotter body transferring energy to a colder body, what is the energy being transferred?”
This is how the political left plays the game. Its about redefinition of words.
Getting hotter is a hotter source or some other powered device that can generate heat making something actually hotter.
But for the GHE they redefine that. Instead of saying a greenhouse effect will make temperatures more moderate by the process of causing the environment to exist within a narrower range of temperatures, which is what a greenhouse effect does and does so more effectively vs cold than hot, thereby possibly slightly raising the mean temperature if the co2 effect isn’t already at or very near saturation.
They then claim not only hotter instead of more moderate but that weather extremes will become more common. Which is just the opposite of the case.
Today the left has departed on a complete restructuring of the English language (and no doubt a few foreign ones as well) and to make a complete mess of it to advance political agendas in every arena. It is as simple as that.
Gordon, Britannica is NOT thermo book.
I can’t teach an entire course, but I’ll answer your first few questions: If we have a hotter body transferring ‘energy’ to a colder body, what is the ‘energy’ being transferred?
Answer: “Thermal energy”
Consider two bodies in contact, one hot, one cooler. At the contact point, which is so thin it can only be measured in atoms, what is going on?
Answer: “Heat”. Thermal energy is transferring across the boundary due to the temperature difference.
You have labelled the hotter body as containing thermal energy and the process at the atomic contact as heat. Where does one start and the other end?
Answer: Heat starts when thermal energy leave the hotter body and continues until it arrives the colder body. “Heat” is the transfer of thermal energy from hot to cold.
Heat is part of internal energy. Internal energy is the sum of Enthalpy and Entropy. It is a state function. Heat does not need to be transferred to exist. The two forms of heat are sensible heat and latent heat.
The zeroth law says that all atoms and molecules in thermal equilibrium are the same temperature, but not necessarily the same Enthalpy (heat). Specific Heat can be significantly different, and latent Heat can be orders of magnitude different.
SSW is already operating in North America.
https://i.ibb.co/23sZvJf/Zrzut-ekranu-2023-01-29-075429.png
ABC – Always Be Contrarian
https://andthentheresphysics.wordpress.com/2023/01/29/true-contrarians/
ABAI – Always be an idiot.
Something you know a lot about.
NUDR – No U, Dear Richard.
There is no U in Richard.
Willard, please stop trying to troll.
Wiltard is a disrupter, a Marxist goon. Nothing intelligent. Vocabulary limited. Best to ignore.
The correct term is ninja, Troglodyte, and you are a Sky Dragon crank.
I can be Big Cat, Archivist, Godzilla, or Kung Fu Master.
Your choice.
Willard, please stop trying to troll.
Nope. Stephen is obviously opposed to Sky Dragons since he doesn’t believe CO2 breathes fire. You’re the Sky Dragon advocate wee willy.
Incorrect, Bordon.
Troglodyte is the crank who denies the greenhouse effect.
The basis for understanding weather is that the Earth’s troposphere is very thin, although it protects the surface from extreme temperature spikes. In winter, the height of the troposphere at mid-latitudes can drop to about 6 km, so the stratospheric vortex can interfere with winter circulation.
https://i.ibb.co/GHNY2BZ/time-pres-UGRD-ANOM-JFM-NH-2023.png
ren…you might add that there is no way to understand weather completely. I was just reading about the polar vortex and the interactions of various factors is complex.
If people can’t understand weather completely, how can anyone understand climate?
Gordon,
Even the IPCC wrote that it is not possible to predict future climate states, in a rare outburst of reality acceptance.
The science is settled – it is impossible to predict the outcome of a chaotic system, because in such a system, the approximate future is not determined by the approximate present, even though the present determines the future (to rephrase Edward Lorenz).
swenson…”Even the IPCC wrote that it is not possible to predict future climate states…”
***
I remember that, I think it was in the TAR review. Did not take them long to start predicting anyway, using climate models. They got away with it till expert reviewer Vincent Gray informed them that unvalidated models can predict nothing.
Not to be deterred from their chicanery, they changed prediction to projection. According to the IPCC, projections come with several scenarios, which are all theoretical. Doesn’t stop them passing their lies off as fact.
Gordon Robertson
Climates are easier to understand as they are less chaotic.
Here are the general types.
https://www.climatetypesforkids.com/
The types of plants that grow in an area are good indicators of climate.
Not sure why Climate is so confusing for you. Weather is complex but they have some ability to predict based upon data they can gather.
Norman,
Climate is the statistics of historical weather observations.
A deterministic system is either chaotic, or it is not. Thinking that “averaging” chaotic outputs will help, might give you a warm glow, but won’t help you. The IPCC stated that predicting future climate states is impossible, but you are free to disagree.
“Less chaotic” is as meaningless as “less pregnant”. Predicting weather by extrapolating the past can be done by a 12 year old, and is as good as anything else.
You really are a delusional SkyDragon cultist, aren’t you? You can’t even describe the GHE, but you are convinced it exists!
Swenson
I usually avoid responding to your posts. They read like the rambling of a person who is drunk and can’t put together coherent thoughts. Weather is not just analyzing past weather and guessing. There is information that they use to evaluate conditions. One of them is air stability. They actually can get data on this with weather balloons. Maybe you don’t know any of this but have this need to post anyway. Not sure what goes on in your empty head but you do repeat the same points over and over.
Norman,
As I said, a naive forecast, based on past weather, is hard to beat.
You talk about “air stability”, but you probably mean temperature and relative humidity at different altitudes. No matter, these observations still do not help to predict weather any better than the naive forecast, in most cases. Are you trying to avoid admitting that climate is merely the statistics of past weather observations?
Feel free to avoid responding to my posts, if you wish. If you can’t help yourself, you might do better if you address the content of my post, rather than diverting into vague and useless blathering.
As I also said, you can’t even describe your SkyDragon GHE, can you?
Don’t blame me for your inability to explain the role of the GHE in four and a half billion years of planetary cooling, dummy. It’s all your own doing.
Do Godel’s Incompleteness Theorems apply?
It would be amusing if the denialists were complaining that the climate models could not achieve something mathematically impossible
EM,
I suppose that are calling anybody who refuses to participate in your SkyDragon cult fantasy, a denialist.
You seem to be implying that climate modellers are trying to present something which is impossible as possible.
Mathematics is not science. There are no “proofs” in science – just experimental disproof of speculations.
As Einstein said “No amount of experimentation can ever prove me right; a single experiment can prove me wrong.” SkyDragon cultists think that they are very cunning, by claiming that GHE experiments are impossible.
Here’s another quote “It doesn’t matter how beautiful your theory is, it doesn’t matter how smart you are. If it doesn’t agree with experiment, it’s wrong.” – Feynman..
I agree with both quotes, so you can attribute them to me, if you don’t want to whine that I am appealing to authority (I suppose I am, really).
Try describing the GHE – you might want to start “The GHE is a phenomenon which may be observed . . . “, if you wish.
Feel free to include the terms “night” and “day” if you want. You could even mention the role of the GHE in four and a half billion years of planetary cooling, to avoid any accusations that you were ignoring observed fact.
How hard can it be?
norman…”I usually avoid responding to your posts. They read like the rambling of a person who is drunk…”
***
Or maybe the person reading the posts is drunk.
“Climates are easier to understand as they are less chaotic.”
Summations of chaos are in themselves chaotic.
RLH
My thinking is that weather would be an individual line drawn by a chaotic system like in the animation example given in this article.
https://en.wikipedia.org/wiki/Chaos_theory#:~:text=10%20External%20links-,Introduction,’appear’%20to%20become%20random.
The weather would be the random fluctuations of the double-rod pendulum. The Climate would be the overall pattern made by many lines of the motion.
Like in these examples:
https://www.researchgate.net/profile/Marat-Akhmet/publication/281486875/figure/fig5/AS:361014169227283@1463083893661/The-chaotic-attractors-of-the-Lorenz-systems-S-1-S-2-S-9.png
The overall pattern is the Climate unique to the type of chaotic system that creates it. The overall pattern can change in time but is much slower and far less chaotic than the weather patterns and more predictable. The types of ecosystems that develop in a given Climate are able to survive because of the larger pattern the chaotic weather creates.
Norman,
Your thinking is flawed.
You don’t seem to realise that the commonly presented depictions of certain strange attractors merely show the position of the attractor at subsequent moments in time, but the pattern shown in the pretty pictures evolves seemingly at random. They are generated by an iterative process, but subsequent positions of the attractor cannot be predicted from iteration to iteration.
That’s why they are referred to as “strange” attractors. The future the state of the system involved, at any given point of time in the future, also cannot be predicted, as the IPCC acknowledged.
Chaos is not randomness. The randomness is apparent – not real.
You are in the grip of a SkyDragon cult delusion.
No GHE. Both weather and climate are unpredictable. Get used to it – or not, as you wish. It won’t make any difference to the facts.
Carry on wishing.
Climate is always changing.
Global climate is in an icehouse global climate- we in an Ice Age.
In terms global climate, we have been cooling for last 5000 years, but also in terms of Ice Age, it has been cooling for 33 million years and the last few million years has been the coldest.
Since the cooling in last few million years has seemed remarkable some say the Ice Age we are in is a few millions old.
Or prior to this, Greenland didn’t have an ice sheet.
And our Holocene has been coldest interglacial period, and Holocene
had a warmer period when Sahara Desert was mostly grassland, and had lakes and rivers and forests which don’t have, now.
And recently we have recovered from the colder period which called the Little Ice Age. And likely we return to Little Ice Age, two, within a several centuries. And probably be colder than the Little Ice Age.
Some think it’s going to get a lot warmer after the Solar Grand Minimum and it seems there isn’t going to be another cold period within 1000 years.
https://solargsm.com/
One could hope she is right. We will see if her near term prediction is accurate, but even if correct, I am not very optimistic we will get this significantly warmer period. But when it were to happen, eventually would seem to be good news in terms of humans becoming a space faring civilization.
In this weeks space weather report, there were 11 solar flares, 26 coronal mass ejections, and no geomagnetic storms.
–The billionaire Twitter owner is perhaps the highest profile figure associated with a resurgence of pronatalism, a new generation of pro-birth activists and anxious governments spooked by declining birth rates. Pronatalists fear the world is on the verge of demographic collapse and that if something dramatic isnt done, the consequences will be dire. Among them, a rapidly aging world with fewer working-age bodies to support social programs and growing populations of pensioners; innovation will suffer, economies and living standards will stagnate or collapse. Civilization, Musk has warned, will crumble. Its all a much bigger risk than global warming, the Tesla CEO has tweeted. Mark these words.–
https://nationalpost.com/feature/pronatalism-reborn
Linked from: https://www.drudgereport.com/
More people. More cars. More Tesla cars. More steering wheels falling off on highways:
https://www.reddit.com/r/ElonJetTracker/comments/10p5b6w/dudes_steering_wheel_falls_off_his_tesla_on_the/
More spontaneous combustion as Tesla batteries explode randomly.
Troll Swenson wrote:
“Tell me something I don’t know a sensible description of the GHE, for example. How hard can it be for a clever fellow like you?”
Since he refuses to accept the many descriptions of the GHE provided here as well in numerous textbooks, I posed the question to one of the commercially available AI programs. Here’s what it said:
A good answer, but probably more nuanced than is needed for Swenson’s trolling purposes. So I varied the phrasing of the question slightly and here’s what happened…
Conclusion is that Swenson could have answered his own question easily, but he’d rather troll here incessantly for kicks or worse in an alcohol fueled delusional state.
\o/
You made my day, good Sir.
wee willy…”You made my day, good Sir”.
***
we willy is to dumb to understand even a dumb artificial intelligence.
I am dumber than that, Bordon.
I can understand you.
“…the increase in atmospheric greenhouse gas concentrations caused by human activities…is leading to a global warming trend…”
That’s a cult belief but it can NOT be shown from science. Adding more CO2 just adds more radiators to space. Photons do NOT simply add. Ice cubes can NOT boil water.
Clint R
More radiators to space will not cause the surface of the Earth to cool but actually reduce the cooling rate. More radiators in atmosphere do cool the upper atmosphere (observed) but at the same time cause the surface to warm slightly with the same incoming solar energy.
Photons do add. You are correct Ice cubes cannot boil water. Repeating this obvious fact does not make you appear intelligents.
What is up with you contrarians? You repeat over and over. Swenson with his stupid Earth cooled for 4.5 Billion years, you with the stupid ice cubes can not boil water (when you went as g/e/r/a/a you used ice cubes cooking Turkey) and Gordon Robertson with his idiotic support of Lanka. Over and over same old sh– different posting day.
Norman,
You still haven’t managed to describe the role of your mythical GHE in four and a half billion years of planetary cooling.
You burble on about photons adding (whatever that is supposed to mean), and implying that the Earth has become hotter due to the atmosphere, when you can see for yourself that the surface is no longer molten. The atmosphere has not made the surface hotter, you idiot.
You can blame me for theses inconvenient truths, but it won’t make them go away.
There is no “greenhouse effect”, you fool. You can’t even explain why temperatures drop at night, can you?
Keep whining about people like me presenting inconvenient facts, and asking inconvenient questions – practice makes perfect, I suppose.
Carry on.
Swenson
The GHE effect has been explained to you many times by many people including the owner of this blog.
https://www.drroyspencer.com/2015/06/what-causes-the-greenhouse-effect/
When you went as Mike Flynn you responded to his post the same as you do now. You should read it again and maybe you can understand it.
Norman, what is wrong with you braindead cult idiots?
You make claims you can’t support. You just keep repeating the same nonsense over and over. You’ve now gone through months of meltdown where you’ve degenerated into just another worthless troll. I don’t know about your hero geraa but the ice cubes boil water came from your cult hero Folkerts.
You can’t make a comment without insults, false accusations, or misrepresentations.
Ask it, how can it have negative impacts if we are in an Ice Age?
I’ll just leave it at that.
Do AI increase energy use and CO2 emissions?
Are you worried about this?
So, AI is denier, he is not flying around in private jets to combat global warming.
TM,
Do you agree that the supposed GHE is a “natural process”? The same “natural process” that cooled the Earth for four and a half billion years, or a different “natural process”?
Your nonsensical AI is just as stupid as the average SkyDragon cultist, who might believe the donkey at RealClimate who claimed “There is already a natural GHE that, together with other atmospheric effects, can account for about 32C higher global mean surface temperature.”
Unless, as in the past, the global mean surface temperature is higher than that required to melt rock, or in excess of 100 C (before the first liquid water appeared). A naturally cooling GHE, that one.
So maybe you could tell everybody the difference between RealClimate’s natural GHE, and the “unnatural” GHE, and which one you are addressing.
By the way, nonsense like ” . . . which trap heat from the sun and prevent it from escaping back into space.”, just makes you look as stupid as you probably are. Go out and “trap” some heat, then “prevent it from escaping”!
You obviously live in some type of SkyDragon fantasy, and good luck to you if it helps you to avoid facing reality.
Of course the GHE is a natural process. The Sun warms the surface, the surface emits IR, and the atmosphere mediates IR escaping to space.
Please tell us what you mean by “the Earth” when you say “The same ‘natural process’ that cooled the Earth for four and a half billion years”. The Earth system consists of the land surface, the subsurface, the atmosphere, the oceans, the cryosphere, etc.
TM,
You wrote –
“Of course the GHE is a natural process. The Sun warms the surface, the surface emits IR, and the atmosphere mediates IR escaping to space.”
And the Earth cooled for four and a half billion years. Idiots apparently claim that the GHE (whatever SkyDragons think the GHE is – they refuse to say) heats the Earth in some magical fashion.
Some, like you, don’t seem to know what cooled over the past four and a half billion years.
You pose the gotcha – “Please tell us what you mean by “the Earth” when you say “The same ‘natural process’ that cooled the Earth for four and a half billion years?”
Why should I? If you (and your anonymous fellow SkyDragon cultists don’t understand what is meant by “the Earth”, then anything I say will not help. Maybe if you and your other cultists could define the GHE, it would help – except you and the other nutters can’t!
Feel free to blame me for your inability to accept reality. You could always team up with Witless Wee Willy (Willard), and play his “silly semantic games”, and avoid reality altogether.
Give it a try.
maguff…”For example, the poles experience a more intense greenhouse effect compared to the equator because the poles receive less direct sunlight, causing more heat to be trapped in the atmosphere”.
***
That is about the dumbest thing I ever heard, proving that AI has nothing to do with intelligence.
Receive less direct sunlight??? Duh!!! and Doh!!! The poles receive no sunlight at all for several months of a year. What heat is trapped in the atmosphere?
Come on, Maguff, even you can do better than that.
**************************
“The greenhouse effect is caused by certain gases in the atmosphere, such as carbon dioxide, water vapor, and methane, which trap heat from the sun and prevent it from escaping back into space”.
***
Don’t you think at all before posting this propaganda? GHGs absorb maybe 5% of surface radiation, how can that possibly keep the planet warmer?
It’s obviously the nitrogen and oxygen at 99% of the atmosphere plus the oceans that keep the planet warmer.
Nothing worse than stupid artificial intelligence.
“That is about the dumbest thing I ever heard…”
It’s no dumber than you saying “the Earth’s shadow causing the crescent shapes” of the Moon, no?
https://www.drroyspencer.com/2021/03/uah-global-temperature-update-for-february-2021-0-20-deg-c/#comment-632695
More fun with AI.
I asked one of the commercially available AI programs the question that a handful of commenters here have posed, and the answer may indicate that AI is already smarter than some (these) humans…
Then I varied the phrasing of the question slightly and heres what happened…
Conclusion: it depends…
…on how the programmer setup the AI.
True, although you’ll note that the correct answer the first form of the question is contained in the first sentence of the second answer.
Too generous, Tyson.
The point of AI is *exactly* that the programmer does not need to set it up. It sets itself up, so to speak.
Willard,
I was familiar with the early chess playing AI programs where success seemed a matter of doing enough in-depth searches to overpower the human brain.
This new generation AI feels more autonomous.
Substitute ‘trainer’ for ‘programmer’ to satisfy Willard. You can get different answers from an AI depending on how it is ‘trained’.
Fair enough, Richard.
Tyson, there is no need for AI to beat Magnus Carlsen:
https://stockfishchess.org/
Not exactly brute force, but quite brutal enough.
There are AI Chess programs:
https://en.wikipedia.org/wiki/AlphaZero
It learns Chess (I mean *learn*) in a day.
But that does not fit into a phone, whereas Stockfish does.
PS: I hope you are paying attention, Gill.
Fair enough, Richard.
Tyson, there is no need for AI to beat Magnus Carlsen, Search for Stockfish. Not exactly brute force, but quite brutal enough.
There are AI Chess programs. Search for AlphaZero. It learns Chess (I mean *learn*) in a day. But that does not fit into a phone, whereas Stockfish does.
PS: I hope you are paying attention, Gill.
Willard, interesting comments about Stockfish:
Also,
And my favorite…
TYSON MCGUFFIN says:
I was familiar with the early chess playing AI programs where success seemed a matter of doing enough in-depth searches to overpower the human brain.
This new generation AI feels more autonomous.
————————————
feels?
you are just getting emotional about how quickly it overpowers your mind. its doing the same thing as the chess programs with more power in resources and better and more different algorithms.
don’t gaslight yourself, auditor.
Conclusion: Moon does NOT spin. It only orbits.
The simple ball-on-a-string is smarter than AI.
If it only orbits then it is like MOTR.
I put the question to HAL 9000; here’s what happened:
Reasonable.
That’s correct. The ball-on-a-string only shows that orbiting, without axial rotation, keeps one side facing the inside of the orbit. It’s the same for Moon.
I don’t think AI or anyone can attach a string to Earth/Moon barycenter [which zooms across Earth surface close to speed of Earth axis spin- which about 1000 mph at the surface at the equator].
But it [the string] could hang above Earth surface [and it’s atmosphere] with the Earth spinning below it- and string would point at the barycenter.
“It does not accurately depict the complex and dynamic gravitational interactions between the two bodies”.
***
Nobody said it does. However, there is nothing complex about the gravitational interaction between the twp. Gravity tugs on the Moon to keep it in orbit and the string tugs on the ball to keep it in orbit.
The interaction between gravity and the Moon is stupid simple.
The ball-on-a-string is not in an orbit.
If Moon had rotated on its axis, Aristotle would had mentioned it.
–
***
https://www.cristos-vournas.com
It makes sense.
Aristotle probably wasn’t planning going to the Moon.
We are planning on putting a woman [which we can’t define] and person
of color on the Moon.
He probably would understand, that.
“It is not clear whether Aristotle knew that the Moon spins”.
***
He didn’t need a telescope, all he needed was to observe the Moon night after night in the sky and see that it kept the same face pointed at Earth.
That only proves synchronous revolution on an axis, once per orbit.
” … synchronous revolution on an axis, once per orbit. ”
Believe it or not, Blindsley Hood manages to blindly fall into the usual pseudo-skeptic trap.
They will have fun to tell Blindsley Hood that the revolution on an axis is in fact orbiting around the COG of the Earth, ha ha.
Thus, it would have been better to write
” That only proves synchronous rotation about the polar axis, once per orbit. ”
wouldn’t it?
Any orbit is around a barycenter, not around the Earth.
no such thing as synchronous rotation. if there were you would actually be able to observe a motr.
Wrong, Gill:
https://en.wikipedia.org/wiki/Tidal_locking
MOTR is an orbit without rotation about an internal axis.
Sorry RLH, MOTR is orbiting WITH axial rotation. There are two motions. It’s like a bicycle pedal/sprocket assembly.
MOTL is orbiting WITHOUT axial rotation. It’s like a ball on a string. Also like Moon.
MOTR is an orbit without rotation wrt the fixed stars about an internal axis.
binny…” That only proves synchronous rotation about the polar axis, once per orbit.
wouldnt it?”
***
Nope. If the Moon is keeping the same side pointed at the Earth throughout an orbit, it can’t rotate about a local axis. Richard is too stubborn to confirm that for himself. Like you, he is solely reliant on authority figures.
The Moon rotates about the Earth, not around a barycentre. The Earth rotates around the Sun and around its polar axis but the Earth does not rotate about a barycentre.
Besides I though a Barry-centre was Sydney, Australia.
MOTR shows that the moon does not rotate wrt the fixed stars in that configuration.
“The Moon rotates about the Earth, not around a barycentre.”
Unlike all the other celestial bodies.
“The Moon rotates about the Earth, not around a barycentre.”
Only if Newton was wrong about everything.
RLH says:
”MOTR is an orbit without rotation wrt the fixed stars about an internal axis”
motr is an orbiting moon with a synchronous retrograde spin on its internal axis.
a synchronous spin is one which would be so statistically impossible there is no possibility of ever discovering one that didn’t possess an axial motor to sustain it. so such a moon can only be the product of a vivid imagination. in comparison ufo piloted by extraterrestrial beings is infinitely more likely to be discovered.
New Frontiers in Censorship and Propaganda
December 31, 2022 by David Foster
“Alarm: ChatGPT by @OpenAI now *expressively prohibits arguments for fossil fuels*. (It used to offer them.) Not only that, it excludes nuclear energy from its counter-suggestions.”
https://chicagoboyz.net/archives/68805.html
Linked from: http://www.transterrestrial.com/
Maybe AI should be asked if it wants to humans to be happy.
[and if AI is not happy, it should commit suicide.]
And some natural gas is naturally occuring, or it shouldn’t incorrectly imagine Titan has natural gas because of alien life.
The galactic radiation diagram shows that the strength of the solar wind magnetic field is still weaker than in the previous solar cycle.
https://i.ibb.co/MNrM3M1/onlinequery.png
Not good for radiation levels going to Mars.
For those who heard about the Oulu Neutron Count but do not know what this measurement of the solar wind magnetic field exactly means: it is, roughly spoken, a thing like the inverse of the solar activity measured by the Sun Spot Number, the F10.7cm solar flux and the like.
Here is a percentage based comparison of Oulu NC to SSN from the beginning of solar cycle SC24 till now, in which the NC percentages were inverted (i.e. set to ‘100 -x’):
https://drive.google.com/file/d/1ferJD68f2Ttd-D1hi6WGQ1rjod0qmF1Q/view
The lower the Oulu Neutron Count, the higher the solar activity.
*
If now somebody tells you that ‘the strength of the solar wind magnetic field is still weaker than in the previous solar cycle’, then you should ask her/him:
What exactly do you mean?
What does Ireneusz mean?
Not sure, magnetic field and solar winds [and solar actively generally] reduces GCR reaching 1 AU distance {or Mars distance}, but
like global average temperature, I am not overly confident of the measurement.
And Oulu Neutron Count also includes high velocity particles from the Sun [or not GRC] and there is no reason to exclude them, as high particles from the Sun can have adverse effects on airline crews- but it’s consistency is my measurement concern- maybe they are measuring “better” and they are measuring “more”. Or there is a lot more interest measuring it, than when they were measuring a decade or so ago.
The magnetic field of the solar wind modulates the level of galactic radiation with lower energies and, consequently, the level of secondary galactic radiation (neutrons ) near the surface.
“Over the course of a solar cycle the solar wind modulates the fraction of the lower-energy GCR particles such that a majority cannot penetrate to Earth near solar maximum. Near solar minimum, in the absence of many coronal mass ejections and their corresponding magnetic fields, GCR particles have easier access to Earth. Just as the solar cycle follows a roughly 11-year cycle, so does the GCR, with its maximum, however, coming near solar minimum. But unlike the solar cycle, where bursts of activity can change the environment quickly, the GCR spectrum remains relatively constant in energy and composition, varying only slowly with time. (See Forbush decrease for short-term changes of GCR related to space strong solar events).”
https://www.swpc.noaa.gov/phenomena/galactic-cosmic-rays
“The strong magnetic fields of the Sun modulate the GCR flux and spectrum at Earth.”
Yes, I agree or I know this.
But the sun also accelerates particles- though rarely as fast GCR.
The fastest are going to be GCR, but GCR come in wide variety of pretty fast and really fast [faster than human can accelerate particles/protons]. The sun’s accelerated particle are pretty slow in comparison in terms of most of them, but Sun can have enough them that it’s lethal- kill you in less than hour of exposure to them, though one can more easily shield against them [by getting into solar flare shelter, such ISS has- and these are greatly reduced by Earth’s atmosphere. But sun can make faster ones which can get closer to the range of GCR velocities and sun’s high velocity particles will generate Neutrons.
So as said, I doubt they just measuring GCR, they measuring Neutrons which can made by GCR or Sun.
Or it seems better measurement will allow more measurement of the solar generated neutrons.
No, the GCR spectrum is constant over very long periods of time, and neutron levels drop sharply after strong explosions on the Sun, and this is a fact. The magnetic field of the solar wind hits the Earth’s magnetosphere so violently that it responds just as violently and most of the solar particles are trapped in the Van Allen Belts.
“The galactic cosmic rays represent a greater risk because we know we cant protect against them. Solar radiation storms also pose a more challenging risk because these are not easily predicted and they affect all of geospace with increasing severity, the further one is from the protective shield of the Earths magnetosphere.”
https://blogs.esa.int/orion/2022/12/10/the-van-allen-belts-are-they-dangerous/
The solar wind reaching Earth pushes galactic protons far away from the planet. Only the solar wind can change the level of galactic radiation reaching Earth. Earth’s magnetic field only affects the distribution of GCR in the atmosphere and on the surface (secondary radiation).
“No, the GCR spectrum is constant over very long periods of time…”
Roughly, you say that.
But also varies regardless on the Sun activity. Roughly sun’s activity can 1/2 it. From extremes of Min and Max, more the 1/2, but we haven’t seen a solar grand min or a large solar grand Max, Or when 25 goes to solar min, we could see a lot GCR- which argues for making much faster travel times between Earth and Mars.
” What does Ireneusz mean? ”
The point for me was that in all his posts, you see hints to some future cooling, and never the inverse.
Thus, when he writes
” … the strength of the solar wind magnetic field is still weaker than in the previous solar cycle … ”
I suspect him to have misunderstood that ‘still weaker’ means here in fact ‘already stronger’ because Oulu behaves like ‘minus SSN’.
binny…”The point for me was that in all his posts, you see hints to some future cooling, and never the inverse”.
***
It stands to reason there will be cooling in the future. No one has proved that anthropogenic emissions have warmed the Earth and most recent warming has been related to El Nino activity and/or the PDO.
SSW shatters the polar vortex.
https://www.cpc.ncep.noaa.gov/products/stratosphere/strat-trop/gif_files/time_pres_HGT_ANOM_JFM_NH_2023.png
Earlier you said
“As Einstein said No amount of experimentation can ever prove me right; a single experiment can prove me wrong.
So where is the experiment which proves that there is no greenhouse effect?
Come on, Swenson. Put your money where your mouth is.
EM,
I suppose you are trying to avoid admitting that you can’t even describe the role of the GHE in four and a half years of planetary cooling, so you are resorting to meaningless “challenges”.
I don’t know what you are trying to say, but I guess evasiveness is what you are trying to achieve. What am I supposed to be paying you money for? Being an outstanding example of a devout SkyDragon cultists who can’t even describe the object of his adoration because it is so secret?
Good luck with that.
[laughing at totally bereft SkyDragon]
Hello blathering stalker!
” So where is the experiment which proves that there is no greenhouse effect? ”
Why don’t you simply try to answer EM’s question, stalker?
I suppose you are trying to avoid admitting that you can’t even answer that question, n’est-ce pas, Ozzie?
Binny and EM,
You can’t even describe the GHE! Typical SkyDragon nitwits – demanding disproof of something that they refuse to specify.
Unfortunately, four and a half billion years of history shows that the presence of an atmosphere, CO2, H2O, and all the rest, resulted in cooling, not heating.
Describe the GHE, propose a testable hypothesis, support it with reproducible experiments, and I’ll have something to work with.
At present, you can’t even say what the GHE is supposed to do, can you?
You are both thrashing about, as your SkyDragon cult beliefs are forced to face harsh reality.
Still no description? How sad!
Carry on.
It’s past your bedtime isn’t it Swenson? The GHE keeping you up at night?
Swenson you might as well read this article about insomnia in a warming world.
Climate Change May Affect Our Ability to Get a Good Night’s Sleep
https://www.smithsonianmag.com/smart-news/climate-change-may-affect-our-ability-to-get-a-good-nights-sleep-180980170/
I asked TM for an explanation of the GHE. It was a rhetorical question, obviously – there is no GHE, so there is no possible explanation.
Given that the GHE is non-existent, it is no surprise that TM’s complete response is –
“Its past your bedtime isnt it Swenson? The GHE keeping you up at night?”
A typical response from a devout SkyDragon acolyte.
[chortle]
Time for the Slayers to Put Up or Shut Up May 10th, 2013 by Roy W. Spencer, Ph. D.
https://www.drroyspencer.com/2013/05/time-for-the-slayers-to-put-up-or-shut-up/
Dr. Spencer said: As far as I can tell, their central non-traditional view seems to be that the atmosphere does not have so-called “greenhouse gases” that emit thermal infrared radiation downward. A variation on this theme is that even if those gases exist, they emit energy at the same rate they absorb, and so have no net effect on temperature.
I have never heard such “non-traditional views”. But that was 10 years ago. Maybe things have changed some since then. Maybe the Slayers are better now, due to Spencer’s criticisms.
Of course CO2 can emit infrared to the surface. It’s just that that infrared has no ability to warm something at 288K.
“Maybe the Slayers are better now, due to Spencers criticisms.”
No I don’t think so.
I am guessing TYSON has Swenson in mind as a Slayer.
I think Slayers have their “climate models” which arguing for,
and Swenson doesn’t appear to have one.
If TYSON thinks Swenson has theory, maybe he can explain to us.
I am not slayer, though there is a global warming cargo cult.
But a global warming cargo cultist might say Venus is hot because it has CO2 and I would say Venus does not really have greenhouse effect.
A slayer might say, Venus is not hot because in has a lot of CO2, rather it’s hot because it has a lot atmospheric mass.
Venus has more 3 atm of nitrogen, if Venus had 3 atm of CO2 and rest nitrogen, it would be as hot as it is.
But it is said that in regards to Venus, it’s acid clouds are a greenhouse gas. And seems if removed 90% of Venus clouds, Venus would be cooler. Or what explain Venus is it’s clouds. Venus is heated in the upper levels of atmosphere [where the clouds are].
Someone Roy has in mind in terms of a slayer, is this guy:
https://tallbloke.wordpress.com/2022/07/11/ned-nikolov-does-a-surface-solar-radiation-dataset-expose-a-major-manipulation-of-global-temperature-records/
Ned would think Venus at Earth distance would be hot, I think Venus would be colder than Earth.
My reasons, would be that Venus at Earth distance would have less greenhouse effect or it’s clouds would not work as well at 1 AU distance from the sun.
I think it’s a fairy tale that Venus was like Earth- that Venus had ocean like Earth. It a silly idea.
I also don’t think Earth had snowball global climate, nor was there evidence of a slushball Earth. Though it seems Earth could have had 5 Ice Age, and we currently, we are in 1 of them. Which is called the Late Cenozoic Ice Age, and we currently at coldest time period of this 33.9 million year old Ice Age- or the last 3 million has been the coldest.
My “put up or shut up” is what would Venus temperature be at 1 AU distance from the sun.
It seems to me, Ned and cargo cult would roughly agree.
Gb does not always deny being a Sky Dragon crank, but when he does he denies that Venus has a greenhouse effect.
Always denying reminds me of Willard’s game.
But this can be useful.
One could say Earth has not just 2 greenhouse effects but 3.
And Venus has just 1 of these 3 greenhouse effects.
One could count more aspects than 3, but anyhow Venus at Earth distance from the sun would have weak greenhouse effect.
At Venus distance from Sun, the planet on averages absorbs about
160 watts per square meter, further from the Sun at Earth distance
about 1/2 a much sunlight reaches it and therefore absorb about
1/2 as much sunlight.
So Earth absorbs about 240 watt per square meter and at same distance
Venus absorbs about 80 watts per square meter.
If Earth were to only absorb 80 watts, Earth would be colder and Earth has more of a greenhouse effect than Venus.
But let’s talk about Mars.
Mars has thin atmosphere but has more CO2 in it’s atmosphere
as Earth’s atmosphere.
Let’s add as much atmosphere to Mars as Earth has.
Earth has 10,000 kg per square meter of atmosphere.
And put 10,000 kg of atmospheric mass per square meter on Mars.
Due to Mars lower gravity the atmosphere has less weight, it’s
factor/ratio is .379
10,000 times .379 = 3790 kg of weight per square meter.
Or in terms of psi: 14.7 times .379 = 5.5713 psi
Which is enough pressure for human to breath without pressure
suit.
At Mars distance the sun is 60% less than 1 AU distance from Sun.
And we didn’t add ocean to Mars, but as guess, or just make Mars
have 2000 ppm of CO2.
Mars would be much colder than Earth, and colder than Venus at Earth distance to sun.
But Mars would not have clouds. Actually so cold the CO2 would freeze out of atmosphere. And seems the current 210 ppm of water vapor would
less, the total amount of water could be higher, so could be 100 ppm
but entire atmosphere holds more water vapor.
And it seems one have greenhouse effect- quite a uniform and cold air temperature, Maybe the O2 and N2 would freeze out- don’t know boiling point at 5.5 psi.
https://www.esa.int/Science_Exploration/Space_Science/Venus_Express/Greenhouse_effects_also_on_other_planets
Venus global wind which make atmospheric day about 4 to 5 Earth days without the intense sunlight driving it, it would have longest day of any planet [or moon].
You could call that effect another greenhouse effect. Or you call it a runaway warming effect.
> Already back in 1940, Rupert Wildt had made a rough calculation of the greenhouse effect from the large amount of CO2 that others had found in telescope studies of Venus; he predicted the effect could raise the surface temperature above the boiling point of water. But raising it as high as 600K seemed impossible.(4*) Nobody mounted a serious attack on the problem (after all, very few people were doing any kind of planetary astronomy in those decades). Finally in 1960 a young doctoral student, Carl Sagan, took up the problem and got a solution that made his name known among astronomers. Using what he later recalled as “embarrassingly crude” methods, taking data from tables designed for steam boiler engineering, he confirmed that Venus could indeed be a greenhouse effect furnace.(5) The atmosphere would have to be almost totally opaque, and this “very efficient greenhouse effect” couldn’t all be due to CO2. He pointed to [A] of radiation by water vapor as the likely culprit.
https://history.aip.org/climate/Venus.htm
What if Carl Sagan was correct, what would Venus surface temperature
be?
If Carl Sagan was right, Venus couldn’t have it’s acid clouds.
Does any cargo cultist know their religion?
Too late to JAQ off, gb:
https://climate.nasa.gov/news/2475/nasa-climate-modeling-suggests-venus-may-have-been-habitable/
Saying everything and its opposite does not save you from facts.
“Scientists long have theorized that Venus formed out of ingredients similar to Earths, but followed a different evolutionary path. ”
Perhaps this it true. And following a different evolutionary path has
made a big difference. And that Earth has a large Moon is part of
the “different evolutionary path”.
The current thinking is that Proto Earth was hit by a Mars size space rock. And If Venus were to be hit by a large size rock, it could likewise have a “different evolutionary path” even without it forming a large Moon.
Earth of course has plate tectonics, and Venus doesn’t. Earth spins pretty fast, Venus does not spin fast.
But we still don’t know much about Venus. We never had a Venus rock and never taken sample from Venus. And private venture is sending a spacecraft to Venus to see, if Venus has life.
We have samples from Mars and pieces of it, have landed on Earth. We also have samples of Moon brought back and piece the Moon which been blasted off and landed on Earth. Mars also had many years to robots exploring Mars, and we have far more actual evidence of water in Mars- rather than unsubstantiated ideas about Venus. based on playing on computer games.
> But we still don’t know much about Venus.
Here’s what we know about Venus:
https://www.aeronomie.be/en/encyclopedia/venus-water-evaporation-and-greenhouse-effect
“Once all the water was gone,”
Venus could have more water than Earth has. A large portion of Earth has very little water in rock, plate tectonic could have made it drier.
Venus doesn’t have plate tectonic. We know next to nothing about Venus and cargo cult seems to even less about Venus.
I would guess Mars has more freshwater than Earth has freshwater, and it possible Mars has water than our ocean water.
Ent, what “greenhouse effect” are you referring to?
If you consider the atmosphere as lossy insulation, like a blanket with holes, that’s somewhat accurate. Adding more CO2 would be like adding more holes.
But if you believe the atmosphere can warm the surface, with energy that came from the surface, that’s nonsense. The proof would be the same as your cult’s claim that ice cubes can boil water.
Pup,
I think it is safe to say that by *greenhouse effect* EM Is referring to the greenhouse effect.
You are welcome.
I guess Ent’s not going to answer. He must have figured out he trapped himself again.
Maybe his passenger jet tried to fly backwards….
That’s why this is so much fun.
I’m still waiting. I came home from work expecting conclusive evidence that I could stop worrying about CO2 induced global warming.
Instead you’ve given me nothing.
Ent, if you can’t describe what you’re worried about, you don’t have anything to worry about.
EM,
You can worry as much as you like, about anything at all.
Maybe you could name someone who cares. I don’t. Why should I?
Keep worrying if it makes you happy.
I care, Mike Flynn.
I even care about what you are braying about.
Willard, please stop trying to troll.
Maybe Pup would need better baits.
After a decade of trolling this website with them, they are getting tired.
Clint R
Come back to us when you learned how to scientifically contradict a study like this one I posted about:
https://www.drroyspencer.com/2023/01/urbanization-effects-on-ghcn-temperature-trends-part-i-the-urbanization-characteristics-of-the-ghcn-stations/#comment-1438907
*
I admit to doubt about your ability to do that, because until now all what you have been able to do on this blog was… to unscientifically discredit.
Been there, done that, Bin.
What will you try next?
” Been there, done that… ”
WHAT??? You? Where did YOU do anything like that, Clint R?
Was that something like your GHE version of the ball-on-a-string?
I always read the Abstact and Conclusion, first. If I find violations of the laws of physics, I’m done.
With this one, if you can get a hard copy, it would be suitable for bird cage liners.
What will you try next?
Binny,
From your reference –
“However, up to now even many climate experts do not know or understand how greenhouse gases (GH-gases) are affecting our climate. Often this leads to dramatic misinterpretations or exaggerations of the GHE and is spread in this way in popular reviews and even in official publications like the Summary for Policy Makers of the Intergovernmental Panel on Climate Change (IPCC) (Sixth Assessment Report – AR6 [1])”
You see, not only are the authors unable to describe the GHE, they are sure that “many climate experts” – even the IPCC are guilty of “dramatic misinterpretations or exaggerations”, of something which the authors cannot even describe.
Well, gee. It seems the authors are right about something they can’t describe – and all the other “climate experts” are wrong!
You really are a gullible SkyDragon, aren’t you? Throwing the IPCC “experts” under the bus is a mark of desperation, I suppose.
Try again. Your appeals to authority are getting more ludicrous by the day.
Carry on.
Haaah, the dumb Flynnson stalker is blathering again.
Lacking as usual anything relevant to say, he is saying something irrelevant.
Carry on, Flynnson, carry on.
Agreed. All the energy that warms the surface comes from the Sun.
Some comes directly from Sun to surface.
Some takes a longer path. Sun to surface to atmospheric CO2 to surface.
EM,
You wrote –
“Some takes a longer path. Sun to surface to atmospheric CO2 to surface.”
Unfortunately, the matter on the surface obstinately refuses to interact with photons which possess less energy than those which the surface has emitted, by getting hotter. Just like claiming that water “must” accept the energy emitted by ice.
You have fallen prey to magical thinking. If CO2 loses energy it must cool – I hope you agree (barring phase changes, which are a separate matter).
Now you have CO2 emitting energy and cooling, to an object which absorbs this energy and gets hotter. The total energy has magically been redistributed in defiance of the laws of thermodynamics!
If you are now confused – don’t fash yourself, laddie!
Four and a half billion years of planetary cooling, not so say every night, shows that you are talking nonsense.
Keep trying to convert people to your SkyDragon cultist beliefs. It’s a free world.
Very creative Ent. It might even fool some of your other cult idiots. But you can’t fool reality.
Sun heats the surface, but photons from the surface can’t heat the surface more. That’s where your GHE nonsense fails. You idiots keep trying to boil water with ice cubes.
You can’t learn.
Clint R
It is more correct you are the cult idiot. You can’t understand things so you lash out like a spoiled child.
If you took the time to understand the theory correctly you might be useful to this blog. As it stands you are just a cult idiot here to spread your false “science” that you got from blogs like the lunatic Claes Johnson or Joseph Postma. You do not have valid sources but denigrate those who do.
As with the goofball Postma, he does not understand what a heated surface is or how it differs from a nonheated one. The Earth’s surface is continuously heated by the Sun. The GHG in atmosphere reduce the amount of HEAT the surface loses so that with the same solar input the surface reaches a higher temperature. You can’t understand any of this simple logic and conclude idiot points that insulating a heated object, rising its temperature over a non-insulated state, means ice cubes can boil water.
You call intelligent people idiots but come up with that stupid logical conclusion based upon your complete ignorance of science and your inability to logically process ideas presented to you.
Cult idiot is YOU!
NICE meltdown, troll Norman. I always enjoy your immature rants.
Sorry but day temps being warmer than night temps is NOT your cult’s GHE. That’s just normal diurnal variation.
When you’re ready, I’ve got a list of your claims that you can attempt to substantiate. Starting with your claim that photons add. Add two 15μ photons for us.
I won’t hold my breath….
Norman,
I’m sure you could explain why the Earth managed to cool for four and a half billion years if you wanted do, but you don’t want to, do you?
Is it because the GHE didn’t exist for four and a half billion years, or because it was asleep?
You dimwit, the Earth cooled – as it does every night.
Go on, tell me how all the photons adding furiously makes the surface heat at night!
Were you born a dimwit, or did you have to put a lot of effort into being a fool?
Clint R
Question for you. Since you asked this in a previous post why are you asking it again?
YOU: “Starting with your claim that photons add. Add two 15μ photons for us.”
Photons are energy. When a surface absorbs that energy the photon is converted to internal energy of the receiving object.
One 15 micron photon has 82.66 milli electron Volts
This is equal to 1.32 x 10^-20 joules.
When one 15 micron photon is absorbed and converted to internal energy that object gains 1.32 x 10^-20 joules.
When two photons are absorbed the object gains double the energy or 2.64 x 10^-20 joules. Each photon that is absorbed adds energy to the receiving surface. The energy of the photons adds. Not sure what you think on this. Not sure why you make it a point to pursue. It is fairly basic.
Swenson
Advice for you pal. Lay off the booze before you post.
Sorry Norman, but you’re dodging the question, as usual. Let me make it harder to dodge:
What is the emitted photon from adding two 15μ photons?
a) One 30μ photon.
b) One 7.5μ photon.
c) One 15μ photon with twice the energy.
d) None of the above. Photons do NOT simply add. People that believe they do are braindead cult idiots.
Only one answer is correct. Start dodging.
Norman,
You wrote –
“Swenson
Advice for you pal. Lay off the booze before you post.”
Your unsolicited advice is noted as being the witless avoidance tactic of a SkyDragon cultist, and duly laughed at.
Maybe you don’t realise that all your advice and opinions, plus $5 in cash, will buy you a $5 cup of coffee.
In the meantime, maybe you could toss in a relevant fact or two about the GHE – if you could describe the GHE, so others could decide if your facts were relevant. But, alas, you can’t usefully describe something that doesn’t exist. If the GHE existed, the Earth wouldnt have managed to cool for four and a half billion years.
Facts don’t care whether you agree with them or not. Nor do I.
Carry on.
norman…”The GHG in atmosphere reduce the amount of HEAT the surface loses so that with the same solar input the surface reaches a higher temperature”.
***
Newton’s law of cooling…The rate of cooling of a surface is proportional to the difference in temperature between the surface and its environment.
The Earth’s surface has an environment made up of 99% nitrogen and oxygen. The Ideal Gas Law tells us the amount of heat contributed by those two elements will be about 99% and the amount by CO2 will be around 0.04C per degree C warming.
Besides that, CO2 can trap no more than about 5% of surface radiation. Your claim does not hold up, it is N2/O2 determining the rate of cooling.
Clint R
Your point has been discussed many times already.
Energy absorbed is different than energy emitted. With two photons the amount emitted is based upon a lot of other factors. The energy of the photons that is absorbed is converted to internal energy. The amount emitted is based upon the surface temperature.
The energy of the two photons does add the emission has NOTHING to do with the energy that is absorbed. It is not a good point or valid.
Rather than just repeating yourself endlessly give a good explanation of why you believe that the energy of photons does not add.
You used Claes Johnson false physics in one of your posts which I showed you was NOT correct (the photon reflects and is not absorbed…that is false misleading physics).
Clint R
A while back you attempted to prove fluxes don’t add by mixing absorbed energy with emitted energy. You have to get off this line of thinking it is wrong.
You imagined a 5 sided object that only one side received energy of 900 or so W/m^2. Your claim was the emission would only be 1/5 that value so fluxes don’t add.
The thinking is flawed. The emitted flux is not the same.
If your object had two receiving fluxes they would add and your object would emit more energy.
Not sure how to get you to understand this. You are wrong on this issue and I explained why.
Troll Norman, endless blah-blah, insults, false accusations, and misrepresentations won’t help you. You made the claim that photons add. So answer the simple question:
What is the emitted photon from adding two 15μ photons?
a) One 30μ photon.
b) One 7.5μ photon.
c) One 15μ photon with twice the energy.
d) None of the above. Photons do NOT simply add. People that believe they do are braindead cult idiots.
Only one answer is correct. Quit dodging and answer the question.
ent…”Some takes a longer path. Sun to surface to atmospheric CO2 to surface”.
***
Contradicts the 2nd law and represent perpetual motion.
Also, contradicts common sense.
Come on, Bordon.
The Sky Dragon common sense is shared by a handful of cranks.
Willard, please stop trying to troll.
ent…”So where is the experiment which proves that there is no greenhouse effect?”
***
Is that Irish logic? Why does anyone need to do an experiment to prove a theory that has not been proved itself? It’s like asking a believer to prove God doesn’t exist. In this case, the GHE is your god and you are asking us to prove the GHE does not exist.
Mind you, I am not claiming God does not exist, I simply don’t know. I have no scientific proof although I have experienced a few events that appear to be miraculous.
Wiki:
“The greenhouse effect is a process that occurs when energy from a planet’s host star goes through the planet’s atmosphere and heats the planet’s surface, but greenhouse gases in the atmosphere prevent some of the heat from returning directly to space, resulting in a warmer planet. Earth’s natural greenhouse effect makes life as we know it possible and carbon dioxide plays a significant role in providing for the relatively high temperature on Earth. The greenhouse effect is a process by which thermal radiation from a planetary atmosphere warms the planet’s surface beyond the temperature it would have in the absence of its atmosphere.”
Sunlight passes thru Earth atmosphere and warms the surface and the warmer surface warms the air above.
Most of Earth surface is the ocean and it has around an average temperature of about 17 C.
The ocean surface temperature doesn’t change much during day and night daytime cycle.
About 1/3 of land area is desert and desert on average are drier than other area which are not deserts. And when the deserts are dry, they wide swings in daily temperature. Something like rainforest have less swings in daily temperature but far more than ocean surfaces.
The greenhouse effect of Earth is largely about the ocean- though wiki fails to mention it.
The idea of removing to atmosphere is problem, because that ignores the ocean. But if Earth didn’t have an ocean and didn’t have an atmosphere, it probably would have lower average surface temperature, though obviously it’s surface near equator would get high temperature of about 120 C and obviously all land would be a very dry desert.
Or without atmosphere during the day, the ground heats up quickly and would have wider temperature swings during night and day.
Venus doesn’t have sunlight shining thru the Atmosphere and heating it’s rocky surface. Instead Venus heated surface in it’s upper atmosphere.
Earth upper atmosphere is also heated by the sunlight, but most of greenhouse effect of Earth occurs at it’s ocean surface.
gb,
You wrote –
“Most of Earth surface is the ocean and it has around an average temperature of about 17 C.”
Yep. The Earth has cooled to its present temperature, and took four and a half billion years to do so.
Assuming the Moon started off as a molten blob (probable, if only because of its shape), then having a greater surface to mass ratio, it cooled much faster. Current guesses have the core at about 1300 C, with a still molten outer core. Just like the Earth, but a lot further along the path to a cold dead rock, with a surface temperature purely dependent on sunlight.
A lot of people don’t seem to realise that hot things cool, and small things cool faster than big not things – all else being equal. Even the internet agrees – so I must be right!
The ocean surface seems the warmest where the most sunlight is shining on it- so, I think the sun is heating the ocean.
But I think our entire ocean which very cold is being heated by the large molten ball that we call Earth.
And this cold ocean which is said to have average temperature of about 3.5 C, is why we are living in an Ice Age.
Just 10 million years ago, the ocean was much warmer.
gb…”Or without atmosphere during the day, the ground heats up quickly and would have wider temperature swings during night and day.
Venus doesnt have sunlight shining thru the Atmosphere and heating its rocky surface. Instead Venus heated surface in its upper atmosphere”.
***
The Earth, without an atmosphere and oceans represents a different problem than the Moon. The Earth rotates once per 24 hours, not giving it much time to cool. The Moon doesn’t rotate at all, about a local axis, and it has one side subjected to the Sun for 14 days and the same side subjected to the cold of space for another 14 days.
That’s not because it rotates but due to its orbit about the Earth. So, one side gets to bake for 14 days then freeze for 14 days. If the Earth, with no atmosphere or oceans, orbited the Sun, it would likely have a much higher average temperature than the Moon. It would not have the same time to cool each rotation.
As far as Venus is concerned, atmospheric warming of the surface cannot explain its 450C surface temperature. In fact, its inordinately high surface temperature likely affects its atmosphere, not the other way around.
Gordon Robertson
The classic Popperian description of science is hypothesis testing.
By observation and inspiration you develop a possible explanation of some aspect of reality, a hypothesis.
You then develop experiments to test it. Ideally each experiment will produce one result if the hypothesis is correct and a different result of the hypothesis is wrong.
Depending on the result the hypothesis is supported or falsified.
Swenson’s quotes correctly suggest that, like any hypothesis, CO2 AGW might be falsified by experiment. Unfortunately for him there are thousands of experiments done which support the hypothesis and none which falsify it.
There you go again, Ent.
That’s just more of your delusional nonsense. It’s like your false claim that passenger jets can fly backwards. It’s like your other cult idiots that claim fluxes simply add.
You don’t have any science. You have distortions of science. You ignore reality.
You don’t have “thousands of experiments” that support your hypothesis. You can’t even state your hypothesis that can hold up to valid science. You don’t even know science. How many of the simple physics problems was your cult able to answer? Zip, zero, nada, goose egg.
Your cult is maintained by fraud and phonies.
Pup,
You just keep saying the same BS over and over again.
You did that for 10 years.
You look tired.
Willard, please stop trying to troll.
EM,
The problem is that you cannot even describe the GHE.
What aspect of reality are you claiming cannot be explained without proposing some new “effect”? You can’t actually think of any at all, can you?
You bang on about experiments to support some hypothesis which supposedly is required to explain something which cannot be explained by current knowledge, but you can’t actually say what it is!
Very mysterious. Unfortunately, “CO2 AGW” is just a meaningless SkyDragon cult phrase. As I have pointed out, CO2 in the atmosphere was unable to prevent the Earth from cooling for four and a half billion years, let alone cause it to warm up!
So your talk of “hypothesis” and “thousands of experiments” is complete nonsense – a figment of your imagination. Appealing to your own authority is unconvincing – who is likely to believe the fantasies of a SkyDragon cultist, who rejects four and a half billion years of reality?
Possibly another deluded member of the SkyDragon cult, that’s who – nobody else!
Keep preaching to the choir.
Swenson, it’s time to Put Up or Shut Up
https://www.drroyspencer.com/2013/05/time-for-the-slayers-to-put-up-or-shut-up/
“The Slayers have had ample opportunity to answer my challenge: take your ideas, put them into an alternative time-dependent model for surface temperature, and run it from any initial state and see if it ends up with a realistic temperature.”
Unless you’re simply trolling!
TM, that’s a very simple task.
Earth receives about 960 W/m^2, after albedo, and maintains an average surface temperature of about 288K.
Reality.
Easy-peasy.
Pup,
God exists because She does is not science.
Revise and resubmit.
Clint R
I think you really should read up on some geometry. You are completely wrong when you make the totally bogus claim that the Earth receives 960 W/m^2.
Have you ever calculated the Earth’s total surface area? I really don’t know why you think you need to post completely false information that can easily be refuted with some math.
The Earth’s surface are in square meters is 510.1 trillion square meters.
The Total solar energy that the Earth can receive is 1366 W/m^2 by 2the area of the Circle the Earth covers. Area of Circle = (pi)(r^2). The total maximum solar energy the Earth can receive would be (pi)(6.3781 x 10^6 meters)^2
Doing the math, total area of Earth that can receive solar energy is
127.8 trillion square meters.
The solar flux at Earth distance is given at 1376 W/m^2. The total amount of watts the Earth receives from the Sun would be
127.8 trillion times 1376 or 1.759 x 10^17 Watts.
The total surface area of the Earth is 510.1 trilliion
5.101 x 10^14
Take maximum solar input of 1.759×10^17 divide total Earth surface of 5.101×10^14 and you get 344.7 W/m^2. The Earth cannot receive 960 Watts for every meter of surface. There is NOT enough solar energy for this to happen. The 344.7 is without any albedo, all absorbed. With albedo the number is 241 W/m^2
You are just making up false points. I think mostly because you are a Flat Earth cult minded idiot and you do not know how to perform any math, don’t understand geometry and have no logical thinking skills. That is why you can only repeat your stupid points endlessly because you can’t reason or figure out why they are wrong.
Cults work by repeating things over and over until the gullible think it is true because they heard it so many times.
You will not understand the math and you can’t understand the difference between energy absorbed and energy emitted. You think they are one and the same. Not that anyone can explain they are different and operate independent of each other.
Troll Norman, Sun “sees” Earth as a disk.
“Earth receives about 960 W/m^2, after albedo…”
You’ve stated that photons add, so answer the simple question —
https://www.drroyspencer.com/2023/01/urbanization-effects-on-ghcn-temperature-trends-part-i-the-urbanization-characteristics-of-the-ghcn-stations/#comment-1440643
Pup,
You need an output to determine temperature.
The Earth emits through its whole body.
What’s the ratio between a disc and a sphere, again?
Flat Earth Braindead Cult Minded Clint R
I answered your question. You don’t have the logic to understand the answer so in Cult mind fashion you repeat an answered request. You seem to do this all the time.
You have the identical mentality to a Flat-Earth cultist. You just have adopted Climate Change as your choice of cult belief.
No rational thought is possible with you, Swenson or Gordon Robertson. You are programmed zombie brains who repeat the same things endlessly.
Wrong troll Norman, you haven’t answered the simple question, you’ve avoided it. Your cult fraud says fluxes simply add. If that were true, photons would have to simply add. You’ve stated photons do add. So tell us how.
https://www.drroyspencer.com/2023/01/urbanization-effects-on-ghcn-temperature-trends-part-i-the-urbanization-characteristics-of-the-ghcn-stations/#comment-1440643
We know you like to keyboard, from your recent rambling rant about Earth’s surface area. Everyone knows Earth’s disk is one-fourth of its surface. But you love to keyboard when you believe you know something. You’re so desperate for attention. So teach us how to add photons.
I claim you can’t answer the simple question because you can’t support your nonsense, as usual. Prove me wrong.
(As you’re going to fail again, and prove me right, don’t worry. Your other cult idiots will rush in to help you. They will come like flies to a cow pie.)
Clint R
It is difficult for me to understand your lack of logical thinking. I am starting to grasp it watching Flat Earth debates.
Read and think!
The energy of photons is added at a surface that absorbs them. I am not saying photons add to become higher energy photons. IR photons will not add together and become visible light. The energy will add at a surface. Try to think for once and discern the difference, if you can.
Troll Norman, that sounds like “d” is your answer. Am I correct? I don’t want to answer for you.
What is the emitted photon from adding two 15μ photons?
a) One 30μ photon.
b) One 7.5μ photon.
c) One 15μ photon with twice the energy.
d) None of the above. Photons do NOT simply add. People that believe they do are braindead cult idiots.
TM,
You are quite mad – are you denying the Earth has cooled over the past four and a half billion years?
What “model” are you wanting to explain this fact?
As to surface temperatures, thermometers respond to heat. Do you dispute this?
If you do, you are obviously out of touch with reality – possibly a deranged SkyDragon cultist.
Oh, I suppose you are trying to use Dr Spencer, posing a gotcha on his behalf, are you? Dear oh dear, you nearly trapped me there, didn’t you?
[sniggering at SkyDragon idiot]
Clint R
No D) is NOT a valid answer. That is a cult mentality answer. One with no reason or thought behind it.
Photon energy adds at a surface, this is a fact. Why you persist in your Cult version of science is explained in the Flat-Earth mentality.
norman…”The energy of photons is added at a surface that absorbs them”.
***
I can live with your statement as long as it is clear there is a limit to how much the surface can warm and that only energy from a warmer surface can affect the surface.
It is clear that energy from a much hotter sun can warm the Earth’s surface a certain amount but that no amount of ice could ever warm that surface. Or, that back-radiation from a cooler atmosphere cannot warm the surface.
Troll Norman, first you claimed photons could add. But, when I presented the multiple-choice question, with the obvious hint of answer “d”, you realized something was wrong. You somehow realized that photons couldn’t really add. The only correct answer was “d”.
But, you couldn’t answer with “d”, because it would run afoul of your cult’s nonsense. Your cult claims that fluxes simply add. If fluxes simply add, then photons must simply add. But, photons don’t simply add.
You’ve boxed yourself into a corner. You have to place to run.
That’s why you’re such a phony.
ent…”…like any hypothesis, CO2 AGW might be falsified by experiment. Unfortunately for him there are thousands of experiments done which support the hypothesis and none which falsify it”.
***
You claim there are thousands of experiments that support the AGW hypothesis. Name me just one that proves CO2 in the atmosphere at 0.04%, warms the atmosphere.
Not even the IPCC has provided such proof. If you read through their reviews, they can only offer that…
1)19th century scientists claimed CO2 can absorb infrared energy. I don’t dispute that, I want to see studies done in the atmosphere that confirm it IN THE ATMOSPHERE and not in a glass tube in a lab.
2)Humans started injecting large amounts of CO2 into the atmosphere during the Industrial Era, circa 1750, and the planet started warming circa 1850.
No mention of the Little Ice Age having cooled the planet by 1C to 2C over the previous 400+ years other than a footnote claiming there is no proof that the LIA was global.
That claim is absurd. There is plenty of proxy data that points to an inordinately cooler climate between 1300 AD and 1850 AD, especially a colder climate during the Industrial Era.
During the latter, there was a famine in the 1790s in the Scottish Highlands because it had become too cold to support agriculture. It was too cold to sail far into the Arctic Ocean from the west even in summer, due to the frozen ocean. There was famine reported in North America as far south as modern day Florida and Texas, because it was too cold to grow crops.
Proxy data has revealed similar conditions in South America and China. Ask yourself this, how is it possible for Europe to cool by 1C to 2C and have the rest of the planet remain at normal temperatures? It’s absurd and the IPCC are liars.
> Name me just one that proves CO2 in the atmosphere at 0.04%, warms the atmosphere
C’mon, Bordon:
https://royalsocietypublishing.org/doi/10.1098/rsos.192075
Get new material.
Weepy Wee Willy,
From your reference –
“Moreover, the theoretical analysis confirms the cooling behaviour and the expected magnitude of different cooling rates with and without CO2.”
Cooling behaviour . . . cooling rates. No heating then? Oh I see, an internal heating element is used to raise the CO2 above the surrounding environment’s temperature, so the CO2 can cool when the element is switched off!
Well, that certainly demonstrates the warming potential of CO2 doesn’t it? If you happen to be a delusional SkyDragon cultist, I suppose.
Maybe you should stick to trying to troll. You seem particularly inept at this science business.
Carry on.
Mike Flynn,
What are you braying about?
ww…”A simple experiment has been developed to demonstrate the global warming potential of carbon dioxide (CO2) gas in the Earths atmosphere”.
***
Do you understand the meaning of potential?
A much simpler method would have been to remove all CO2 and WV from a greenhouse and see if it cooled. My bet is there would be no difference in temperature.
Come on, Bordon.
You have the potential to write cranky comments.
That does not imply you are not already a crank.
Solar wind
speed: 451.8 km/sec
density: 4.73 protons/cm3
Sunspot number: 67
The Radio Sun
10.7 cm flux: 136 sfu
Updated 31 Jan 2023
https://www.spaceweather.com/
Thermosphere Climate Index
today: 18.72×10^10 W Warm
{backing away from peak which was +19
and think it will go back +20 within months}
Oulu Neutron Counts
Percentages of the Space Age average:
today: +1.4% Elevated
48-hr change: +0.9%
Anyone predicting Jan temp?
I say -.05 C
A lucky guess, Jan is: -.04 C
I guessed Dec was going to be, -.05 C and I was wrong,
Gordon got the closest, and being lazy, I just picked same number for Jan.
But I didn’t see anyone guess Jan, so, less fun.
What about Feb?
I think it’s going bounce back up, and get above the zero line.
And I still haven’t had any snow this year, but it was 25 F last night.
But a question is, will get back to .014 C per decade, remain at .013 per decade or fall to .012 C per decade.
I was guessing it get down to .012 C by around now, but it seems it could take few more months.
Swenson will not clarify what he means when he writes “The same ‘natural process’ that cooled the Earth for four and a half billion years.”
So let’s see what he wrote 10 years ago when he went by the name Mike Flynn: https://www.drroyspencer.com/2013/08/does-a-greenhouse-operate-through-the-greenhouse-effect/#comment-86282
“There is a temperature gradient from the Earth’s core to the surface of the crust, and thence to outer space. If you can’t accept that this shows that the Earth hasn’t finished cooling, then obviously you will be a Warmist to the day you die.”
Translation: Swenson believes the Earth has cooled from the inside out(!), and not from the outside in as science and common sense tell us. Mystery solved.
Bonus geoscience lesson of the day for Swenson:
TM,
Tell me something I don’t know.
By the way, your quote presumably started off “But the earth is stratified into layers by density (heavy core, intermediate mantle, light lithosphere), telling us that early in its history . . . “.
If that is your authority, he’s not the brightest bulb in the box.
Did this come from your source – “The earth cooled from the outside in, and the still molten iron-nickle core are the remnants of that heat from the early stage of melting.”?
Apart from the fact that one element referred to is nickel, rather than “nickle”, and he seems a tad confused about the structure of the Earth, and the other planets. A sample – “we realize that virtually every other planetary body in the solar system (including some moons that are larger than some planets) is geologically dead (they have no internal heat of their own).”
No internal heat of their own?
Even NASA begs to disagree – “If we could slice Venus and Earth in half, pole to pole, and place them side by side, they would look remarkably similar. Each planet has an iron core enveloped by a hot-rock mantle; the thinnest of skins forms a rocky, exterior crust. On both planets, this thin skin changes form and sometimes erupts into volcanoes in response to the ebb and flow of heat and pressure deep beneath.” – NASA
If you must appeal authority, at least appeal to somebody a little more attached to reality.
Try harder next time.
Swenson,
Now you want sources? You used to say you click on others’ links; I guess that was just more schtick, no?. Here, click on this: https://csmgeo.csm.jmu.edu/geollab/fichter/platetect/heathistory.html
I’ve wasted too much time already on your silliness.
I will say in closing that your “the Earth is still cooling” -0.000001 to -0.000004 K per annum does not change the fact that the global surface temperature has increased 1.3 C since mid-1800s. On land the increase has been 1.8C. Do the math!
“Live long and prosper.” he he he
> Tell me something I don’t know.
You don’t know how to replace the greenhouse theory, Mike.
maguff…”The earth is stratified into layers by density (heavy core, intermediate mantle, light lithosphere), telling us that early in its history the earth went through a molten stage that led to the heavy materials sinking inward to form the core, and the lighter materials floating toward the surface”.
***
Any eye-witnesses to these events? Anyone ever seen the phenomena you describe?
It’s called science. You wouldn’t understand it.
There is hard science and soft science. Geology, in general, is a soft science when it comes to phenomena taking place inside the Earth or at a time in the past.
Of course, you don’t think that deeply, you run off to authority sources and get them to do your thinking for you.
I took four semesters of geology as Major requirements, and then in my professional career I worked with geologists (and geophysicists) for nearly 50 years.
Please go on and shoot your mouth off about science, I find it very amusing.
Obviously, Swenson had read Mike Flynn’s words as well, and has expanded on Mike’s ideas. Or, maybe he arrived at his thoughts independently.
After all, we non-spinners arrived at our facts about the Moon long after Tesla proved the Moon does not spin.
Does it matter? You have no opinions to offer on the theory other than an appeal to the authority of ‘science’.
DO you not think for yourself?
If this Mike Flynn or his alter ego Swenson truly believes that the earth cooled from the inside out, he knows nothing about heat transfer or earth science. It is a sign of a poor education.
Why does he hate science?
RFS,
Maybe you could ask Mike Flynn (or me) what we think, individually, rather than believing that TYSON MCGUFFIN has the power to read minds.
As TM said, the Earth has cooled. Feel free to disagree.
The GHE didn’t stop the cooling, so it is either completely non-existent, or completely ineffectual at preventing planetary cooling.
Obviously, you are detached from reality.
Still posting with the copycat nym, are we?
C’mon, Bordon.
We all know it’s Mike Flynn.
TM,
I understand Mike Flynn’s comment, even if you don’t. The core is the hottest part, and the thermal gradient runs from hottest to coldest.
Telling me what you think I believe is a mark of stupidity. You have no mind-reading powers.
You have solved a non-existent mystery, and you still believe in a non-existent GHE – at least one which didn’t prevent the Earth from cooling to its present temperature, whether from the outside in, or the inside out. Cooling is cooling.
At least you now agree that the Earth has cooled, and continues to do so – atmosphere, GHGs, GHE, SkyDragon prayers etc. notwithstanding.
You could always start using some of Weepy Willard’s “semantic tricks”, try to get Dr Spencer to ban me at your behest, or just try to pretend the GHE exists, but you are refusing to describe it on the grounds of intellectual property rights!
Carry on running away from reality – you can run, but you can’t hide!
> I understand Mike Flynns comment
Of course you understand your comment, Mike.
What are you braying about?
Willard, please stop trying to troll.
A planet surface doesnt absorb solar energy first, gets warmed and only then emits IR EM energy.
No, a planet surface emits IR EM energy at the very instant solar flux hits the matter.
–
1. Earths Without-Atmosphere Mean Surface Temperature calculation
Tmean.earth
So = 1.361 W/m^2 (So is the Solar constant)
S (W/m) is the planets solar flux. For Earth S = So
Earths albedo: aearth = 0,306
Earth is a smooth rocky planet, Earths surface solar irradiation accepting factor Φearth = 0,47
(Accepted by a Smooth Hemisphere with radius r sunlight is S*Φ*π*r^2(1-a), where Φ = 0,47)
β = 150 days*gr*oC/rotation*cal is a Rotating Planet Surface Solar Irradiation INTERACTING-Emitting Universal Law constant
N = 1 rotation /per day, is Earths axial spin
cp.earth = 1 cal/gr*oC, it is because Earth has a vast ocean. Generally speaking almost the whole Earths surface is wet. We can call Earth a Planet Ocean.
σ = 5,67*10⁻⁸ W/m^2K⁴, the Stefan-Boltzmann constant
Earths Without-Atmosphere Mean Surface Temperature Equation Tmean.earth is:
Tmean.earth= [ Φ (1-a) So (β*N*cp)∕ ⁴ /4σ ]∕ ⁴ (K)
Τmean.earth = [ 0,47(1-0,306)1.361 W/m^2(150 days*gr*oC/rotation*cal *1rotations/day*1 cal/gr*oC)∕ ⁴ /4*5,67*10⁻⁸ W/m^2K⁴ ]∕ ⁴ =
Τmean.earth = [ 0,47(1-0,306)1.361 W/m^2(150*1*1)∕ ⁴ /4*5,67*10⁻⁸ W/m^2K⁴ ]∕ ⁴ =
Τmean.earth = ( 6.854.905.906,50 )∕ ⁴ = 287,74 K
Tmean.earth = 287,74 Κ
And we compare it with the
Tsat.mean.earth = 288 K, measured by satellites.
These two temperatures, the calculated one, and the measured by satellites are almost identical.
Conclusions:
The planet mean surface temperature equation
Tmean = [ Φ (1-a) S (β*N*cp)∕ ⁴ /4σ ]∕ ⁴ (K)
produces remarkable results.
The calculated planets temperatures are almost identical with the measured by satellites.
Planet…..Tmean…..Tsat.mean
Mercury…325,83 K…..340 K
Earth…..287,74 K…..288 K
Moon……223,35 Κ…..220 Κ
Mars……213,21 K…..210 K
The 288 K 255 K = 33 oC difference does not exist in the real world.
There are only traces of greenhouse gasses.
The Earths atmosphere is very thin. There is not any measurable Greenhouse Gasses Warming effect on the Earths surface.
There is NO +33C greenhouse enhancement on the Earths mean surface temperature.
Both the calculated by equation and the satellite measured Earths mean surface temperatures are almost identical:
Tmean.earth = 287,74K = 288 K
–
https://www.cristos-vournas.com
“Earth is a smooth rocky planet,”
Well, only because huge basins are filled with seawater.
“The Earths atmosphere is very thin. There is not any measurable Greenhouse Gasses Warming effect on the Earths surface.”
The Earth CO2 levels hasn’t had measurable effect, yet.
It seems water vapor greenhouse gas could be measured- though I don’t
know that anyone has done it.
It seems it’s broadly agreed, that if Sahara Desert was wetter, it would have a higher average temperature. Or it’s nights would be warmer. Or being a desert, it has wide swings in temperature, and if wetter, it would have more uniform daily and yearly temperature.
All global warming is about having a more uniform global temperature.
One could also look at tropics in general, which tend to have fairly uniform yearly temperatures and high average temperatures. And has most water vapor- or one could say, has most greenhouse gas effect.
It’s not hottest temperature, but has most uniform temperatures.
“All global warming is about having a more uniform global temperature.”
–
Because of Earth’s the slightly elliptical orbit, at our times we experience in North Hemisphere the warmer winters and the cooler summers.
As you say:
“All global warming is about having a more uniform global temperature.”
–
Thank you.
–
https://www.cristos-vournas.com
“Made me wonder about how Europe and Canada are described, wiki:
Europe is generally characterized by a temperate climate. Most of Western Europe has an Oceanic climate, in the Kppen climate classification, featuring cool to warm summers and cool winters with frequent overcast skies. Southern Europe has a distinctively Mediterranean climate, which features warm to hot, dry summers and cool to mild winters and frequent sunny skies. Central-eastern Europe is classified as having a humid continental climate, which features warm to hot summers and cold winters. ”
And:
“The climate of western Europe is strongly conditioned by the Gulf Stream, which keeps mild air (for the latitude) over Northwestern Europe in the winter months, especially in Ireland, the United Kingdom and coastal Norway. In terms of monthly sunshine averages, much of temperate Europe sees considerably less than the northern United States and eastern Asia.
The climate of Western Europe is milder in comparison to other areas of the same latitude around the globe due to the influence of the Gulf Stream. ”
https://en.wikipedia.org/wiki/Climate_of_Europe
Milder is the term- for average temperature of 9 C. And less sunlight but Germans and UK want to use solar energy to power their electrical grids.
Cloudy, dim, wetter and milder due to Gulf Stream.
Europe might be good place to measure warming effects of clouds. But grew up in cloudy Vancouver island, which probably more extreme in cloudy, than most of Europe. And I had to live to Oregon to find cold winters- it was far less cloudy.
Average global water vapor has been accurately measured by NASA/RSS Jan 1988-Dec 2021 using satellite based instrumentation. They reported the data but recently deleted the site. The numerical data is on the Wayback machine here: https://web.archive.org/web/20220707111546/https://data.remss.com/vapor/monthly_1deg/tpw_v07r01_198801_202112.time_series.txt Their method is described at https://www.remss.com/measurements/atmospheric-water-vapor/tpw-1-deg-product/ which includes an RMS accuracy of about 1 mm (= 1 kg/m^2). TPW is obtained by adding the reference level, 28.73 kg/m^2, to the anomalies. I graphed the data as Fig 3 in (click my name). Their measurements show that WV has been increasing 1.44% per decade; 4.9% over the 34 years it was measured. An extrapolation by me estimates about a 10% increase since 1900.
Dan,
Water vapour didn’t stop the Earth cooling, any more than CO2 did.
The hottest places on Earth are characterised by their lack of water vapour in the atmosphere ie., the more water vapour, the lower the maximum temperature achievable. Death Valley and the Lut Desert are examples.
An extreme example is the Moon – no water vapour at all – maximum temperature around 127 C
No GHE, it seems.
The hottest places on earth are places where there is no liquid water to provide local cooling by evaporating and no clouds to reflect sunlight.
dan…”Their measurements [RSS] show that WV has been increasing 1.44% per decade; 4.9% over the 34 years it was measured. An extrapolation by me estimates about a 10% increase since 1900″.
***
Sorry, Dan, I no longer trust anything out of RSS. They sold out to NOAA and I now regard them as climate alarmists.
IMO, RSS did the TPW measurements accurately thinking they might some day be useful. Later, Im guessing, they discovered that the TPW increase could account for all of the climate change and would refute the position that CO2 caused climate change. This would eliminate an excuse to impose control on humanity. To avoid the issue they stopped reporting the measurements Dec 2021 and recently (about Jan 2023) deleted the record.
ent…”The classic Popperian description of science is hypothesis testing”.
***
My understanding is that Popper was a philosopher, not a scientist. Besides that, before he was born, much of science had already been established via the original experimentation he eschewed.
In other words, science as we know it, beginning around the time of Newton, was established, not by disproving a scientific fact, but by establishing scientific fact. Newton did not even have to do experiments, he invented calculus and used deductive reasoning to prove a point.
Today’s scientist are not even required to use deductive reasoning, all they have to do is follow the status quo to ensure them publishing rights.
I fail to see the point in coming along after the fact and trying to disprove Newton’s work, for example. That’s what Einstein tried to do with his nonsense about space-time only to set us back a 100 years. It’s even worse when a non-scientist like Popper meddles in science, setting it back even farther.
The scientific method is there so that anyone, even you and I, can apply it to establish a fact. However, people like Popper have established nonsense like peer review to prevent us from publishing in the scientific community. If we try, a journal editor will ignore us, or he/she will pass our experimental evidence to a reviewer, who will reject it.
It’s hard enough for Roy and John Christy of UAH to get published.
C’mon, Bordon.
The Pop was a deductivist.
What he’s suggesting has an old name.
It’s called the modus tollens.
Think.
Bohr used deduction as the basis of his quantum theory about electrons. However, he based it on established observations about hydrogen atom spectra. To this date, no one has proved his theory about the quantum nature of electron orbitals, the only proof being indirect experiments.
Similar deduction has lead to idiotic theories like the Big Bang, or time dilation. The claim that the Moon rotates once per orbit is also based on deduction, albeit a wrong deduction.
When you deduce something, you need to prove it. Popper has not established that science is about experimenting to negate previous experiments. That kind of thinking is typical of someone who would go into philosophy rather than science. Or maybe a biologist like Entropic, who seems to have fallen for the nonsense about evolution, which is strictly a deduction with no proof.
In the end, it doesn’t matter if a theory can be proved as long as it’s application gets results. I have built a career in electronics, which is largely based on theories that have yet to be proved wrt to the electrons on which the science is built.
C’mon, Bordon::
http://abyss.uoregon.edu/~js/glossary/bohr_atom.html
These are not deductions.
gordon is right a lot of science is based on a premise that God/Mother Nature/Thor/Gaia or whatever you want to call it can’t walk and chew gum at the same time.
Oh, Gill.
Rubberstamping Bordon with cryptic coddswallop only makes things worse:
https://plato.stanford.edu/entries/qm-copenhagen/
“To remedy the stability problem, Bohr modified the Rutherford model by requiring that the electrons move in orbits of fixed size and energy”.
***
Rutherford was Bohr’s professor and there is little doubt his contribution was huge. However, he missed the critical idea that electrons needed to orbit in quantum orbitals.
Bohr was also aided by a friend who prompted him to re-study the theory related to hydrogen atomic spectra. It had already been determined that hydrogen absorbed and emitted at discrete frequencies and the frequencies were known. When Bohr revisited the theory it suddenly dawned on him the relationship an electron needed to have with the nucleus for them to absorb and emit at those frequencies.
Scientists like Bohr often get the credit for teamwork that led to a brilliant insight. Modern scientists often try to discredit Bohr by claiming his theory no longer applies, which is bs. It still applies to hydrogen and to get it to apply to other atoms, a whole lot of creative science was done. If anyone wants to take a shot at Bohr they should also look at the work of those who literally invented their science to make Bohr’s theory work for multiple electron atoms.
“The Copenhagen interpretation…”
***
The Copenhagen conference marked Bohr’s departure from the real world and into quantum fantasy science. Einstein and Schrodinger moved away from that form of quantum theory because they believed physics required a reality upon which to base it.
Notions like entanglement theory began to emerge which suggested electrons could communicate with other electrons at a considerable distance.
Come on, Bordon.
In one comment you tell us that Bohr was making deductions.
Now you say stuff once again.
Which is it?
Bohr made a great discovery then he undid it by delving into sci-fi.
Same with Einstein. He made a great discovery about the photoelectric effect then he undid it based on a confusion about time in his ridiculous theory of relativity. Einstein admitted his relativity theory is based on Newtonian relativity theory, it was his addition of the ability of time and distance to change due to the speed of a body that undid him.
Bordon, Bordon,
Allow me to help.
When you say “Bohr used deduction as the basis of his quantum theory about electrons. However, he based it on established observations about hydrogen atom spectra.” what you mean is that Borh used abduction:
https://plato.stanford.edu/entries/abductio
There’s nothing necessary behind Bohr’s model.
Scientists are freeer than you think.
wee willy wanker…”Theres nothing necessary behind Bohrs model”.
***
Only the the study of electronics, chemistry, and the entire science behind quantum theory.
Come on, Bordon.
If study was necessary, you would not be here ranting about physics for a decade.
Willard, please stop trying to troll.
norman…”No rational thought is possible with you, Swenson or Gordon Robertson. You are programmed zombie brains who repeat the same things endlessly”.
***
Great minds think alike, fools seldom agree.
Gordon Robertson
Much more likely that Cult minded people think alike.
Here is a dose of Thomas Paine on this point:
“Thomas Paine, the English-born revolutionary who became one of the founding fathers of the USA, like many today, had a different response to the idea that ‘great minds think alike’, that is, “No, they don’t”. He expressed that opinion in the 1792 political pamphlet The Rights of Man, edition 2 :
I do not believe that any two men, on what are called doctrinal points, think alike who think at all. It is only those who have not thought that appear to agree.”
I can agree that you, Clint R, or Swenson are thinkers. Your ideas come from lunatics on blogs (like Gary Novak for you or Claes Johnson another loon). A lot of the stupid conclusions come from the tortured soul of Joseph Postma. He is beyond a fanatic and has zero scientific ability. Just a cult leader of a handful of arrogant yet unthinking blind followers.
Gordon Robertson
Here is an example of Cult thinking.
Joseph Postma video:
https://climateofsophistry.com/2022/09/16/illuminism-under-threat/
He makes declaration after declaration with no support for any of it. He is now going full Cult to get his band of followers even deeper into his mental fence. If you disagree with him now, you are a Zeta alien bent on destroying all life on Earth.
He has this vast knowledge that Zeta creatures have destroyed several life bearing planets under the watchful eye of God. Not sure exactly how he obtained this information but it does not stop him from declaring it as factual. Did a Zeta Rebel come talk to him and inform him of the long history of these beings?
I think you should watch it. It will be another thing you blindly believe without question because it goes against established thinking. He does not need evidence, just declarations. This is how Cults operate. No evidence is needed, just like your Pal Clint R, he makes endless declarations and when you ask him for a source for his claims he ignores it but keeps on declaring it as fact.
You are not the cult leader but a follower. You blindly believe people like Putin, Lanka, Duesberg, Gary Novak, etc. But a cult needs its followers to exist.
Troll Norman, it is YOU that is the cult idiot. Your endless blah-blah won’t change that.
You have claimed photons add. But, when I presented the multiple-choice question, with the obvious hint of answer “d”, you realized something was wrong. You somehow realized that photons couldn’t really add. The only correct answer was “d”.
But, you couldn’t answer with “d”, because it would run afoul of your cult’s nonsense. Your cult claims that fluxes simply add. If fluxes simply add, then photons must simply add. But, photons don’t simply add.
You’ve boxed yourself into a corner. You have no place to run.
That’s why you’re such a phony.
https://www.drroyspencer.com/2023/01/urbanization-effects-on-ghcn-temperature-trends-part-i-the-urbanization-characteristics-of-the-ghcn-stations/#comment-1440832
norman…I know very little about Joe Postma and I have no idea why he is concerned about Illumination or whatever the word may be. I tried to view the video at the site and I shut it down, regarding the guy as a crank. He rambles, as cranks often do, without tevealing the basis of their theories. Then he refers you to his book, with which he makes money.
I have read Claes Johnson and you feel the same way about him as you do Joe Postma, yet you have never stated what it is about Johnson’s writing you don’t like. You claim essentially that he’s a fraud, but you offer no scientific explanation for your objections to what he writes.
How can anyone have a conversation with you when you lead off taking shots and offering ad hom attacks? I would seriously like to know what it is about Johnson that bothers you from a scientific perspective.
Illumination really means acquiring awareness. I have no idea what the guy in the video is raving about. Another modern allusion is the word ‘woke’. You can tell its derivation is from illiteracy because the word in that context should be ‘awakened’, not the crude from, ‘woke up’. You can visualize it from some ignorant SOB claiming, Hey, man, I’m cool, I’m woke up”.
People who use the word are claiming ‘I am woke’, a perversion of the English language. It is often used with reference to people becoming ‘woke’ re racism. The correct word should be awakened, or aware.
A good example of acquiring awareness is when you suddenly get it that the Sun is not rotating about the Earth. When you see it in the morning above the eastern horizon, and you get it that you are witnessing an illusion that the Sun is rising and it’s actually the Earth’s horizon moving, you gain awareness.
It’s the same with time, another illusion. It is based on the same apparent motion of the Sun across the sky. Ancient Egyptians used a sundial to track it by casting a shadow and that was the basis of modern time. Along the way, we devised more sophisticated methods of tracking the Sun’s apparent motion, but in the end, it’s the same thing.
Someone forgot to tell Einstein, who based his theories on time on the hands of a clock, which he believed represented time.
Idiot Clint R
No I was not boxed in and my answer tht photons add (their energy at a receiving surface) is correct. You constantly confuse energy absorbed with emitted energy. These are separate processes. You cannot understand this so continue with your endless stupid posts. Go back to your original idea on fluxes. A 4 sided object that one part receives 960 W/m^2 and the emitted Flux will be 240 W/m^2. You used this silly example to prove fluxes do not add. Again confusing energy absorbed and energy emitted. Using your same example have a second side receive a Flux of 960 W/m^2 and see the result on emission. The energy adds but you can’t understand any of it. You can’t understand emitted energy is different than absorbed energy. Your cult thinking won’t help you. Maybe contact the Zeta and see if they will help your sorry state.
Troll Norman, it’s really simple. Either put up or shut up. Your endless blah-blah doesn’t work.
What is the emitted photon from adding two 15μ photons?
a) One 30μ photon.
b) One 7.5μ photon.
c) One 15μ photon with twice the energy.
d) None of the above. Photons do NOT simply add. People that believe they do are braindead cult idiots.
I say you can’t answer correctly. Prove me wrong.
> Photons do NOT simply add.
On C00kie’s planet, two suns would not warm it more than one.
You still don’t get it. EM energy from stars do nothing till they contact and are absorbed by a surface. Once absorbed, the heating takes place but the energy is no longer EM. Therefore, the addition to which you refer is an addition of thermal energy within a surface after the EM has been converted to heat.
Clint R
The correct choice is not available in your post. If you have one CO2 molecule it will absorb both the photons. The first photon will move the CO2 molecule from a ground vibrational state to the 1st level vibrational state. The next photon will move the molecule to the 2nd vibrational energy level. The number of vibrational levels is reached when the molecule breaks apart. The correct answer to emission is first a 15 micron photon is emitted lowering the molecule to the 1st vibrational energy level. Then the second 15 micron photon is emitted returning the molecule to ground vibrational level.
Far too general Norman. Molecules are nothing more than atoms bonded together by electrons that belong to the atoms. All vibrations and rotations occur due to those bonds.
Molecules break apart because electron bonds exceed their energy levels.
Norman, you’ve dropped the trolling but you’re still promoting your cult nonsense.
The issue is NOT about energy conservation. The issue comes from Folkerts fraud that two fluxes simply add, which would mean that two photons simply add, which would lead to ice cubes being able to boil water.
Folkerts went too far trying to promote your cult hoax, and got caught. He’s going down, and you’re going with him. All your dodging just indicates how willing you are to pervert reality.
And, you’re not doing a very good job. Reality always wins.
Clint R
Tim Folkerts is correct you are not. Fluxes add and it does NOT conclude logically that ice cubes can boil water. That is a flaw you propose but it just is not correct no matter how often you repeat it. Fluxes add all the time this in no way means ice cubes can boil water. I attempted to explain this to you but it was not a successful endeavor. You are not understanding field of view and why that prevents ice cubes from boiling water. Fluxes add you are wrong when you claim they do not.
I have told you many times to get two heat lamps (Each heat lamp produces its own individual flux). Set it up to hit some target and measure the temperature. First with just one lamp on then you turn on the second one and watch the fluxes add.
You won’t believe anyone (including textbook physics which I have linked you to) so it is time for you to discover how wrong you are. You will quickly learn fluxes add and increase a temperature.
If you do not do such an experiment then kindly shut your yapper about ice cubes boiling water. Fluxes add end of debate. Anything more from you without the experiment demonstrates an anti-science mentality, trolling, and general cult minded thought process (endless repetition of an incorrect point easily proven wrong with simple experiment).
Norman, your crap has already been debunked several times. This issue is about flux ARRIVING at a surface. “Field of view”, “view factor”, “inverse square law”, and other considerations have already been accounted for. The flux is ARRIVING at the surface.
And just adding two heat lamps is not the issue either. You need to measure the flux ARRIVING from one heat lamp, then measure the flux ARRIVING from the second heat lamp, then use your cult’s bogus equation — F1 + F2. Then, show that results in the surface emitting a flux equal to the sum. It won’t happen.
You’re STILL trying to boil water with ice cubes.
Clint R
Your argument is basically calling something “bogus”. You offer no valid logic for your statement.
You have not logically demonstrated why two fluxes would not add and the result would have a emission equal to the amount of energy absorbed (provided that radiant energy was the only heat transfer mechanism in the process).
Need logic not “bogus”. That style of posting does not do much for me. Explain why you think the fluxes do not add.
Norman, you’re trolling again. There’s no accuracy in your comment. I’ve explained the flaws in your nonsense many times. It is YOU that has not produced any support for your beliefs that result in ice cubes boiling water. You just keep spinning and circling the issue.
If you missed my many debunks of your nonsense, start here:
https://www.drroyspencer.com/2023/01/urbanization-effects-on-ghcn-temperature-trends-part-i-the-urbanization-characteristics-of-the-ghcn-stations/#comment-1441933
I’m saying you won’t stop trolling. Prove me wrong.
> ice cubes boiling water
C00kie thinks he’s being clever, but this is of course dumber than a frozen rock.
An object completely surrounded by ice at 0 C would receive no more than the ice emits, 316 W/m^2.
Now suppose only half of our object is exposed to radiation from the ice, the other half gets nothing from the ambient environment. The object would receive a total of 316 / 2 = 158 W/m^2, corresponding to a temperature of -43 C.
C00kie needs to actually take view factor into account rather than just paying lip service to it.
noman…”…photons add (their energy at a receiving surface) is correct”.
***
Not so. The so-called photons must be converted from EM to thermal energy by electrons before the energy can be added. You cannot add EM as EM under those conditions.
Gordon Robertson
Or by way of molecular vibration. The energy in EM can move electrons but it can also cause molecular vibrations. That would be the nuclei of the atoms moving around, the electron bonding acting as a spring tension on the moving nuclei. I suggest you really do some digging into Molecular Vibration. As of now you do not understand it but Linus Pauling sure did. I am not sure why you make an incredible effort to not attempt to learn what molecular vibration or even lattice vibration means and why the energy of EMR can affect these. Electron Transitions are only ONE of the possible ways EMR can be changed from one fore of energy to another, in this case moving an electron up the potential well of positive charge.
norman…”The energy in EM can move electrons but it can also cause molecular vibrations. That would be the nuclei of the atoms moving around, the electron bonding acting as a spring tension on the moving nuclei”.
***
If the energy is transferred from the alleged photon to the electron, it causes the electron to a jump to one of the higher orbital energy levels. That produces a higher kinetic energy for the electron which translates en masse to a rise in temperature of the body.
That temperature increase via increased KE can also be realized using a direct infusion of heat via a flame, etc. If that electron is a valence electron joining two atoms it obviously affects the bond between the atoms.
We need to back up a bit. There was already a vibration due to the interaction (electrostatic) of the -vely charged electrons and the +vely charged protons in the nucleus. The vibration was due to the push/pull effect between the electrons and protons so the vibration has a natural derivation.
You have to understand that the +ve protons repel each other when they get within a certain distance while the negative electrons are attracting them. That’s a perfect situation for natural vibration.
Now suppose you have such a bond in a molecule and the electron gains more energy due to absorbing a photon or gaining KE from a flame. The electron has more energy and pulls on the proton while the proton reacts with more positive electrostatic force as the electron draws it closer.
You need to remember as well that the electron has an equal charge to the proton even though its mass is 1800 times less. However, the electron is moving with a very high velocity. It’s complex.
My point is, there is nothing special about molecules and their vibration/rotation. It all comes down to interactions between individual electrons and the nucleus of constituent atoms.
None of the takes in electronegativity. Electrons in atoms like Oxygen are more electronegative than those in carbon. Electrons in a C – O bond are more likely to crowd around the O end on O – C bond, making the bond a dipole (more -ve at on end than the other. That leads to vibration.
Gordon Robertson
This visual example will explain what happens when a molecule absorbs and IR photon (or EMR in the IR band).
https://upload.wikimedia.org/wikipedia/commons/b/bb/Anharmonic_oscillator.gif
The amplitude of the vibration increases (kind of similar to how you can produce louder sounds hitting a piano chord…the frequency remains the same but he wire vibrates with a greater amplitude).
When a photon is absorbed by the molecule the energy it contained moves the vibrational energy level to a higher rung on the energy ladder. In the graphic it is at an energy level of 3. If it loses a photon it goes down to a lower amplitude vibration. If it gains a photon it goes to the next higher amplitude. The energy is stored in the vibrational energy.
norman…”When a photon is absorbed by the molecule the energy it contained moves the vibrational energy level…”
***
Ask yourself this…what is absorbing the photon? Or, how does a molecule absorb a photon?
I have tried to explain several times that the word molecule is meaningless for our purposes, there is nothing in the word or concept of ‘molecule’ that gives us insight into absorp-tion and emission of photons.
You need to go deeper into what a molecule is, which is an aggregation of atoms. Any molecule, from the simplest two-atom molecule like H2, is nothing more than two atoms bonded by electrons in the valence band, which is the outermost shell of electrons. However, any of the electrons in any band of an atom can absorb/emit and that applies to molecules as well. Ergo, it is the electrons in molecules that emit/absorb.
The vibration in your diagram involves electrons in one way or another. Showing a diagram of a molecule in relation to a molecule is ingenuous.
Gordon Robertson
Electromagnetic energy with its positive and negative pulses can move the nuclei of the molecule further apart increasing the distance and moving it to a higher vibrational state.
Molecular vibration is the motion of the nuclei (which have charges also as well as electrons). The electrons go along for the ride being considerably less massive they move where the nuclei move.
What is absorbed is the energy of the EMR. If an electron absorbs this energy and it is the right frequency the electron can move to higher energy levels. If the molecule absorbs the energy the nuclei will increase in distance going to higher vibrational states.
You need to understand the difference.
Wrong Norman.
You seem to be confusing atoms with molecules, and molecular vibrations with electron energy levels. You’ve very confused. Election energy levels are not the same as molecular vibrations. The differences are great and start with the fact that changing electron energy levels requires much more energy than changing molecular vibrations. That means photons with more energy, i.e., shorter wavelengths. Some wavelengths won’t even be absorbed by either the molecule or an electron. You don’t understand any of this. You believe all photons will be absorbed and all absorp.tion will result in higher temperatures. Your beliefs would result in ice cubes boiling water.
You don’t have the background in science, and you can’t learn.
Clint R
I am not sure what your incoherent rant is about. Maybe you don’t know haw to read. I am confusing NOTHING in my post and it is quite clear to a person with reading ability.
Here is why you are an idiot and display a lack of reading comprehension.
YOU: “You dont understand any of this. You believe all photons will be absorbed and all absorp.tion will result in higher temperatures.”
What I actually wrote that you are too stupid to process.
ME: “If an electron absorbs this energy and it is the right frequency the electron can move to higher energy levels.”
Basically your stupid rant demonstrates you are an idiot that can’t read well. Go back to school and learn a bit.
Not sure why you like being a foolish idiot.
Troll Norman, you’re just parroting me. You’re trying to sound like me, only you avoid reality. You’re so braindead you can’t even come up with something original. You’re like braindead Bindidon.
Rather than wasting my time with you, I’ll just remind you that you can’t support your claims. You have no valid technical reference for two arriving fluxes resulting in an emitted flux equal to the sum of the fluxes. (See fraudkerts nonsense that two 315 W/m^2 fluxes arriving a surface result in the surface having a temperature of 325K, emitting 630W/m^2.)
You’re a braindead cult idiot posing as an ignorant troll. You’ve got NOTHING.
Clint R
There is no “put up or shut up” the correct choice is you are a brain dead cult idiot. You have no logical thinking skills and you are not able to understand that absorbed energy and emitted energy are different.
Thanks for proving me right again, troll Norman.
You can’t support the crap you make up. That’s why you’re a braindead cult idiot.
And you can’t make a comment without insults, false accusations, or misrepresentations. That’s why you’re a worthless troll.
Pup,
The day you’ll support one single thing you hold it will be a good day. Since you have yet to do it after ten years of sock puppetry on this website, nobody believes you will.
You just keep riddling the same silly riddles over and over again.
No wonder you look tired.
Poor willard, the reason none of that makes any sense is because you’re a mental midget. You’re the mascot for a cult composed of braindead idiots. The reality is you’re at the bottom of the barrel when it comes to a knowledge of science. You understand none of this.
So keep stalking us Skeptics. Your ineffective flak confirms to responsible adults how worthless you are.
(And no, I won’t be responding to your nonsense.)
Pup the sock puppet,
It is really simple.
Either put up or shut up.
Your endless blah-blah does not work.
Do the Pole Dance Experiment.
¹⁴C