
 Home/Blog
The Version 6.1 global average lower tropospheric temperature (LT) anomaly for February, 2026 was +0.39 deg. C departure from the 1991-2020 mean, up a little from the January, 2026 value of +0.35 deg. C.
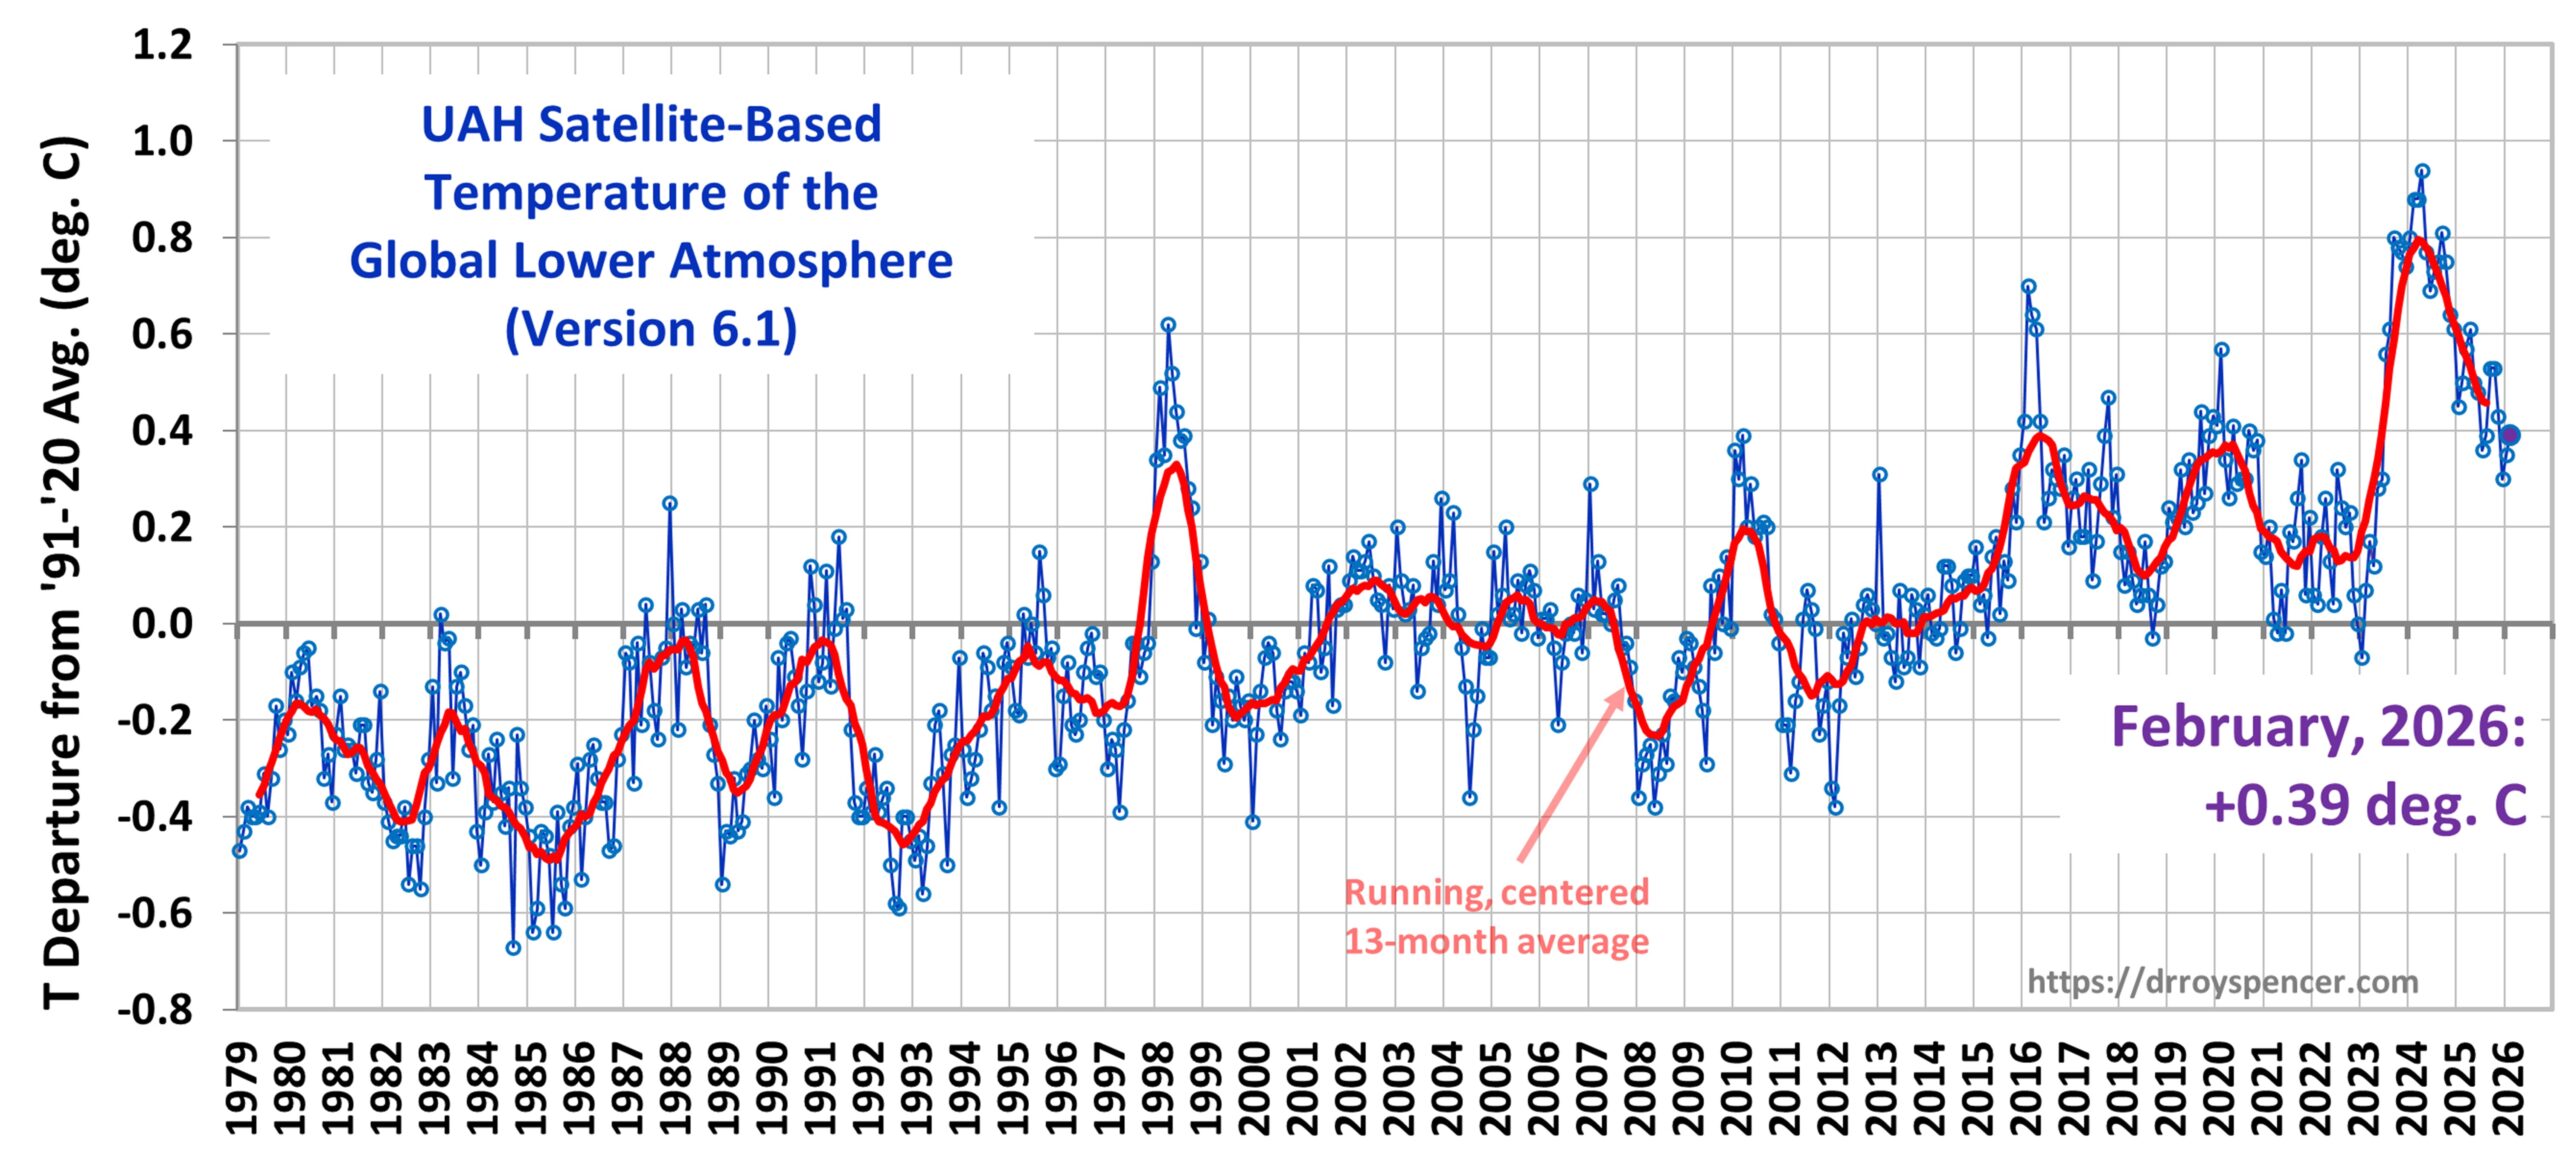
The Version 6.1 global area-averaged linear temperature trend (January 1979 through February 2026) remains at +0.16 deg/ C/decade (+0.22 C/decade over land, +0.13 C/decade over oceans).
The following table lists various regional Version 6.1 LT departures from the 30-year (1991-2020) average for the last 26 months (record highs are in red).
| YEAR | MO | GLOBE | NHEM. | SHEM. | TROPIC | USA48 | ARCTIC | AUST |
| 2024 | Jan | +0.80 | +1.02 | +0.57 | +1.20 | -0.19 | +0.40 | +1.12 |
| 2024 | Feb | +0.88 | +0.94 | +0.81 | +1.16 | +1.31 | +0.85 | +1.16 |
| 2024 | Mar | +0.88 | +0.96 | +0.80 | +1.25 | +0.22 | +1.05 | +1.34 |
| 2024 | Apr | +0.94 | +1.12 | +0.76 | +1.15 | +0.86 | +0.88 | +0.54 |
| 2024 | May | +0.77 | +0.77 | +0.78 | +1.20 | +0.04 | +0.20 | +0.52 |
| 2024 | June | +0.69 | +0.78 | +0.60 | +0.85 | +1.36 | +0.63 | +0.91 |
| 2024 | July | +0.73 | +0.86 | +0.61 | +0.96 | +0.44 | +0.56 | -0.07 |
| 2024 | Aug | +0.75 | +0.81 | +0.69 | +0.74 | +0.40 | +0.88 | +1.75 |
| 2024 | Sep | +0.81 | +1.04 | +0.58 | +0.82 | +1.31 | +1.48 | +0.98 |
| 2024 | Oct | +0.75 | +0.89 | +0.60 | +0.63 | +1.89 | +0.81 | +1.09 |
| 2024 | Nov | +0.64 | +0.87 | +0.40 | +0.53 | +1.11 | +0.79 | +1.00 |
| 2024 | Dec | +0.61 | +0.75 | +0.47 | +0.52 | +1.41 | +1.12 | +1.54 |
| 2025 | Jan | +0.45 | +0.70 | +0.21 | +0.24 | -1.07 | +0.74 | +0.48 |
| 2025 | Feb | +0.50 | +0.55 | +0.45 | +0.26 | +1.03 | +2.10 | +0.87 |
| 2025 | Mar | +0.57 | +0.73 | +0.41 | +0.40 | +1.24 | +1.23 | +1.20 |
| 2025 | Apr | +0.61 | +0.76 | +0.46 | +0.36 | +0.81 | +0.85 | +1.21 |
| 2025 | May | +0.50 | +0.45 | +0.55 | +0.30 | +0.15 | +0.75 | +0.98 |
| 2025 | June | +0.48 | +0.48 | +0.47 | +0.30 | +0.80 | +0.05 | +0.39 |
| 2025 | July | +0.36 | +0.49 | +0.23 | +0.45 | +0.32 | +0.40 | +0.53 |
| 2025 | Aug | +0.39 | +0.39 | +0.39 | +0.16 | -0.06 | +0.82 | +0.11 |
| 2025 | Sep | +0.53 | +0.56 | +0.49 | +0.35 | +0.38 | +0.77 | +0.30 |
| 2025 | Oct | +0.53 | +0.52 | +0.55 | +0.24 | +1.12 | +1.42 | +1.67 |
| 2025 | Nov | +0.43 | +0.59 | +0.27 | +0.24 | +1.32 | +0.78 | +0.36 |
| 2025 | Dec | +0.30 | +0.45 | +0.15 | +0.19 | +2.10 | +0.32 | +0.37 |
| 2026 | Jan | +0.35 | +0.51 | +0.19 | +0.09 | +0.30 | +1.40 | +0.95 |
| 2026 | Feb | +0.39 | +0.54 | +0.23 | +0.03 | +1.91 | -0.48 | +0.73 |
The full UAH Global Temperature Report, along with the LT global gridpoint anomaly map for February, 2026 and a more detailed analysis by John Christy, should be available within the next several days here.
The monthly anomalies for various regions for the four deep layers we monitor from satellites will be available in the next several days at the following locations:


6th warmest February
1 2024 0.88
2 2016 0.70
3 2020 0.57
4 2025 0.50
5 1998 0.49
6 2026 0.39
7 2010 0.30
8 2017 0.30
9 2019 0.21
10 2021 0.20
Global anomalies still very close to the long term linear trend, which is surprising given the La Nina conditions over the past year or so.
March could be interesting as ERA shows a big drop in anomalies in the last week of February.
Still have a water vapor from that volcano. Water vapor is a much stronger greenhouse gas than CO2
https://acd-ext.gsfc.nasa.gov/Data_services/met/qbo/h2o_MLS_vPRE_qbo_00N.png
” Water vapor is a much stronger greenhouse gas than CO2 ”
This is not wrong of course, but is valid only at the surface and in the lower troposphere at altitudes up to 5 km and pressures from 1000 down to 500 hPa.
The water vapor average concentration in the lower troposphere is about 0.4 %, i.e. 4000 ppm, and can go near the surface in the Tropics up to 5 % i.e. 50000 ppm.
What you proudly show, however is the lower and mid stratosphere at altitudes between 15 and 40 km and pressures between 100 and 3 hPa.
If you look at the green part of the color scale, you see a water vapor concentration from 0 up to 1 ppm, i.e. 4000 times lower than in the lower troposphere.
And this 1 ppm in the stratosphere is also about 400 times lower than CO2, as this gas has on average the same concentration in both atmospheric layers.
The upper troposphere is considered to be 8-17km above the surface.
Lower reaches in the tropics can be 1012ppm and near the top 4-10ppm
https://agupubs.onlinelibrary.wiley.com/doi/full/10.1029/2009JD013209
While we don’t really know if CO2 produces any significant radiative warming of surface from those altitudes; we do know water vapor can carry 1600 times the heat per mole as CO2 mostly in the form of latent heat up into those regions changing the lapse rate and suppressing convection. The resulting cloud of water vapor creates the hotspot and can be triggered by any source of surface warming including orbital perturbations or earth by the same mechanisms recorded by various scientists over the decades prior to CO2 getting all the climate monies.
The water vapor dissipated over about two years, but the submicronic Sulfate aerosol is still there. It’s small size and composition prevent both settling and evaporation.
The water vapor may have accounted for the rapid rise in temperature in 2022 and 2023, but the cooling effect has taken over. Sone reports are that it is primarily onfined to the Southern Hemisphere, but that raises the question of its impact on La Niña.
According to the Oceanic Niño Index (ONI), there hasn’t been a La Niña event since the last El Niño (2023-2024). There have been some recent negative values, but not negative enough to be classified as La Niña.
ONI has been phased out.
https://www.cpc.ncep.noaa.gov/products/analysis_monitoring/enso/roni/announcement.php
According to MEI, the Multivariate ENSO Index, much more accurate than ONI (nino3+4), there was of course a La Nina episode which started in July 2025 and lasts until right now:
https://psl.noaa.gov/enso/mei/img/meiv2.timeseries.png
Data
https://psl.noaa.gov/enso/mei/data/meiv2.data
MEIv2 has a very strong downward trend bias that can be easily appreciated in the figure. It is not properly detrended, as any index should be. Therefore, recent Niñas appear stronger than they are, and recent Niños weaker.
What is ERA and can you post a link?
Pet peeve of mine – use of imprecise words like “warmest.” Your post might not be an offender. I presume you are referencing the UAH data. But many others do not, especially the media, who use scare tactics using “warmest”, “record”, “highest” without (or burying deep in the article) reference to the margin above the previous temperature. Typically, the margin would be judged by “the man in the street” (and me) as quite small and certainly not alarming. “Warmest, record, highest” since the Medieval Warm Period? Nope. Our species and all Hominids have certainly lived and adapted quite well in warmer climate regimes. And they had little of our modern technology.
ERA5 is a reanalysis model from ECMWF
https://cds.climate.copernicus.eu/datasets/reanalysis-era5-single-levels?tab=overview
This page has visualization for the daily data
https://pulse.climate.copernicus.eu/
I’m surprised that UAH is saying the land was so warm in February. Globally it was the second warmest February for land. Only 0.04C below the record set in 2024.
For the Northern Hemisphere it was also second warmest, only 0.02C below the record set in 2016.
US temps up again, but Arctic negative by a sizeable degree.
The Arctic is warming rapidly.
As a northeastern USAian who has experienced one of the cooler winters in the past couple of decades, I expected (without looking at other data) that the Arctic would be on the warm side this past month due to Arctic air being diverted to my neighborhood, but that seems not to be the case. Qualitatively, “climate reanalyzer” seems to be consistent with the UAH observation for February in that the past month’s surface temperature anomaly for the Arctic was on the cool side relative to recent years.
https://climatereanalyzer.org/clim/t2_daily/?dm_id=arctic
That is, I agree with your assertion that “the Arctic is warming” rapidly” (on a long term average), but the data for this month seems to be a cold side outlier.
That all depends on when your start point is. It’s probably back to what it was in the 1930s/40s. By 2034, it will have started to cool just as ‘rapidly’. It’s just a cycle.
” It’s probably back to what it was in the 1930s/40s. By 2034, it will have started to cool just as ‘rapidly’. It’s just a cycle. ”
As usual, Buzz posts vague assertions without any source let alone data backing them.
*
Even if their time series starts with 1871, Met Office has IMHO no valuable data for sea ice back to the ‘1930/40s’; one starts better with 1951.
Let’s therefore have a look at their HadICE data, going till Dec 25:
https://drive.google.com/file/d/1WcsjTtbsk8Dd93TprKT8_dYVHncGg9v2/view
*
Not the least bit of a cycle to be seen there. Pure invention, as so often!
*
And in case of anyone denying the value of anomalies, here is the absolute data they were obtained from by removing the annual cycle:
https://drive.google.com/file/d/1QtzRyo4uFIcsRMyiorlFRa3UgRSGyPxy/view
*
Buzz probably obtained his Arctic ‘opinion’ from Watts’ WUWT, a blog best known as Heartland’s and GWPF’s loudest megaphone.
” It’s probably back to what it was in the 1930s/40s. By 2034, it will have started to cool just as ‘rapidly’. It’s just a cycle. ”
As usual, Buzz posts vague assertions without any source let alone data backing them.
*
Even if their time series starts with 1871, Met Office has IMHO no valuable data for sea ice back to the ‘1930/40s’; one starts better with 1951.
Let’s therefore have a look at their Arctic sea ice extent data, going till Dec 25:
https://drive.google.com/file/d/1WcsjTtbsk8Dd93TprKT8_dYVHncGg9v2/view
*
Not the least bit of a cycle to be seen there. Pure invention of the poster, as so often!
*
And in case of anyone doubting the correctness of anomalies, here is the absolute data series they were obtained from, by removing its annual cycle:
https://drive.google.com/file/d/1QtzRyo4uFIcsRMyiorlFRa3UgRSGyPxy/view
*
Buzz probably obtained his Arctic ‘opinion’ from Watts’ WUWT, Heartland’s megaphone.
Met Office’s source:
https://www.metoffice.gov.uk/hadobs/hadisst/data/download.html
Mark B,
Yes, the Arctic leaned colder in February, but it still ranked as only the 11th coldest February in the UAH NoPol dataset.
Buzz
[“That all depends on when your start point is. It’s probably back to what it was in the 1930s/40s. By 2034, it will have started to cool just as ‘rapidly’. It’s just a cycle.”]
A broken record:
https://wattsupwiththat.com/2014/01/30/is-the-climate-sell-signal-imminent/
Feeling dumb?
Just remember there are skeptics who see one colder than average month in a single region and decide that anthropogenic global warming must be a myth:
https://tinyurl.com/2ke5wsdk
Bindidon,
It is playful sport to describe WUWT blog and assert links to Heartland Institute. That is easy social politics stuff.
For we scientists, the more interesting question is “What serious mistakes, if any, have they made?”
Would you like to offer a reply? Geoff S
“What serious mistakes, if any, have they made?”
If I had time enough to spend on all the mistakes anyone can find there, I would have written at least 1000 comments like this one:
https://wattsupwiththat.com/2025/04/19/is-arctic-amplification-an-averaging-error/#comment-4067318
Geoff Sherrington,
See here:
https://wattsupwiththat.com/2021/04/04/the-new-pause-lengthens-by-three-months-to-5-years-10-months/
It is fairly clear to me and others that the “Monckton pauses” are created by choosing a regression period that begins just before a strong El Niño and ends during a La Niña.
Given that repeated pattern of selective framing, it is difficult to see it as accidental.
Nothing to do with selection, you can plainly see them on the UAH graph. Anywhere there is a visual sine wave like activity, it means the areas represented are a flat trend. Example mid 2016 til 2023. That’s a 7 year pause.
The IPCC called the 15 year period from 1998 – 2012 a pause. UAH extends it to 18 years.
Granted, it has warmed slightly through these pauses but in no way can such activity be attributed to anthropogenic warming.
The “Monckton pauses” are by definition choosing the longest period of zero or negative warming trend. Because El Nino/La Nina are typically the largest amplitude components in the temperature anomaly time series the tend to correspond with the beginnings and endings of “Monckton pauses”.
This may be a bit out of date, but this is my illustration of “Monckton pauses” for four of the major time series:
https://southstcafe.neocities.org/climate/escalatorGraph.png
I’ve also applied the statistical multiple regression technique of Foster/Rahmstorf 2011 to various time series to nominally remove the El Nino, solar cycle, and volcanic aerosol components of the time series, which makes the pauses shorter. The pauses are inherent in any noisy linear trend series with autocorrelation.
https://southstcafe.neocities.org/climate/escalatorChartFR.png
In both figures, the longest pause is in the UAH series centered circa 2005. Notably it remains in the series after FR2011 is applied and is largely mitigated in the other series. It has been hypothesized that this is an artifact of the way UAH treated the time of observation drift/merge for the NOAA 15 satellite vs what RSS did.
Thanks Mark B for reminding us of Foster’s & Rahmstorf’s excellent analysis showing us what remains in temperature time series when removing ENSO and volcanoes.
*
Santer & al. did something similar a few years later, based on RSS (3.3)
https://dspace.mit.edu/bitstream/handle/1721.1/89054/solomon%206%20Santer_etal_NatGeo_Article_File_22jan2014.pdf
but did not publish their results in a form replicatable by anyone having the skills nedded to do.
The heart of their work:
https://fs5.directupload.net/images/160809/i5xhzij3.jpg
The picture I wanted to show was rather this one:
https://drive.google.com/file/d/1JK3TcyGrFvi4qu8BpJdued1tfiuqXdfk/view
Thanks Bindion, that was a really nice time series decomposition by Santer!
However, in the residual (why haven’t they indicated how much is still there) remains a large part that is unexplained by those factors. The variation is roughly the same as in the original data.
And I don really see the argument against the “pause” since there has been no upwards trend since more than the last half of the entire set, slight cooling if anything. The pause seems to be even longer now.. It is obvious that the linear fit of adds little value aswell.
Gordon Robertson wrote:
“Granted, it has warmed slightly through these pauses but in no way can such activity be attributed to anthropogenic warming.”
Why?
certainly anthropogenic warming can be part of any longterm gradual warming trend. I seriously doubt that was what Gordon was talking about.
But there is a pulse of multi-decadal and multi-centennial ups and downs in the various instrument and proxy records that can’t be
attributed to CO2 which is not going up and down on those time scales.
this is in fact part of the industrial age warming that noaa has recognized for decades that the models can’t reproduce. Verdict? A natural climate fluctuation that has been intentionally ignored.
Intentionally? Sure, Milankovic is about earths precessions, changes in axial tilt, and changes in orbit shape and earth’s speed in over the year. And they have to be aware that the planets have patterns suited to make those changes on all time scales.
But institutions are way way to stuck up to admit to such an obvious intentional omission. So like trained thoroughbreds they keep racing the oval track wearing blinders so as to not be distracted in their big money mission to save the world from burning up. |They know they don’t buy into that. . .but hey the money is green and money is good for science.
Gordon Robertson,
[“The IPCC called the 15 year period from 1998 – 2012 a pause. UAH extends it to 18 years.”]
You ignore the point about ENSO variability dominating short time windows and repeat the same mistake by invoking the 1998 – 2012 “pause.”
Just like UAH, the RONI index shows a negative trend from January 1998 to December 2012.
https://www.cpc.ncep.noaa.gov/products/analysis_monitoring/enso/roni/
Could you also elaborate on your claim that the UAH time series exhibits a sine wave structure? The ENSO driven peaks occur at irregular intervals, and their amplitudes vary widely.
Yes the enso is dominating in the number of peaks. But 1940 and 2000 involved planetary alignments known to produce significant orbital speed adjustments to earth in its orbit.
Finally a 2020 peak occurred during a warm aligned Jupiter Saturn conjunction but during a moderately strong La Nina.
This pattern of saturn and Venus then teamed up for a very rare 4 jovian planet alignment peaking in 2023-24 as Jupiter conjuncted with all three other jovians between 2020 and 2024. From 1980 that alignment built with the slowest going into a warming influence in 1980 followed in order by the 3rd, 2nd, and fastest of the 4 Jovians compressing the alignment more narrowly especially from 1990 onwards to 2024 when Jupiter passed the last one. My money is on this alignment possibly being the strongest since the Minoan warm period.
With strong to possibly near super nino revving up. Looks like 2027 might shatter the reco warmest year.
We have likely already bottomed out for this cool enso phase.
Probably going to see multiple months in 2027 have anomalies above 1.0C on the current chart.
II’m not an expert but it seems the current SOI would correlate with a decent la Nina. Being a casual observer of Pacific equatorial wind anomalies for almost two decades the ENSO subsurface warmth seems quite a bit put of step on the warm side.
Could we be seeing a shift in the baseline.
If you gave any enso expert indices to make a guess on how the enso subsurface would look without knowing anything about the waste water temps I doubt anyone would predict the subsurface to be as warm as it is.
It seems that everything is much the same as last month. The atmosphere is cooling from whatever happened the last 3 years. It has not been conclusively explained. ENSO effects seem highly unlikely. It has nothing to do with an incremental increase in CO2. Claims that warming has “accelerated” will have to wait for a few more years if ever.
One other conclusion is that events such as the last 3 years demonstrate that data manipulation such as averaging and smoothing very often leads to misleading results — especially in the short term. The manipulators probably understand this as well. That’s why they do it.
“ENSO effects seem highly unlikely.”
Ummmm… We know from history, that ENSO effects on global temperature are the dominant cause of short-term variation.
“It has nothing to do with an incremental increase in CO2.”
True. An no one in climate science has claimed that CO2 explains short-term T variation.
“data manipulation such as averaging and smoothing”
OMG. Weird.
Neither of those are nefarious ‘manipulation’.
No one should be ‘misled’ by the use of these standard data analysis methods.
No, Nate, intelligent people are not going to be misled by your drive-by quotes. My whole statement is right there in context. You cannot try to fool dumb people without being really dumb yourself. It is obvious what you did. Most people with at least a high school education can see how each sentence in my comment follows the next to form a coherent thought. Taking them one at a time out of context does not change the meaning.
Please stop being a pest.
As expected we get the usual tirade of ad homs, but no science rebuttal from Tim.
Apparently you feel that your views cannot be challenged.
“Apparently you feel that your views cannot be challenged.”
It’s ironic given that Tim S is a MAGA supporter and MAGA supporters often claim to champion freedom of speech.
More BS from Nate, and now a new fool. Show me where I have ever supported Trump or MAGA in ANY way. I have criticized the media coverage from the liberal media, and the hysteria associated with that coverage in the same way that I have criticized media hype about climate while also acknowledging that CO2 should have some effect. I have provided detailed technical descriptions of the greenhouse effect. Have any of you?
Lazy stereotypes are a sign of a lazy mind. Intelligent people can understand that human behavior and climate are both topics that require the ability to comprehend complexity.
“An no one in climate science has claimed that CO2 explains short-term T variation.”
Nate,
If it can’t explain short-term T variation, it doesn’t explain long term T variation.
Cause you know, long-term is the short-terms put together.
So I ask you, how does a string of non-explanations turn into an explanation?
> If it can’t explain short-term T variation, it doesn’t explain long term T variation.
Holy meteorological fallacy, Bad Man!
(It’s the other way around.)
Bad Andrew, try applying your logic to the issue of whether the tilt of the earth explains variations in temperature.
Can you predict whether tomorrow (or the next day or the next day) will be warmer than today based on tilt of the earth? The changing tilt has basically zero impact on hourly or daily temperature changes.
But I bet you can predict (outside the tropics) whether January will be warmer than July.
A string of non-explanations for individual days DOES turn into an explanation for seasons.
Hi Willard,
Nice to hear from you again.
Your comment seems to be simply oppositional and lacking in meaningful content, like answering my question.
Talk to you later.
Tim Folkerts,
The relationship between the earth and the sun directly affects the earth’s temperature, yes. Observation.
More or less c02 is in the air makes it warmer or cooler is not an observation. That’s why “no one in climate science has claimed that CO2 explains short-term T variation”
See the difference?
Bad Andrew, you said “If it can’t explain short-term T variation, it doesn’t explain long term T variation.”
I am simply pointing out that this statement is ABSOLUTELY FALSE. There as MANY cases (including the one I gave) where a variable can’t explain short-term variations, but can explain long-term variations.
You need to understand basic logic before proceeding to basic science. See how that works?
“I am simply pointing out that this statement is ABSOLUTELY FALSE. There as MANY cases (including the one I gave) where a variable can’t explain short-term variations, but can explain long-term variations.”
Tim Folkerts,
OK so maybe I chose my words poorly to make my argument.
So, I concede that point.
BUT, C02 doesn’t explain any temperatures, short or long term. That’s a subjective imposition.
My bad, Bad. Allow me to explain –
The meteorological fallacy is a bit like the mereological fallacy: it’s an invalid inference from parts to wholes. A bit like suggesting that for you to think, your liver would need to think.
In our context, it’d be like saying that unless and until we can predict our next throw, we can’t say that in the long run, ceteris paribus, we can’t know that the sum of our throws will average to seven.
AGW is easy to conceive: it’s like adding a dot on the dice so that sometimes we can get 13s, more 13s, then 14s, and so on and so forth.
Thank you for your polite and patient response, Willard.
“AGW is easy to conceive: it’s like adding a dot on the dice so that sometimes we can get 13s, more 13s, then 14s, and so on and so forth.”
Indeed it is. So every throw results in a higher number than if you didn’t add the dot. Back in the day, Mosher would present a similar argument, which was “More C02 makes it warmer than it would have been otherwise.”
But it can’t be demonstrated that any dots have been added. “Would have been” is entirely imaginary.
You’ll say “More C02 is adding the dot.”
That’s a belief of yours.
I will expand on my comment. Over the years, there clearly is month-to-month variability in the dataset. That variation tends to fall within a fairly tight range. There are some notable exceptions, but not too many. To that extent, the current reading depicts the condition of the atmosphere relative to the history of the dataset. It does not explain what factors are “controlling” that temperature. Given the variation in the 13-month average, there must factors other than the steady accumulation of CO2.
The current grouping of monthly data shows a clear downward trend with the 13-month average running in the middle. That is a strong signal that the atmosphere is in a cooling phase. It does not reveal the mechanism of that decline. It does not predict the future condition.
The same argument can be made for a 30 year or 40 year trend. Without additional data going further back, it is not possible to rule out long term trends that have nothing to do with the rise in CO2. Long term surface data and sea level data suggest this current warm period could be influenced by something other than rising CO2.
Nate, get lost! Do not try to pick this apart.
Tim S
“That is a strong signal that the atmosphere is in a cooling phase.”
The current behavior of UAH is not nearly as remarkable as you suggest.
The equatorial Pacific is currently in a moderate La Niña phase, and UAH has so far bottomed out around +0.3C (though additional cooling may occur given the recent cooling in the tropics).
The most comparable pre-2023 ENSO episode is 2017–2018, when UAH bottomed out at −0.03C in September 2018.
In my view, a stronger cooling argument should at least wait to see whether the 2025–26 season reaches a similar minimum.
At the moment, we are still far from that point.
Again, you seem to feel that your comments cannot be challenged. But that is not the case, since you do not own this forum.
“It does not explain what factors are “controlling” that temperature. Given the variation in the 13-month average, there must factors other than the steady accumulation of CO2.”
As I mentioned ENSO is one that through long experience and research, we CAN know that it controls a significant faction of the short term global temperature variation.
Get back to us with your theory when the data stops going down.
[“Get back to us with your theory when the data stops going down.”]
Not a theory. Just the variation in the data — you know, the thing you were just commenting on:
“That variation tends to fall within a fairly tight range. There are some notable exceptions, but not too many.”
“Get back to us with your theory when the data stops going down”
How bout the fact we’ve just had a modest La Nina period?
Again, historically, such a period after a strong El Nino, leads to global cooling.
It is helpful to look back at similar periods of ENSO history, to see whether we have warmed relative to them.
We are now 2 y after the end of the 23-24 El Nino. We can compare to 2 y after the 15-16 El Nino, early 2018, again after modest La Ninas.
In surface record we are about 0.25 higher (end of red curve) than the same period in 2018 (end of green curve).
https://www.woodfortrees.org/plot/gistemp/from:2010/plot/gistemp/from:2010/to:2018.2
For the record, I welcome honest and intelligent response to my comments. That includes Nate just as soon as that might happen. I do not appreciate pure argument for the sake of argument. That is especially true of dumb arguments which I find really boring.
[“I do not appreciate pure argument for the sake of argument. That is especially true of dumb arguments which I find really boring.”]
Then respectfully, you should probably hold yourself to the same standard and avoid implying that Roy Spencer is somehow manipulating readers with the 13 month running average he applies to the UAH time series.
You wrote:
[“Averaging and smoothing very often leads to misleading results — especially in the short term. The manipulators probably understand this as well. That’s why they do it.”]
A 13 month running mean is simply a standard way of reducing month to month noise in the dataset.
You may not agree with everything Roy says, but he is the owner of the blog and deserves a certain level of respect.
I will just accept that you are not very bright. The 13-month average is ADDED to the graph. It does not substitute the monthly data as if that was measured. In the case of UAH, the 13-month average helps to show how the monthly variation is centered. It does not erase the monthly data.
There are numerous graphs including those posted here on this site by Bindidon that propose to show a 10-year average as the actual measured data for that year. The method is to smooth out effects such as the last 3 years as if that represents an acceleration of warming. The classic case is the various graphs that attempt to erase the warming of the 1930s with the associated rapid increase in sea level.
Thanks for asking, but you really are not paying attention.
kynquora…”A 13 month running mean is simply a standard way of reducing month to month noise in the dataset”.
***
There is no noise in the UAH data set, each data point represents actual data. The running average simply smooths out the wild variation in the data to give a smoother trend.
Tim S,
[“The classic case is the various graphs that attempt to erase the warming of the 1930s with the associated rapid increase in sea level.”]
Smoothing does not remove real events.
If an alleged feature diminishes significantly under moderate smoothing, it reflects short term variability rather than a persistent climate signal. In that case, the basis of your complaint is not particularly strong.
I have a better answer. The raw data would be even more revealing if it was done weekly, but that would be much more work for Dr Roy. Nonetheless, there is a good example of the value of the monthly data to demonstrate the rate of temperature movement. In early 2023 there was an extreme acceleration in temperature that is clearly depicted by large changes in the monthly data that are more dramatic than the 13-monthly average. Some commenters here claimed it must be a problem with the satellite — it was thought by some to be not physically possible.
“I have a better answer. The raw data would be even more revealing if it was done weekly, but that would be much more work for Dr Roy”
How bout hourly? Would that be better?
Given that weather variations are inportant on weekly time scales (it takes warm air masses a week or more to cross a land mass), this would simply add weather noise to any clmate signal.
Short term noise obscures signal of interest, which in the case of climate change is years or decades.
Eg. 30 y, is the standard mereorological period to establish the climate normal.
To those of us who analyze data for their daily job, we understand that reducing random background noise by averaging or smoothing is a standard usedul tool, when the signal of interest is expected on a much longer time scale than the smoothing time scale.
“not very bright”
Again Tim is being a delicate flower who needs to put down anyone who challenges his ‘brilliant’ opinions.
Not a good look, Tim.
Nate, in my quest to help you become a better person, I have a suggestion. If you don’t like being described as a pest, you could simply behave better. As the expression goes:
Play stupid games — win stupid prizes.
You are always welcome to make rational comments that accurately depict my statements and my intent. I think you are capable of that. I am pulling for you. I am a friendly supporter.
The lack of hour by hour data is terrible. This monthly average business is a grotesque smoothing of he truth.
“Nate, in my quest to help you become a better person, I have a suggestion. If you don’t like being described as a pest, you could simply behave better.”
Oh, OK.
So that means don’t challenge your science claims, no matter how erroneous they are, because you wont have any answers, and are very insecure and thus will need to beliittle your challengers.
Got it.
Despite Nate and barry making jokes, there is a rational aspect to the data reporting period. First, this:
“you should probably hold yourself to the same standard and avoid implying that Roy Spencer is somehow manipulating readers with the 13 month running average”
I am sorry, but that is a comment that is “not very bright” from someone who is “not paying attention”. If that individual is capable of better work, then that is what they should do — better work. I have addressed the fact that 13-month data does not attempt to erase or substitute the monthly data, but rather add to it.
As for weekly data, it would usually just add more weather related noise except for those rare periods when there is a strong effect causing rapid movement such as the early part of 2023.
As for hourly readings, I think there was a post many years ago showing a real-time display of some type. It may actually have been something different than that, but it did show a wave-like form. It has no value for looking at trends, but it is interesting show the real-time or near real-time variation due to weather effects.
Warmest winter (DJF) on record for ‘USA48’, I think
Warmest…since when? And the magnatude…by how much?
geoff sherrington…”For we scientists, the more interesting question is “What serious mistakes, if any, have they made?”
***
Are we talking about WUWT and Heartland, or the climate alarmists? I don’t see any serious mistakes made over at WUWT and Heartland is more the messenger than the message.
My concern is with the egregious mistakes made by climate alarmists. Where do I begin?
First, there is the inference that warming since 1850 has been due to a trace gas in the atmosphere. Syun Akasofu, a geophysicists who gained fame due to his brilliant work on the solar wind, claims the IPCC has erred by attributing the warming to a trace gas while ignoring the much greater factor of a re-warming from the Little Ice Age.
The IPCC are so desperate to get away from the LIA that they have dismissed it as a phenomena local only to Europe. They have not explained how it is possible for the frigid conditions recorded in Europe over the 450 years of the LIA to be local only to Europe while the rest of the planet was unaffected.
There is essentially no evidence to support the anthropogenic theory, the IPCC resorting to the work of Tyndall and Arrenhius in the mid to late 19th century. While Tyndall’s work is sound, in that he discovered gases like CO2 can absorb infrared energy, he did not prove anything with regard to the pithy amount of CO2 in the atmosphere.
Tyndall knew nothing about electrons and how they form bonds to create molecules like CO2. He had not the slightest idea as to why CO2 absorbed infrared energy. In fact, he lacked the instrumentation to do any serious measurements in the atmosphere nor did Arrhenius. Even today, we cannot prove how much CO2 warms the rest of the atmosphere.
There is not a shred of scientific evidence supplied in any IPCC literature that demonstrates how a trace gas can produce significant warming.
In fact, the long established Ideal Gas Law limits the warming of CO2 at 0.06 mass percent in the atmosphere to a mere 0.06C per 1C warming of the atmosphere.
Most IPCC propaganda comes from unvalidated climate models. The models suffer from two main issues: the amount of warming they attribute to CO2 is egregiously exaggerated and the positive feedbacks they claim that amplify warming (AGW) cannot exist in our atmosphere.
If you take away the propaganda and outright lies, anthropogenic warming theory is more pseudo-science than fact.
Gordon,
The specific heat of CO2 has nothing to do with “CO2 caused” warming (almost nothing, if fact requires .06% more heat by your own numbers).
It’s how much energy CO2 absorbs from Infra-red radiation coming from above and below that it then transfers to the surrounding molecules by bumping into them harder until all molecules are at a new higher energy.
But the 3 additional watts due to doubling of CO2 is only going to result in about 1 degree of “warming”….and even more CO2 is simply going to make the 1 degree “warmer” area of our planet slightly larger in size…..since at 15C the ground emits 390 W/m^2…one more degree is an additional 5.5 watts….while the planet average over the whole planet is 240, not 390, so the warmer area emitting to outer space is just going to get 2% larger to emit the same amount of incoming sunlight to outer space.
The area is going to get larger because the 160 watts / sq M of solar input at the bottom of the “column” causes thousands of watts of “integrated atmospheric column kinetic energy”, which is convection and Coriolis force induced winds, which send energy to other regions and altitudes where the energy represented by that 1 degree warmer temperature can more successfully escape to outer space. Down where us humans live, we’re not really going to notice 1 degree warmer due to 20 degree daily swings due to “the weather”.
“the positive feedbacks they claim that amplify warming (AGW) cannot exist in our atmosphere.”
How do you explain the large global temperature difference between glacial and interglacial periods without invoking positive feedbacks?
Orbital variations act as the initial trigger for ice age cycles, but they mainly redistribute regional insolation rather than significantly altering global mean insolation.
Without major feedbacks, it is difficult to see how such large global temperature changes could occur.
eldrosion…when we talk about positive feedback in the context of anthropogenic warming, we are talking about an amplifying positive feedback. Let me explain.
There are two basic types of positive feedback. One requires an amplifier to amplify input signals, a portion of which is fed back to the input, either in phase or out of phase. That kind of feedback, no matter where or how it is applied is governed by the equation…
G = A/(1 + AB)
G = overall gain of system
A = amount of amplification, or gain
B = amount and phase of output signal fed back to input.
If the sign of B reinforces the input, then the output increases each cycle and can eventually runaway, limited in electronic amps only by the amount of current the power supply can deliver or the ability of the devices to deal with high current before they blow. A controlled form of this positive FB is used in oscillators and the likes.
If the sign of B detracts from the input signal, the output signal reduces. This form is used in audio amplifiers to increase and flatten bandwidth.
This type of positive feedback cannot exist in the atmosphere since there are no amplifiers available. Unfortunately, people like Carl Sagan and his acolyte at NASA GISS, James Hansen, incorrectly applied such theory inappropriately, envisioning a thermal runaway greenhouse effect on Venus.
They have tried to model Earth’s atmosphere based on Venus. Problem is, the surface temperature of Venus is 450C whereas the average temperature on Earth is closer to 15C. There is no way the dense atmosphere of Venus could have been caused by thermal runaway due to CO2.
Another type of positive feedback is the type used in servo systems where amplification is not required to operate the system. Rather, the system works on voltage polarity. This kind of PF is more like what is found on Earth.
For example, if one needs to control the speed of a motor, one can use a motor controller, an electrical device that varies the armature current to the motor. Motor speed is directly proportional to armature current.
It is then a matter of attaching a tachometer to the motor shaft, the purpose of which is to generate a positive and negative voltage, depending on whether the motor RPM is above or below a set point RPM. If positive means the RPM is high, and low is vice-versa, those signed voltages when fed back to the motor controller tell it whether it should increase or decrease the armature current.
Hopefully, you agree that kind of feedback can amplify nothing. So, we are left with amplifying feedback to explain any warming due to feedbacks. If you check it out carefully, you will see that any feedback in the atmosphere has to be negative only. If it is referenced as positive, it is done relatively, with positive meaning a not-so-negative, negative feedback.
Ergo, positive feedbacks in the atmosphere cannot amplify heat, yet climate models are incorrectly programmed with such amplifying feedbacks.
If you are suggesting that I think I am correct and all scientists claiming temperature rises due to PF are wrong, that’s exactly what I am saying. There is an excellent explanation here by engineer Jeffrey Glassman, under ‘Gavin Schmidt and Positive Feedback’.
http://rocketscientistsjournal.com/2006/11/gavin_schmidt_on_the_acquittal.html
Schmidt, with a degree in math and head of NASA GISS is revealed as having no idea of the meaning of amplifying positive feedback. Yet he uses that theory to give his models far too much warming effect.
Feedbacks in physics simply means a change in a system alters conditions in a way that increases or decreases the original change.
Many systems behave this way without electronics. For example, consider avalanches. A small disturbance can cause some snow to start sliding. As that snow moves downhill, it destabilizes additional layers of snow, causing more of it to break loose and join the slide. The process builds on itself, and the avalanche rapidly grows larger. There is no amplifier circuit involved.
Regarding climate change specifically, it is well established that the Arctic is particularly sensitive to warming. One major reason is the loss of sea ice. This exposes more open ocean, which transfers heat to the colder Arctic atmosphere during autumn and winter. The Arctic surface temperature record clearly shows this trend: October is the fastest warming month at the North Pole.
Eldrosion,
Why do you say that orbital variations are the initial trigger for the ice age cycles? No two orbits are the same. By the same logic the climate warming could also be caused by the orbital changes.
How big a change in the orbits would cause an ice age or global warming?
In 2007 I read a post titled “Natural Variation.”
Apparently we are still stuck on that lesson nearly two decades later. Deniers still cannot reconcile natural variability with a rising GHG induced trend.
http://web.archive.org/web/20070225090704/tamino.wordpress.com/2007/02/20/natural-variation/
Why? Because they are afraid of reality.
Nice post, El. Almost 20 years old now and just as relevant as ever!
That’s because there is not an iota of scientific proof that anthropogenic warming has any significance. If you have such proof, a one to one correlation between the 0.06 mass percent of CO2 in the atmosphere and significant warming, I’d love to see it.
This Eldro guy just can’t get it. He believes in the CO2 nonsense, and he’s sure the science is on his side. Yet, he doesn’t even understand the basics.
His cult claims that Earth is 33K warmer than it’s supposed to be because of CO2. When I asked him where the “33K” came from, he balked. When I tried to explain it to him, he balked.
He doesn’t know the science, and he can’t learn.
The “33K” nonsense comes from comparing Earth with an imaginary sphere. A sphere that has no oceans and no atmosphere. It’s a completely absurd comparison. It’s a perversion of reality. Yet it’s the basis of the CO2 nonsense.
The warming we’re seeing is due to “Natural Variability”, not any CO2 nonsense. The science is NOT on the side of the CO2 cult.
The issue raised was statistical: temperature records consist of a long term trend plus natural variability, and short windows can be dominated by that variability. That is why short segments of the record can appear flat or even cooling while the longer record continues to show warming.
Whether the long-term trend is attributed to CO2, solar forcing, or something else is a separate question. The statistical structure of the data remains the same:
temperature = trend + natural variability.
This comment does not really address the point being discussed. And you need to accept the fact that the planet is dying.
Eldro, the fact that the “33K” nonsense is a basis for the CO2 hoax went right over your head. You refuse to accept reality, and you can’t learn.
Thanks for proving me right, again.
And since we know CO2 can’t warm Earth, then your “equation”. becomes reality:
trend = CO2 warming + solar forcing + natural variability
trend = zero + natural variability
temperature = trend + natural variability
temperature = natural variability.
CO2’s radiative forcing does not depend solely on the simplified 33 K estimate.
Another strong line of evidence is the observed cooling of the stratosphere alongside warming of the lower atmosphere.
In the thin stratosphere, infrared photons emitted by CO2 are more likely to escape directly to space. In the denser lower atmosphere, photons are much more likely to be absorbed and re emitted.
Spamming “thanks for proving me right” like it is a victory lap just tells everyone you are insecure about your position. We all know self awareness is not exactly your strong suit.
I see you’re already using false accusations, Eldro. That didn’t take long. Thanking you for proving me right is NOT spamming, it’s reality.
You’re just throwing crap at the wall now, hoping something will stick. “Photons” won’t help your case, they debunk it. CO2’s 15μ photons can not raise the temperature of a 288K surface. Just like photons from ice cubes can not boil water.
So thanks again for proving me right.
Your attempt to use photons failed as quickly as the bogus “33K” nonsense. What will you try next?
You failed to see the insulation mechanism operating in the lower troposphere.
And if your reply did not address the substance of my argument, how exactly did it “prove you right”?
Eldro, your “photons” didn’t work for you so now you’re trying the “insulation mechanism”. Obviously you don’t understand that CO2 isn’t “insulation” for Earth. Oxygen and Nitrogen can provide insulation, but CO2 absorbs and re-emits. The re-emitted 15μ photons can not raise Earth’s 288K surface temperature.
You clearly don’t understand any of this, which proves me right, again.
What will you try next?
“CO2 absorbs and re-emits”
…including downward toward the surface, reducing the rate of at which energy escapes to space.
Get it?
For that to work, the surface temperature would have to be much less than 288K. Say, 150K?
Nothing on Earth is that cold.
What will you try next?
Here is Google AI’s answer to the question of whether insulation requires the insulating material to be warmer than the object being insulated:
“No, insulation does not require the insulating material to be warmer than the object being insulated.”
Your question is wrong, Eldro.
You’re incompetently confusing “insulation” with “photon absorp.tion”.
It’s almost as if you don’t know what you’re talking about, huh?
Its just maths. and the sums don’t add up, John Christy.
Your response is unclear. Can you specify what you mean?
The 33 K difference between Earth at 288 K as it is now, and Earth at 255 K doesn’t have anything to do with
– CO2
let alone with
– a ‘sphere that has no oceans and no atmosphere’.
The difference lies in the water content of the troposphere, which currently ranges between 0.4% and 5% in the tropics, compared to a situation where:
– the planet receives significantly less solar radiation – for example, due to an extreme position within one or more Milankovitch cycles
and consequently,
– the troposphere cools so drastically from the tropopause to the surface that all the water vapor it contains precipitates, and the Earth’s surface then resembles an icy ball.
For this reason, the albedo in the equations used to calculate the 255 K is 0.3 – exactly as it is currently, since 0.3 is also the albedo value for long living ice (fresh snow has an albedo of 0.8).
The albedo value for a ‘sphere that has no oceans and no atmosphere’ is around 0.12: this is no alarmista invention.
It is the value shown for our Moon in the pseudoskeptic GHE denying papers written by Nikolov & Zeller under their (stoopid) nicknames ‘Volokin & Rellez’.
Bindi, you’re very confused. Most of your comment is either irrelevant or wrong.
The “33K” nonsense is clearly your cult’s attempt to “prove” CO2 warming. Where have you been?
Stick with producing poor-quality graphs. Even the simplest science is over your head.
Ah, the little ankle-biting Clint R dog can’t keep silent, denies evidence with the usual
” Most of your comment is either irrelevant or wrong. ”
without of course being able to explain why.
*
” The “33K” nonsense is clearly your cult’s attempt to “prove” CO2 warming. Where have you been? ”
No. Any scientist knows that water vapor is by far the major aspect in the GHE. Only people like Clint R keep fixated on CO2, which in comparison still plays a minor role – but that will change in the future.
*
” Stick with producing poor-quality graphs. ”
You don’t even have the least idea of how to pruduce any graph, let alone to process the data they represent, hence don’t know anything about their quality.
All you are able to is ankle-biting and leaving poops everywhere, endlessly repeating your antiscience.
Bindi, your insults and false accusations demonstrate your ignorance and immaturity. You can’t even fake a knowledge of science. Want a test?
1) What is a viable model of “orbiting without spin”?
2) Can CO2’s 15μ photons raise the temperature of a 288K surface?
3) Can an incoming flux of 300 W/m² raise the temperature of a surface already emitting 400 W/m²?
You’re such a phony and fraud. I’d be amazed if you could get even ONE of the questions right….
Clint,
Blinny believes if there are no GHG’s in the atmosphere then it is isothermal. And he believes water is the main GHG. Of course, he will need to explain why the moist adiabatic lapse rate is more isothermal than the dry rate.
tim f…”The changing tilt has basically zero impact on hourly or daily temperature changes”.
***
Are you serious, Tim? If I am sitting here in good, old Vancouver Canada on a fairly pleasant winter’s day with temps around 10C, then suddenly, within hours, the temps are sub-zero C, do you think the the Earth’s tilt has nothing to do with that?
The reason the air becomes so frigid so quickly is that freezing air from the Arctic has descended on us. That air being frigid has everything to do with the Earth’s tilt and its orbital position.
The tilt causes an absence of sunlight in the Arctic, and it gets mighty cold up there without sunlight. That freezing air can descend as far south as Texas and Florida and when it collides with warmer air from the Gulf, things can get nasty.
Ergo, the tilt causes major storms in North America alone. This winter on the Pacific Coast by Vancouver was particularly mild whereas further east, right to the Atlantic, conditions were brutal re cold ad storms. Earth’s tilt producing cold Arctic air which was pushed aside by warmer Pacific air.
Tim F,
You claim that the earth tilt has zero affect on temperature changes.
So how do you explain that in the northern hemisphere it’s actually a lot colder when the earth is closer to the sun.
Gordon Robertson,
Your reply didn’t address the main point.
Tim Folkerts was making a timescale argument about signal versus variability. Earth’s axial tilt changes negligibly over days and weeks, which is why winter lasts roughly 3 months. As such, it is not a useful predictor of temperature on weekly timescales.
By the way, in your earlier comment were you interpreting the term “noise” as fake or erroneous data? “Wild variation” is exactly what statisticians mean by noise.
https://www.drroyspencer.com/2026/03/uah-v6-1-global-temperature-update-for-february-2026-0-39-deg-c/#comment-1736680
No worries if that was the interpretation. Tim S perplexingly argued that Roy’s running average is fake and intended to mislead, which understandably muddies the discussion for readers.
Earth’s thermal inertia is tremendously large. It is the reason Earth is never in equilibrium with incoming solar energy.
Either there is a slow, orbitally forced rise in global accumulated thermal energy, or, decline in thermal energy, because of the orbitally forced the lessened the surface accumulative abilities.
In our times the total yearly SW reflection along with the total yearly immediate IR emission are lower, than some few millennia previously. Lowering radiative losses resulted to increased heat accumulation and global temperature rise.
The warming is because of orbital circumstances, not because of extensive fossil fuels burning. The phenomenon originates from the planet’s changing ability to accumulate solar energy.
When Earth is closer to sun on winters, Earth gets warmer, than when Earth is closer to sun on summers. A big differencies occur, with the intermediate phases in between. You will be immediatelly convinced by a single glance at a classroom’s demonstration globe.
–
https://www.cristos-vournas.com
My name is Charlie Kirk and my credit card number is 6735-8812-2278-6833
The expiration date is 08/27
The security code is 269
https://tinyurl.com/yptsh697
What kind of weird post is this?!
” How big a change in the orbits would cause an ice age or global warming? ”
*
It seems that some have difficulties with the influence of Earth’s orbit changes on its climate.
Of course: people observing this influence don’t look at geologically tiny moments like e.g. the last 2000 years.
The best to understand the issue is to have a look at a beautiful page made long time ago by people working at Indiana’s University, but which recently disappeared, very probably due to the dictatorial, ‘anti-free speech’ behavior of the US’ top ignoramus known as the Trumping boy.
*
But… thankfully, there’s (1) the Web Archive and (2) all those companies like Alphabet or Amazon that scour the entire web daily to optimize their answers to our questions, heh heh.
So take a look at these simple explanations:
https://web.archive.org/web/20210206021955/https://geol105.sitehost.iu.edu/images/gaia_chapter_4/milankovitch.htm
Bindy,
The fact that Tim F said that the earth tilt has zero effect is utterly wrong. Then you miss, on purpose, the fact that Tim F was saying that the earth’s orbit can cause an ice age but not cause any warming.
Do you & TimF ignore logic on purpose or just lack the skill?
Anon for Q-related reason,
Mighty Tim said no such thing.
As an old minarchist used to say: read harder.
Cheerios.
Dullard, if you are that scared of Co2 then stop breathing.
Anon from Australia – Why the lies? And didn’t you get fed to the crocs a year or two back?
eldrosion…”Feedbacks in physics simply means a change in a system alters conditions in a way that increases or decreases the original change”.
***
That explanation is straight out of the Gavin Schmidt school of physics and is far too simplistic. In fact, it is wrong. It fails to satisfy the defining equation for PF…
G = A/(A + AB)
It is imperative to understand that we cannot get something for nothing. If we want to increase a quantity like heat we need to amplify it. Heat will not amplify on its own and the 2nd law tells us that heat cannot transfer itself from cold to hot, just as no other form of energy can transfer itself from a lower potential to a higher potential by its own means.
How do we amplify heat from the Sun? What is a heat amplifier, how does it work? Positive feedback can only work where a form of amplification is available. In nature, the only means I know of doing that is through resonant structures and even at that, the amount of amplification is limited.
Specifically, in order for a positive feedback to work, there needs to be a mechanism wherein the output is isolated from the input. Otherwise, the two systems cannot interact in such a manner that an increase can take place in the output so that it can send a signal back to the input to increase the output even more.
If you have straight resistive network without an active device like an amplifying transistor, it is impossible to speak of positive feedback. We can talk about negative feedback to an extent and in the atmosphere, without an amplifier, all we can discuss is negative feedbacks.
Albedo is of necessity related to negative feedback, not positive feedback.
With electroncs/electrical signals, the amplifier acts as an impedance buffer that essentially isolates the input from the input while allow the input signal to affect the gain of the transistor. The gain is due to a lower current in the input of the transistor allowing more current to flow in the output, however, the extra current is produced by the power supply. Ergo, we are not getting something for nothing.
Transistors are designed to do that but there is no mechanism available in the atmosphere to do it. Since the Sun supplies all of our heat, a positive feedback system, in order to increase that heat, would need to interact with another device that allows an increase in heat. One such mechanism would need to increase heat from the Sun while another would need to draw heat from another source, like another star.
Alarmists have made the egregious mistake of presuming a trace gas in the atmosphere can act like that independent heat source. Not only does that theory contradict the 2nd law, by allowing heat to be transferred from a colder atmosphere to a warmer surface, it is an example of perpetual motion whereby heat from the surface is recycled back to the surface to increase the surface temperature independently of the Sun.
If you think there is such a mechanism, please explain it in detail without resorting to generalities as does Gavin Schmidt. He does a lot of hemming and hawing without explaining the exact mechanism. In fact, he cannot explain it mathematically because he tried and botched it.
Snow on a slope is not an example of positive feedback. Basically, you have the force of gravity acting on the snow, which has compacted and supplied friction to hold it in place. If the snow freezes, which it will, and new snow falls on it, the frozen surface supplies a lowered resistance and the downhill force finds it easier to overcome the resistance. Of course, vibrations help to break the bond holding the snow but the entire mechanism is not an example of positive feedback.
Albedo is not a form of positive feedback. We are looking for an amplification of heat and that requires a greater input of heat or a lowering of heat dissipation from the surface. The Sun is the input and unless there is a mechanism for retaining heat that is controlled by a feedback mechanism, there can be no positive feedback.
The atmosphere serves as a means of retaining heat longer but it is the entire atmosphere, that is 99% nitrogen and oxygen that is involved not the trace gas acting a lone.
Explain your albedo theory to show how an input of heat from the Sun can be controlled in a feedback loop.
What we need is a natural vibration capable of resonating at a specific frequency. A perfect example is the Seattle-Tacoma Bridge collapse. It was a suspension bridge built with cables supporting the bridge deck. The wind blowing past the cables caused them to resonate like a guitar string resonates with the body, especially in an acoustic guitar.
Unfortunately, with the SeaTac Bridge, the deck supported by the cables formed a resonate structure that vibrated at the same frequency as the cables. Vibration was fed back from the deck to the cables causing them to vibrate harder and the resonance escalated till the deck was vibrating like a long sine wave.
There are ijits out there arguing in retrospect that it was not resonance that caused the collapse. However, nothing else can explain such an amplification of oscillation due to a 40 mph wind. Obviously, such a wind is insufficient to cause a rigid bridge deck to oscillate on its own. In other words, without the suspension cables, the bridge would not have gone into oscillation.
Gordon, you may want to check your references about the failure of the Tacoma bridge. The failure of the bridge was to do with the deck not the cables. Failure of that & Ferry bridge caused a lot of research into aerodynamic effects on structures.
And unlike Bindy Brownshirt I don’t consider myself an engineer, just have family in the field. But then again Bindy considers himself a guru on computer etc.
anon…the problem I have with that theory is that a structure stiff enough to carry vehicles is highly unlikely to vibrate due to a 40 mph wind.
I think it is far more likely that the supporting cables would begin vibrating, even slightly, and that the vibrating energy would get transferred incrementally to the main structure. If the main structure was tuned in some way to the vibrating cable frequency, that could enhance resonance to the point where the bridge failed.
After all, winds don’t resonate, they supply the force required for the cables to vibrate. I am sure the actual problem is far more complex but I can hardly see a steel structure designed to carry vehicles vibrating due to wind.
Gordon,
Ever been in a skyscraper when the wind is a strong breeze. The building sways. I think that the twin towers used to sway over 11 meters and affected people. A skyscraper is a lot more rigid than a thin bridge deck.
“Snow on a slope is not an example of positive feedback. Basically, you have the force of gravity acting on the snow, which has compacted and supplied friction to hold it in place. If the snow freezes, which it will, and new snow falls on it, the frozen surface supplies a lowered resistance and the downhill force finds it easier to overcome the resistance. Of course, vibrations help to break the bond holding the snow but the entire mechanism is not an example of positive feedback.”
You just described a positive feedback mechanism, even though you claim it is not one:
“frozen surface supplies a lowered resistance and the downhill force finds it easier to overcome the resistance.”
“Albedo is not a form of positive feedback. We are looking for an amplification of heat and that requires a greater input of heat or a lowering of heat dissipation from the surface. The Sun is the input and unless there is a mechanism for retaining heat that is controlled by a feedback mechanism, there can be no positive feedback.”
The solar input does not change in ice albedo feedback. What changes is the fraction of that energy that is reflected versus absorbed. Ice reflects much more sunlight than open water. When warming reduces ice cover, the planetary albedo decreases. This allows more solar radiation to be absorbed by the surface. That additional absorbed energy causes further warming.
An example of positive feedback.
Some wacko wants to push a left wing eco ideology.
leftwing legacy media report on it as if were fact.
Anon for a reason
What the world wouldn’t give for AGW to be a grand conspiracy!
kynqors…”By the way, in your earlier comment were you interpreting the term “noise” as fake or erroneous data? “Wild variation” is exactly what statisticians mean by noise”.
***
I was using the definition of noise from electronics systems where noise is an unwanted and often a spurious signal. In other words, it has nothing to do with the desired signal.
I don’t know why statisticians would describe wild variations of real data as noise. Wild variations in an audio signal is not regarded as noise unless it is an unwanted signal produced by something like EMR. I don’t see anything in the UAH data that I’d call noise.
The red running average is designed to smooth out wild swings and produce a curved trend that indicates how the data is trending.
In music, especially with a guitar, three notes that are related like CEG, (first, 3rd and 5th notes of the C-scale) sound good when played on a normal tuned guitar. However, if you play the same chord through a distortion unit, the combination of notes will produce spurious harmonics that are are not in tune with the original chord. That combination produces essentially noise that is unpleasant to the ear.
Rock guitarists get around that by playing power chords through distortion units which are often combinations like firsts and fifths. Those notes produce harmonics that are pleasant yet adding a 3rd through the distortion unit does not. Spurious harmonics produced are unpleasant to the ear.
Has anyone perchance calculated the linear trend for the last decade?
Since February 2016, the linear trend is 0.32C/decade.
Is that what you are looking for?
Yes, thank you.
I hope you know better. This is the worst kind of cherry picking during a period of an obvious anomaly over the last 3 years. In your previous posts you always seemed like someone who wanted credibility. You should ask this question in a few more years when the data show the true nature of the recent effect.
Hey, I’m not only old enough to know better, I can even remember years and years on this blog when the deniers were claiming it had been “cooling” since 1998. (It hadn’t.) I’m just getting my own back.
In a few more years a proper time-series analysis will still show accelerating warming. We already know that, because we have a huge body of established science describing the mechanism behind warming since the Industrial Revolution. Sure, there’s definitely a very slight chance that a period will occur when that is not the outcome, but it won’t be significant. That would just be natural variability and the vagaries of sampling. The Earth is warming. We know why. End of.
P.S. Cherry-picking “is the act of pointing to individual cases or data that seem to confirm a particular position while ignoring a significant portion of related and similar cases or data that may contradict that position.” (Wiki) What I did is better described as “asking has anyone perchance calculated the linear trend for the last decade”.
You’re welcome.
I gave you a chance to explain this. Every knowledgeable person knows that the history of the satellite record contains annual and decadal variations. Asking about 10-year trends is entirely incompetent, and the very definition of cheery picking. The proof is the fact that I do not need to explain this to anyone else.
The promised us palm trees and grapevines, and this is what we got!
https://www.youtube.com/shorts/3t1NKz5HpGQ
MaxC,
Who specifically promised that global warming would bring palm trees and grapevines to New York City in late winter?
Kyngora, take your choice.
The alarmist cult goes back to Hansen. Followed by a long list starting with Gore, continuing with “How dare you” Greta.
Of course the MSM and Hollywood was fully in on the hoax.
https://en.wikipedia.org/wiki/The_Day_After_Tomorrow
This long-term trend doesn’t show any indication of acceleration from CO2 warming and the cyclical response demonstrates negative feedback in the system.
Well, it wouldn’t would it? It’s a long-term trend.
Elliott, the point is that if CO₂ were adding a strong positive feedback on top of the baseline trend, you’d expect to see some deviation from the established long‑term cycle—either an inflection, a change in amplitude, or a shift in the underlying slope. Instead, the signal tracks the same multi‑decadal pattern it always has.
A long‑term trend doesn’t magically hide acceleration. If the forcing were large enough to alter the system’s feedback structure, it would show up in the shape of the curve. The fact that the cycle persists with the same timing and magnitude is exactly what you’d expect from a system dominated by internal variability with stabilizing (negative) feedbacks, not one being pushed into a new regime by CO₂.
If you plot a long-term linear trend, you get a straight line. I would have though that fairly elementary. If you look at the trend for the last decade, you get a line more than twice the gradient of the long-term trend. Now, I knew that before I asked, so there’s an element of self-confirmation there, but the fact is that if you do a proper time-series analysis of the (limited) data in Dr. Roy’s series you get a clear accelerating trend.
The Basics — Part 1
Not long after I began commenting here, I noticed the Warmists did not understand the basic science. Not only that, they didn’t even understand their own cult beliefs. For example, the one that calls himself “Eldrosion”, does not understand where the “33K” nonsense comes from! Recently, Bindi inadvertently admitted he did not understand either. My guess is the vast majority of the cult doesn’t understand the basics. Greta certainly doesn’t….
If people understood the basic science, the CO2 hoax would go away. So all Skep’ics should make sure they understand the basic physics. It’s not that hard. For example:
Problem 1: A perfectly conducting sphere (emissivity = 1) receives flux from four sources equally spaced around its equator. Each source supplies 1000 W/m² to the sphere’s “disk”.
Do you understand the problem? Can you solve it?
Consider one source at a time. Since the incoming flux impacts the sphere’s “disk”, the eventual emitted flux from the sphere will be 1/4 of the incoming, since the disk’s area is 1/4 of the sphere’s area. So using the Stefan-Boltzmann equation, the temperature of the sphere can be calculated.
S = σT⁴
S = 1000/4 = 250
σ = 5.67/100000000
T⁴ = 250(100000000)/5.67
T = (4409171075)^0.25
T = 258K
Now add the second source of 1000 W/m². The emitted flux is then 500 W/m².
S = 500 W/m², T = 306K
For 3 sources, 750 W/m² emitted:
S = 750 W/m², T = 339K
For all 4 sources, 1000 W/m² emitted:
S = 1000 W/m², T = 364K
This is only at a high school level of physics. It’s not that complicated. That’s why it’s so instructive that very few of the cult kids could even answer Problem 1. The cult kids have no knowledge of the relevant physics, and can’t learn. If you’re already skeptical of the CO2 nonsense, please make sure you understand the basics. This nonsense would not have lasted as long as it has if everyone understood the basic science.
To be continued….
Justice the American Way
https://www.whitehouse.gov/videos/justice-the-american-way/
Now we all can admire the mental level of all these people.
*
Translated from a German newspaper:
” Particularly noteworthy: Several of the actors shown are outspoken Trump critics. Robert Downey Jr. and Bryan Cranston have publicly opposed Trump; Downey Jr. even actively campaigned for Kamala Harris in the 2024 election.
Another detail amused users: Several of the actors in the video are not American. Russell Crowe is from New Zealand, Mel Gibson is Australian, Keanu Reeves is a Canadian citizen and was born in Beirut, and Ryan Reynolds is also Canadian. ”
**
This is reminiscent of one of the most shameful self-portrayals ever published by a US president:
https://www.youtube.com/watch?v=ugrn6DNAYEU
*
Shame on you, Trumping boy, and shame on all those who profit economically and financially from your misdeeds and cowardly applaud you for precisely that reason.
*
But… isn’t all this best for people like Clint R., who are all incurably suffering from the “Trump addiction syndrome”?
Well, Trump can certainly be an idiot. I am an American and I appreciate our written Constitution and our mostly (certainly not all) positive role in the world. He promised “America First” and these overseas “adventures” look like we are trying to be the world’s policeman all over again. I am tired of seeing young Americans killed, maimed, and marred for life mentally by combat experiences. Hopefully, he is using our military power in a way that Presidents going back to Truman were unwilling to do – massive, overwhelming force (which we have) to achieve an objective quickly, actually limiting overall loss of life by limiting the length of the combat.
He doesn’t just “push the envelope” on using his constitutional power, he rips it open. He certainly has all the impulses of a dictator. But our institutions (Supreme Court, Congress, Federalism, etc) are strong enough to survive Trump.
I disagree with several of his policies, I hate the way he denigrates people, I dislike his communication style. Yet, he may well be saving our country from a worse fate…the twin prisons of democratic socialism and cultural suicide. Both are on display in Western Europe, Canada, and Australia. Until Trump, we were well on our way to joining them. Except for fleeting moments, patriotism is gone there. They can’t defend themselves, let alone help othered who are being attacked. Their economies are sick and exhausted from pulling a heavy sled of people who won’t work hard and immigrants flooding their countries. They have forgotten the traditions of the Enlightenment and Reformation which made them so strong. Western Marxism (research it if you don’t recognize the term) has made its 100 year march through their institutions and left them zombie like – their structure is there, but life has gone out of them.
Trump seems on his way to destroying the power of some of the worst actors on the planet, something the flaccid UN and NATO could never do. With no help from either. We will not forget. Europe, notwithstanding NATO, we came in WWI, we came in WWII. We are not coming the next time. You are on your own.
That’s interesting. The rest of the world is sick and tired of seeing tens of thousands of non-Americans murdered or maimed for life and hearing the US whine about the few of their own terrorists that were hurt while doing it.
Bindi show what the term “useful idiot” means. You actually believed Trump is personally creating youtube videos? LOL.
Here’s what actually happens. Trump sees the video online and thinks it is funny so shares it with his followers. Hate Trump media then claims Trump produced the video and all their radical, leftwing followers repeat the lie.
I see a lot of the same arguments being tossed around. The question of whether GHGs have been recently warming Earth has been clearly demonstrated to be false by NASA CERES mission data. This is laid out nicely by some graphs.
https://wattsupwiththat.com/2025/01/22/greenhouse-efficiency-2/
It is now clear all the warming in the 21st century was due to increases in solar energy allowed by a reduction in clouds.
richard m…I would not say all the warming is produced by that, I think most is due to a simple re-warming from the Little Ice Age that ended circa 1850.
If any is produced by AGW it is a tiny, insignificant amount limited to 0.06C per 1C warming of the atmosphere.
Gordon, my reference was to the physical cause of the warming. What drives the cloud changes is still up for debate. Part of that might certainly be tied to long term cycles.
In addition, the data only references the post-2000 period. The data does not cover the pre-2000 warming. I think that period could be better defined as the recovery from the LIA.
Lamb came to the same conclusion in the 1960s
eldrosion…”You just described a positive feedback mechanism, even though you claim it is not one:
“frozen surface supplies a lowered resistance and the downhill force finds it easier to overcome the resistance.””
***
You can’t just define feedback any old way and call it science. Here we are talking about a specific type of feedback called an amplifying feedback and the name says it all.
The AGW theory is based on the idea that GHGs in the atmosphere trap infrared energy from the surface them radiate (feed back) a portion back to the surface. That back-radiated IR allegedly gets absorbed by the surface and raises the temperature of the surface.
If that was true, it would represent a positive feedback. However, it cannot be true for two main reasons….
1)the theory contradicts the 2nd law of thermodynamics. That is, heat is being transferred, by its own means, from a colder region to a warmer region. No form of energy can be transferred from a lower potential source to a higher potential target.
2)since the surface supplied the IR in the first place, cooling as it did (a heat loss), the AGW theory is suggesting that heat can be recycled surface to atmosphere and back so as to raise the temperature of the surface. That is perpetual motion, plain and simply. Essentially, you are getting something for nothing.
Because there are major losses in this system, it cannot replace the losses never mind raise surface temperature. That’s what perpetual motion is about, it’s a theoretical lossless system.
The only way that could possible work is if another heat source was involved. IR radiated by the surface would need to activate the heat source which would raise the surface temperature. That is, a heat amplifier would be required.
Your example of snow on a slope has no system never mind a feedback. Neither does the albedo theory.
A feedback mechanism has to be part of a system. There has to be an input and an output with a mechanism to ‘feed back’ energy from the output in such a manner that the input signal is boosted or attenuated.
Had the clowns of today been alive 16 thousand years ago when the warming began would they have tried to stop it. rather yhan celebrate its arrival ?
The Basics — Part 2
There is a lot of confusion in “climate science” about three terms, “flux”, “energy”, and “heat”.
“Energy”, in physics, commonly has units of “Joules”. “Heat” is a little more complicated as it is a “rate”, and commonly has units “Joules/second”, or “energy per time”. People that have not studied physics get confused, thinking that “energy per time” is the same as “energy”. That’s WRONG.
To illustrate the difference “per time” makes, most adults are familiar with the term “speed”, from driving vehicles. They know that “speed” has units of “miles per hour” or “kilometers per hour”. “Speed” is “distance per time”. So “speed” is clearly not “distance”, just as “heat” is not “energy”. This will be important to understand when we discuss the Second Law of Thermodynamics (2LoT).
A “Watt” has units of energy per time, specifically Joules/second. The Watt can be used either for the transfer of mechanical energy (power), or the transfer of thermal energy (heat). In the “English” system, often still used in the US, power can have units of “horsepower”, and heat has units of “BTU/hr”. Both units are still “rate” units. “Horsepower” and “heat” are NOT amounts, they are “rates”. That’s why it’s incorrect to say something “contains heat”. That’s as incorrect as saying your car “contains” 60 mph!
“Flux” is even more complicated, but responsible adults are able to understand it. “Flux” has units of “energy per time per area”, often seen as “Watts/square meter”. So obviously, flux is NOT energy. “Flux” is simply the power (NOT energy) passing through an area.
To review:
Energy — Joules
Watts — Energy/time — Joules/second
Flux — Power/area — Energy/time/area — Watts/m²
Heat — Energy/time — Joules/second — Watts
To be continued….
You have omitted the solid angle in your definition.
Keep trying.
I keep pointing out that the cult kids don’t understand any of this, and they keep proving me right!
[Only adults will understand there was no need to mention anything about spherical geometry in my comment.]
Kids these days….
Hey professor – let’s see your derivation of the Solar Constant before we go any further.
Child, you have a history of ignorance. You need to try to learn.
Do you have any responsible questions about the relevant issue, Part 2?
StudentB,
You mentioned the solar constant, so a quick question.
how much time each year does the earth receive the solar constant of energy from the sun?
Still waiting.
Can anybody help him?
Energy flux is the rate at which energy transfers through a given surface area, typically measured in watts per square meter.
It defines how much energy (in joules) passes through a specific area (in square meters) per unit time (in seconds) and is crucial for quantifying heat, solar, or electromagnetic energy flow.
*
Key details regarding energy flux:
Definition: It represents the intensity of energy flow, representing energy per unit area per unit time.
Units: The SI unit is watts per square meter or sometimes calories per square centimeter per day.
Applications: In physics and astronomy, it represents the energy flow of light or heat (e.g., solar radiation hitting Earth).
Poynting Vector: In electromagnetism, the magnitude of the Poynting vector represents the energy flux, with its direction indicating the direction of energy transport.
Alternative Definition: Sometimes “energy flux” simply refers to the total power (energy per time) passing through a surface, not normalized by area.
It is often used interchangeably with “energy flux density” when specifying that the measurement is per unit area.
**
It’s astonishing to see the technically and scientifically uneducated Clint R trying to educate the blog, a guy who after all endlessly insults astronomers, name calling them astrologers, and discredits and denigrates centuries-old scientific findings about the Moon’s spin – from Isaac Newton to scientists who nowadays analyze the composition of the lunar core by using data from retroreflectors on the Moon and from the Lunar Reconnaissance Orbiter.
But the ignorant Clint R isn’t alone in his unscientific denial of science: Other ignoramuses like Robertson consistently join him, for example, by deliberately, woefully misrepresenting for years Newton’s texts in his masterpiece, ‘Principia Scientifica’ (or even its translation in many languages by several independent translators).
As usual, Bindi finds things on the Internet he doesn’t understand, then resorts to insults and false accusations. Like the rest of his cult, he has no clue about the science. He’s never been able to answer any of my simple physics problems.
One of his funniest capers was when he attempted to produce some “proof” that Moon spins by linking to a bunch of random sources about Moon! And he still has no viable model of “orbiting without spin”. The poor guy is absolutely clueless.
Which proves me right, again!
thomas hagedorn…”I am an American and I appreciate our written Constitution and our mostly (certainly not all) positive role in the world”.
***
Thomas, I hate to be the bearer of bad news, but America is a continent and any denizens of any of the Americas is equally an American. Unfortunately, that excludes Hawaii, who are part of the United States but who reside in a different continent than the Americas hence cannot be American.
Look on any atlas of the world and you will find no country called America. Study a course in geography and you will find no country named America. The name of your country is the United States, and it is located in North America, along with Canada. Ergo. Canadians are as much Americans as you in the good, old US.
“Of America” does not mean America, it means the US is part of America, which spreads from the Arctic Ocean down through Central America, to the sothern Pacific Ocean below Tierra del Fuego, at the tip of South ***America***.
——
“Yet, he may well be saving our country from a worse fate…the twin prisons of democratic socialism and cultural suicide. Both are on display in Western Europe, Canada, and Australia. Until Trump, we were well on our way to joining them
….Their economies are sick and exhausted from pulling a heavy sled of people who won’t work hard and immigrants flooding their countries.
….Western Marxism (research it if you don’t recognize the term) has made its 100 year march through their institutions and left them zombie like – their structure is there, but life has gone out of them”.
***
I simply cannot fathom how people of your country have become so conditioned to believe such nonsense. You reference immigrants, does that include the people of the US and Canada who emigrated here from the 16th century onward? After all, with your celebration of Thanksgiving, you are repeating a tradition started by the Pilgrims who emigrated from the UK and according to Google AI, “The Pilgrims landed at Cape Cod (Provincetown) on November 21, 1620…”
Obviously, you seem to be referring to non-White immigrants who were initially stolen from Africa to act as slaves on plantations in the fledgling US. They hardly had a choice in the matter.
I don’t see Trump trying to send Blacks back to Africa. He would be insane to try it since there are some 50 million Blacks in the US and Trump knows better than to mess with them. Rather he cherry picks who is undesirable and who is not.
Later, countries like the US and Canada began focusing on immigrants from Asia and the Middle East since they were more desperate and less well informed than the unionized workers emigrating from Europe. You see, those ingrates from Europe began organizing and demanding better wages and conditions. Naturally, capitalists from both countries began spreading the propaganda that the socialist principles demonstrated by such people were related to Marxist policies.
There is nothing wrong with our economy in Canada, unless you are a raving right-winger who regards universal medicare as a plot engineering by Stalin. No one gets sick in Canada and gets ignored because he/she cannot afford medical care. A sore point here is that sick relatives of immigrants are being treated as well, but heck, even an Archie Bunker like me would not complain about an old, sick man or woman being treated for poor health free of charge.
There is no such term as a Western Marxist for the simple reason there is no such thing as a Marxist. Those calling themselves as such have simply made up the name to associate it with Marx.
Marx himself has been taken entirely out of the context of his time. Today, no one would pay him any heed but in his day, his claims were apt. Black-hearted capitalists were ensuing that the average Joe had little or no incomes while forcing children of 12 to work down coal mines.
By speaking in a derogatory manner about Marx, you are simply revealing the abject brain-washing you receive in the US by far right-wingers in your good country. You are also condoning the conditions of his times that would better be associated with banana republic dictators today.
I want to be clear that I find the works of Marx to be more amusing than anything when taken in the context of our modern democracies. I certainly don’t take his work seriously but if I lived in his times, I would regard him a hero rather than a villain.
If you think we are all zombies up here in Canada, why don’t you visit and find out first hand? Afraid you’ll be attacked by the walking dead?
——
“We will not forget. Europe, notwithstanding NATO, we came in WWI, we came in WWII. We are not coming the next time. You are on your own”.
***
The US came into WW1 three years too late. By the time you got there the war was nearly over.
WWII did not start out that well either. The US could see the brutality of Hitler but the isolationists in the US wanted nothing to do with it. Please don’t give me the bs about the US saving our bacon in WWI and WWII. The US definitely made major contributions re materials but as soldiers, they were no better than UK or Commonwealth soldiers.
In fact, when the US campaign began in North Africa, they were pretty useless. It took considerable time for US soldiers to become acclimatized to war. Rommel had a field day with them at first and had it not been for a concerted effort from the far more experienced UK-based 8th Army. Rommel would have driven the US back into the sea.
There was an exception, a big-hearted Yank and a Democrat, by the name of Franklin Delano Roosevelt, a man suffering from polio who did not allow his impediment to get in the way. FDR saw to it, IN SECRET deals with Churchill that the UK had the war materials to carry on against Hitler. The shameful part is that had he been discovered by the US Congress, you Yanks would have removed him from office via impeachment.
FDR also saw to it that the US recovered from the depression by applying good socialist techniques. His New Deal used centralized government projects to get people out of a major hole. The centralized government initiatives are better known as socialism.
The US did not enter WWII till December 7th, 1941 some 15 months after WWII began on September 1st 1939. The US would not have joined the war had the Japanese not been stupid enough to attack the US Navy at Pearl Harbour.
Please try to see through your abject conditioning. You live in a great country and you don’t need the bs that gets developed by some ijits who need further justification to make the US appear greater than it really is.
And, how about Trump. when visiting the graveyards of dead US soldiers in Europe, referred to them as ‘suckers and losers’. This is a guy who has managed to escape any military service yet he insults seriously brave US soldiers who went to Europe and died there.
The Democrats made a huge error by embracing this craziness called “progressive”. It is being compared by people like you to socialism or left-wing politics, yet is nothing more than a sickness called political correctness. That’s why Trump is currently in power, US citizens rightly rejected the progressive/woke movement. We would do the same here in Canada.
We have our own cranks here in Canada trying to push the so-called progressive agenda. I would venture to say that most Canadians reject such idiocy. The average Canadian does not stand for allowing biological males into womens’ washrooms and to play on their sports teams. We do not approve of defunding police or allowing criminals a ‘get out of jail free’ card.
Mind you, we are far too soft on criminals at times and there has to be a happy difference between being soft on crime and sentencing a Black to 25 years in prison for having a small quantity of marijuana on him.
In WWI, Canadians distinguished themselves in battle like Vimy Ridge, succeeding where others had failed. In WWII. the idiot Montgomery assigned the main Canadians force to face Nazi Panzer divisions to engage them so US forces under Paton could sneak around the edge. Thousands of Canadians were sacrificed by that idiot to help out US troops.
When that phase of the war ended, as the Nazis were routed, it was the job of Canadian troops to march along the Normandy coast and into Holland, where they did exemplary work wiping out one Nazi stronghold after the other.
Please don’t infer to me that Canadians are soft. Canadians volunteered for both wars while many US citizens sat on their hands. I want to honour those brave US soldiers who did cross the border and signed up with Canadian and British troops to fight the Nazis. There are many good and decent Yanks who clearly understand the difference between right and wrong.
There are seriously decent people both sides of our border and it is an insult to them to lump them under umbrella of Marxism. Most of those brave souls shun political rhetoric, as I do myself, and stand only for a common decency toward fellow humans.
Trump and his followers will have no idea what I am talking about.
Unfortunately, this is a very long article about western Marxism:
https://en.wikipedia.org/wiki/Western_Marxism
Western Marxism is quite real. Mark Carney is one of its many children. Starmer, Merkle, etc. also. it has ruined our (US) educational system, turning it into a tool for societal and cultural (socialist) transformation. Climate change theory is one of its many fruits.
Gramski and Lukacs, led the charge in Europe in the 20s and 30s. The Frankfort School at Columbia and John Dewey (a willing idiot) set the plan in motion in the 30s in the U.S. in 50 years they and their successors had transformed the U.S. educational system. The basic idea was that existing societies had to be destroyed first, a people had to be divided before a new socialist order could be achieved. Capitalism, even during the Depression, proved to be too successful of a system to do that so they swung over to dividing people by basic identity…race, gender, later, sexual preference and now dexual identity. Class differences also were still to be emphasized. The nation state and patriotism were to be weakened and replaced by transnational structures – formal (UN, EU) and informal (World Economic Forum). This was not a conspiracy, because it was conducted in the open. It was more a series of coordinated actions by elites who developed a shared vision, produced by their educational systems. It seems to be progressing towards a de facto world government, with zombie nation states that are more symbolic than real. Climate agreements are one feeble attempt at this.
Trump has put up a huge roadblock to this terrible idea. But it has been on the march for a long time and it will take many decades to reverse the damage done in the U.S. The jury is out on whether we will do that. It looks to me like we are the world’s best hope. There do seem to be a lot of people’s movements in the west that are fighting this elite plan.
I think Canada is a great country, I have known a number of Canadian ex oats in the U.S.
We seem to have a lot in common. Canadians distinguished themselves in both world wars. But your government has lost its way. Look at Carney’s background. He is a globalist thru and thru. He is not a Canadian nationalist. Trump stupidly allowed him to cover himself in your flag to defeat your best candidate. As for sick economies. Every western economy is struggling right now with social programs that are way underfunded and aging populations. But we are the least sick. And it has been that way for 20 to 30 years. Simply look at the most important economic statistic – GDP and its growth. Look at your (Canada and the developed world) stock markets. And socialist government refuses to harness adequately a huge asset in Alberta’s tar sands. Canada has one of the world’s largest oil and gas reserves and mismanages it. Meanwhile, the U.S. has its own reserves, looking for more, and is close to helping Venezuela and Iran (also with huge proven reserves) greatly increase their output.
I would.never imply that the Canadian people are soft. In a lot of ways (with some notable differences) the pioneers of both countries had some shared experiences. And Canadians are great at a tough, tough sport – hockey. It was only a truly amazing game by our goalie that won that gold medal for our men.
But your GOVERNMENT is soft. If you want to call it progressive/woke, that’s fine. Our Progressives here call their preferred way to do foreign policy “soft power”. I suspect your current Canadian government may follow the same line of thinking. Treat other countries with great deference, no matter how cruel and repressive, even send them money, talk nice to them, make them your friends and negotiate. Tyrants love “soft power”. It is sort of a slow surrender. Didn’t work out too well for old Neville Chsmberlain. Much better than having your international opponents love you is to have them fear you. So far Trumps winning that game.
The Canadian people deserve a much better government than they have right now. I hope they get it. And certainly hope the relations warm between our two countries soon. It may not happen until Trump is gone. You need to spend more on your national defense so they Russia knows they will pay a big price if they attack. And they may come thru you to get to us.
“Mark Carney is one of its many children. Starmer, Merkle, etc. also. ”
None of them are mentioned in the article.
All three have been involved with the World Economic Forum (you have likely seen news from their annual meetings in Davos). Carney and Merkle have had fairly significant involvement. Carney also had a key role on a UN committee that coordinated world wide action on climate change, involving thousands of global businesses, NGOs, and governments. This committee is definitely acting as a transnational (post national?). Carney is a dedicated globalist. To borrow and modify a popular acronym in the U.S., he is a CINO…Canadian in name only. Like many politicians, he tells people what they want to hear. Trump can’t keep his mouth shut, says stupid things about Canada, and, voila, he helps Carney become prime minister.
You demonstrate nothing to do with Marxism going on here.
Davos? Attended by noted ‘Marxists’:
Elon Musk (Tesla), Jensen Huang (Nvidia), Satya Nadella (Microsoft), Dario Amodei (Anthropic), Demis Hassabis (Google DeepMind).
and Trump, Bessent, and Lutnick.
Nate,
I don’t know what nationality you have, but you certain don’t understand what Starmer is. He is a Fabian, he is the most unpopular prime minister ever, who is selling out the UK.
His policies are all driven by socialism. It’s not pretty.
FYI
“Marxism is a 19th-century socioeconomic and political theory developed by Karl Marx and Friedrich Engels that analyzes history through the lens of class struggle, specifically the conflict between the bourgeois owners of production and the exploited working-class proletariat. It advocates for a revolution to abolish capitalism, private property, and class divisions, aiming for a stateless, communist society.”
Show us evidence that the abolishment of capitalism, private property, or a stateless communist society are the policies of Starmer or Carney.
Nate,
So on one hand you want 100% identical characteristics to be classified as Marxist. On the other hand you want zero evidence for your belief in climate change.
Starmer certainly wants a stateless country with open borders, poor education and zero citizens rights against the government. As a Fabian he is a Marxist.
Try and remember your history. The editor of the Italian socialist paper refined his views to become the Italian Ww2 leader. The Germans party at the time was the nationalist social worker party and again had deep routes in Marxist dogma.
And yet with climate change there is so much evidence that there are other contributing sources to the recent mild temperature rise that it makes the claim that Co2 is THE culprit laughable.
Seems I have to spell this out for the slow learners.
Most Western democracies, including the US, in the last century have adopted some social programs, like social security, medicare, etc, while maintaing predominantly Capitalist economies.
None of that is remotely like Marxism.
Nate,
You got things wrong yet again.
Socialism has big government, big regulation and hoes for total control. In the UK, EU and Australia there is near total control with regulations.
The fact that you might have a few choices on what to buy, where to eat or what type watch doesn’t mean that control isn’t there.
Never heard of the Fabian’s which is a surprise seem you promote them.
OMG
Gordon,
You do seem to be overly pedantic on minor common terms. I would say that someone who refers to a American means a citizen of the USA. Like wise some one referring to me as British means a citizen of Great Britain, as the country Britain doesn’t exist.
So as Canada is so great and wonderful, can you explain how the MAID program is working out to the poor, the vets, those with autism.
Perhaps concentrate more on the climate rather than social political issues.
clint…”“Energy”, in physics, commonly has units of “Joules”. “Heat” is a little more complicated as it is a “rate”, and commonly has units “Joules/second”, or “energy per time”. People that have not studied physics get confused, thinking that “energy per time” is the same as “energy”. That’s WRONG”.
***
Clint, you remind me of Edith Bunker, in that you are a pip who needs to stifle himself.
Heat is not a rate and is measured classically in calories. A calorie is defined as the amount of heat required to raise one CC (or gram) of water by 1C. According to Google AI, that rise in temperature is between 14.5C and 15.5C. One CC is equivalent to 1 gram since water is assigned a density of 1.
Circa 1840, Simon Joule, after whom the joule is named, calculated the equivalence between heat and work. He calculated, using the work done by a small rotating paddle in water and the equivalent heat generated in the water, that one joule of energy from the paddle produced 0.239 calories of heat energy.
According to the conservation of energy principle, if you generate work and it generates heat in water then one form of energy is being converted to another. Mechanical energy is being converted to thermal energy, or heat.
A few years alter, Clausius did exemplary work on the equivalence of heat and work, producing the 2nd law and entropy and contributing the internal energy part to the 1st law.
Heat is most definitely a form of energy, not a rate. Heat is measured in calories not calories per second or joules per second. The reason we measure it in joules today has its basis in the equivalence found by Joule as to the equivalence of joules and calories.
No matter how the politically-correct see it, the basic unit of heat is still the calorie.
———–
” “Flux” is simply the power (NOT energy) passing through an area.
To review:
Energy — Joules
Watts — Energy/time — Joules/second
Flux — Power/area — Energy/time/area — Watts/m²
Heat — Energy/time — Joules/second — Watts
To be continued….”
***
How can there be power without work, a measure of mechanical energy? The horsepower was the initial measure of work, James Watt calculated the rate at which a horse could raise a load so many feet.
The HP is a unit of power and it measures the amount of work done per unit time. Later, the watt was introduced as an equivalent electrical unit of power. There are 746 watts in 1 HP.
Work is force x distance and has no time units. If I lift a mass in pounds over a distance I have done work. To get the power, I need to keep lifting that weight over a time period. That is, power is the amount of work done in a unit of time.
However, work can be stated without the time factor as just work, a force acting over a distance.
If I lift 550 pounds by 1 foot I have done 550 foot-pounds of work. If I do that in one second, I have used 1 HP of power.
The joule is a measure of mechanical energy and is technically related only to that form of energy.
Flux is a simple rate of change and the word comes from Newton’s fluxion, which Newton used as the basis of calculus to represent an instantaneous rate of change. In modern calculus, that is now called the 1st derivative.
Ergo, flux, as we are using it, is a reference to the rate of change of something over an area. But, what is the meaning of something? Something is varying therefore it is not kosher to claim flux is a reference to nothing.
In electronics, we learned to associate flux with magnetic and/or electromagnetic energy. That makes sense. If an EM field is varying over an area we call that a flux field. However, a magnetic flux can be created around a conductor by running a current through it.
It is not pragmatic to use a single conductor, however, since a conductor formed into adjacent coils adds to the flux field density, making it stronger. The properties of such a coil that creates the flux we call inductance. By adding an iron core inside the coil we re-enforce the flux field, which can flow through the iron like a current through copper.
The resistance an inductor offers to a current is called inductive reactance.
That theory is the basis of electric motors and transformers (also filters and antennas), as well as inductors used elsewhere. At higher frequencies the iron core is removed and only air is required.
Flux must refer to some form of energy, otherwise it makes no sense.
My comments are for responsible adults, gordon. I don’t expect kids to understand, especially kids with serious mental issues.
Seek help.
Large tortoiseshell butterfly (Nymphalis polychloros) no longer extinct in Britain: https://www.theguardian.com/environment/2026/mar/09/large-tortoiseshell-butterfly-no-longer-extinct-uk
There has been a steady drip of news in recent years about species returning to Britain, or just turning up, as the climate warms. Some of these are definitely not welcome – there are tiger mosquitoes which transmit a fascinating range of tropical diseases, and increasing numbers of ticks which do the same. However, there are also more photogenic species, including butterflies and several birds. This is happening all across Europe. You can visualise climate-change simply by plotting certain species ranges.
Due to the warm summer insects of all types proliferated all over the UK,for the first time in years car windscreens were covered in dead flies and moths ,almost all wildlife enjoyed the warmth of the summer,which in turn made a mockery of the climate doom and gloom brigade ,as for coal, I doubt it had any any effect .smog from coal burning disappeared in the UK decades ago
There was a malaria epidemic in Canada circa 1820, during the latter part of the Little Ice Age. Not related to global warming.
The butterflies may be returning to the UK due to the elimination of coal burning fires, which produced considerable smog. Again, hardly related to AGW. It simply has not warmed enough in the UK for the type of climate change indicated.
According to Google AI…”The Large tortoiseshell butterfly (
Nymphalis polychloros) effectively went extinct as a resident species in the UK by the 1960s to early 1980s. The decline was likely driven by the loss of their primary larval foodplant, elm trees, due to Dutch elm disease, compounded by climate factors and high susceptibility to parasite attacks.
Due to the warm summer insects of all types proliferated all over the UK,for the first time in years car windscreens were covered in dead flies and moths ,almost all wildlife enjoyed the warmth of the summer,which in turn made a mockery of the climate doom and gloom brigade ,as for coal, I doubt it had any any effect .smog from coal burning disappeared in the UK decades ago
The Basics — Part 3
We constantly observe that the CO2 cult is ignorant of both thermodynamics and radiative physics. Unfortunately, many Skeptics are just as uninformed. Hopefully, this will clear up some of the basic issues. Here in Part 3, we will discuss thermodynamics. In Part 4, we will address radiative physics.
The First Law of Thermodynamics (1LoT) deals with the equivalence of thermal-energy to work-energy, or as rates, heat to power. At the time steam engines were first becoming important, scientists were studying how making steam could result in driving a piston or turning a wheel. The First Law also aligns with the conservation of energy. Typically 1LoT is represented by ΔU = Q – W, where ΔU is the change in internal energy of the system, Q is the thermal energy (entering the system), and W is the work energy (leaving the system). This form was common in the days of steam engines. There are other forms, but all allow for the conversion of energy, while also requiring the conservation of energy.
Note that 1LoT has NOTHING to do with temperature. Nor does 1LoT require all energy entering a system to raise the system temperature.
The Second Law of Thermodynamics (2Lot) deals with the definition of “heat”, and the concept of “entropy”. In thermodynamics, “heat” is the transfer of energy from a hot object to a cold object. 2LoT says that heat occurs spontaneously but the reverse does not happen by its own means. In simple terms, that means a hot object can raise the temperature of a colder object, but the colder object can not raise the temperature of the hotter object. (People get confused about this concerning insulation, which will be discussed in Part 4.)
The concept of “entropy” came about from the studies of early steam engines, and the effort to make the engines more efficient. But the studies quickly expanded into many other areas. It turns out that “entropy” has much greater implications than just with heat. Wikipedia has a fairly good analogy that compares 1LoT and 2LoT with entropy:
So 2LoT prevents the cup from moving itself back on top of the table, AND prevents the cup from repairing itself. In thermodynamic terms, the higher the “entropy”, the higher the disorder, randomness, and disorganization. A shattered cup has higher entropy than a good cup. According to 2LoT, a system can not decrease its entropy (increase its order) without the correct input from outside the system. A car will need maintenance after a time, but will never repair itself.
To be continued….
Still waiting for your derivation of the SC.
Otherwise nobody is the least bit interested in your attempts to appear knowledgable.
” One of his funniest capers was when he attempted to produce some “proof” that Moon spins by linking to a bunch of random sources about Moon! ”
*
List of references to treatises and papers about Moon’s spin around its polar axis
https://drive.google.com/file/d/13DRDH1OFOUHYM_6HKH19sbj28yckJMF7/view
*
A bunch of random sources that prominent denier Clint R has, of course, never even begun to examine, let alone would he be able to scientifically contradict any of them.
**
” And he still has no viable model of “orbiting without spin”. The poor guy is absolutely clueless. ”
Exactly, Clint R. Exactly.
*
Oh… I always forget to ask him how his model of “orbiting without spin” does look like!
Perhaps he’ll finally give us a glimpse into the secrets of his model?
**
The Humanity can by the way be glad that none of the four brazen lunar spin deniers infesting this blog were ever involved in planning a manned lunar mission.
OMG!
I like to point out these kids have no understanding of science, and can’t learn.
Bindi continues to prove me right….
Clint R
You know yourself well. You have a childish mind and you do not understand science. Yes that is you! Too bad you are blind to your own behavior.
Norman, stalking me with your usual insults and false accusations just proves me right.
Please continue.
Insults from Clint: beautiful. Insults toward Clint: ugly.
I think we got it straight now.
$100 a barrel. Due to muti-billion-dollar wars of choice.
And Mr. Trump thought that since the US is an oil producer, we will be fine.
Wrong. Oil is an global commodity, its price is set based on the global market.
Just more economic self-harming.
Another good reason to move as quickly as possible away from reliance on fossil fuels.
But Mr. Trump has done the opposite, putting up government roadblocks to wind and solar and electric vehicles.
We are falling well behind China in all of these industries.
Welcome to the UK Nate, only it’s not war that has damaged our industries and pushed up prices, rather the silly climate change act, wars come and go, we have had the climate change act since 2008, it killed our heavy industries and has driven up energy prices ever since its birth, not one taxpayer has benefited , and for what? a climate crisis that never existed in the first place, but you keep on plugging your stupid war on fossil fuels, which without would make your life miserable and hard, the propaganda that says renewables are cheep is just that,propaganda,subsidized wind and solar farms are built by private companies who then sell what they produce to the highest bidder, and guess who pays the final bill? we now have a footprint in the UK of thousands of sq miles of junk trying to do what a couple of hundred sq miles use to do, progress? based on ignorance .
So for you, UK becoming more reliant on fossil energy that must be imported whose costs are subject to geopolitical upheavals, as we’re seeing now, is somehow a good idea?
Ian brown
Fossil Fuels did help bring up the human race to a higher standard of living. Please consider that the available amount is not an unlimited resource. Even if you can’t accept the scientific findings of Climate Change (or some global warming from CO2 emissions) than at least look at the evidence of supply. If the human race does not gradually go away from oil sources it will hit hard when the time comes and the oil dries up.
https://www.worldometers.info/oil/
I do not think wind and solar will provide enough power to run modern civilization but they can help transition until the human race maybe does get viable fusion power.
anon…”Gordon,You do seem to be overly pedantic on minor common terms. I would say that someone who refers to a American means a citizen of the USA. Like wise some one referring to me as British means a citizen of Great Britain, as the country Britain doesn’t exist”.
***
I was born in the UK and recently I was back visiting. I was checking out of a Tesco and the lady asked if my accent was American. I told her it was. She asked where I was from and I told her it was Vancouver, Canada. She gave me a perplexed look and advised me that Canada is not in America. I told her it was most definitely in America, with the likes of the US and Mexico.
The light went on and she gave me a big smile. She told me that had never occurred to her and that she would remember it.
That lady. Anon, has a far greater grasp of geography than you and I can only hope the light will go on for you.
If I refer to you, or myself, as British (I have dual citizenship) that is apt since the name of the country is Great Britain. The name of the United States is ‘United States’ and that is declared in their constitution. The Founding Fathers called the country the United States ***OF*** America, clearly meaning that the United States, all 13 of them at the time, iswere in the continent of America.
Should the Founding Fathers have intended to call the country America, surely they would have done that. They were not stupid people, like the current mob running the US, and they clearly understood that the 13 states were in the continent of America and not America itself.
The continent is named after Amerigo Vespucci, even though it was Columbus who first discovered the continent as a European. It should have been called Columbia, or something more apt, then the US would be the United Sates of Columbia. Yanks would likely then call themselves Columbians, conveniently excluding all other denizens of the continent.
It’s not clear when Yanks started calling themselves American, and their country America. They were all from the same stock in the UK, some of them settling in the New York region and some further north where modern day Montreal and Toronto are located. It was all America, so where did the ego-trip begin where US citizens suddenly referred to themselves as America.
BTW, the French also played an important part but the British army and the French Army had it out on the Plains of Abraham, near modern day Quebec City. The battle was considered part of the 7 Years War between Britain and France. That battle is still being fought by modern day Quebecois who are a pain in the butt in Canada.
It is similar to the IRA in Ireland, who are still fighting the Battle of the Boyne, where William III, a Protestant, defeated forces of James II, a Catholic. Although the war was fought in 1690, many are carrying on the Catholic-Protestant nonsense to this day.
The human race has a very long way to go before we gain any form of awareness and enlightenment.
———–
“So as Canada is so great and wonderful, can you explain how the MAID program is working out to the poor, the vets, those with autism”.
***
A friend of mine, who had acute COPD, passed on via MAID. I have another friend who is considering it should things deteriorate for him. Neither is poor, a vet, or has autism.
Are you suggesting we are practicing voluntary euthansia in Canada? I have only heard of MAID recently (Medical-Assistance In Dying). It has very stringent requirements and not something to be considered lightly.
Remember, it is entirely voluntary.
***
“Perhaps concentrate more on the climate rather than social political issues”.
***
I would agree with you should people stop taking shots with off-topic subjects. I do appreciate Roy allowing us to vent on off-topic subjects, many of them that cross-over into the climate arena as examples of oppression and propaganda.
Gordon,
Like many other people, I know others from different countries, including Americans & Canadians. But as you said that some one from from Great Britain can refer to themselves as British, so the same rules can apply to Americans.
Btw people have been coerced into MAID
You need to look into that yourself as you don’t believe others.
clint paints himself into a corner…”The First Law of Thermodynamics (1LoT) deals with the equivalence of thermal-energy to work-energy, or as rates, heat to power”.
***
Clausius, who is responsible for the definition of internal energy in the 1st law, described internal energy as a summation of heat energy and the mechanical vibration of atoms in a solid. Of, course, an atom in a solid which is vibrating over a distance is doing work. But, work also requires a force since work is defined mathematically as…
W = force x distance.
The 1st law is not about rate or power since work is neither. It cannot be either until a time factor is involved and we need to know the total amount of work done per unit time. Ergo, the 1st law is about the equivalence of heat and work, as Clit tried to imply.
Clausius claimed that the required force comes in part from internal heat. In other words, as heat is added to a solid, part of the heat causes a change in internal work while another part exists as free heat.
In his free energy equation, Gibbs stated that as…
G = H – T.S
In words, free energy (G) = total energy, or enthalpy (H) minus entropy, the heat lost and unavailable for work (T.S).
T.S comes from the Clausius entropy definition for entropy, which he stated in words as the sum (integral) of infinitesimal quantities of heat (dq) at temperature, T.
That is…entropy = S =integral dq/T
If we integrate that to get the sum, we get Q = T.S as in the Gibbs free energy equation. Therefore, the Gibbs equation tells us that entropy is heat and that the total free heat in a system is the total heat, H, minus the heat lost, T.S, which is the entropy.
Gibbs can be expressed in terms of pressure and volume changes but in the end we are talking about a loss of heat, which is entropy. That’s how Clausius defined it.
BTW…the concept of entropy does not date back further than Clausius, circa 1850, since he coined the term and invented the concept of entropy. It was his discovery that superseded the work of Carnot, who had hypothesized there were no losses in a heat engine. Between Carnot and Clausius, the physicist Joule demonstrated the equivalence of heat and work.
Clausius had the insight that heat was lost within the heat engine and that lead him to the 2nd law and its mathematical expression via entropy.
However, in his work, he expanded the concept of entropy to the entire universe and that’s where the misunderstanding came from that entropy is a measure of disorder. Clausius presented two cases for entropy. The first involved a reversible process wherein the process returns to its starting point. He claimed the entropy for such a process is zero. With an irreversible process the entropy is always positive, which is a statement of the 2nd law.
It’s the other process, an irreversible process, that is of interest. An irreversible process can never revert to its initial state and Clausius pointed out that most processes in the universe are irreversible. He pointed out that the general process of the universe is irreversible and he made some sweeping statements to that effect.
He stated…”The energy of the universe is constant,”
and “The entropy of the universe tends to a maximum”.
There is neither a reference nor a hint to disorder in those statements. Clausius did not even utter the words disorder. The concept of disorder comes from the natural disintegration of material during an irreversible process. However, it is still the heat released during such processes that is the measure of entropy.
Without a measure of heat, there can be no measure of entropy. There are simply no units to describe disorder.
This all renders Clint’s claim null and void that heat is simply a transfer of energy as a generic energy transfer. Heat is clearly energy and both the 1st law, the 2nd law, and Gibbs free energy equation represents heat as energy.
I have asked Clint several times to name the form of energy being transferred and all he supplies are insults. The energy is clearly heat, therefore Clint’s definition of heat is a transfer of heat.
I like to point out these kids have no understanding of science, and can’t learn.
gordon continues to prove me right….
anon…”The Germans party at the time was the nationalist social worker party and again had deep routes in Marxist dogma”.
***
Then why did the Nazis toss true socialists and communists into concentration camps? Unionists too. The Nazis were another example of a totalitarian regime calling themselves socialist to give respectability to their horror show. What would Hitler, a corporal in the German army, know about socialism? His MO was strictly revenge for the loss for Germany in WW I.
Marxists dogma is a nonsensical term that implies it represents the work of Marx. Marx, despite his urgings for a revolution, believed in democracy. His idea of revolution was to get rid of the despotic capitalists brutalizing workers in his day. After that, he envisioned a democratic society.
BTW…Marx was adamant that his work would never be called, or associated with socialism, which he associated with wealthy Germans offering handouts to the poor.
The world has never seen a democratic version of the work of Marx. Can’t envision it myself since it would require greatly enlightened people who would likely become politically-correct and scunner me.
Scunner…Scottish…”Google AI Overview…
A Scottish “scunner” (or scunnered) refers to
a feeling of intense disgust, boredom, or loathing, often used to describe being “fed up” with someone or something”.
That is a far cry from what we saw with Lenin and Stalin in Russia. The Bolsheviks had zero intention of anything resembling a democracy. Mao was a bit different in China. His movement began as a fairly democratic process against a totalitarian regime run by Chiang Kai Shek. His movement gave freedom to women who had never experienced freedom and he introduced education for everyone.
I visualize it more as a bunch of decent people running from the a corrupt law system and hiding out in the hills in camps.
Mao’s greatest mistake, IMHO, was trusting in Stalin and the Russian abortion they called communism. It was no more Marxist than Attila the Hun. Mao patterned his regime on that of Russia believing it to be honourable. When emissaries returned and told Mao of the brutality in Russia he would not believe them.
Still, early communism in China was fairly democratic in that a central committee sat and discussed the best way to go. When you are dealing with billions of seriously ignorant peasants, how would one proceed? Circa 1915, when Sun Yat Sen tried to introduce democracy to China, no one wanted it because they did not trust it.
Gordon, you’ve lost it on this one. Marx was a miserable person. May have been Satan-worshipper (some evidence of it, but it’s inconclusive). He and Engels promised heaven on earth, but they delivered hell. The “Black Book of Communism” documents the massive human tragedy that they unleashed. Communism, Socialism (including Democratic Socialism, and Progressivism are all related and all sprang from Marxism. Within each category there are very wide variations, but they always share many common goals, strategies, and tactics. Communism and Democratic Socialism are different in many ways, but they share the same Marxist DNA and the same very flawed economic and social outlook. They all ignore human nature, whereas, as flawed as it can be at times, capitalism delivers the best outcomes for the most people.
Here was the Marxist plan from the Communist Manifesto:
II Proletarians and Communists
– “The bourgeois family will vanish as a matter of course when it’s complement vanishes and both will vanish with the vanishing of capital”
– “Communists desire to introduce and openly legalize a system of free love”
– “ The first step in the revolution by the working class is to raise the proletariat to the position of ruling class to win the battle of democracy”
– Once that is done, the Manifesto lays out 10 steps, including:
– Abolition of property
– A heavy progressive or graduated income tax
– Centralization of credit in a national bank with state capital and an exclusive monopoly
– Centralization of the means of communication
– Political power is merely the organized power of one class for oppressing another
– The concluding paragraph says “the communists openly declare that their ends can be attained only by the forcible overthrow of all existing social conditions. Working men of all countries unite!
– Preface to Russian edition in 1882 – Engels seems to praise the anarchists, who had just assassinated the Czar.
For marxists, democracy and elections are simply a tool for some (proletariat) to gain control and then to force their system on everyone. Look at their definition of “political power.”
The jury is in and the evidence is clear. The more free an economy, the better the economic results. Look at the U.S. and many of the Asian countries, as opposed to Europe. The more free a people (where speech and thought is not repressed, but encouraged and protected, the more creative and innovative the people). Compare US tech innovation and Europe.
“The more free a people (where speech and thought is not repressed, but encouraged and protected, the more creative and innovative”
Except for asian countries China, Vietnam.
Nate – these are exceptions that prove the rule. And, BTW, the USSR (Stalin) and China (Mao) and 10s of millions of their citizens learned in the cruelest way (see Black Book of Communism) that private ownership of property is by far the best way to motivate people. Stalin learned about the problems of state ownership in the early 20s, backed off, then doubled down in 1930s Ukraine with disastrous results (See great movie: Mr. Jones). The USSR proved that a centralized, planned economy that terrorizes its citizens wuth the fear of death can accomplish a lot over a decade or two (tremendous increase in production in 30s and WWII). But eventually it is so inefficient and leaves such little motivation to work, that it collapses. China is a communist country operating on some Fascist principles, not unlike Nazi Germany. That didn’t start to happen until about the 80s, when they allowed a quasi-capitalist class and that is the source of a lot of their recent success. Still, there is so much terrible central planning in China that it too is increasingly looking economically “unsustainable.”
Nate
Are you saying that China is innovative?
I suppose there is the robot display, the one who h wasn’t so much AI robots but more like remote controlled mannequins. Or the various ideas that they have “acquired” from the west.
One important factor that has makde the US so innovative is since WWII we invested heavily in science. Our universities are great and numerous, and both have helped us attract the best and brightest to come here and study and stay here in large numbers.
The current government is trying its best to kill that goose that laid the golden egg.
And China is catching up to us in science investment and innovation as a result.
Nate,
It was the Democrats in America that help destroy academia. Allowing dei to replace merit, allowing cancel culture to reign supreme.
Same happened in the UK, with Fabian led policies. But over here we also had a political policy to encourage 50% of young adults to go to university. If that doesn’t dumb down a degree I don’t what will.
Widespread cuts to science funding by Trump admin, in many cases, without Congressi0onal authorization.
Some particularly arbitrary and capricious cuts have been reinstated by courts.
https://www.nature.com/immersive/d41586-026-00088-9/index.html
Cancelled Grants not reinstated, many for health, medical, cancer research:
“Roughly 2,600 grants have not been reinstated or unfrozen (black), amounting to $1.4 billion of unspent funding.”
Note that this is comparable to 1 day expenditure on the Iran War.
Nate says:
”Widespread cuts to science funding by Trump admin, in many cases, without Congressi0onal authorization.”
You might disagree with what has done here, but its his job to spend money wisely.
From several stand points what Trump has proposed makes a lot of sense.
The graph in the ”Nature” report shows Trump proposing for the reduction of non-defense expenditures by about 35% which reduces it to a 1991 level adjusted for inflation.
Trump was elected essentially by the middle class. Adjusted for inflation middle class buying power has been reduced by 33% and middle class buying power for a home has been reduced by 40%.
As we know the cost of every government funded job puts a burden on every taxpayer.
The sad fact is for the middle class the increase in that non-defense spending burden in present day dollars that has gone up by 35%.
The sad fact is this increased level of government expenditures quite simply has not translated into benefits to the middle class but instead has translated into far greater power for those already in power as the share of US wealth for the top 1% has increased by about 33% reinforcing the observation that most tax dollars seem to end up in the hands of the wealthiest.
FYI
https://fiscaldata.treasury.gov/americas-finance-guide/federal-spending/
“Compared to the federal spending of $3.04 trillion for the same period last year (Oct 2024 – Feb 2025) our federal spending has increased by $63 billion.”
The world’s oceans continue to be at near-record temperatures.
https://climatereanalyzer.org/clim/sst_daily/?dm_id=world2
Matching March 2025, and nearly as high as the peak El Nino month of March of 2024.
“and nearly as high as the peak El Nino month of March of 2024.”
And that is not even mentioning the reports that a very strong El Niño might develop later this year:
https://www.severe-weather.eu/long-range-2/super-el-nino-2026-forecast-la-nina-collapse-global-weather-shift-united-states-canada-europe-fa/
Every clue adds to the complexity of trying understand why the atmosphere is in a cooling phase. There is a lag in the effect, but if El NIno does develop, we should expect to see a possible rise in temp., or at least some leveling off of the cooling trend (yes, trend). If it does not, then the mystery continues, and the effect could be something else such as Hunga Tonga maybe.
Nate ,fossil fuel energy works 24/7 regardless of the climate, the UK has no shortage of fossil fuels, only the will to get them out of the ground, the argument that we are going to run out any day soon is simply not true, there are millions of tons of coal under the UK and large reserves of untapped oil and gas, we are after all an island in the Atlantic ocean, there are at least 10 old coal mines within a five mile radius of my house, they only closed because they were independent mines and could not compete with the NCB on prices, most closed because once a seam developed a fault it was abandoned because of the cost, the coal is still there just a few feet lower, there are hundreds of such mines all across the UK,can’t wait for the UN to change tack and jump on the shortage of fossil fuels narrative,
The climate crisis has run its course.
I’m sure you believe in the free-market. If no one wants to dig it up, then its market value may not be high.
Google says
“As of March 2026, the Trump administration has opened over 13 million acres of federal land to new coal leasing, reversing previous restrictions to encourage domestic production. Despite this, the industry has shown limited interest, leading to canceled or rejected lease sales in states like Utah due to low bids and declining demand.”
There is no any planetary effective temperature. It is a mathematical abstraction invented on the basis of on planetary cross-section absorbed solar flux. The division of solar flux by four is a pure mathematical abstraction!
–
https://www.christos-vournas.com
thomas hagedorn…”Gordon, you’ve lost it on this one. Marx was a miserable person. May have been Satan-worshipper (some evidence of it, but it’s inconclusive). He and Engels promised heaven on earth, but they delivered hell. The “Black Book of Communism” documents the massive human tragedy that they unleashed. Communism, Socialism (including Democratic Socialism, and Progressivism are all related and all sprang from Marxism. Within each category there are very wide variations, but they always share many common goals, strategies, and tactics. Communism and Democratic Socialism are different in many ways, but they share the same Marxist DNA….”
***
Thomas…your rhetoric here reads right out of a religious cult. You are blaming Marx for situations which he could not possibly have influenced personally.
One of the weakest part of your argument is that socialism is a product of Marxism. Do you understand that socialism as a movement began decades before Marx put pen to paper? Socialism began as a workers movement and was the precursor to modern unionism.
Marx was born in 1818 and socialism got going seriously around 1830, when Marx was 12 years old. However, the roots of socialism date back to the French Revolution in 1789.
Blaming Marx for all this is ingenuous. People across Europe were protesting social conditions long before him. His Communist Manifesto appeared in 1847 and claiming that seriously influenced all protestors is ridiculous. There were certainly people prone to his rhetoric re revolution but the French revolted all on their own, long before Marx was born.
When you oppress people, they can get ornery. That is the roots of socialism, especially as it applies to workers. Nothing to do with Marx, he was just a messenger.
It is important to understand that socialism developed under democracy, using civil disobedience as a tool. There were no major revolutions as advocated by Marx till the Russian revolution of 1917 and even then it is questionable as to how much Marxist philosophy influenced them.
The Bolsheviks, lead by Lenin, promised ‘peace, land, and bread’. They lied, divorcing themselves from the underlying principles of Marx, who actually envisioned a post-revolutionary democratic system. Lenin, then Stalin, lead Russia down a road of depravity and brutality, hardly the MO of Marx.
You cannot blame Marx for the behavior of utter idiots who stole his philosophy and implemented it with brutality.
Furthermore, you cannot equate socialism, a workers movement under a democracy, to the Russian or Chinese systems they claimed to be communism. Those referring to Russian and Chinese style communism as socialism are utter ijits. And there are plenty of them around.
This is the same argument as US citizens referring to their country as America. The Nazis, a brutal cult of sheer ijits, referred to themselves as socialists, does that make them socialists? No. They brutalized true socialists and communists in concentration camps.
Also, you have to consider the rhetoric of right wingers who want to denounce communism and workers’ movement. I have heard right-wingers refer to democratic socialists as pinkos and commies. Today, such rhetoric would be regarded as hate speech. In fact, your rhetoric comes across as hate speech.
If someone believes in central government under a democracy, while not overly interfering in capitalism, why should they be viewed through hate-filled eyes? I live under a socialist government right now and there is minimal interference in capitalist ventures. In fact, such ventures are being encouraged.
If you want to see a real socialist government in action, come up here to British Columbia, Canada and see it in action for yourself. It is nothing at all like the Draconian system you describe, nor is it evil in any way.
I have my personal quarrels with the current government but that is related to ijits representing minority interests who have invaded the party and tried to enforce their idiocy on the rest of us. I am talking in particular about climate alarmists and the LGBTQ cultists.
The things is, Thomas, if no one likes them they can vote them out every 4 years. That’s the difference between democratic socialism and the bastardization of it claimed by the likes of Russia and China. Heck, even Russia abandoned communism in 1990 and guess what happened. the Russian mafia, lead by capitalists tried to take over. Also, Wall Street tried to invade and rip off the Russians.
If you want to understand this, Thomas, you need to shelve the emotion and consider it objectively. Consider the condition of the working class in the time of Marx and try to visualize what it would be like to see children of 10 forced to work in coal mines and sweatshop factories. Of course, if you think that is cool, then I get your point based on your depraved perspective.
Then ask yourself why the capitalists of the day were so heartless.
I believe in responsible capitalism. In other words, when your country is at war, capitalists should control themselves re raising prices based on the idiocy of supply and demand.
During WW II, Standard Oil was caught selling oil to the Nazis, a treasonable act. They justified such sales under the claim that ‘free enterprise must prevail above all’. FDR was having none of that and called the head of Standard, Rockefeller, onto the carpet and reading him the riot act.
As the US engages with Iran and oil supply is cut off. The oil companies and Wall Street are slobbering over the profits they can make. I imagine Trump and his buddies will be in on the profits.
The danger these days, Thomas, is not communism or socialism, but unfettered capitalism. Capitalists need to be more responsible and consider the effect their actions will have on the population of a country in general.
I want to be clear that I am in no way anti-capitalist. I understand the advantage of entrepreneurship. I differ only in that I think it should be democratic and responsible to the country as a whole.
On the bright side, Trump, an uber-capitalist, has just shot himself in the foot by starting a war with Iran. He promised lower gas prices and now they are shooting up.
Trump’s reason for starting this war is not apparent until you get it that he needs a diversion to avoid the close scrutiny of his relationship with Epstein. Things were getting too hot for him after Bill Clinton’s testimony when pressure began to mount to drag Trump in to testify.
In my native country of Scotland, one of the bards wrote…
“Oh what a tangled web we weave,
When first we practice to deceive”.
We are apt to believe those we do not know and have never met,because they have not yet deceived us, Samuel Johnson. history like politicians has a habit of lying to us, and I have been lied too by politicians all my life,
Ian….when you consider history for what it is, it is nothing more than a collection of thoughts stored in books and passed on generation to generation. In other words, history has no reality. The future is nothing more than thoughts projected by the human mind. It has no existence either. Yet, we have scare mongers predicting a future climate as if it has a reality.
It gets seriously ridiculous when a bona fide and great physicist/mathematician, Isaac Newton, gets demoted in the minds of some to second place behind Einstein, who engaged in little more than far-out thought experiments. The contributions of Newton to science dwarfs anything Einstein has contributed yet Einstein is viewed by many as a genius who surpassed the genius of Newton.
Poppycock!!!
I still have a healthy respect for Einstein, but he was strictly a product of his times who has been promoted to rock-star status based purely on belief systems of others. I fell into such a belief system based on simply seeing posters of him with e = mc^2 on them. Same with Feynman, another rock star with whom I failed to see his immense ego, which he allowed to interfere in his science.
Einstein made a crucial error by adapting the theories of Lorentz, who postulated that time could change its duration with the speed of a mass wrt the speed of light. In the days of Lorentz, the modern definition of time (UTC = Universal Coordinated Time) had not been invented, and time was a hit or miss proposal. The idea of time was more a philosophy/belief than an actuality.
Louis Essen, who invented the atomic clock claimed that Einstein did not understand measurement. That seems obvious to me when the basis of much of Einstein’s relativity theory is based on kinematics, a discipline in physics where forces are ignored as the impetus for velocity and acceleration.
The basic equation for distance = s = velocity x time.
s = vt.
This equation completely ignore the forces and masses involved. Therefore, when you transpose it as t = s/v, it makes no sense since time does not exist as an actual, real unit, like force or mass.
Einstein, based on Lorentz, took it further, claiming that the same t is influenced by the velocity of a mass, v, divided by the speed of light, c, presumed to me a constant.
Lorentz postulated that a factor v (gamma) = 1/(1 – v^2/c^2)
The gamma factor is the time dilation presented to a clock if a mass with velocity v is compared to the speed of light. In other words gamma is the degree to which a clock should run more slowly if a mass v is running wrt the speed of light.
That, of course, is absolute nonsense. Clocks neither speed up nor slow down due to the velocity at which they are moving. A clock is a rotary machine designed to be in sync with the rotation of the Earth. Why should it speed up or slow down due to its velocity?
Essen, the expert on atomic clocks, claimed that even atomic clocks have errors and he claimed such errors explain what people using them to confirm relativity theory are actually seeing.
Even today, time is an idea contained only in the human mind and its basis is the period of the Earth’s daily rotation, a relative constant. Yet, many modern scientists still insist on claiming that the light from distance stars is evidence of the past. In other words, they have a belief system, contained in the mind, and it is influencing their ability to see actual reality. That light can only be seen because it is here and now, as collected through the lens of a telescope.
I was never a fan of Marx or Marxist philosophy but I admired the guy for speaking out against the immense injustices of his time. The irony is that the cruel capitalists of his time, who openly treated people like trash, come out of it as heroes. It strikes me as excessive that he promoted revolution as a means of implementing his philosophy, then again, I was not there experiencing the dismal environment he and others had to endure.
There are a growing number of people who are using AI to prove their arguments. I strongly suggest that you learn what AI is and how Large Language Models work. LLMs are a subset of AI. LLMs don’t reason, don’t learn anything new after the initial training, and can provide any answer you want with the correct prompt.
In the UK a judge used a legal LLM to write his ruling on a case. He referenced case law with quotes. Goes without saying that the quotes were hallucinations.
So if you use LLMs to “prove” your argument for or against climate change then how robust is your argument? If it’s not robust then why are you pushing your argument?
anon…I have written something similar in past posts. We humans don’t even understand the meaning of intelligence, never mind defining a form of an artificial variety.
All AI is based on computer programs and relies on human programmers. The degree of intelligence then is seriously limited to the ability of programmers to be in touch with it.
I watch a series called ‘Mayday’, which covers various disastrous airline crashes. It boggles my mind how many of those crashes involve a conflict between the human pilots and the automated systems like autopilot or autothrust. Those systems are a form of AI.
I am actually horrified by this since I earned my living repairing sophisticated computer systems. The number of times I have seen such an automated system pack it in for no apparent reason is mind-boggling.
I am completely opposed to the idea of driver-less automobiles on our roads, a prospect I regard as sheer insanity. Yet, companies are advertising such cars as completely safe.
AI does not worry me, it’s the people in politics who have not a clue what it is, who are promoting it.
Gordon,
The number of times I have had human drivers causing near missing or accidents means I have more faith in self drive cars. One less death via self drive cars means that they are better. But self drive cars are a subset of AI and are distinct from a different subset of AI of Large Language Models.
It is the reliance on these LLMs that is risible. It is believing that LLMs are even intelligent in the first place which is incredibly misplaced. They aren’t. They are not programmed as such, they are trained on data. So training LLM only on Micheal Mann works of art then you will get a non scientific world ending story. Train the data that Dr Roy Spencer and co have collected and analysed then you will still get a parroting of scientific facts of the source. There is no reasoning or intelligence to the output of LLMs. The LLMs don’t know what truth is, it doesn’t know what science is, they don’t know what women are either.
What I think, is that a higher (N*cp)¹∕ ⁴ rises absorption by lessening the Immediate IR emitted power.
When (N*cp)]¹∕ ⁴ is inserted into standard effective temperature:
Te=[(1−a)S/4σ]]¹∕ ⁴
the effective temperature equation is transformed into a different physical concept equation, it is the average surface temperature theoretical equation now,
Tmean={[(1−a)S 1/4(β*N*cp)]¹∕ ⁴ ] /σ]}]¹∕ ⁴
where the
(1−a)S 1/4(β*N*cp)]¹∕ ⁴
is what absorbed as heat,
and where the (1−a)S is the not reflected portion of the incident solar flux.
–
https://www.cristos-vournas.com
The problem with your theory is that it implies that the brightness of a rotating object will change according to its rate of rotation. If I look at a red object here on the Earth’s surface, my eyes detect it as reflected short-wave radiation. If the same object starts spinning, it does not get any darker or lighter. It still looks the same red colour.
i.e. the same amount of reflected radiation reaches my eyes.
That means it must absorb the same amount of short-wave radiation independent of spin.
The same applies in outer space.
Rotation is irrelevant when considering equilibrium temperatures.
Thank you, studentb, for your response.
“The same applies in outer space.
Rotation is irrelevant when considering equilibrium temperatures.”
No, it is not the same in outer space.
–
https://www.cristos-vournas.com
When rotating faster, the solar irradiated body emits less Immediate IR, thus absorbs more heat. That is what makes the surface warmer, because when rotating faster there is more heat absorbed!
–
https://www.cristos-vournas.com
Hi Dr. Spencer,
I wasn’t recently in a FB group, supposedly devoted to Climate Discussion. It bears more of the hallmarks of a MMA fight. I posed the Question specifically about the heatwaves of 2024.
The question was roughly this: How did we get a massive heatwave over North America and Europe during La Niña in May and El Niño was late arriving in August? Could it be that the significant and repeated Solar flares occurring during that same time period have significantly contributed to the earth’s temperature rise during that specific period? I know that CMIP6 called for more Solar Forcing estimates to be admitted into the models and I know there are papers out there that say solar influences are vastly under estimated, with an over reliance on TSI. I’m an intelligence analyst by trade, which makes me skeptical on anything until I’m shown the process and it makes sense, but if l the solar forcing are not being properly accounted for, then all the recent warming is being pushed on AGW incorrectly.
Hope you have a great evening.
Lance Owens
CW3 (retired)
The Basics — Part 4
It’s not possible to scientifically understand Earth’s temperature without understanding radiative physics. And, it’s not possible to understand radiative physics without understanding photons.
Think of photons as “packets” of energy. To avoid all of the controversy about photons, just think of them as nebulous “packets” that can display both properties of particles and waves. Each photon has a frequency and a wavelength, depending on its energy. And since photons travel at the speed of light, their frequency and wavelength are related by the equation c = fλ, where “c” is the speed of light, “f” is the frequency, and “λ” is the wavelength. All photons are not the same. This is an important fact often overlooked in “climate science”, and requires emphasis: ALL PHOTONS ARE NOT THE SAME.
Surfaces typically emit photons of different wavelengths forming a “spectrum”. At one end of the spectrum the photons will have shorter wavelengths (higher energy, higher frequencies). At the other end of the spectrum the photons will have longer wavelengths (lower energy, lower frequencies). The photons emitted by the surface are called a “radiative flux”, typically having units of “W/m²” (There are other terms used, so go by the units, “W/m²”.) The value of the emitted flux can be calculated from the Stefan-Boltzmann equation, which relates the emitted flux to the temperature of the surface. For typical Earth temperatures, the emitted spectrum is in the “infrared” range. The flux received from Sun are in the visible, infrared, and ultraviolet ranges. Another fact often ignored in “climate science” is that all flux is not the same, and requires emphasis: ALL FLUX IS NOT THE SAME.
Upon impacting a surface, photons are either absorbed, reflected, or pass through the surface. What happens to a photon is based on its wavelength. If the photon’s wavelength is too long, it is reflected. It the photon’s wavelength is too short, it will be transmitted through the surface. If the photon’s wavelength is compatible with the surface, it will be absorbed. Another fact often ignored in “climate science” is that all photons are not always absorbed, and requires emphasis: ALL PHOTONS ARE NOT ALWAYS ABSORBED.
For absorp.tion to occur, a surface must have molecules capable of absorbing the photons. If there is no compatibility, the photons will be reflected or transmitted. Even if the photon is absorbed, there is no guarantee of a temperature increase. So two actions are required to raise the surface temperature: photon absorp.tion AND an increase in average kinetic energy of the molecules. This is one of the reasons the CO2 nonsense is bogus. It is very difficult for CO2’s 15μ photons to be absorbed by a 288K surface, and even if absorbed, they could not raise the average kinetic energy.
If the surface’s emitted flux is known, and the arriving flux is known, it’s easy to determine if the surface’s temperature will be increased. For example, if the surface is emitting 400 W/m², and the arriving flux is 300 W/m², then the surface’s temperature will not increase. The incoming flux MUST be greater than the emitted flux to cause a temperature increase. This is why you cannot boil water with the flux from ice, and why CO2 cannot raise Earth’s surface temperature.
The concept of “insulation” is also misunderstood in “climate science”. In conduction, insulation is an important factor. But, there is no equivalence in radiative physics. A radiative flux is NOT insulation. If a flux of 1000 W/m² is being emitted from a surface, an incoming flux of 500 W/m² will not have an effect on the emitted flux. Photons do not interfere with each other. Two photons can pass through each other. That’s also why radiative fluxes do not simply add/subtract. For there to be interference, the wavelengths, polarizations, and phases would have to all be exactly synchronized. That does not happen in nature. (This is also why the “RHTE” is nonsense.)
The insulation in the atmosphere is provided by the non-radiative gases, nitrogen and oxygen. These two gases, which make up 99% of the atmosphere, provide insulation. The “lapse rate” is the result of thermal energy moving from “hot” surface to “cold” TOA. Just like the temperature gradient in home insulation, from hot interior to cold exterior, in winter.
Warmists will often use a thermos bottle as an example of how photons can “slow the cooling”, and a thermos bottle can do that. But, it’s ONLY because the reflective liner is returning a nearly full spectrum. CO2’s 15μ photons only return a minuscule fraction of the Earth’s spectrum, with no ability to maintain surface temperature. We got a good example of how a “full spectrum” works with the recent Hunga-Tonga eruption. A water vapor “shell” around Earth significantly raised surface temperature for almost two years! CO2 can’t do that.
Finally, “black bodies” are imaginary. They do not exist. And they cannot be used to violate the laws of physics, as Warmists try to do. That makes a lot of “climate science” go away. For example, the “33K” is bogus, along with the “blue/green plates” nonsense. So that requires emphasis: BLACK BODIES ARE IMAGINARY.
To be continued….
Stop with this ignorant rubbish.
Derive the SC before you continue. Its easy. A first year student can do it.
Thanks for keeping your childish comments short, Fstudent.
Bindi, gordon, and barry spew long rambling word-salads to show their incompetence and immaturity.
You do it is only a few lines….
StudentB,
I asked you before about the solar constant, don’t know if you are willfully ignoring the question or whether you struggling.
So I try again:
What percent of the year does the sun energy enters into the earth system matches the solar constant? Or to the nearest day if its too much of a struggle.
“Obstinacy and ignorance are often linked in human behavior, with the former describing a stubborn refusal to change, and the latter referring to a lack of knowledge, which together can lead to unreasonable, harmful, or “willful” behavior.”
StudentB
So yes your stubborn behaviour not to answer a question with something you raised is obvious.
So you try, and fai, to trap Clint. But in doing so you are using the term Solar Constant. I was wondering if you actually knew what the term meant.
Why don’t you stick to words you know the meaning of and how they are applied.
“What percent of the year does the sun energy enters into the earth system matches the solar constant? Or to the nearest day if its too much of a struggle.”
Too easy.
Ignoring the elliptical nature of the Earth’s orbit, the SC impinges the top of the atmosphere every day of the year.
The amount entering the earth system depends on the average planetary albedo which is about 0.3 – meaning about 70% is absorbed.
Therefore, there is never a day when the amount entering the system equals 100%
The answer is therefore 0%.
Poster QAnon is known to me on this blog since quite a while among other things for his utter superficiality.
I’ve been familiar with the QAnon poster on this blog for some time now, partly because of his extreme superficiality.
When I read one of his recent posts about a British judge having used AI for the editing of his judgment, I wanted to take a closer look at what was actually true in his post .
His own words:
” In the UK a judge used a legal LLM to write his ruling on a case. He referenced case law with quotes. Goes without saying that the quotes were hallucinations. ”
*
This didn’t particularly surprise me, since QAnon, like some others, mostly polemically discredits and vilifies anything he doesn’t like, rather than responding with a well-reasoned rebuttal.
So I asked Google’s AI corner about this British judge, and here’s the answer:
*
” In September 2023, it was reported that Lord Justice Colin Birss, a Court of Appeal judge in England and Wales, admitted to using ChatGPT to summarize an area of law for a ruling.
He described the AI tool as “jolly useful” for creating a paragraph summarizing legal context he was already familiar with, which he then included in his judgment.
*
Key Details of the Incident
Context:
Lord Justice Birss, a specialist in intellectual property law, used the chatbot for a task he was already preparing to do himself, allowing him to verify the accuracy of the output.
Responsibility: He stressed that he took “full personal responsibility” for the content of his judgment, rather than delegating responsibility to the AI tool.
Cautionary Use: He [Birss] advised that AI should not be relied upon for finding new information or in areas of law where the user has no knowledge, citing the risk of AI “hallucinating” (making up) information.
*
Wider Context in UK Law
Judicial Guidance: Following this incident, the UK Judicial Office issued guidance in December 2023 (updated in April and October 2025) confirming that judges can use AI for tasks like summarizing documents, but they must treat the output as a draft and verify it.
First Verified Case: This was widely reported as the first known use of ChatGPT by a British judge to write part of a judgment.
Other Examples: In October 2025, it was reported that Judge Christopher McNall of the First-tier Tribunal used AI to summarize documents for a ruling on a discrete case-management matter.
*
While AI is being increasingly used to enhance efficiency, the senior judiciary in the UK has emphasized that AI must be used safely and that a human judge must remain accountable. ”
*
As anyone can see, QAnon’s post about a judge using AI has not the slightest similarity to Google’s AI response, which is very likely to be much closer to reality than QAnon’s superficial and, above all, woefully discrediting drivel.
Bindy Brownshirt,
Well done you managed to find other cases. Do o you on purpose find the cases that I wasn’t referring to?
QAnon
Some years ago, the fanatic ultra right wing braggart Anderson name called me ‘Nazi’ and ‘Fascist’ on this blog just because I didn’t support his ideas.
I wrote on the blog I then would counter this filthy insult by name calling him ‘asshole’ in return.
You perfectly know that by name calling me ‘Brownshirt’, you personally link me to Hitler’s SA troops who plundered and murdered everywhere in Germany from 1925 till 1945.
And therefore you deserve this same name from now on.
Bindy Mitty,
you stated you weren’t going to read my posts. So your word is worth nothing, your actions to try and silence any critic of your belief system is very comparable to the Brown Shirts.
Your wild claims in the realm of programming is risible, and your critical thinking is on par with the Brown Shirts of last century.
You are the antidote to progress and science.
QAnon
You are truly one of the most repugnant users of this blog: one of those who freely denigrate and insult others because they cowardly keep behind the blog operator’s indifference regarding the limits of freedom of speech, something you persistently misuse.
Never and never would you dare to write such filthy words on other skeptic blogs, for example, Jo Nova’s or Jennifer Mahorasy’s.
*
” you stated you weren’t going to read my posts. So your word is worth nothing, … ”
Wrong!
I told you indeed I would stop to read your arrogant and ignorant antiscience blah blah when using Firefox, but also that I would keep from time to time an eye on that blah blah when using TOR.
From now on, I will read EVERYTHING you write.
*
To identifiy me with the Brown Shirts, a pack of thousands of murderers (prefigurating the far more bloodthirsty SS), responsible for the death of 100 thousands of Jews, communists, socialists, protestants an others, clearly shows us on this blog how full of worst thoughts your brain actually is.
Compared to you, a poster like Robertson seems like an honest and respectful person.
Bindy Mitty
You say that I call you names but you always refer to me as QAnon, a group that I do not associate with. So you are very much like a Brownshirt by your actions.
Your Walter Mitty claim that you had a program that would block my post. Obviously it doesn’t work.
While you are reading my posts consider the solar constant that StudentB mentions.
As a thought experiment how many days, weeks months does the earth receive the equivalent energy of the dollar constant?
If it’s too difficult for you to answer then just reply with your typical insults.
Apparently, all the posters here prefer to keep insulting instead of simply telling us what information they have regarding the solar constant.
*
The Solar Constant is no ‘constant’ and has never been.
It is a yearly average of TSI, the Total Solar Irradiation.
This averaging is due to
– the elliptic shape of Earth’s orbit around the Sun, which induces a cyclic change in Earth-Sun’s distance, letting Sun’s effect vary by ~ 3%, what gives ~ 6.5% TSI when taking the Inverse Square law into account;
– variations in Sun’s effect due to the solar cycles (~ 1%).
*
Therefore, the deliberately misleading question
” What percent of the year does the sun energy enters into the earth system matches the solar constant? ”
makes not much sense, as this occurs only twice a year during a few days in April and October respectively, when Earth is at its average distance from the Sun.
Bindy Mitty,
So it’s about 20 minutes worth each year. At least you have the one ball to answer, unlike StudentDuh.
And after numerous little nudges you even remember the inverse square law. It really is like casting pearl before schweine.
Yet you still can’t understand that the earth orbit never repeats the same path each year and so the earth never receives the same energy at the same time time each year.
So how many extra watts would cause any change in temperature. I think it was one of those propaganda sites of yours that mentioned 5 watts would cause a 1C rise. But people can’t ask questions on those sites, so very last century.
” Yet you still can’t understand that the earth orbit never repeats the same path each year and so the earth never receives the same energy at the same time time each year. ”
Oh Noes… what a ridiculous claim.
Anyone interested in astronomy knows that of course Earth’s orbit isn’t fixed: it is influenced by other planets behind it, by all Milankovich cycles,and even Earth’s orbit rotates around the Sun.
What YOU like all pseudo-skeptics don’t understand is that these factors act over millenia ranges; they don’t change anything in TSI within 50 to 100 year periods.
***
” Your Walter Mitty claim that you had a program that would block my post. Obviously it doesn’t work. ”
What’s that for a stoopid nonsense, QAnon? I don’t have any program blocking anyone; who is this Mitty? Never heard.
*
” Your wild claims in the realm of programming is risible, and your critical thinking is on par with the Brown Shirts of last century.
Such filthy, cowardly remarks you posted some years ago already, and that’s the reason why I started to name you ‘Q’Anon at that time.
*
You are the antidote to progress and science. ”
You are the one who never posted any evaluation of anything let alone any valuable science.
All you were able to do for years is to discredit, denigrate, insult and lie.
Bindy Mitty
So predictable that you would not be able understand the simple ideas. IlSo let’s dumb it down even further:
The orbit of the earth varies from year to year due to the gravitational pull of all the other planets. Bill Hunter spelled that out to you previously. You even admitted that you knew what the inverse square law is. So put the two together and you get a slight difference in the energy input.
Your argument of extreme is reminiscent of the brown shirts of last century.
Of course if it wasn’t bad faith argument on your side then I do feel sorry for the burden you must be to your family.
QAnon
Apparently you aren’t even able to correctly read my comments.
” Anyone interested in astronomy knows that of course Earth’s orbit isn’t fixed: it is influenced by other planets behind it, by all Milankovich cycles,and even Earth’s orbit rotates around the Sun. ”
*
” Bill Hunter spelled that out to you previously. ”
Oh and you think he is a valuable scientific reference to me?
1. The Hunter boy never was able to post us links to science backing his warming denial ‘thoughts’ using celestial influence, until I myself did? Ha ha. Some examples:
Nicola Scafetta
Empirical evidence for a celestial origin of the climate oscillations and its implications
https://www.sciencedirect.com/science/article/abs/pii/S1364682610001495
Antero Ollila
Jupiter and Saturn can explain the swings of the Earth’s temperature
https://www.climatexam.com/single-post/jupiter-and-saturn-can-explain-the-swings-of-the-earth-s-temperature
M.G. Ogurtsov
Possible Contribution of the Gravitational Influence of Jupiter and Saturn to the 60-Year Variation in Global Temperature
https://link.springer.com/article/10.1134/S0016793220030135
Need more? I have some in stock.
*
2. Moreover, the Hunter boy belongs, together with Robertson, Clint R and the fake moderator DREMT, to this ominous lunar spin denial gang who not only discredits century-old science but also repeatedly tried to even distort and misrepresent Isaac Newton’s writings about this lunar spin!
*
” Bill Hunter spelled that out to you previously. ”
Thanks for having made me laugh so nice.
Again Bindi, if you’re going to mention Moon, you need to provide a viable model of “orbiting without spin”. Otherwise, you’re just kidding yourself, which will lead to a full mental breakdown as we see with gordon.
Bindy Mitty,
You appeal to all the authorities that you want, it just reinforces the Brownshirt reputation that you achieved all by yourself. Don’t use facts, just use poor arguments.
Regardless, you still don’t understand that a differing orbit from year to year can affect the amount of energy that the earth receives. Its really not that difficult a concept.
So have you any estimate about how much extra energy a change in orbit would cause some of the warming? Or you just going to sit there trembling.
QAnon
” You appeal to all the authorities that you want, it just reinforces the Brownshirt reputation that you achieved all by yourself. Don’t use facts, just use poor arguments. ”
I didn’t call on any authority; I merely posted links that confirmed what the Hunter boy had read somewhere, but as always, was unable to post himself.
*
You can name me ‘Brownshirt’ as long as you want: each time you confirm by this way the evidence that far right wing people always keep name calling others as Fascists, exactly what they actually are themselves, and conversely name Fascist dictators like Pinochet ‘Leftists’.
And by the way, are you that blind that you even don’t manage to see that except the two cowardly insulting braggarts QAnon and Anderson, no one on this blog did ever insult me by linking me to the SA Nazis, a pack of murderers?
This is exactly the reason why I name you QAnon: all these people behave like you.
*
” So have you any estimate about how much extra energy a change in orbit would cause some of the warming? ”
Why the heck should I do YOUR job?
Do it yourself, QAnon! I can imagine that your ‘result’ will look quite similar to Clint R’s model of “orbiting without spin”.
OMG…
Bindy,
I link you to the Brownshirt of yesteryear because of you anti science, ant free speech anti democratic views. You techniques lack any critical thinking or reasoning.
Btw you started referring to me as QAnon months before I got tired of your anti science rants. Then I started referring to you by your character.
Of course you can as always change the outcome by being more scientific in your answers, and less abusive to others.
“anti science, ant free speech anti democratic views”
Pure projection, anon.
Bindy cites actual data and does solid analysis of it.
Thanks Bindidon for the scafetta link. I figured somebody has to have been working on this planetary orbit perturbation theory. Scafetta is a huge help along with identifying other resources.
Notably scafetta estimates that the plantary influence piece accounts for about 60% of the warming during the industrial age through 2015. He just missed getting the big event in the sky in 2023/24.
Simply more evidence of the political malfeasance of the UN in playing footsie with special interests. Bares the need to fight oligarchy.
> Simply more evidence of the political malfeasance of the UN
The only thing left for Gill is to lash out at the messenger. Team Science is OK with that, as we nurture Sky Dragon cranks’ vitriol and return it with kindness.
LMAO!
Willard I don’t think the intent of creating the UN was to be a messenger boy.
Their mission states: maintaining international peace and security, promoting human rights, fostering social and economic development, protecting the environment, and providing humanitarian aid during emergencies.
They seem to be failing on every single point in their mission and represents a huge waste of money and instead simply serve as subterfuge for money laundering and a platform for virtue signaling with no substance behind it.
Here is an example of just 3 of many studies that attribute significant contributions to global warming which to the benefit of special interests the UN just ignored without comment. I would LMAO at that if it weren’t so damaging.
See my excellent answer (0%) to your question above.
I can’t wait for the next question.
StudentDuh,
So you don’t understand that the earth system includes the atmosphere. And yet you claim that the earth system doesn’t have 100% of the solar constant energy entering.
And that’s after you say that you not going to include the earth’s actual orbit.
Impressive
You set a new low bar.
Exactly what type of student are you claiming to be.?
Bindidon says:
Anyone interested in astronomy knows that of course Earth’s orbit isn’t fixed: it is influenced by other planets behind it, by all Milankovich cycles,and even Earth’s orbit rotates around the Sun.
What YOU like all pseudo-skeptics don’t understand is that these factors act over millenia ranges; they don’t change anything in TSI within 50 to 100 year periods.
—————————
To be a skeptic all you need is doubt. You can’t be a skeptical without doubt. Skeptics particularly doubt stuff claimed but not supported.
So the real question here is whether or not you Bindidon are a pseudo-scientist.
Real scientists actually measure and document their measurements.
Show us the measurements for the effects that you acknowledge to exist but claim that ”they don’t change anything in TSI within 50 to 100 year periods”. Only a pseudo-scientist would make such a claim and not have the evidence handy.
And after all if you choose to insult somebody rather than make your case, its usually the case that you don’t have one. One cannot claim impatience in teaching while spending years on end doing nothing but bursting your spleen. . .unless of course you are also insane.
Bill,
Bindy Mitty was an engineer. Or that’s what he claimed elsewhere. Got my doubts.
Engineers are usually very bright!
Constantly repeating what you heard is quite good evidence that at least one is up to the level of brightness as parrots and parakeets.
clint continues to clog the blog with his incoherent natterings based on something other than science. He claims to be a skeptic but he’d make a great alarmist based on the amount of pseudo-science he projects.
He begins…”Think of photons as “packets” of energy”.
Why the generic energy tag when photon are clearly small packets of electromagnetic energy that are generated by electrons in atoms OR any electron flowing in a conductor or through free space? Clint and others like to use the generic energy tag since it gets them around explaining exactly what kind of energy is involved.
Alarmists use the generic energy phrase to get around treating electromagnetic energy and heat as distinctly different forms of energy. By doing so, they can conveniently get around the 2nd law by talking about a nefarious ‘sum’ of energy when in reality EM and heat cannot be added.
That enables alarmists to claim a transfer of heat from a colder atmosphere to a warmer surface, that produced the heat in the first place. That represents a recycling of heat to increase surface temperature an illegal process better known as perpetual motion.
Clint goes one step farther, he denies that heat is energy, only a transfer of energy, you guessed it, a generic energy. He refuses to name the energy being transferred, however, which is obviously heat.
But hey, let’s not get overly niggly.
Clint prints in capitals and bold type…”ALL PHOTONS ARE NOT THE SAME”. Later he does the same with “ALL FLUX IS NOT THE SAME”. Unfortunately he does not let us in on the meaning of such phrases.
All photons can be claimed to be the same since they all consist of electromagnetic energy, the most important differentiator. Any photon, or quantum of EM, is made up of a few cycles of an electric field orthogonal to a magnetic field. Clint does not talk about fields, just fluxes, as if they are of a different nature.
Clint goes on…”Surfaces typically emit photons of different wavelengths forming a “spectrum””. He fails to explain how such a spectrum is formed as a continuous wavefront consisting of very short bursts of EM energy from atoms. One might expect such an amalgam of bazzillions of short bursts to form a chaotic distribution of frequencies rather than what we see in a visual telescope or a radiotelescope, which is a continuous wavefront of light at any specific frequency.
Also, a surface made up of only one element, say aluminum, can only radiate at certain discrete frequencies. A broader IR spectrum can only be generated by materials that have impurities, for example sand, which is made up of many elements.
Although I have taken shots at the relativity theory of Einstein, he did state later in life that scientists tend to think they know that light is made up of photon and waves, but in reality none of them know the truth in that regard. I’ll second him on that, not that anyone cares what I think.
Although light does begin its journey as short bursts of quanta, some have come to call photons, no one has the slightest idea how they come together to form wavefronts.
Nevertheless, Clint continues…”The photons emitted by the surface are called a “radiative flux”, typically having units of “W/m²” (There are other terms used, so go by the units, “W/m²”.) The value of the emitted flux can be calculated from the Stefan-Boltzmann equation, which relates the emitted flux to the temperature of the surface”.
Clint continues to be confused about flux. The word flux is derived from the Latin word ‘fluxus’. From Google AI..”The English word “flux” is derived from the Latin word fluxus, which means “a flow,” “flowing,” or “loose”. It originates from the Latin verb fluere, meaning “to flow” or “to stream”.
Newton derived the word fluxion to mean exactly that and fluxion is the basis of his calculus, the first derivative of a function. In terms of a magnetic field that is changing, Faraday derived the term d(phi)/dt, to describe the instantaneous change in a magnetic field.
More specifically, Faraday equated the changing magnetic flux to the voltage induced in a conductor subjected to a changing field as …e = -d(phi)/dt
Meaning, the faster the field is changing, the more voltage is induced in the conductor. I might add that a highly variable flux field produces a highly variable voltage.
It’s plain to see that flux is a nebulous term, like time, invented by the human mind to serve a particular service. We already have terms such as lines of force to describe such fields and introducing the idea of photons tends to cloud the matter. That is especially true when one tends to describe photons as both particles and waves, a highly unlikely occurrence.
Stefan-Boltzmann hardly applies here since it was derived initially by Stefan in a temperature range from about 500C to 1500C. Boltzmann came along later and performed a stupid analysis using statistical methods but never proved the S-B equation applies over a larger range of frequencies.
Earlier, I quoted someone else who pointed out how ludicrous S-B becomes at room temperature. A block of ice is claimed to emit 315 w/m^2 at room temperature a ridiculously high radiant value.
Clint goes on to pontificate…
“Upon impacting a surface, photons are either absorbed, reflected, or pass through the surface. What happens to a photon is based on its wavelength. If the photon’s wavelength is too long, it is reflected. It the photon’s wavelength is too short, it will be transmitted through the surface. If the photon’s wavelength is compatible with the surface, it will be absorbed”.
According to Clint, at IR frequencies, all photons are reflected. If the frequencies are very high, the photons can magically travel through any surface.
The truth is far more palatable. If the frequency of any photons can resonate with the angular frequencies of electrons in atoms of the surface, they will be absorbed. That is the basis of Bohr’s 1913 theory that is the basis of real quantum theory.
The only photons that could conceivably pass through a surface of significant thickness are very high frequency, high intensity EM like gamma rays. Even x-rays can be blocked by lead. In most cases, photons can interact at no more than the surface level.
Bohr’s theory is based on hydrogen, where the sole electron in the hydrogen atom can absorb, and emit, a fair range of discrete frequencies of EM. However, the emission variety is dependent on temperature. There is a full range of hydrogen spectral lines from a hot star but hardly anything from hydrogen at room temperature in the molecular form of H2.
Each element in the periodic table has its own specific radiation and absorption line spectrum. None have a continuous spectrum.
Clint goes on…
“The “lapse rate” is the result of thermal energy moving from “hot” surface to “cold” TOA. Just like the temperature gradient in home insulation, from hot interior to cold exterior, in winter”
Without gravity, there could not be a lapse rate. It is gravity that binds the atmosphere to the Earth and orders air density with a negative pressure gradient.
If the atmosphere was replaced by a sphere that contained the Earth, with the current air, the air would spread out to create an equal pressure. Heated air at the surface would still rise but it would tend to produce more heat near the sphere, hence the opposite of our current lapse rate.
The lapse rate is obviously create by the negative pressure gradient produced by gravity. Heated air at the surface rises into a less dense atmosphere and colder air from aloft descends to replace it. Without that process. vertical convection could not operate. Air becomes cooler with altitude because it is less dense and the Ideal Gas Law tells us that temperature must get lower with altitude as well, considering a constant volume.
Clint carries on regardless…”Warmists will often use a thermos bottle as an example of how photons can “slow the cooling”, and a thermos bottle can do that. But, it’s ONLY because the reflective liner is returning a nearly full spectrum”.
Not really. It’s the vacuum built into the inner flask of a vacuum-style thermos that slows the rate of heat dissipation. There is also an air barrier between the inner flask and the outer shell. Other types use an insulator between the inner flask and the outer shell but they don’t work as well as a vacuum.
I have such a thermos which has a stainless steel inner flask surrounded by insulation between it and the outer shell. It works adequately for something like coffee but I have noticed my coffee is getting cool by coffee time where with a vacuum flask it is hotter.
The thing about coating the inner surface of the flask with a shiny material is essentially worthless since the amount of heat loss it represents is minimal compared to the vacuum.
Clint concludes…
“Finally, “black bodies” are imaginary”.
Finally, something I can agree with. Actually, I have nothing against Clint.
gordon proves once again that he doesn’t understand the basic science. A small list of his lack of understanding — Heat, Energy, Photons, Entropy, Flux, Time, Gravity, Current Flow, S/B Law, 2LoT, WDL, IR Thermometers, Vectors, Orbital Motions, Lunar Phases, and heat sinks.
It’s no wonder he can’t convince anyone he’s an engineer.
For years I’ve been advising gordon to get help from mental-health professionals. It appears he has failed to take my advice.
At least I tried….
anon…in case there was a misunderstanding I was agreeing with you re AI. However, I have worked with similar control systems most of my adult years, including the electronics, electrical, and computer aspects, both programming and hardware, especially hardware.
If there was some sort of guide mechanism built into the road or along the road, I would be less bothered. As it stands, they rely solely on technologies like radar and lidar and those technologies are currently unsafe for a driverless car.
A while back I worked on an airport baggage system. When a bag is sent down from the front desk where you check in, the tag on it is scanned by readers and the software determines where it has to go. It is fully automated from then on. The number of times per day that system fails is ridiculous. It could be something simple like a sensor being slightly out of alignment, or a controller messing up for no apparent reason, but it fails regularly.
There is nothing to prevent the sensors in a car from going out of alignment due to a slight bump. Or simply a failure in the logic, which is common. What then?
I was working with a guy once and he was installing the brains of the system while I did some grunt work. It was his job. He was becoming increasingly frustrated because the system would not start. Each time I passed him I said, pull the power cord and plug it back in. Finally he got pissed off at me and asked what good that would do. I urged him to try it. He did, and the system fired up, much to his chagrin.
What the power reset did was reset the logic. Some computers have a small reset button, referred to as ‘power-on reset’. I knew that, he didn’t.
Airline manufacturers were able to dupe politicians into believing their autopilot and other automated mechanism were safe, until large airliners started going down for no apparent reason. Much of it has been traced back to those automated systems going awry for no apparent reason and the pilots, being required to suddenly take over, have failed.
When your aircraft suddenly begins dropping out of control, you don’t have time to be calm and read a manual. Even the most experienced people can panic and miss simple solution, such as shutting down the damned autopilot.
As one British Airways pilot put it, the computer should be monitoring the pilot and not the other way around. I just watched an incident on Mayday in which a prop plane went out of control and crashed, killing everyone on board. The cause was traced back to icing on the wings.
If a pilot sees that he can increase the thrust to keep the plane from stalling. In this case, the air traffic controller asked them to reduce speed to 150 knots so they would not be too close to another larger plane about to land. The pilot had autopilot on and dialed in the new speed during a turn. However, the autopilot, detected something wrong due to drag from the icing and began pitching over uncontrollably. One wing was so iced up the autopilot could not handle it during a turn, so it lost control and flipped the plane into a spiral.
Many modern crashes are put down to pilots becoming far too reliant on automation and becoming baffled when it fails. They tend to panic and overcompensate, causing the aircraft to lose control and crash.
Consider the same in cars on a road under autopilot. What is it exactly the auto mechanism is relying on to remain on the road? That has never been adequately explained and politicians are suffering with the same bs from manufacturers re how safe their products are.
I was employed to fix computerized equipment because they failed suddenly or erratically without explanation. I am not falling for their bs. I know for a fact the automation is far from fool roof. How many people must die from faulty automation before steps are taken?
Gordon,
They are using self drive cars on California roads. Other than a couple of initial deaths the self drive cars do seem to be safe, based on real world evidence.
Problem with technology is that all to often people want a perfect solution. There isn’t.
You mentioned plane crashes, but the other side is that Manual flying has resulted in deaths when the pilot gets too close to the turbulence of a different plan. Computerised system, note I didn’t say AI, are a lot safer in this regard.
Although self drive vehicles are AI they are not the same as LLMs. It’s the LLMs that is the problem.
The U.S. just experienced its second warmest meteorological winter on record. Nine states saw their warmest winter on record, and the West is likely to face increased hydrological stress in the coming months.
https://www.ncei.noaa.gov/access/monitoring/monthly-report/national/202602
This same outfit, NOAA, claimed 2014 as the hottest year ever. When the small print was examined, what they were saying was that 2014 was statistically the hottest year ever based on a likelihood of 48%. NASA GISS claimed the same thing with a probability of 38%.
Look at 2014 above in the UAH record and it becomes plain that 2014 was nowhere near a record year. But you expect us to accept the word of a major shyster that 2026 was the second warmest winter on record?
How can you trust such shysters to tell the truth about global warming?
When the IPCC announced in 2013, that the period from 1998 till 2012 (15 years) showed no statistical warming, NOAA’s temperature series confirmed that so-called pause. Then NOAA went back and adjusted its sea surface temperature series to show a slight warming.
Both NOAA and GISS have been guilty of adjusting the temperature record respectively to show a gradual warming where there was no warming. GISS replaced 1934 with 1998 as the warmest year to date until Steve McIntyre of the climateaudit site called them on it and forced them to change it back.
Both are guilty of fudging temperatures using interpolation and homogenization. That means taking two stations up to 1200 km apart and interpolating those temps to show a fake temperature for a third station. When all the fudging is complete, they go over it and homogenize the temperatures to smooth them out. Most sea surface temps are calculated that way.
Major shysters.
Your approach is to undermine the credibility of the data source rather than engaging with the data itself, and in doing so, you commit several inaccuracies.
For someone who frequently objects to ad hominems:
“Even Clint should be able to understand the simplicity of these subjective descriptions but he hates being wrong and will come after me with a terse statement complete with ad homs and insults.”
this is a bit ironic.
1) “That means taking two stations up to 1200 km apart and interpolating those temps to show a fake temperature for a third station.”
Temperature anomalies are spatially coherent over large distances and that is why interpolation is applied to anomalies rather than absolute temperatures. Absolute temperatures vary strongly with local factors but anomalies reflect the shared large scale climate signal. That makes them suitable for spatial interpolation.
You can see this in practice using principal component analysis. When applied to multiple station time series, most of the variance is typically captured by PC1, which represents the common regional signal. PC2 captures smaller scale deviations where the station’s temperature patterns diverge.
Homogenization is also not about smoothing noise. It corrects for non climatic artifacts in station data. The method compares a station’s time series with nearby stations to identify sudden breakpoints that are not present regionally.
Because true climate signals are shared across neighboring stations, a divergence at a single station indicates a non climatic change (instrument shift for example). The affected segment is then adjusted to restore consistency with the regional signal.
Cry Wolf some more, Eldro.
After the 1.001th time, people really start to pay attention.
I am posting this excellent paper by Clausius that clearly explains the 2nd law and entropy. Clausius should know about these things since he invented the concept of entropy, named it, developed the 2nd law from scratch, and contributed the definition of internal energy to the 1st law.
https://web.lemoyne.edu/giunta/Clausius1865.pdf
Even Clint should be able to understand the simplicity of these subjective descriptions but he hates being wrong and will come after me with a terse statement complete with ad homs and insults.
Clausius explains one type of transformation, when heat is transferred from a hotter region to a cooler region. He states the instantaneous quantity as dq/T, where dq is the infinitesimal quantity of heat and T is the absolute temperature at which it is transferred.
Then he defines a quantity S where ds is the corresponding quantity of S to dq. He writes…
ds = dq/T
If ds is summed alone then
S = So + integral dq/T
He names S as entropy and it is plain to see that the only variable left upon which S is dependent is dq. Ergo, entropy is an expression of heat transfer only.
Later, Boltzmann, tried to prove the 2nd law and entropy statistically and failed. However, some modern dweebs, for whatever reason, accept the failed version of Boltzmann and reject the Clausius version, which he invented and named.
The confusion that entropy is a measure of disorder appears to have come from the concluding statement in this paper…
“In the meantime, I shall limit myself to mentioning one result: Imagine the same quantity that, relative to one body, I have called its entropy, consequently, with due regard to all circumstances, applied to the entire universe, and also that other, simpler concept, energy, applied at the same time: then the fundamental laws of the universe that correspond to the two laws of mechanical heat theory can be pronounced in the following form:
1. The energy of the universe is constant.
2. The entropy of the universe strives toward a maximum
He is in no way applying this to disorder, only to ‘mechanical heat theory’ as stated.
It is true that an irreversible process leads to disorder but there are no units in entropy to describe disorder. What are the units of disorder anyway, I have heard of none?
Entropy units are joules/degree K, where the joule, a measure of mechanical energy, is used because it has an equivalence to heat in calories.
1 joule is equivalent to 0.238 calories.
We cannot write that one equals the other since their units are not the same, only equivalent.
gordon, you need some professional help. Your ignorance of science is what proves you’re not an engineer. Yet you keep clogging this blog with your perverted delusions. And you’re obsessed with me.
Aren’t mental health issues covered under Canada’s socialized medicine?
“Later, Boltzmann, tried to prove the 2nd law and entropy statistically and failed. However, some modern dweebs, for whatever reason, accept the failed version of Boltzmann and reject the Clausius version, which he invented and named.”
By ‘dweebs’ you seem to mean the vast majority of physicists, chemists, and engineers who use Thermodynamics today.
No, they don’t reject Clausius version of entropy or the 2nd law. They still use it.
But they do also accept that it relates to the statistical properties of atoms, and make use of that.
Even Clausius agreed. He was the one that pioneered doing that!
https://www.math.umd.edu/~lvrmr/History/Revival.html
“Clausius now defined a new parameter: the mean free path (L) of a gas molecule, to be computed as the average distance a molecule may travel before interacting with another molecule. He argued that L may be large enough compared with molecular diameters so that the basic concepts of kinetic theory used in deriving the ideal gas law are unimpaired, yet small enough so that a molecule must change its direction many times every second, and may take a fairly long time to escape from a given macroscopic region of space. In this way the slowness of ordinary gas diffusion, compared with molecular speeds, could be explained.”
“Maxwell incorporated the mean free path into his own kinetic theory and showed that it could be related to gas properties such as viscosity (see next section). As a result it soon became a valuable concept, not only for interpreting experimental data, but also for determining the size of molecules and thus justifying its own existence.”
The Environmental Defense Fund has posted a tranche of documents from the “Climate Working Group,” which were released by court order following from the EDF/UCS lawsuit against the government.
https://www.edf.org/media/records-trump-administrations-illegal-climate-working-group-available-online
This issue should ONLY be about science. But, it is a political issue. Very few people understand any of the science, so ignorance wins.
Look at the hatred from the cult when presented with simple science. Just one example:
https://www.drroyspencer.com/2026/03/uah-v6-1-global-temperature-update-for-february-2026-0-39-deg-c/#comment-1737516
Mark B,
EDF do ors seem to be over the top with their announcements. Got anything noteworthy?
I find it quite amusing how so many supposedly intelligent people pick a quarrel with the climate, and get paid silly money for doing it,
Phoenix, Arizona has just set a new all time record for the earliest 100F (37.7C) day. This surpasses the previous record set on Mar. 26, 1988.
According to the US National Weather Service, the average first 100F day in Phoenix is May 2.
https://www.weather.gov/psr/FirstandLastTemperatures
How much of the year will Phoenix effectively be in ‘summer’ by the late 21st century?
Correction: this is based on the forecast for today so it hasn’t officially happened yet, but if verified, it would break the previous March 26, 1988 record.
Anon for a reason asks:
“Exactly what type of student are you claiming to be.?”
Another easy question.
I am an average student but, as is obvious, at least ten times smarter than some of the armchair commentators here.
As to your original question, let me say that it was badly worded and obviously pointless. You meant to ask:
How often does Earth experience the AVERAGE amount of solar radiation (at the top of the atmosphere) during its orbit around the sun.?
As Bindion pointed out above, the answer is twice, because the orbit is elliptical.
Now answer me this – So what?
StudentB ,
With Bindy help you get there.
The “so what?” Leads to the next question:
Does the twice a year occurrence lasting a few minutes happen at the same time each year? Is there a noticeable shift in any particular direction?
Answer to question number 3:
The time of occurrence changes over time.
The equinox point moves westward along the ecliptic at a rate of 1 degree every 71.6 years, causing stars to appear to move roughly 1 degree per century (or 50.3 seconds of arc per year).
p.s. Where the hell are you going with this?
StudentB,
So are you surprised when signs of spring has moved forward over the last 100 years, measured on days.
Do you attribute that to climate change or to earth’s orbit changing ?
Sorry.
It is my turn to ask a question.
If the earth’s orbit was responsible for “signs of spring shifting forward”, would you expect this to occur simultaneously in both hemispheres ?
Take your time.
Student B
Two comments on QAnon’s (and the Hunter boy’s) strange surge to explain a warming that would be due mainly to external influences (planets, Milankovich cycles etc).
1. For some technical reasons, I’m in best position to know that the backwardshift in wine grape harvest time in France (Champagne, Beaujolais, Provence, Languedoc) was not at all a continuous phenomenon observed during the last century.
On the contrary, the noticeably earlier shift of the grape harvest in these regions only occurred about 35–40 years ago.
At the same time, the temperature increase also contributed to a higher alcohol content, as several French winemakers explained to me a long time ago, something I also experienced myself when drinking the wines: the balance in red wines between alcohol and tannins was suddenly no longer as it used to be.
Incredibly, but true: This was even evident in southern Germany, where, for example, Pinot Noir, a popular grape variety in Baden-Württemberg, has been offered with up to 14% alcohol for the past twenty years!
That was unthinkable before: Before the 1980s and 1990s, winemakers and wineries sold their wines — apart from a few top wines — at best with around 12.5% alcohol.
*
I learned from the export manager of a small Champagne house, even before I read about it in the newspapers, that the major houses had long been investing in the construction of cellars for aging their Champagnes in English chalk formations because since a few dacades it is becoming too warm around Champagne’s capital Reims.
That, too, was of course unthinkable before.
**
2. As opposed to nonsensical pseudo-skeptic claims that Earth is, with regard to its current position within the three Milankovivh cycles, in a warming phase, exactly the contrary is the case: Earth is since at least 5,000 years on a very slowly cooling path.
*
Thus, a warming explained by precession or obliquity changes is sheer nonsense.
Bindidon says:
”That was unthinkable before: Before the 1980s and 1990s, winemakers and wineries sold their wines — apart from a few top wines — at best with around 12.5% alcohol.”
Do you think the Minoans got schnockered easier than now? The recent peak may have been similar to the peak warming of about 3,600 year planetary cycle currently dubbed the Minoan Warming Period. That repeats once every 3,600 years. The Minoans are considered to be one of the founders of the European wine trade.
“Archaeological evidence shows wine was a significant part of their diet, commerce, and religious ceremonies, with vineyards cultivated extensively on Crete during the 3rd and 2nd millennia BC.”
bindidon says:
2. As opposed to nonsensical pseudo-skeptic claims that Earth is, with regard to its current position within the three Milankovivh cycles, in a warming phase, exactly the contrary is the case: Earth is since at least 5,000 years on a very slowly cooling path.
————–
I have heard that said for quite sometime, but I hear a lot said over time that has proven wrong. Google AI says we don’t know. What we do know is the axial parameters don’t change how much sunlight we get. And until science can figure out a climate model that works (many sources including your host scientist) handing heat in the atmosphere, ocean, clouds, and ice we are apt to remain in the dark.
https://co2coalition.org/facts/temperatures-have-changed-for-800000-years-it-wasnt-us/
Clearly to even get close to how climate changes we need to understand how it has been changing in the past. We see in that chart that multi-centennial warming rates of more than .12/decade for 200 years or less. As long as folks are running around guess about how long its been cooling why not guess that one of those .12/decade natural warming trends got underway a 100 years ago? If those were volcanoes scientists would be telling us its due. But not so when that would be an inconvenient truth to special interests very much interested in shucking the powerless.
Crete (/kriːt/ KREET; Greek: Κρήτη, Modern: Kríti [ˈkriti], Ancient: Krḗtē [krɛ̌ːtεː]) is the largest and most populous of the Greek islands, the 90th largest island in the world, and the fifth largest island in the Mediterranean Sea, after Sicily, Sardinia, Cyprus, and Corsica. Crete is located approximately 100 km (62 mi) south of the Peloponnese, and about 300 km (190 mi) southwest of Anatolia. Crete has an area of 8,450 km2 (3,260 mi2) and a coastline of 1,046 km (650 mi). It bounds the southern border of the Aegean Sea, with the Sea of Crete (or North Cretan Sea) to the north and the Libyan Sea (or South Cretan Sea) to the south. Crete covers 260 km from west to east but is narrow from north to south, spanning three degrees of longitude but only half a degree of latitude.
StudentB,
In the UK, Europe, America spring cones early. In north Africa I doubt it would be noticeable, same in the lower latitudes of the southern hemisphere
I’m waiting for the usual UK news to bleat on how spring cones early. They forget to mention that autumn as lso comes earlier.
What’s your view?
My view? – Bingo!
You have shot down your own theory.
How?
Because precession “dictates which hemisphere experiences summer closer to the sun, altering seasonal contrasts”.
i.e. if spring comes early then autumn must come later!
Yet you claim they both come earlier.
Therefore precession is not involved.
Thank you.
StudentB,
Currently in the northern hemisphere we are heading into spring. On the southern hemisphere it is heading into autumn.
Not a difficult concept.
So no I haven’t shot down my own argument.
The fact that the earth system is receiving more energy in spring, referring to the northern hemisphere, explains the warming spring and it coming a few days earlier.
Co2 is not to be blamed for the planet warming , but the plants seem to enjoy the extra Co2.
Remember that the Earth is moving away from the Sun as Spring turns to Summer in the northern hemisphere.
Let me help you (again).
If spring in one hemisphere is advancing, that means Earth must be getting slightly closer to the sun at that point in time. That also means that 6 months later, Earth will be moving slightly away from the sun as it follows its elliptical orbit.
This means:
Spring in one hemisphere advances, Autumn in the other advances.
Autumn in the same hemisphere retreats. Spring in the other retreats.
i.e. you get a contrast between what happens in one season versus the other season.
You stated;
“I’m waiting for the usual UK news to bleat on how spring cones early. They forget to mention that autumn as lso comes earlier.”
They cannot both come earlier according to your theory. Therefore your theory is wrong.
StudentB
Rather then trying to imagine how the earth’s elliptical orbit is changing relative to the sun, you might want to check the actual distances.
“Co2 is not to be blamed for the planet warming”
And you know that how?
Anon,
The actual trends are spring coming earlier and fall coming later.
The evidence is that the climate zones are shifting north in the northern hemisphere and south in the southern hemisphere.
Google climate zone changes.
mark b…”The Environmental Defense Fund has posted a tranche of documents from the “Climate Working Group,””
***
The Climate Working Group, better known as the Climate Propaganda Group.
Here is their opening statement from the document posted.
“Trump Energy Secretary Chris Wright “secretly arranged” for five hand-picked climate contrarians to form the “Climate Working Group” last year. They were assigned to secretly draft a biased report challenging the overwhelming scientific consensus underpinning the Endangerment Finding – EPA’s foundational scientific finding that climate pollution endangers public health and the environment”.
The so-called contrarians are…
John Christy, Ph.D.
Judith Curry, Ph.D.
Steven Koonin, Ph.D.
Ross McKitrick, Ph.D.
Roy Spencer, Ph.D.
I am not sure about the work of Steve Koonin, but the other 4 are well known to me as people of impeccable integrity that goes with their equally impeccable understanding of current climate issues and the possible effects the issues have on the planet and its people. Dismissing them as simple contrarians is typical of the immense arrogance demonstrated by climate alarmists who dabble in pseudo-science and unvalidated climate models.
The ijits, based on their biased, ad hom based complaints, have associated consensus with science and that is typical of their pseudo-science. They seem to think that if a certain number of people agree with a claim, that the claim has been proved via that consensus. The ijits go so far as to claim the report delivered by the five scholars is biased.
Their claim that the study was conducted in secret is laughable. Who advertises that they are doing a study? Were they supposed to contact every alarmist and announce their study, so the alarmists could harass them at every step. Did Newton announce that he was studying gravity or inventing a new form of math?
John Christy and Roy Spencer are well-known to us here since Roy runs the blog and John runs the department at the University of Alabama, Huntsville. In over 10 years of posting here I have not seen a hint of anything that would compromise the integrity of either scientist. In fact, I have been impressed with the resume of both as well as their humanitarian efforts. John taught in Africa for humanitarian reasons and saw first hand the effect of a lack of fossil fuels in Africa.
Judith Curry is of equal integrity. As part of the Berkeley Earth Study, she resigned when the leader began over-simplifying the results and using them in support of climate alarm. When she became skeptical of climate alarm, Michael Mann, a class act [/sarc off], insulted her using filthy language typical of a misogynist and someone who practices chauvinism and sexism.
Ross McKitrick, a fellow Canadian, is an outlier in that he is an economist. However, Ross and partner Steve McIntyre of the site climateaudit dot com, took on the IPCC regarding the claims of Chapter 9 in an IPCC review, that the statistical math used by Mann et al in their hockey stick study, was wrong. Mann and his buddies in that chapter were citing only papers written by each other.
Furthermore, McKitrick has written extensively on the shortcomings of the IPCC, painting a picture so bleak that anyone with a real understanding of science will have trouble justifying the very existence of the IPCC. I don’t think calling the IPCC a load of liars is too harsh.
The hectoring by M&M of Susan Sullivan, then an overseer of clown acts like chapter 9, to do something about the bad act, was resisted at first but then she gave in and essentially ordered them to review their work. They ignored her completely.
Finally, the US government stepped in and ordered a review by the National Academy of Science, along with an expert in statistics, Edward Wegmann, to review the situation. Wegmann agreed with M&M that the math was faulty and added that Chapter 9 appeared to be nepotic.
NAS did not go as far as they could have gone but went far enough to discredit the claim in the hockey stick study that there was unprecedented warming in the 1990s decade that represented a major warming over the past 1000 years. NAS reduced the span to 1600 AD onward and excluded the 20th century altogether based on the use of only one type of tree ring proxy, from the pine tree bristlecone, that NAS found unacceptable.
Although NAS did not come right out and disqualify the entire study, they did enough to negate it. The IPCC went farther, basing the study in 1850, then redrawing the hockey stick graph with error bars to the point the graph became known as the spaghetti graph. Without the 20th century proxies, the study became essentially useless.
The irony was left to Mann et al. After being drubbed by Wegmann re their faulty statistics, their sole complaint was that Wegmann plagiarized a paper by Bradley, of MBH, the study authors. Duh!!! How can an investigation into a paper, where the quoted material is related to the investigation, be classed as plagiarism?
No siree. The clowns at the Environmental Defense Fund are spitting into the wind on this one. They are practicing character assassination simply because they lack the hard science to disprove the study by Christy, Curry, Koonin, McKitrick and Spencer.
Furthermore the EDC will have to study a heck of a lot of real science to even begin comprehending the paper by the learned authors above. The problem with most climate alarmists is that they simply don’t have a firm grasp of basic science.
eldrosian…”Your approach is to undermine the credibility of the data source rather than engaging with the data itself, and in doing so, you commit several inaccuracies.
For someone who frequently objects to ad hominems:
“Even Clint should be able to understand the simplicity of these subjective descriptions but he hates being wrong and will come after me with a terse statement complete with ad homs and insults.”
this is a bit ironic””.
***
No irony, just humour. Clint and I take shots at each other regularly and I get a kick out of it. I need to point out from my somewhat childish nature that Clint started it all by attacking me. I warned him at the time that I’d retaliate as I am doing now if he kept it up.
I am usually laughing or in a good mood when I write the drivel. Same with Binny. where much of the drivel began. I visualize Binny as typing away on his computer, in a Germa Bavarian town, fudging statistics, wearing lederhosen and an alpine hat, getting up every so often to yodel out the window, in a French accent, alarming the neighbours. Something like the bird in one of those Swiss cuckoo clocks.
Why, I stuck up for Clint the other day. Someone remarked that Clint ate poop sandwiches. I assured him that was not true since Clint does not like bread.
As I have pointed out in the past, my attacks are not really directed at him, I am more interested in a third party who may have read his drivel and would appreciate another POV.
——–
“Temperature anomalies are spatially coherent over large distances and that is why interpolation is applied to anomalies rather than absolute temperatures. Absolute temperatures vary strongly with local factors but anomalies reflect the shared large scale climate signal. That makes them suitable for spatial interpolation”.
***
I beg to differ. If you average thermometer placement on the solid surface over the entire planet, it amounts to 1 thermometer to cover every 100,000 km^2. Not only is that silly, it does not account for vast differences in altitude. Ocean coverage is no better and the devices used are equally silly.
This is a serious abuse of statistics. At least the UAH data covers 95% of the surface, including oceans, and has some meaning when averaged.
The highest density for thermometer coverage is in the United States.
For ocean measurements, The Argo buoy is designed to spend most of its time underwater. Every so often, it surfaces and an air temperature is taken. Where does one begin to analyze the serious issues with such a system, from waves breaking over the device, to sea spray, to sudden variations in altitude with waves varying in altitude from a few feet to a 100 feet.
Anthony Watts at WUWT has done excellent work studying heat island effects throughout the US. He has found horrifying situations where the exhaust from an AC system is blowing straight into the Stevenson screen housing the thermometer.
You can misuse statistics to prove any point unless you are from the MarK Twain school, where he wrote…’There are three kinds of lies: lies, damned lies, and statistics. Statistics most definitely has good applications but it can be seriously abused, and easily.
While studying engineering, in a probability and statistics class, I had the opportunity to talk with a young prof who was a whiz in the field. I had always had an issue with gallop polls and I asked him about them after a class. He said, “Oh, no you don’t, first tell me what ‘YOU’ think is wrong with them”. I told him I thought the sample size was way too small, leaving the result unreliable. He agreed immediately and that was that.
Apply such reasoning to the concept of interpolating an imaginary third station from two measured stations up to 1200 km apart. I live in the Vancouver, Canada region. That’s like having one station here in Vancouver and another in Regina on the Canadian Prairies. The weather between both cities could hardly be different. In between, there is an even greater diversity in weather from coastal rain forests to arid desert-like conditions. There are also immense variation in altitude.
In Regina I was told, ‘if you don’t like the weather, wait 15 minutes and it will change’. I found out the hard way during winter on a drive from Saskatoon to Regina, how true that is. I started out in a brilliant sunny day with clear skies and after 50 km, I was ensconced in blowing powder snow with zero visibility while the temps had dropped some 15C. The sheath on my gas pedal froze and I had to lift the hood to work on it. Nearly froze to death, I had to jump back in the car every 15 seconds to warm up.
Talk about urban heat islands, I had to set my idle up higher and essentially drove the last 50 km on high idle. I was only in Regina, among high rises, a few minutes, before the cable unfroze. I was able to get out and lift the hood no problem without fear of freezing to death.
——–
“You can see this in practice using principal component analysis. When applied to multiple station time series, most of the variance is typically captured by PC1, which represents the common regional signal. PC2 captures smaller scale deviations where the station’s temperature patterns diverge”.
***
You have to be seriously careful when you begin applying statistical theory like that. Context is everything. You cannot simply take numbers and crunch them using statistical algorithms.
Look at the UAH data in the graph above. The trend, using statistical analysis in about 0.14 C/decade. Obviously, however, the trend is far from a representation of the actual context. Something caused a flat trend from 1998 till 2012 (announced by the IPCC), and smaller flat trends between 2012 and present. Clearly, anthropogenic causes is not the driving force.
I don’t think we understand a darned thing about what is causing the trend other than a continuation of the rewarming since 1850, when the LIA ended. The rewarming is bound to be slow since a huge amount of ice was created during the 400+ years of the LIA and our orbital effects replenish some of the ice each winter in both hemispheres.
I don’t see ice in the Arctic and Antarctic ever changing significantly in winter as long as we maintain our current orbit and axial tilt. Better not say that too loud or some alarmist will come up with the idea of changing our orbit or tilt.
—–
“Homogenization is also not about smoothing noise. It corrects for non climatic artifacts in station data. The method compares a station’s time series with nearby stations to identify sudden breakpoints that are not present regionally”.
****
In other words, if you cannot prove the anthropogenic theory, move the goal posts. That reminds me of a comment by comedian Billy Connolly about the on-going failure of the Scottish national soccer team. He commented that someone needs to tell them the point of the game is to put the ball into the other team’s goal while protecting your own. He reasoned the current team is just out there for a good run about.
He reasoned even more sarcastically, that if Scotland ever hosted the soccer World Cup, they’d send everyone home after the preliminary round because they did not know you could go further than that round.
It seems gordon was up late last night proving me right, again.
He suffers from both delusions and an obsession with me. I live in his head rent free, as they say.
I never get tired of being right.
Gordon Robertson says:
“I don’t think we understand a darned thing about what is causing the trend other than a continuation of the rewarming since 1850, when the LIA ended.”
That’s exactly right. We don’t know what caused the LIA and we don’t know why it ended. What we do know is that the planet has been warming since the LIA ended and there’s no reason to expect that warming to suddenly stop now.
The Basics — Part 5
This is now the fifth in a series showing the cult does not understand the basics. They don’t know the basic science, and often they don’t even know their own cult’s nonsense. They just comment here based on their false beliefs.
The series started with a review of a simple problem.
The answer is 364K, with the sphere emitting 1000 W/m². Only two commenters were able to solve it correctly. Bindi, gordon, barry, Nate, Ball4, Willard, F-student, Ark, bob, and several other cult kids didn’t even try. If you STILL can’t understand this simple problem, you shouldn’t be commenting here, IMHO.
In Problem 2, two more sources are added, one supplying 1000 W/m² to the sphere’s “north pole” and the second supplying 1000 W/m² to the sphere’s “south pole”. There are now 6 sources each supplying 1000 W/m² to the sphere’s disk from different directions. What is the sphere’s steady-state temperature?
Not one person was able to correctly answer! Norman was able to solve Problem 1, but Problem 2 stumped him. That’s likely because he figured out the correct answer destroyed his CO2 beliefs. (Folkerts went down in flames trying to pervert the issue, which will be discussed later.)
The correct answer to Problem 2 is the same as Problem 1, 364K. The sphere is emitting 1000 W/m², so additional incoming fluxes equal to, or less than, 1000 W/m² can NOT raise the sphere’s temperature. This is nothing more than 2LoT applied to radiative physics. It’s also the reason flux from ice cannot boil water, and CO2 cannot raise Earth surface temperature.
To be continued….
A brazen and ignorant little boy lacking both technical skills and science, denying scientific evidence like GHE and the lunar spin, shouldn’t be commenting anywhere.
But… heil freedom of speech!
*
It’s also perfectly clear that Clint R. is deliberately misleading the blog: He simply found a few problems and their solutions somewhere on the internet and published them here as if he were a physics teacher.
But… anyone who, for years, insults astronomers and physicists as ‘astrologers’ and has had nothing to say about the extremely complex motion of celestial bodies that simultaneously rotate around their polar axis and orbit another, except the stupid:
” Got a viable model for orbiting without spin? ”
is certainly not a physics teacher, let alone a physicist.
*
Incidentally, we are all waiting here for HIS model in this matter, which he of course never published.
Bindi, your insults, false accusations, ignorance of science, and inability to learn are all exactly what we see from gordon.
Thanks for proving me right, again.
Where does the additional 2000 w/m^2 go?
bob, you have a history of rejecting reality, so this is just for adults:
There is NO “additional 2000 w/m^2”. bob is confusing flux with energy. That’s a common mistake in “climate science”. And the cultists are unable to learn.
There are TWO 1000 W/m² fluxes that are likely reflected. Even if some of the photons get absorbed, they would not be able to raise the temperature. Only photons with enough energy to raise the average kinetic energy could raise the temperature.
Clint,
I did not mention energy.
“Likely reflected” you claim, but that is not possible with emmisivity of 1.
Second, you said 1000 w/m^2, but failed to tell us enough information about that flux.
It could be 1 photon/m^2, one very high frequency photon, that could raise the temperature of the sphere.
So sad.
bob must have missed this in my first sentence: “…you have a history of rejecting reality, so this is just for adults”
Clint,
Flux is the amount of energy passing through an area per unit of time.
Of course flux is energy.
Also, of course, “I have the key to escape reality, it don’t cost very much and it lasts a good time”
Where did that Quantum Physiccracked. go? You know you can’t get your money back after you smoke the crack.
bob, this is the kind of crap you spew: Speed is distance per time, so of course “speed” is “distance”.
I don’t expect you to ever grow up and accept reality.
Prove me wrong.
Easily done Clint,
You are confusing vectors and scalars again!
Radiant flux density, in watts per meter squared, is a vector, while speed and distance are scalar.
Go on, keep exposing your lack of knowledge.
And, of course, vectors can be added.
Sorry bob, but flux is not energy just as speed is not distance. You STILL don’t get it.
Which proves me right again — you can’t learn.
Now, being the cult child you are, what will you try next?
Clint,
No matter how many times you say it you are still wrong.
Flux is energy per area per time.
Energy is the only thing in the numerator, so flux is energy.
And you can add fluxes if and only if the area and time match, and the units are the same.
And you are already adding fluxes in problem 1, you just fail to realize that.
Sorry Clint,
Radiant flux density is defined as energy.
You lose.
You’re STILL wrong, bob.
“Energy per time per area” is NOT the same as “energy”. You’re overlooking the qualifiers of time and area. Energy is a conserved quantity, but “energy per time” is NOT conserved.
The fact that you keep failing to pervert reality should tell you something. And the fact that you can’t see the same childish tactics in others, like Ball4, Nate, Bindi, and gordon, should also tell you something. But things just aren’t happening for you.
So, keep proving me right. I can take it.
So what Clint,
You are still adding flutes when you claim you can’t.
The sphere was a blackbody, until Clint declared that they dont exist. Now it seems to be un-named, but with the same properties as a blackbody.
A perfect emitter. Which as we know, is a perfect absorber by Kirchhoffs Law.
But again, he has it magically transforming into a bizarre material.
It is now a perfect absorber for 4 sources of radiation whilst being a perfect mirror for 2 identical sources.
How does it know which sources to reflect perfectly and which to absorb perfectly
He seems confortable with his contradictions.
Child Nate, you’re imitating barry. He also believes “black bodies” are real.
As expected, his anomalous thinking has nothing to back it up, and much to ridicule.
This is a classic example of:
“Never wrestle with a pig. You both get dirty and the pig likes it.”
Guess who the pig is here.
Students,
Is it a theoretical pig or an imaginary pig?
Clint opines: “The correct answer to Problem 2 is the same as Problem 1, 364K. … This is nothing more than 2LoT applied to radiative physics. “
The 2LoT tells us that radiation from a source cannot raise the temperature of a receiving object hotter than the source. Ie heat flows from hotter to cooler.
Consider sunlight. The sun at 5770 L emits about 63,000,000 W/m^2; the earth receives about 1370 W/m^2. The 2LoT limit for sunlight is 5770 K (based on 63,000,000 W/m^2), not 394 K (based on 1370 W/m^2).
Similarly, the 2LoT limit for Clint’s problem is ALSO related to the TEMPERATURE of the EMITTING surfaces.
* If the SOURCE of his radiation is 364 K emitting 1000 W/m^2, then the limit is 364K. (the 4 sources would completely surround the sphere).
* If the SOURCE of his radiation is 5770 K emitting 63,000,000 W/m^2, then the limit is 5770 K. (the 4 sources would be 4 small sources, and many more than 4 can be used to each provide 1000 W/m^2 from many more than 4 directions).
If Clint had specified his sources were at 364 K, then he would be right. But no such limit was stated (nor is it even remotely implied), so we are free to have 5 or 6 of 100 much hotter sources sources all providing 1000 W to the sphere.
Clint suffers from erotomania, or de Clérambault’s syndrome, a type of delusional disorder. He thinks anyone who mentions him in a post is obsessed with him, a sure sign of the disease. He is so delusional he believes his pseudo-science is actual science.
In Part 5 of his delusional rant he relies solely on thought experiments which cannot possibly be proved. Of course, that puts him in a similar category to Einstein, whose major work on relativity is based on thought experiments. Clint will regard that as a huge compliment, believing I have compared him to Einstein.
Clint’s delusional disorder is classical in that he maintains he is right and everyone else wrong but cannot prove it using hard science. Amusing character. Instead, he resorts to ad homs and insults, the hallmark of the delusional.
gordon proves me right again.
Just after I pointed out he was delusional and obsessed with me, he stalks me with a comment containing false accusations.
He’s making this too easy for me….
skeptical…”We don’t know what caused the LIA and we don’t know why it ended. What we do know is that the planet has been warming since the LIA ended and there’s no reason to expect that warming to suddenly stop now”.
***
That’s just the tip of the iceberg. The mentality that has dismissed the LIA and substituted a ridiculous theory based on a trace gas is also hard at work trying to control the thought processes of the entire planet.
All hard science is at risk as the politically-correct invade the domain and try to impose their bs, which is based on nothing more than consensus. These dufi (plural of dufus) are not satisfied with offering an alternative theory, they are hard at work trying to silence anyone who disagrees with them.
I have ranted in the past about my experience in electrical engineering, where we are taught a 200 year old lie that electrical current flows positive to negative. The lie was started by Benjamin Franklin who postulated that electric current was a flow of charges from a high positive charged area to a negatively charged area.
That theory was disproved in 1898 when Thompson discovered the electron. It became quickly apparent that electrons are the current carriers but the sheer stubbornness in physics maintained the old theory which they labeled ‘conventional current’. EE textbooks freely admit that real current is due to electron transfer atom to atom in a conductor but insist on using the old theory.
Heat was once regarded as a fluid called caloric which was believed to flow through a substance. That was around the same time as Franklin’s claim yet the science eventually agreed that heat is an unknown form of energy that relies on electrons in atoms to be transferred. Today, ijits are trying hard to redefine heat as a mere transfer of a generic energy, one of the more idiotic claims in science.
During the 400 years since the time of Newton in the early 1600s, we have made great strides in science yet we are just about as ignorant as scientists in the time of Newton regarding how the universe works at the atomic level. I blame part of that on the utter stupidity available in the human mind that resists change and tries to enforce paradigms that clearly don’t work.
Quantum theory began as a promising illumination into the workings of atomic structure but has since devolved into sheer nonsense that relies so heavily on obfuscation and unproved mathematical concepts, that it literally makes no sense.
Physicist David Bohm made a bold statement that we have reached the end of the roads of Newtonian theory and quantum theory and that we must step back and find another way forward. He claimed that in the 1950s and here we are, some 75 years later, still groping in the dark.
In the 1920s, not long after Bohr produced his basic quantum theory, based on the single electron in hydrogen orbiting the single proton nucleus, several scientists started speculating wildly trying to expand Bohr’s theory to suit all atoms. To enable their theories they offered imaginative theories such as an electron being both a particle and a wave (de Broglie).
Schrodinger liked the idea of de Broglie and fluked on a set of wave equations that treated the electron as a wave. His wave theory became the basis of quantum theory, and Linus Pauling used the theory to research molecules. However, the equations did not work as stated and Pauling had to combine his extensive knowledge of molecules while modifying the equation to make them work.
Personally, I think it is ludicrous to treat electrons as waves since they have a mass and carry a negative charge. However, an electron orbiting a nucleus exhibits simple harmonic motion, similar to a pendulum, and that orbital motion can be regarded as having a frequency hence offering the appearance of a wave. That is a far cry from claiming the electron as having a duality where it can behave like a particle or a wave, like electromagnetic energy.
Electrons do not behave like waves, their motion can be used as a representation of simple harmonic motion. The same applies to a line drawn on the shaft end of an armature an electric motor. The motion of one end of the line can be likened to a sine wave when projected onto the x-axis but the motor cannot be claimed to be a wave, or anything like a wave.
Bohr himself became the culprit who lead quantum theory into its current state of sci-fi. Essentially, Bohr abandoned the hard science in which phenomena had to have a real, objective basis. He developed a theory in which electrons could apparently communicate with each other at a distance, a pure philosophy that has never been proved in nearly a century.
Science as a whole has suffered from the human mind gone awry. Politics and religion have come into it. Darwin lead us down the path of evolution without a shred of proof re how basic elements, representing no life, could suddenly form together to produce the intelligent life we have today. However, his inane theory pleased many scientists who were tired of the Church dictating scientific thought.
Eggheads like Hawkins, along with the unknown George Garrow, lead us on a merry theory re the Big Bang and black holes, without any physical evidence to back such claims. We now talk openly about proto-planets orbiting distance stars even though no optical telescope can see one.
These days, misinformation is being interpreted as theories offered by anyone skeptical of the mainstream consensus. A link to a paper was offered yesterday wherein climate alarmists panned the scientific work of 5 good scientists as ‘contrarian’. Both Roy and John of UAH, who were two of the five, can relate stories of how they have been censored by climate alarmist ijits in the past.
nate…”By ‘dweebs’ you seem to mean the vast majority of physicists, chemists, and engineers who use Thermodynamics today”.
***
There’s that vast majority thingy again.
Not at all, I used dweebs specifically in reference to anyone who accepted the statistically-derived version of entropy from Boltzmann after Clausius specifically created the term entropy to mean a transfer of heat out of a mass.
If Boltzmann had wanted to redefine entropy he should have invented his own term in line with his statistical delusion. Then people could have freely used it as a predictor of disorder. The Clausius version has nothing related to disorder in the equation.
Think about it. No one at the time, including Clausius had the slightest idea how heat related to the electrons in atoms. They were groping in the dark as to the relationship of heat and atoms. How the heck could they define heat transfer statistically?
Clausius had the insight that heat represented the motion in atoms but his definition of the 2nd law and entropy had nothing to do with internal energy or the motion of atoms per se. He did measurements of temperature at the beginning and end of a process and used such macro qualities to define heat transfer.
Clausius stated clearly that knowledge of the internal processes of atom, was not important. In fact, he had no idea how electrons interacted a la Bohr with the nucleus in atoms. As it turned out, it is a variations in the KE of electron via orbital changes that defines heat and electromagnetic energy within atoms.
We cannot claim that heat is kinetic energy because KE tells us nothing other than the energy is in motion. KE is not even a form of energy, it is related only to motion and applies to any form of energy. Heat is the form of energy and the motion refers to the motion of atoms externally and the motion of electrons internally.
If you add heat to a mass, it is the electrons that absorb it and jump to higher orbital energy levels. Since valence electrons also form the bonds holding atoms together in a mass, exciting the valence electrons causes the atoms to vibrate harder, since it unbalances the natural vibration between the nucleus protons and the electrons surrounding them.
That’s my story and I’m sticking to it.
—-
“No, they don’t reject Clausius version of entropy or the 2nd law. They still use it”.
****
Are you referring to those who claim heat can be transferred both ways between bodies of different temperatures when Clausius made it clear that BY ITS OWN MEANS, heat can only be transferred hot to cold?
—–
“But they do also accept that it relates to the statistical properties of atoms, and make use of that”.
***
How does one apply statistics to atoms he/she cannot see? In the days of Boltzmann, no one had any idea that electrons existed hence the content of an atom. Both Maxwell and Boltzmann were imagining particles that has little resemblance to real atoms.
—-
“Even Clausius agreed. He was the one that pioneered doing that!”
***
Clausius was a pioneer in the theory underlying statistical mechanics but he gave up on it because it was taking valuable time away from his work on real-time heat. Maxwell was influenced by his work. That does not mean Clausius agreed with the redefinition of entropy by Boltzmann based on statistical methods.
Gordon,
What is the kinetic energy of a 5 ounce baseball traveling 100 miles per hour?
“If Boltzmann had wanted to redefine entropy he should have invented his own term in line with his statistical delusion. Then people could have freely used it as a predictor of disorder.”
Again. You are wrong. He did not redefine entropy. He still used Clausius definition.
Then he showed how to calculate it from counting stats of molecules.
He advanced the subject in ways useful to many.
Not useful to you? Who cares?
Folkerts made a major mistake, which shows how confused the cult is about radiative physics.
Here, I corrected some of his confusion:
https://www.drroyspencer.com/2026/02/uah-v6-1-global-temperature-update-for-january-2026-0-35-deg-c/#comment-1735689
Now, I need to finish explaining his mistake.
Folkerts implies that a surface that is emitting 100000 W/m² can be subdivided. That is, 1/100 of the surface will be emitting 1000 W/m²! Or, 50% of the surface will be emitting 50000 W/m². That’s so wrong.
A uniform surface will be emitting the same flux all over its area. Flux cannot be divided, added, subtracted, averaged, etc. Flux is NOT energy. Folkerts, and the cult, try to treat flux as energy. They can’t learn.
Nope, he never said that.
Nate, I know that Folkerts is your daddy, but he also perverts physics. I gave you one link. If you agree to not comment here for 60 days, I’ll give you another link with even a better example of his perversion.
You need to learn to back up what you say, rather than just blurting out nonsense. So, agree to not commenting for 60 days and I’ll provide the other link.
Show some backbone!
Nah.
But If you can support your claim that a perfect emitter can simultaneously be a perfect reflector, as you do here:
https://www.drroyspencer.com/2026/03/uah-v6-1-global-temperature-update-for-february-2026-0-39-deg-c/#comment-1738690
with a valid physics source, then I will acknowledge being wrong.
You got caught with another false claim. And now you’re trying to divert to more crap.
You kids need to grow up and be responsible for your comments.
I won’t hold my breath….
Obviously, as always, you cannot provide a physics source to support your absurd physics claims.
The point seems to be just to get attention.
Negative attention seems to do the trick for trolls.
Nate, like the rest of the cult kids you can’t make a comment without a false accusation.
I never used the phrases “perfect emitter” or “perfect reflector”. You’re just making up crap, again.
I clearly explained the science, but you can’t understand the basics. That’s the reason for my effort–to show how ignorant and incompetent you kids are.
“I never used the phrases “perfect emitter””
You said e = 1. I assume you knew thst meant perfect emitter. Maybe you dont.
” “perfect reflector”.
You said that that the last two sources would not increase the temperature. That can only mean they were reflected.
If not reflected, then explain with real physics, where their energy flux went.
Yeah child, you were making up crap again.
It’s not relevant where the reflected fluxes end up. What is relevant is they can’t raise the temperature. You’re just trying to confuse the issue. That’s why you can never understand. One of the other cult kids, bob, asked the same question. See if you can dodge my answer like he did:
https://www.drroyspencer.com/2026/03/uah-v6-1-global-temperature-update-for-february-2026-0-39-deg-c/#comment-1738717
“I never used the phrases “perfect emitter” or “perfect reflector”. You’re just making up crap, again.”
“It’s not relevant where the reflected fluxes end up”
Ok, so they are reflected.
And you dont dispute, anymore, that e =1, means a perfect emitter.
So you STILL need to find a physics source to support the claim that a perfect emitter can simultaneously be a very good reflector.
Please show us your source.
If not, then your claims deserve only ridicule.
Have I got a deal for you, child Nate!
Don’t comment here for 60 days, and I’ll provide the source.
You can use the time to study up on physics, and when you come back you’ll learn even more.
What a deal. Don’t miss out!
“Folkerts implies that a surface that is emitting 100000 W/m² can be subdivided. That is, 1/100 of the surface will be emitting 1000 W/m²! Or, 50% of the surface will be emitting 50000 W/m². That’s so wrong.”
The only thing ‘so wrong’ here is your understanding of what I said. Once again, you show your utter lack of understanding of “emitted flux” vs “received flux”.
Suppose a 1 m^2 surface is emitting a flux of 100,000 W/m^2, which is a total power of = 100,000 W. If I cut away 99% of the surface, it is still emitting a flux of 100,000 W/m^2, but that results in only 1000 W of power emitted.
Emitted POWER decreases; emitted FLUX remains constant.
************************************
The PROPER implication of what I said is that a RECEIVING surface will RECEIVE 1% as much power if the EMITTING surface becomes 1% as large.
The PROPER implication is that you were trying to pervert the simple, straightforward problem and got caught, again.
I’M not at all interested by this discussions about fluxes hitting spheres, and don’t want to actively contribute to that in any form: I have enough to do with lots of other things.
*
However, some paragraphs in the posts upthread inevitably caught my attention.
Google now has an intelligent user interface that not only reacts to keywords but also answers even complex questions with a detailed, well formatted text – instead of simply generating dozens or thousands of links to sources and leaving you to do the tedious work of filtering out valuable information.
Thus… let’s use it.
*
1. ” One arriving flux of 250 W/² would only raise the sphere to 182K. It would take 4 separate fluxes of 250 W/² to get to 258K. ”
Google’s answer when given exactly this text above as input:
https://tinyurl.com/250-W-m2-1-src-182-k-vs-4-258
*
2. ” Whether you have the emitted flux 0.25% as strong (ie 250W/m^2 from the entire shell @ 258K), or you have the emitted flux at full strength (100,000 W/m^2) but from only 0.25% of the area of the shell, the result is the same: 258 K for the sphere. ”
Google’s answer when given exactly this text above as input:
https://tinyurl.com/sml-fl-ov-big-eq-big-fl-ov-sml
*
As barry 100% correctly stated upthread, it seems that some, especially all-time-better-knowers specialised in the ‘Keep it simple, Stupid’ blah blah, confound emitted fluxes with arrived fluxes. Ontly the latter ones matter here.
*
3. ” Flux cannot be divided, added, subtracted, averaged, etc. ”
Google’s answer when given exactly this text above as input:
https://tinyurl.com/Flux-no-add-sub-mult-div-avg
This is even much older pseudoskeptic nonsense than (1) and (2).
*
Let’s listen to James Clerk Maxwell, a person knowing 1,000,000 times more about fluxes than Robertson, Clint R and all other pseudoskeptics infesting this blog taken all together:
” In the case of fluxes, we have to take the integral, over a surface, of the flux through every element of the surface. The result of this operation is called the surface integral of the flux. It represents the quantity which passes through the surface. ”
A surface integral is formally defined as the limit of a Riemann sum, where the surface is divided into an infinite number of infinitesimally small area elements.
*
But, as all sound skeptics know, pseudoskeptics accept information from articles, Wikipedia, Google or an AI-based source, only if that information matches their personal view and narrative; otherwise, it is ‘plain wrong’.
I thought when sending my comment it would be too long, hence did not add this little extra:
” When do we average fluxes? ”
Google’s answer when given exactly this text above as input:
https://tinyurl.com/When-do-we-average-fluxes
*
A typical example is a study which was conducted in Germoney around 2010 by employees of a state environmental agency: They surveyed the ground using very slow-flying drones, flying over various landscape types such as forests, fields, and so on.
Each of these landscape types exhibited a different, unique signature—I’ve long since forgotten which kinds of emission were sounded.
The researchers had to process the heterogeneous flux measurements, accurate to the minute, into daily averages.
Before doing so, however, they had to automatically subdivide the measured pixel areas according to surface type in order to average them using type specific averaging periods.
Yeah.
*
The major reason why pseudoskeptics doubt and discredit everything is that none of them needs to work using what they doubt.
So what!
My effort to show the incompetence of the cult kids is paying off better than I expected. Here, Bindi is even out-doing gordon. With no understanding of the basics, he assembles out-of-context quotes, improper triggers to AI, and even ends up quoting Maxwell! (Electric/magnetic fields are NOT photon fluxes!)
This is why I always try to “keep it simple”. Bindi gets things so confused no one can even begin to help him. He has no interest in learning anyway.
Kids these days….
As predicted above, it was clear what the pseudoskeptic Professor Flux nicknamed Clint R would write:
” With no understanding of the basics, he assembles out-of-context quotes, improper triggers to AI… ”
*
But the very best is that now he writes:
and even ends up quoting Maxwell! (Electric/magnetic fields are NOT photon fluxes!)
What the heck do photons have to do with a general discussion about fluxes?
*
Of course, Professor Flux won’t understand what is behind this link:
https://en.wikipedia.org/wiki/Flux
because instad of learning the contents, he will – exactly as does Robertson – merely scan it for the presence of what he dislikes and the absence of what he expects.
*
IThat’s enough, let’s Professor Flux reply one more time: He’s always insisting on being the last one to reply to a sub-thread. I won’t, it’s too boring.
¡Basta ya!
Bindi incompetently inquires: “What the heck do photons have to do with a general discussion about fluxes?”
The discussion is about “radiative fluxes”, which are composed of photons. Everyone seems to understand that except YOU.
Now you claim you won’t try for the last word?
That’ll be the day….
Transport fluxes
1. Momentum flux, the rate of transfer of momentum across a unit area (N·s·m−2·s−1). (Newton’s law of viscosity)
2. Heat flux, the rate of heat flow across a unit area (J·m−2·s−1). (Fourier’s law of conduction. This definition of heat flux fits Maxwell’s original definition.)
3. Diffusion flux, the rate of movement of molecules across a unit area (mol·m−2·s−1). (Fick’s law of diffusion)
4. Volumetric flux, the rate of volume flow across a unit area (m3·m−2·s−1). (Darcy’s law of groundwater flow)
5. Mass flux, the rate of mass flow across a unit area (kg·m−2·s−1). (Either an alternate form of Fick’s law that includes the molecular mass, or an alternate form of Darcy’s law that includes the density.)
6. Radiative flux, the amount of energy transferred in the form of photons at a certain distance from the source per unit area per second (J·m−2·s−1). Used in astronomy to determine the magnitude and spectral class of a star. Also acts as a generalization of heat flux, which is equal to the radiative flux when restricted to the electromagnetic spectrum.
7. Energy flux, the rate of transfer of energy through a unit area (J·m−2·s−1). The radiative flux and heat flux are specific cases of energy flux.
8. Particle flux, the rate of transfer of particles through a unit area ([number of particles] m−2·s−1)
*
Of course: all these fluxes have a different meaning depending on what they transport, and are sometimes computed differently.
They are nonetheless all fluxes, which can be added, subtracted, multiplied, divided and averaged.
Anyone who doubts that is mentally deranged, as are all MAGAmaniacal Trumpistas.
Bindi just couldn’t stay away. He found some more stuff he can’t understand, to throw against the wall. He claims radiative flux can be simply added. So 5 ice cubes, each emitting 315 W/m² when added could produce a flux of 1575 W/m²! That would certainly boil some water.
Bindi “proves” ice can boil water! Just like he “proved” Moon is spinning.
What a clown.
Talk about clowns, Clint R 8:44 pm again forgets to add the emitting areas of all 5 of his ice cubes:
1575W/5m^2 = 315W/m^2
Ball4, your inability to understand any of this just proves me right, again.
Bindy
You are using LLMs as a crutch for your argument. LLMs don’t reason, they just produce noise in a statistical pattern.
Some pseudoskeptics don’t understand that when hearing of ‘to add’ with respect to fluxes, they still have to grasp that adding / subracting fluxes never, never implied to proportionally increase / decrease the temperature of the surfaces hit by the flux(es).
That’s what Clint R intentionally distorts and misrepresents, just like he distorts and misrepresent the effects of backradiation from the atmosphere to the surface:
(1) He always speaks about CO2 instead of accepting that H2O in its water vapor form still plays the major role in the case, and that by a lot;
(2) He permanently insits in repeating his nonsense à la
‘CO2’s 15 µ photons can’t warm the surface’
(what is true but meaningless), apparently thinking that would be the consequence of the (hmmh) correct but terribly unlucky statement ‘backradiation warms the surface’.
*
{ How can officials publish such a statement? Don’t they understand that it automatically will be misunderstood – intentionally or not? }
The backradiation is no more than
– that part of the longwave infrared radiation emitted by Earth (in response to the solar shortwave radiation reaching the surface according to its temperature)
but
– was caught by infrared sensitive atmospheric constituents (water vapor, CO2, CH4, N2O etc)
and
– was reemitted back to the surface.
***
” Just like he “proved” Moon is spinning. ”
No, I didn’t prove it.
I collected – beginning with Isaac Newton’s Principia Scientifica – a big amount of sources wich mention the work of scientists either having, like Newton, understood that the Moon spins about its polar axis, or even proved it or, like the Apollo, Selena or Chang’e missions, used previous results to get their lunar descent/ascent procedures working correctly.
***
We will see, however, that Clint R never did ever admit being wrong, and will reply to this comment with texts even dumber than before.
His choice.
Bindi, writing long, rambling, disjointed comments ain’t science.
If you have “proof” Moon is spinning on its axis as it orbits, please provide it.
IOW, put up or shut up.
” If you have “proof” Moon is spinning on its axis as it orbits, please provide it. ”
What’s the sense of your question, denier Clint R?
Regardless what I post links to, you anyway will deny these proofs while of course being absolutely unable to technically let alone scientifically disprove them.
Look in the list I regularly upload, and search for Mayer, Lagrange, Laplace.
Even if you were like me able to read documents written in the German language and typography used in 1750, you wouldn’t be able to understand anything of what Tobias Mayer wrote.
Let alone would you be able to walk through the proofs formulated by Lagrange and Laplace!
All what you and your acolytes Robertson & Co. are able to do is to misinterpret, distort, misrepresent, discredit and denigrate anything you dislike or don’t understand.
*
Got a viable model for orbiting without spin, Clint R?
That’s my point, Bindi. You’ve got NOTHING.
Writing long, rambling, disjointed comments ain’t science.
If you have “proof” Moon is spinning on its axis as it orbits, please provide it.
Or, if you have a viable model of “orbiting without spin”, please provide that.
But, you’ve got NOTHING.
IOW, put up or shut up.
Clint R
Playing games again! Bindidon did give you valid proof of the Moon rotating on its axis!! I read his link a few years back. It was from NASA on Moon Missions how they take the Moon’s known rotation into consideration for when the Lunar Module takes off from the surface to dock with the Command Module for the journey back to Earth. You are not interested in reality or Truth
You are a MAGA cult member and believe lies fed to you daily
You lack intelligence to come up with your own ideas or thinkthrough why the Moon has to rotate once per orbit to keep the same side facing Earth! I have given you many links
You fail misrtably at learning
If your Lord Trump told you the Moon rotated on its axis you would then blindly brlieve it! You are not a smart person. Jist a babbling unthinking child mind.
Norman, a link to one of the sources of the nonsense ain’t science. You need to learn the basics, and stay away from your cult.
For example, come up with a viable model of “orbiting without spin”. Once you do that, lunar motions will be obvious to you.
You’ve got to remember, NASA is just another bloated bureaucracy, full of corruption, WOKE, and incompetence. When Trump finishes with the drug cartels and terrorists, maybe he’ll have time to clean out NASA?
Ew, Clint R’s ‘skepticism’ is motivated by his right wing ideology.
So many of them are.
Eldro, you were unable to understand your cult’s “33K” nonsense. So here’s a chance for you to redeem yourself and prove you’re not an immature, ignorant, incompetent cult kid:
Provide a viable model of “orbiting without spin”.
To see and provide a viable model of “orbiting without spin” just look at twirling a ball on a string where the ball is orbiting the twirler without the ball spinning on the ball’s own axis wrt to the string.
Clint requests: “If you have “proof” Moon is spinning on its axis as it orbits, please provide it.”
Surely you know science is not about “proof”. It is about being able to make accurate predictions — a ‘viable model’ as you more accurately state elsewhere.
The “viable model” is that “orbit” is the motion of the CoM, while “spinning” (aka rotation) is the change in orientation with respect to the CoM.
With this model, gravity predicts the elliptical “orbit” of the moon around the earth (or earth around the sun, or the sun around the center of the galaxy).
Independent of “orbit” is “rotation”. Even if the moon were spinning faster or slower or even backwards, the *orbit* would remain the same. Rotation is measured relative to the ‘fixed stars’.
Perhaps the simplest way to know that “orbit” and “spin” are two different things is that they proceed at two different angular rates. The orbital angular velocity increases and decreases as the moon proceeds around its orbit, while the rotational angular velocity remains constant. This accurately predicts libration.
Good to see Ball4 conceding the moon issue. Welcome to the “Non-Spinners”, Ball4!
DREMT,
You missed the reference frame Ball4 was referring too, you see reference frames do matter.
No, bob, I missed nothing.
If Ball4 were a “Spinner”, he’d have answered that his model for “orbiting without spin” was something like a “frictionless yo-yo” – you know, something moving like the “moon on the right” (MOTR) in the GIF below:
https://upload.wikimedia.org/wikipedia/commons/5/56/Tidal_locking_of_the_Moon_with_the_Earth.gif
Instead, he answered that his model for “orbiting without spin” was a ball on a string – moving like the “moon on the left” (MOTL). That makes him a “Non-Spinner”.
His little “wrt to the string” reference frame remark changes nothing. Nothing to do with reference frames can make movement like the MOTL into movement like the MOTR. They will always be two different motions no matter which reference frame you use.
Finally, I’ve never said that reference frames don’t matter, or aren’t useful, or aren’t necessary. What I’ve said is that they don’t resolve the moon issue, in the way Ball4 seems to think they do.
DREMT 6:52 pm comments: “I missed nothing.”
That’s obviously wrong, DREMT did miss something when I am both a non-spinner and a spinner at the same time since our Moon both spins inertially and doesn’t spin as observed from Earth as Bob 6:19 pm notes depending on reference frame of the observer:
To see and provide a viable model of lunar “orbiting with spin” just look at twirling a ball on a string where the ball is orbiting the twirler with the ball spinning on the ball’s own axis wrt to inertial space.
Contrary to DREMT’s erroneous opinion, fact is reference frames completely resolve the moon issue as Tesla pointed out many moons ago with his Ferris wheel momentum analysis analogy.
DREMP,
What you missed is that Ball4 said the ball is not rotating with respect to the string.
And of course the string is spinning.
We see the phases of the Moon, because the Moon rotates with respect to the Sun.
If you think the Moon is not rotating, then you have absolutely no scientific credibility.
“What you missed is that Ball4 said the ball is not rotating with respect to the string.”
No, bob, I didn’t miss that. As I said:
“His little “wrt to the string” reference frame remark changes nothing. Nothing to do with reference frames can make movement like the MOTL into movement like the MOTR. They will always be two different motions no matter which reference frame you use.”
Saying that “orbiting without spin” is modelled by movement like the MOTL makes you a “Non-Spinner”. You can’t get around that with a mention of reference frames. That was Ball4’s mistake. He is now, and always will be, a “Non-Spinner”. If he wanted to be a “Spinner” he should have said that “orbiting without spin” is modelled by movement like the MOTR.
Ball4 is a “Non-Spinner”.
Ball4 remains a non-spinner wrt the string and a spinner wrt inertial space just like the physical MOTL observer. The MOTR is fictional not physical. Reference frames are cool.
Reference frames are understood with absolute crystal clarity, that’s how I know you’re wrong, Ball4.
You are a “Non-Spinner”. To be a “Spinner”, your model for “orbit without spin” would have to involve movement like the MOTR.
You’ve never even understood the very basics of this issue.
7:57 am: Provide a viable model of “orbiting without spin”:
11:06 am: To see and provide a viable model of “orbiting without spin” just look at twirling a ball on a string where the ball is orbiting the twirler without the ball spinning on the ball’s own axis wrt to the string.
MOTR is just a model; the very basic issue is it’s not a viable moon. See the MOTL for a viable moon. Tesla was right when observing from Earth many moons ago.
Ball4 parades his lack of understanding of the basics of this issue.
He doesn’t seem to realise that by saying something moving like the MOTR is not a viable model of “orbit without spin” he’s just reinforcing my point ever more strongly that he’s a “Non-Spinner”.
Great entertainment.
Both non-spinner AND spinner all at once depending on observing frame. Just like DREMT and Tesla.
No, Ball4. This is precisely what you’ve never understood. It’s a true dichotomy, a binary proposition. “Orbit without spin” is either movement like the MOTL, or the MOTR. And, as soon as you realise that, and start arguing about which one is correct, you’ve already transcended reference frames. You’ve tacitly admitted that reference frames do not resolve the moon issue in the way that you think they do. So many “Spinners” have already argued with me that “orbit without spin” is movement like the MOTR…huge back and forths on the subject. All the while, they didn’t even realise the fact they were arguing that point meant they’d already gone way beyond the reference frame issue.
Oh well.
The MOTR is not a viable moon DREMT as you’ve been told so your whole argument fails because it isn’t what Clint R asked for.
Viable “model” of “orbit without spin”, Ball4. That’s what we’re looking for.
Not “viable moon”.
You’re completely wrong, as usual.
Then don’t use either MOTL or MOTR to respond to Clint R as you did. I already gave Clint a viable model of orbiting without spin above at 11:06 am.
Just want to say that the MOTR is not a viable model of orbital motion without spin.
It may start with no rotation, but that is not the lowest energy state, the Moon will start rotating and after some time will become the Moon on the left.
MOTL or MOTR is just essentially a shortcut way of describing the motion, Ball4.
You presented the ball on a string (which moves like the MOTL) as being a viable model of “orbit without spin”. That makes you a “Non-Spinner”. To be a “Spinner”, you would have needed to present a model that moves like the MOTR. Something like a “frictionless yo-yo”.
Neither of you even seem to understand what is meant by “orbit without spin”. Despite it being easily understandable from the words used, and despite it being explained to you in excruciating detail over the course of about eight years.
It’s a motion. One of the two motions involved in discussing the moon issue. The other motion being “spin”.
As you think the Earth’s moon spins, you believe the moon is doing both motions. “Orbit without spin”, which you define as movement like the MOTR, and “spin”. Both motions added together can result in overall movement like the MOTL. It’s slightly difficult to understand, but not eight years worth of difficult.
I did present a viable model that moves like the non-viable MOTR at 10:22 pm. DREMT admittedly simply ignores comments showing DREMT is wrong.
Not much I can do when I’m arguing against a pathological liar.
Yes DREMPT,
For eight years you have been confused by the terms orbit and spin.
Orbit is the path.
Spin is rotation on an axis.
Now I will invoke the 3 body problem, to prove that an orbit is not a rotation, as all bodies in the universe are linked by gravity, therefore their motions are chaotic, not repetitive, thus not conic sections, therefore not rotations.
The Motl is the one that spins, so it’s not a viable model of orbit without spin.
Neither the MOTL or the MOTR is a model of “orbit without spin”, bob. A model would be something like a ball on a string, which moves like the MOTL, or a “frictionless yo-yo”, which moves like the MOTR. By “model” we are looking for a physical object which moves in the relevant manner.
If you are a “Spinner”, your model of “orbit without spin” should move like the MOTR. I’m giving you guys an answer to Clint’s eternal question of “what is your model of “orbit without spin?”” – the “frictionless yo-yo”! You’re welcome.
Ball4’s comment that a ball on a string is a viable model of “orbit without spin” means he is a “Non-Spinner”.
Once you guys get up to speed and start actually debating whether “orbit without spin” is movement like the MOTL or the MOTR, you will have left reference frames far behind and will finally have elevated yourselves to a position of some understanding of the basic issues.
Then, maybe you’ll be ready to look at the “perfect tetherball” example. Maybe.
4:42 pm is again evidence that DREMT admittedly simply ignores comments showing DREMT is wrong since correctly:
Ball4’s comment that a ball on a string is a viable model of “orbit without spin” wrt the string means he is a “Non-Spinner” in that reference frame.
Ball4’s comment that a ball on a string is a viable model of “orbit with spin” wrt to inertial space means he is also a “Spinner” in THAT reference frame.
Our viable Moon has inertial spin on its own axis but no spin on its own axis as observed from Earth – Tesla made that observation many moons ago.
No, Ball4. There is no one single motion “orbit with spin” which you can find a viable model for. There are an infinite number of different potential spin rates, and thus an infinite number of potential different models!
There is one single motion “orbit without spin”, however, and it is either movement like the MOTL, or the MOTR.
You really can’t wrap your head around this at all, can you?
If there are two identical spheres, sphere 1 and sphere 2, which may differ only in size.
Their average surface temperatures Tmean1 and Tmean2 relate as the fourth root of incident on the spheres fluxes.
Thus:
Tmean1 /Tmean2 = (Flux1 /Flux2)^!/4
–
https://www.cristos-vournas.com
christos…how are things in Greece these days. Hope you are far enough from Iran that they cannot bomb you.
I agree with your post and it is obvious. For those who disagree, we have a saying over here that they are built too close too the ground, and it goes straight-over their heads.
A shorter form is that it went straight over his head.
From Google AI…
“It went straight over his head” means
a person completely failed to understand, notice, or appreciate what was said or done, usually because it was too complex, sophisticated, or subtle. It implies the information passed by without being comprehended, similar to a joke or complex idea that misses its target audience”.
Cambridge dictionary…
“over your head
idiom
too difficult or strange for you to understand:
go over your head I tried to take in what he was saying about nuclear fusion, but most of it went over my head.
Having casually observed the gulf between those fomenting climate change hysteria, and those who claim that our carbon emissions have zero effect on the climate, I begin to wonder.
I know that there are partial truths in both arguments.
My best understanding, however, is the reality that, as Doctor Spencer describes, human activities do not have a very large impact on climate. That acknowledged, however, we need to think about the consequences of climate change, regardless of the cause. The reason is that the Earth viewed as a system has a very slow response time when viewed in terms of human lifetimes.
The bottom line is that climate change will happen, human activities have some influence as do all other forms of life on this planet
My question: Where are the discussions about measures that should be planned in advance to expected changes in global weather patterns?
The frequency and intensity of major storms are like to increase increases with atmosophereic warming because warmer air can hold more water vapor with the inherent increase in heat energy. There is a reasonable expectation of sea level rise on the order of a quarter to half meter over the next 80 years.
What plans are in place to prevent flooding of lowland areas? Relocating populations away from existing coastlines where appropriate? And so on.
Anon,
The actual trends are spring coming earlier and fall coming later.
The evidence is that the climate zones are shifting north in the northern hemisphere and south in the southern hemisphere.
Google climate zone changes.
History says they always have changed, nothing new there,today is nothing special.
Bob,
The spring in the northern hemisphere is earlier as well as the autumn.
I put this down to the earth’s orbit as being the main culprit. Changes in albedo from man’s affect on the environment, heat islands again have an effect. CO2 may have an affect but it is minor.
Use logic, rather than suspect data tends to be reliable in the long run.
When are you going to post your famous solar graphs with nothing else but coloring, Anon for Q-related reasons?
“CO2 may have an affect but it is minor.”
Other than by political biases, how do you know that?
Nate,
You suggest that I’m politically biased. What about yourself, does your political ideology have anything to do with you ignoring logic?
Albedo has a huge affect and is basic science.
Urban heat island, again, has a huge affect. Ok you might need a car to prove it to yourself. And it’s not just urban, it’s farming (1000 watts per cow), it’s industrial sites requiring mega watts of energy. All of which turns into heat.
Pollution, or the lack of, smog & particulate pollution has reduced with a noticeable increase of solar energy getting through.
Orbital changes. Minor in astronomical distance but large when including the inverse square law. Again very basic science.
Whereas Co2, to the anti capitalists has been a very invisible and convenient excuse to push their agenda. Co2 may have a small impact but it’s not the only source of natural climate change.
Anything But CO2.
How original.
Ok, so just a feeling. Not based on any facts.
Nate,
So you don’t understand the basics of science.
My view is based on the most known aspects of science, not political driven hatred.
So you can’t deny albedo effects, orbital effects and pollution effects. Now I understand why Clint refers to you as he does
“My view is based on the most known aspects of science”
So you say. Who knows what that actually is.
If by ‘science’, you mean the highly skewed information skimmed off the denialist blogosphere, no credit can be given.
“Pollution, or the lack of, smog & particulate pollution has reduced with a noticeable increase of solar energy getting through.”
Yes this is most likely causing accelerated warming in the last 15 y, compared to previous 4 decades.
“Orbital changes. Minor in astronomical distance but large when including the inverse square law. Again very basic science.”
Nobody has provided the actual data or evidence. Astrology.
“Whereas Co2, to the anti capitalists has been a very invisible and convenient excuse to push their agenda. Co2 may have a small impact but it’s not the only source of natural climate change.”
Again, your political biases on display, no science offered.
Nate,
Astronomy is not astrology, although you don’t understand the difference is not a complete surprise.
NASA has a department dedicated to work out where all the large bodies are in the solar system. Needed to plan launch Windows. It’s not a math problem that can be worked out easily, as it needs a supercomputer
So the evidence of the earth orbit last and future fears with NASA and not with you or studentduh who struggle with basic geometry.
Oh astronomy?
Then you can be the first to provide the data or evidence that planetary positions can account for the GW of the last century.
Thanks for the review!
If this does not fit the blog I replied to, is there one that oes, and can it be moved to there?
binny…”Let’s listen to James Clerk Maxwell, a person knowing 1,000,000 times more about fluxes than Robertson, Clint R and all other pseudoskeptics infesting this blog taken all together:
” In the case of fluxes, we have to take the integral, over a surface, of the flux through every element of the surface. The result of this operation is called the surface integral of the flux. It represents the quantity which passes through the surface. ”
A surface integral is formally defined as the limit of a Riemann sum, where the surface is divided into an infinite number of infinitesimally small area elements”.
***
Maxwell was a mathematician and his work on fluxes is based on the brilliant work of Faraday, who lacked the mathematical skills to present his findings and was not even a physicist. Maxwell kindly came to his assistance in order to get him published but Maxwell also gets the credit for Faraday’s work and discoveries.
Something similar to Boltzmann getting credit for the brilliant work of Clausius on the 2nd law and entropy even though the work of Boltzmann only served to obfuscate the work of Clausius.
Binny is correct, however, even though the definition of Maxwell’s flux still seems obscure. It is usually applied to electromagnetic energy passing through a surface and as such, the flux is a representation of the electric and magnetic fields of EM which can be represented by vectors.
A flux always represents something real. Maxwell applied fluxes to EM while Fourier applied them to heat flow in a solid. Apparently he regarded heat as an entity that can flow like a flux. Of course, in the day of Fourier, nothing was known about atomic structure and how heat is transported through a solid by electrons. Since electrons are physical particles they don’t really make up a flux field. However, it does no harm to visualize them as such.
There is a simpler representation from the electrical/electronics field. When a current of electrons and their charges run through a conductor, they automatically create a magnetic flux field about the conductor. Of course, that flux tries to collapse and as it does it induces a current back into the conductor which opposes the current that caused it. Hence the voltage induced, that produces the counter-current, is called a counter EMF, or counter voltage.
That is, if a voltage produced the original current that creates the flux is polarized positive to negative, the Cemf has the opposite polarity.
That is the basic principle of inductance. The magnetic portion of the fields to which I referred are called fluxes. The term magnetic flux is very common in the electrical/electronics fields in which they are basics.
With regard to surface integrals and the Riemann sum, I think crediting Riemann for that is an insult to Newton, who invented the calculus. Riemann apparently developed a rigourous method for dividing the area under a curve into ever-decreasing areas that in the limit approach the exact area under the curve when summed.
I think that is splitting hairs in a major way but science seems full of such incidents where historians try to remove the credit from the original inventor or spread it out among many inventors.
Some achievements are suppressed by governments,one that comes to mind is the building of the world’s first programmable computer, in 1946 the USA claimed the prize but unknown to them a programmable computer had been running in England since 1943, It was invented by a telephone engineer called Tommy Flowers, consisting of 1600 tube valves, he called it Colossus. It was installed at Bletchley Park, by 1946 they had 10 machines running .
ian…we must not forget Alan Turing whose Turing machine is considered by some to be the first computer model based on electronics. Of course, he needed someone with expertise, like Flowers, an electrical engineer, who had the know-how to design and build such a machine.
Turing had several other projects on the go of a similar nature like his bombe machines, which were run using electromagnets and relays. It his remarkable brain-power that came up with the ideas and he hired other to implement them. The machines were geared to speeding up the process of decrypting codes.
The impetus for Flowers would have been the code-breaking going on at Bletchley, since Turing was one of those experts who hired him to do Colossus. Obviously, Turing did not have the expertise to build one but his Turing machine provided an algorithm for a CPU. Obviously, Flowers had his own genius when it cam to the implementation.
If it interests you, look up Max Newman as well and one of the key cryptanalysts at Bletchley, Dilly Knox.
Bletchley was essentially based on many people of genius level who were recruited as code breakers.
From my earlier post, Gordon, Turin did not commission Flowers to build Colossus, Turin said what Flowers was suggesting was impossible,his team at Bletchley refused to fund the idea, so Flowers took 50.000 pounds out his own bank account and funded the project himself, when he completed the build he
went back to Bletchley and arranged a trial run,the machine worked as Flowers said it would, and was much faster and more robust than anything Turin had, he was so impressed he asked for it to be dismantled and rebuilt at Bletchley, he then commissioned 10 more to be built at Bletchley, when asked why he knew tube valves would run without the failures that always dogged valve technology, Flowers replied , thermal shock destroys tube valves, and the secret was never to turn them off.
binny…”Why is Robertson unable, when reading the text about the ‘Spots in the body of the sun…’ to understand or at least accept that Newton is not speaking about motions but about period of motions”?
***
I have told you why, several times, in detail.
1)Elsewhere in Principia, Newton lays out clearly that the Moon moves with a linear motion. At each instant of its orbital motion, the Moon instantaneous motion is always linear. That means, as Clint offered, someone looking forward along the orbital path, would always be looking forward.
Linear motion, or rectilinear motion, or straight-line motion, means the Moon is not rotating. It appears to rotate because it is moving through Earth’s gravitational field and that field bends the linear motion very gradually into a full ellipse, which resembles a circle more than a true ovoid.
With such a motion, there is no need for the Moon to rotate about a local axis since the very curvilinear motion developed as a result of gravity acting on the linear lunar motion always keeps the same face of the Moon pointed at Earth.
2)If Newton had intended that the Moon rotates about a local axis, he would have been compelled to go into great detail on the subject. Such a rotation would not be a trivial matter to explain, it would have required great detail to explain it. Thus far, not one poater on this site, nor NASA itself, has been able to successfully explain the Moon rotating exactly once per orbit.
In fact Tesla disproved it using kinetic energy examples.
Anything in the translation alluding to local rotation is covered in a few sentences, hardly the MO of Newton regarding such an important subject.
Gordon,
The Moon does not move with rectilinear motion. Full Stop.
A tangent line does not mean the Moon is moving in a straight line. Full Stop.
Bob, don’t wrestle with him.
bob…you are full of Moon dust.
A tangent line is a straight line and at any instant the Moon is following that straight line. Newton knew that, I know that, but apparent neither you nor stoopidb know that. This is the very basis of calculus.
If Earth’s gravitational field was suddenly shut off, do you think the Moon would continue in its orbit? If so, a 100 demerit points. It would fly off along the current tangent line direction at the moment the field was shut off.
Ever see sparks fly of a grinding wheel? Why don’t they continue along a circular path?
If you want to prove that mathematically, the direction a particle will take when released from a turning wheel, you take the first derivative of the circle equation and that gives you the slope of the tangent line at that point. The particle will follow that straight line direction.
Why shouldn’t it? Alternately, why should it continue along a curved path when there are no forces compelling it to do that?
We are talking about linear momentum since angular momentum requires a rigid body as an axle to constrain a mass attached to it to a curved path. Linear momentum requires an inline force to initiate it and another opposite inline force to stop it. If we can calculate the force required to stop the momentum in a mass, we know essentially that the momentum represents a pseudo-force in the tangential direction.
Such a force can only act in a straight line since to make the force act along a curve, some sort of lever arm or field is required. Force will simply not move naturally along a curved path.
The Moon has only linear momentum as Newton claimed. There are no forces acting to ***DRIVE*** the Moon along a curved path. Our gravitational field acts only to draw the linear momentum vector off its linear course. Therefore the lunar orbital path is a resultant between the linear momentum of the Moon and the centripetal force of gravity. If the Moon broke free, it would veer off in a straight line along the last instantaneous tangential line.
If, on the other hand, the Moon was approaching Earth at a correct altitude, it would follow a parabolic or hyperbolic path while under the influence of Earth’s gravity. The path would gradually straighten out as the effect of gravity diminished.
“The Moon has only linear momentum as Newton claimed.”
I would love to see a link and/or quote to the place you think Newton claims such a thing.
“We are talking about linear momentum since angular momentum requires a rigid body as an axle to constrain a mass attached to it to a curved path.”
I would also love to see a link and/or quote from any physic text that much such a stipulation on angular momentum.
Not you stating your opinion or your interpretation, Gordon, but links to actual sentences from actual source.
Gordon,
Use your Calculus skills and take the second derivative.
The first derivative is velocity and the second derivative is acceleration. So that means the Moon is accelerating towards the Earth, and the result of acceleration and momentum is the elliptical path of the Moon.
And yes I have used a grinder, and I observed the sparks going off in arcs rather than straight lines.
Because of gravity, the same force causing the Moon to follow an eclipse, not a straight line.
Gordon, You mustve heard of Kepler’s Laws of planetary motion.
The second law is “A line segment joining a planet and the Sun sweeps out equal areas during equal intervals of time.”
Area swept in a short time dt is (1/2)R^2*dtheta, where dtheta is the angle swept by the line segment in the time dt.
So we have R^2(dtheta/dt) = R^2*omega = C a constant
Now the orbital angular momentum is L = mR^2*omega = mC must also be a constant.
Thus 2nd law is saying that the orbital angular momentum is a constant for a body in orbit.
Not 0, a constant.
Fun fact #1 about Newton: he wrote more about the Bible than about science – mostly about prophecy in the the books of Daniel and Revelation. He was obsessed/intrigued about the “end times.”
Fun fact #2 about Newton: he was a pretty good investor, but he was totally taken in by the atmosphere of greed surrounding the South Seas Bubble. He was a wealthy public official and investor, but lost 20,000 pounds (equivalent to millions of dollars today) in South Seas Company shares.
He stated “I can calculate the motions of the heavenly bodies, but not the madness of people.”
SOLAR MINIMUM UPDATE
Records for earlier-than-usual high temperatures were broken in multiple states by the heatwave, including in California, Arizona and Nevada.
A town near North Shore, California, matched the previous March record this week, hitting 42C on 18 March, according to the NWS.
Phoenix also recorded its hottest March day ever on Thursday, climbing to 40C, past the previous record of 39C which was set on Wednesday.
Las Vegas reached 35C, surpassing the previous record of 34C on Wednesday.
“Extreme early-season heat coupled with high tourism rates will make this heat very dangerous,” the Las Vegas, Nevada NWS office warned earlier this week.
Typically, the average first 40C degree day of the year does not occur until the end of May, the NWS said.
https://www.bbc.com/news/articles/cj40xgv5vpdo
Don’t you just love the BBC, I have to live with the scaremongering rubbish they present as fact, a warm couple of days in a desert,is not a crisis.interesting, but without scrutiny it is no more than a number in a short record.
Dullard, why do you believe the BBC so much? They apologised to Trump for editing his speech, something you quoted as proof of your bias but since have gone very quiet.
BBC is worse than CNN which at least has to correct their errors.whereas the BBC ignores virtually all complaints, and wasn’t their truth seeker of BBC verify caught lying about her CV?
Still no solar graphs, Anon for Q-related reasons, and which part of “according to the NWS” you do not get?
“why do you believe the BBC so much?”
Again, cant refute the message, so attack the messenger.
The records being broken in Western US during this heat wave have been reported widely in many media outlets.
Nate,
You may not be aware that the BBC has made some silly claims about the weather over the years. bbc reports on any doom goblins utterance as if it’s gospel. Bbc reports on many weather events that even the ipcc doesn’t recognise.
So yes it’s reasonable to ignore the BBC as a reliable source.
Anon for Q-related reasons might not be aware that nobody cares about his rants about the Beeb.
” Because I’m president. ”
https://www.nytimes.com/2026/03/26/us/politics/trump-mail-in-voting-florida.html
More fun please!
https://www.fox13now.com/news/politics/zero-non-citizens-voted-in-utah-review-finds
I don’t always have time to respond to all the nonsense from the cult kids. But, I had time this morning to find this from Bindi: “I’M not at all interested by this discussions about fluxes hitting spheres, and don’t want to actively contribute to that in any form: I have enough to do with lots of other things.”
Of course Bindi has time to support his TDS, but no time to learn science.
But, his nonsense needs to be debunked. Supposedly he retrieved this from Google AI:
In reality, a single flux of 250 W/m^2 would raise a blackbody sphere to approximately 258 K, not 182 K. Furthermore, applying four such fluxes (totaling 1000 W/m^2) would raise the temperature to approximately 364 K, not 258 K.
Now all of the cult kids should know that is wrong. So, test for Bindi — What did Google AI get wrong?
See if you can get the right answer, Bindi. I say you can’t. Prove me wrong.
Dimwit,
before you spout more endless disinformation, take up my simple challenge:
Derive the solar constant (SC).
A first year student can do it.
Otherwise (as we all know) you have zero credibility.
Prove us wrong.
Child, the Solar Constant is just an average of solar measurements around the orbit, applicable to AU and without albedo. An accepted value is usually between 1361 and 1371 W/m². It’s not that hard to understand. But thanks for proving me right — you don’t know crap about the issues here.
Now, it’s past your bedtime. I won’t be bothered by any more of your immature nonsense.
Dimwit,
that is not a derivation.
YOU GET A BIG F.
Try again, the SC is not just a measurement.
Here is a hint, the sun’s surface temperature is close to 5777 K.
StudentDuh,
It’s amusing that you call someone else a dimwit. You have been struggling with the inverse square law, and only using simplistic orbits that I was starting to wonder at what school you were at.
By the way, have you any understanding of what a 3 body problem is?
You’re very confused Fstudent, as usual.
But resubmit your comment without the childish insults and I’ll try to help. I’ve learned cult kids can’t learn. Let’s see if you can at least act like an adult.
Quiet children.
Pay attention.
Next step in deriving the SC:
Which law should we now apply assuming the sun is about 6000 K ?
(Hint: It has nothing to do with the 3-body problem)
“What did Google AI get wrong?”
The only thing ‘wrong’ is not being specific about what is meant by “a single flux of 250 W/m^2”. There are two perfectly reasonable interpretations
a) there is a single, uniform flux of 250 W/m^2 over the entire surface of the sphere
b) there is a single, unidirectional flux of 250 W/m^2 heading toward the sphere from one side.
For (a), the correct result is 258 K.
For (b), the correct result is 182 K.
Anyone with a little mental flexibility should be able to see and understand both options.
Folkerts tries to pervert the situation, again.
Bindi’s Google AI claim: “In reality, a single flux of 250 W/m^2 would raise a blackbody sphere to approximately 258 K, not 182 K.”
To emphasize: “…a single flux of 250 W/m^2…”
Folkerts tries to distract by changing to multiple fluxes “over the entire surface of the sphere”. Since a “single” flux cannot be “over the entire surface” of a sphere.
So Bindi’s Google source is WRONG, and Folkerts gets caught attempting to pervert reality, again.
“Since a “single” flux cannot be “over the entire surface” of a sphere.”
Why not? Here’s one definition: “Radiative flux, also known as radiative flux density or radiation flux is the amount of power radiated through a given area”. We can define any area, A, we like — for example the surface of a sphere. Then find the total power, P, thru that surface. Voila! we have the one and only flux = P/A.
Of course, this is just a semantic diversion on your part from the crux of the issue. 5 or 6 or 100 unidirectional fluxes of 1000 W/m^2 can be incident on a sphere and can raise the temperature more than 4 fluxes could achieve.
Clint R,
Try now and learn something.
A single flux, say from the Sun to the Earth, can certainly can illuminate the entire surface of the Earth, when the Earth is rotating on an axis and that axis is tilted with respect to the plane of Earth’s orbit.
NOAA has shifted from Oceanic Nino Index ONI to relative RONI.This shift suggests a reconsideration of the actual causes of ENSO. https://link.springer.com/article/10.1007/s44292-026-00077-7
nabil…considering that the PDO was not identified till the 1990s and the AMO around the same era, I don’t think we have learned much about the origins of ENSO. The PDO was first noticed in 1977, around the time the current warming propaganda began, and any good research on ocean oscillations has been drowned out by alarmist propaganda.
The guy who named the PDO thought it was driving ENSO.
SOLAR MINIMUM UPDATE
Almost-global-average sea-surface temperatures are creeping up to record levels again and we’re still in La Nina (according to NOAA).
https://bsky.app/profile/micefearboggis.bsky.social/post/3mhzcxlvzk224
” … and we’re still in La Nina (according to NOAA). ”
Where does Kennedy get that from?
We left ENSO’s La Niña mode (moving above its ‘-0.5’ treshold) by end of January:
https://www.cpc.ncep.noaa.gov/products/CFSv2/imagesInd3/nino34Mon.gif
*
But this is a discussion about the sex of angels compared to what comes next if the incoming El Niño matches the predictions.
‘+2’ by end of November this year… that’s a lot, looks like the 2023 resp. 1998 El Niños:
https://drive.google.com/file/d/1DPH9DAqm2g54Q0GlHAvsyEGt4V1yl-ap/view
> Where does Kennedy get that from?
The next post:
https://bsky.app/profile/micefearboggis.bsky.social/post/3mhzcxngma224
Reactance hinders learning.
You donÄ’t need to show me that link, Willard.
If you had understood what was missing in Kennedy’s first comment, you’d have posted this link too (the contents of which I read long lonf before Kennedy posted it).
Ignorance and arrogance hinder learning even more.
In addition, lets’s have a look a the somewhat strange fact the NOAA not only hosts two very different ENSO monitoring departments which, at a very first glance, do not seem to have that much in common:
– NCEP with Nino 1+2, Nino 3, Nino 4, Nino 3+4
– MEI (the Multivariate ENSO Index).
*
But… when you look at NCEP data, you are furthermore confronted with Internet publications about the current ENSO status which apparently do not give a good fit to each another:
– on the one hand, you see, coming from the CLIMATE PREDICTION CENTER/NCEP/NWS, this picture:
https://www.cpc.ncep.noaa.gov/products/analysis_monitoring/enso_advisory/figure02.gif
with last update on March 12 from data dated march 4 (subfig. 2 from top for Nino 3+4)
and
– on the other hand, you have, from NWS / NCEP / CPC, this one, also for Nino 3+4:
https://www.cpc.ncep.noaa.gov/products/CFSv2/imagesInd3/nino34Mon.gif
currently dated March 28 based on ICs from March 18-27.
*
By all deep respect due to John Kennedy, a researcher known to me since I have read the paper
Quantifying uncertainties in global and regional temperature change using an ensemble of observational estimates: The HadCRUT4 data set
which he coauthered in 2012 already, I still don’t understand his position wrt NCEP’s so much differing ENSO publications, and prefer to stick to original NCEP resp. MEI data:
https://drive.google.com/file/d/1KoNIqs-16AUzO91cA_-NZTtRJbWTKWIb/view
*
Some might wonder about the difference between NCP Nino and MEI.
This is due to the fact that while NCEP restricts its ENSO evaluations on sea surface temperatures in very small areas (Nino 3+4: 5S:5N – 170W-120W), MEI is a very much more complex time series, also monitoring a much greater observation area:
” The bi-monthly Multivariate El Niño/Southern Oscillation (ENSO) index (MEI.v2) is the time series of the leading combined Empirical Orthogonal Function (EOF) of five different variables (sea level pressure (SLP), sea surface temperature (SST), zonal and meridional components of the surface wind, and outgoing longwave radiation (OLR)) over the tropical Pacific basin (30°S-30°N and 100°E-70°W). ”
*
Data sources
NCEP Nino (1-2, 3, 4, 3+4)
https://www.cpc.ncep.noaa.gov/data/indices/ersst5.nino.mth.91-20.ascii
MEI V2
https://psl.noaa.gov/enso/mei/data/meiv2.data
Missing this might have been easy
“A transition from La Niña to ENSO-neutral is expected in the next month, with ENSO-neutral favored through May-July 2026 (55% chance). In June-August 2026, El Niño is likely to emerge (62% chance) and persist through at least the end of 2026.”
But then why read anything when one just has to act the opposite as Bordo every month?
Gordon, it appears to have anthropogenic causes: uneven warming between the hemispheres
Atmosphere is very thin to play a role of a warming blanket. Atmosphere is not able to warm Earth’s surface.
Unfortunatelly, when Earth’s surface temperature (288K) is compared with the surface temperature of the airless Moon (220K), some climatologists still claim it warms surface by +68C!
–
https://www.cristos-vournas.com
Christos, Christos, Christos, explain this fact:
“Venus is much hotter than Mercury, despite being further from the Sun. Venus has a surface temperature hot enough to melt lead. This high temperature is due to a thick greenhouse atmosphere that traps heat, whereas Mercury has no atmosphere to hold onto solar energy.”
I look forward to your tortured response.
Ever hear of the 2nd law? The surface temperature averages 450C and the Venusian atmosphere gets progressively cooler with altitude. According to your theory, and other alarmists, heat is being transferred from the cooler atmosphere to the much hotter surface.
That’s a no-no for the 2nd law. That is, in order for the atmosphere to be heating the 450C surface, the atmosphere would have to be much hotter.
The nonsense of a runaway thermal effect on Venus came from an ijit, Carl Sagan, who thrived on belittling others. James Hansen, former heat of NASA GISS was obtuse enough to believe Sagan and tried to introduce the same lame theory to Earth’s atmosphere.
Some of us here have studied thermodynamics formally and we are not falling for such pseudo-science.
Thank you, studentb, for your response.
–
When comparing Venus’ atmosphere vs Earth’s “This high temperature is due to a thick greenhouse atmosphere that traps heat, whereas Mercury has no atmosphere to hold onto solar energy.”
Vemus has a two hundred eighty thousand (280 000) times more CO2 in its atmosphere. It is 280 000 to 1. When comparing – Earth has no greenhouse effect – so much infinitesimal Earth’s greenhouse effect is.
–
https://www.cristos-vournas.com
“Earth has no greenhouse effect – so much infinitesimal Earth’s greenhouse effect is.”
Christos, I am confused by your comment. Either Earth has a greenhouse effect or it doesn’t.
Which is it?
I think it is very small. I accept it is there. There should be some theoretically.
Christos, Earth’s atmosphere, over 90% nitrogen and oxygen, definitely acts as insulation. High levels of water vapor (reflecting a full spectrum) can even raise surface temps. We saw that with Hunga-Tonga. CO2 can’t do that.
Earth is basically a “water planet”. If all land mass were leveled, filling ocean and sea basins, the resulting “land” would be covered by water to a depth of about 1.5 miles.
Earth’s atmosphere and 70% surface water are why Earth is warmer than Moon.
Thank you, Clint R, for your response.
I think the +68°C warming is not because of atmosphere’s greenhouse effect. I think the reason is the Rotational Warming Phenomenon.
–
https://www.cristos-vournas.com
You’re very welcome, Christos. I knew you didn’t mean Earth’s atmosphere had no effect. You were referring to CO2.
ian…re Bletchley Park and Colossus computer.
I am not arguing with you on the facts abut Colossus and Flowers, since I am no authority on the subject. However, I have read a lot on Bletchley Park and to understand the overall scenario, I think it is necessary to consider that history in an overall manner as related to Flowers and his contribution.
I acknowledge that it’s possible Flowers developed Colossus independently but the following article on Wiki suggests it was done in conjunction with Newman, who I mentioned before, and Turing.
https://en.wikipedia.org/wiki/Colossus_computer
“Colossus was designed by General Post Office (GPO) research telephone engineer Tommy Flowers[1] based on plans developed by mathematician Max Newman at the Government Code and Cypher School at Bletchley Park.
Alan Turing’s use of probability in cryptanalysis (see Banburismus) contributed to its design. It has sometimes been erroneously stated that Turing designed Colossus to aid the cryptanalysis of the Enigma.[4] (Turing’s machine that helped decode Enigma was the electromechanical Bombe, not Colossus.)”
No matter what, it was a tremendous development and Flowers definitely had the know-how as an electrical engineer to make it happen. He may have been working on it independently as you claim, using his own funds.
https://en.wikipedia.org/wiki/Tommy_Flowers
Apparently there was infighting at Bletchley and whereas Turing admired Flowers and introduced him to Newman, a poobah at Bletchley, Welchman, did not like the use of vacuum tubes by Flowers in lieu of relays.
Apparently the crew at Bletchley named the computer ‘Colossus’ due to its immense proportions. A handheld calculator today would be far more powerful.
The point is, they were living under a gun due to the war and they all managed to pull together and get the job done.
We seem have the same issues today where people who have no idea what they are doing wrt to technology get to be in charge. Some are claiming that driver-less cars are safe and I disagree vehemently. I have been hired in the past solely to work on computerized systems and their sensors. Complex systems often fail for no apparent reason and to think cars are being controlled by such units baffles me.
I have been watching the show ‘Mayday’ and it is apparent that automation is responsible for disastrous airline crashes that kill thousands. Some pilots blithely rely on computers to do their jobs and when the automation fails they are caught unprepared. They essentially have no idea what to do and I can sympathize based on the number of times I’ve had to scratch my head wondering where to begin with a diagnosis.
Bindi, before you clog the blog again, how about cleaning up some of your messes:
https://www.drroyspencer.com/2026/03/uah-v6-1-global-temperature-update-for-february-2026-0-39-deg-c/#comment-1739383
“Since a “single” flux cannot be “over the entire surface” of a sphere.”
Why not? Here’s one definition: “Radiative flux, also known as radiative flux density or radiation flux is the amount of power radiated through a given area”. We can define any area, A, we like — for example the surface of a sphere. Then find the total power, P, thru that surface. Voila! we have the one and only flux = P/A.
Of course, this is just a semantic diversion on your part from the crux of the issue. 5 or 6 or 100 unidirectional fluxes of 1000 W/m^2 can be incident on a sphere and can raise the temperature more than 4 fluxes could achieve.
I don’t know why Folkerts put his comment both here and upthread. But, I’m glad he did.
His comment reveals two examples of his ongoing nonsense:
1) He confuses emitted flux with arriving flux.
2) He believes that all flux can raise temperature, even if the target object is emitting an equal flux.
Kids these days….
Are you really claiming that if I got 100 flat mirrors that each reflect a 1000 W/m^2 beam of sunlight toward a sphere (emissivity =1), that the hottest I could get the sphere with those 100 beams of sunlight would be 364 K? That only the first 4 beams of sunlight matter?
Well, let’s make it simpler to avoid confusion.
If the sphere (emissivity = 1) were in deep space and receiving 1000 W/m^2 at its disk from 100 different directions, then its maximum temperature would be about 364.4K. Or, it would not exceed 365K.
Do you want to confuse that reality?
The sun @ ~ 1.2 AU would provide 1 beam of 1000 W/m^2. This would warm the sphere to 258 K.
If I could place 3 additional sun-like stars (or simply 3 flat mirrors) we would have 4 beam of 1000 W/m^2. This would warm the sphere to 364 K.
Are you TRULY going to continue to argue that having 1000 total stars around the sphere (or 999 reflected beams from mirrors) would STILL leave the sphere at 364 K?
Confuse the issue all you want, Folkerts. No matter how many sunbeams, suns, stars, or mirrors you conjure up, the reality remains the same:
Adding more such sources wouldn’t change a thing. That’s why more ice cubes can’t make your drink warmer. Like all of “climate science”, you don’t understand radiative physics, or thermodynamics.
But, keep trying to pervert reality. The other cult kids will love you for it.
So if we kept adding stars until the ENTIRE SKY was covered with suns, you still argue that an object at the center would be 364 K, not 5770 K. Fascinating.
What’s fascinating Folkerts is your inability to face reality.
If all of the stars in your ENTIRE SKY were only providing 1000 W/m^2 to Earth’s disk, then Earth’s temperature would not exceed 365K.
Many astronomers believe there are trillions of stars out there, yet Earth remains about 288K.
But, keep trying to pervert reality. The other cult kids will love you for it.
(What will you try next?)
Here is how Clint R counts…
1 2 3 4 4 4 4 4 …
bob, you haven’t learned a thing. But you seem to believe being “cute” will make up for your ignorance.
Thanks for proving me right.
“If all of the stars in your ENTIRE SKY were only providing 1000 W/m^2 to Earth’s disk”
Its fascinating how thoroughly you can misunderstand. I suspect the only way to ‘get on the same wavelength’ would be to actually talk and draw pictures to clarify what we are each thinking.
Here, I am talking about a beam of ~ parallel rays (like sunlight), where the beam has an intensity of 1000 W/m^2. Like a powerful spotlight say 10 meters away shining at the sphere. That is fully compatible with your stated problem.
For the sake of discussion and easy numbers, lets assume the sphere has a cross-sectional area of 1 m^2 (total surface area of4 m^2).
1 such spotlight provides 1000 W to the sphere and would warm your sphere to 258 K. Any additional spot light will send 1000 W more to the sphere. The power doesn’t magically stop arriving or stop being absorbed when we have 4 spotlights and the sphere is 364 K. 5 spotlights provide 5000 W. 6 spotlights provide 6000 W. The sphere keeps getting more power and keeps getting hotter.
Now eventually, we will reach a state where we physically can’t fit any more spotlights (physically can’t put more mirrors to reflect more sun light). Then we will reach a maximum temperature for the sphere. But that maximum is not when the sphere is receiving 4000W from 4 spotlights.
I better stop there. Tell me SPECIFICALLY what if anything you disagree with so far.
Clint,
You are just an ignorant slob.
Prove me wrong.
Well Folkerts, you’re trying two new tricks. You’re now switching to “spotlights”, and converting to “power”. But tricks only work on kids.
You’re still making the same mistake. Once the 4-1000 W/m^2 fluxes have warmed the sphere to 364, no other 1000 W/m^2 sources can raise its temperature. As with your “climate science”, you believe all flux is always absorbed. That’s why you believe ice cubes can boil water. You obviously have no real-world experience with radiative physics or thermodynamics.
Consequently, I don’t expect you to change your false beliefs.
What will you try next?
Clint R
Rather than babble and tell Tim Folkerts (probably the poster with most physics knowledge) he is wrong do some actual science and use experimental evidence to prove all current established science wrong. Just because you strongly believe your understanding is correct you need to prove your case with real world evidence! Get a sphere set up six equal heat lamps around it measure the surface temperature of the sphere as you turn on each light. You babble around thinking people actually care about your made up opinions. No one really does. They just can’t believe how ignorant and arrogsnt you are. Amazing phenomena. Your thought pricess is on same level as “flat-earthers”. Now will you provide real evidence or will you babble about concepts you can’t understand??
Norman, I’m sorry Folkerts has let you down. That happens so often when children cling to false heroes.
I’m interested in “Science for Adults”. That means reality without insults and false accusations.
If you want to start with some science, let’s see your viable model of “orbiting without spin”.
Clint R
Please try to remain focused. We are not talking about the Moon!! You say “real” sciene then do a real experiment and provide empirical evidence for your claims. Yoi make the claim additional radiant heat sources will quit warming a surface. So do science!! I think you throw the word “science” to baffle ignorants on this blog like DREMT who is asclueless as they come. The rest of us know you are ignorant anti-science!!
Norman, I’m not going to waste any more time with you unless you eliminate the insults and false accusations. You can’t learn by behaving like a child.
Grow up and I’ll teach you some science.
“If the sphere (emissivity = 1) were in deep space and receiving 1000 W/m^2 at its disk from 100 different directions, then its maximum temperature would be about 364.4K. Or, it would not exceed 365K”
Again, do all those watts/m^2 > 1000 just get reflected, or what?
How can an emissivity = 1 surface become a very good reflector (e ~ 0)?
To maintain the T =364.4 K, the surface has to continue to absorb 1000 W/m^2.
Then how does the surface KNOW which fluxes to absorb and which to reflect?
Answer with real physics please.
Is someone impersonating Nate? This doesn’t sound like him at all. There are no insults or false accusations!
Is he trying to grow up? Let’s assume the best, and respond accordingly.
Nate asks: “Again, do all those watts/m^2 > 1000 just get reflected, or what?”
If photons are not absorbed or transmitted, then they get reflected.
Nate asks: “How can an emissivity = 1 surface become a very good reflector (e ~ 0)?”
Absorp.tion is based on compatibility of the flux with the surface. The surface compatibility is determined by the type of molecules and temperature. As the temperature changes, the emissivity changes.
Nate says: “To maintain the T =364.4 K, the surface has to continue to absorb 1000 W/m^2.”
Actually the sphere would have to be absorbing 4 – 1000 W/m^2 fluxes, to maintain its 364.4 K temperature.
Nate asks: “Then how does the surface KNOW which fluxes to absorb and which to reflect?”
See above.
“Once the 4-1000 W/m^2 fluxes have warmed the sphere to 364, no other 1000 W/m^2 sources can raise its temperature. ”
You keep claiming this bases on your own authority, but never giving either a source or a reason.
“You’re now switching to “spotlights””
No, just clarifying what you mean. Are your incoming fluxes beams — like sunlight or a spotlight? I.e. plane waves? Sometimes you seem to act like it. Or are your fluxes some other sort of geometry? Perhaps hitting normal to the surface wherever they arrive.
If you can’t describe the geometry of your own fluxes, then you clearly can’t comment intelligently on the result of the fluxes.
“and converting to “power””
And again, if you can’t understand that 1000 W/m^2 to a 1 m^2 surface is 1000 W, then you again clearly can’t comment intelligently on the issue at hand.
Clint R,
You claim that if a photon is not transmitted or absorbed then they get reflected.
In your continued ignorance, you forgot another way photons interact with matter.
Being the son of a certified egghead, I used to live on Marie Curie lane, and the next street over was Compton court.
And wavelength compatibility is the wrong terminology, the proper one being absorption spectrum.
Tell the truth Cable Guy.
“Nate asks: “How can an emissivity = 1 surface become a very good reflector (e ~ 0)?”
Absorp.tion is based on compatibility of the flux with the surface. The surface compatibility is determined by the type of molecules and temperature. As the temperature changes, the emissivity changes.”
In your problem you specified e =1, said nothing about the molecule type, or that e changes with temperature.
Are you now, post hoc, changing the problem to suit your claims?
You implied the temperature when reflection starts had to do with the sources being 1000 W/m2, which is not a property of the body at all.
Which is it?
Real physics, please.
It’s just a bunch of cult kids, having fun. They can only clog the blog.
Folkerts is now confused about the “geometry”. bob believes the street he lived on means anything. And we now know it was the real Nate — the false accusations have returned. He was just trying to trick me.
Kids these days….
Clint R,
As usual, Clint R, you missed it by that much.
Not the street I lived on, but the next one, named after Arther Compton.
Who described one form of scattering, which you are still ignorant of.
“Compton scattering” has nothing to do with the problem discussed here. The cult kids just continue to clog the blog with childish incompetence, proving me right.
And, they won’t stop….
Clint R,
Do you get the point.
You thought you described everything that could happen when a photon interacts with matter.
You forgot scattering.
What is my ‘false accusation’?
Im just unclear about what determines reflection vs absorption in your theory?
Nate, here are your false accusations:
1) “Are you now, post hoc, changing the problem to suit your claims?”
Trying to explain the science to you is NOT changing the problem.
2). “You implied the temperature when reflection starts had to do with the sources being 1000 W/m2, which is not a property of the body at all.”
I never implied such a thing. I’m not responsible for your inferences.
Now, if you can’t admit those are false accusations, there’s no need to continue.
“If the sphere (emissivity = 1) were in deep space and receiving 1000 W/m^2 at its disk from 100 different directions, then its maximum temperature would be about 364.4K. Or, it would not exceed 365K.”
“Adding more such sources wouldn’t change a thing.”
Clearly, you are saying that the 364.4 K is due to a property of the sources.
Not a property of the sphere, its molecules, etc.
Not a false accusation.
You need to clarify, is it a property of the source, or a property of the sphere and its molecules, that determines the maximum T?
You have said both.
It’s been already well explained. Your questions reveal that you’re not making any progress.
We’re just going to have to accept that this is too far over your head.
[PUFFMAN] If the sphere (emissivity = 1)
[PREVIOUSLY, PUFFMAN] Black bodies are imaginary. So all of the rest of your comment is nonsense.
Clint,
Here you say: the temperature of the sphere is due to a SOURCE property.
https://www.drroyspencer.com/2026/03/uah-v6-1-global-temperature-update-for-february-2026-0-39-deg-c/#comment-1739571
“If the sphere (emissivity = 1) were in deep space and receiving 1000 W/m^2 at its disk from 100 different directions, then its maximum temperature would be about 364.4K. Or, it would not exceed 365K.”
Here:
https://www.drroyspencer.com/2026/03/uah-v6-1-global-temperature-update-for-february-2026-0-39-deg-c/#comment-1739846
It is due to a SPHERE property.
“Nate asks: ‘How can an emissivity = 1 surface become a very good reflector (e ~ 0)?’
Absorp.tion is based on compatibility of the flux with the surface. The surface compatibility is determined by the type of molecules and temperature. As the temperature changes, the emissivity changes.”
So you seem comfortable with your contradictions!
No, you have not explained them away.
Where can I find a physics source that describes ‘flux-surface compatibility’ as you do?
So far, my class of dim wits cannot answer the most basic questions concerning the derivation of the SC.
The sun’s surface temperature (T) is about 6000 K.
The Stefan Boltzmann Law tells us that the intensity of the emitted radiation is
sigma * T*T*T*T
in units of Watts per meter squared.
Now, for the benefit of CR, the total amount emitted by the sun is this intensity multiplied by the surface area of the sun (in units of Watts)
Assuming these Watts are undiminished as they head off into space, what is the intensity of the radiation (in units of Watts per meter squared) at a point located at the mean Earth-Sun distance?
Its simple.
No wonder he’s an F student. He can’t learn.
I gave him a simple explanation of the Solar Constant. I made it so simple a normal child could understand. But cult kids are different. They have no ability to learn. They can only stalk and spew nonsense.
Here, the F student still believes the Solar Constant was “derived”. He obviously believes it was “derived” from Sun’s emitting temperature. Of course, it’s almost the other way around. Sun’s emitting temperature was derived from the solar spectrum, as seen from Earth. The peak energy of the spectrum provides the wavelength for Wien’s Displacemnt Law, which provides Sun’s emitting temperature.
Watch the F student continue to prove me right. He can’t learn.
CR, CR, CR,
go to the top of the class for dim-wittery.
“… he obviously believes it was “derived” from Sun’s emitting temperature. Of course, it’s almost the other way around. Sun’s emitting temperature was derived from the solar spectrum, as seen from Earth. The peak energy of the spectrum provides the wavelength for Wien’s Displacemnt Law, which provides Sun’s emitting temperature.”
I don’t think I have ever read such blatant, incoherent nonsense. This even worse than Gordon’s dribblings. Surely you are joking?
StudentDuh
The solar constant is irrelevant for anything to do with the earth’s weather or climate.
You been posting about a circular orbit and how the earth’s orbit isn’t being affected by anything but the sun. You seem to panic with anything like 3 body problem is even mentioned. Yet NASA themselves produces very precise data detailing where the planets & sun are every second of the year. Guess what all the orbits varies due to the complex gravitational interaction between all bodies.
Why are you trying to construct a web of simplistic assumptions to try and prove that the Co2 is causing extinction level global warming?
If you trying to convince others you might succeed with those who have already fallen for the MSM lies aka the Dullards of the world.
Anon:
“The solar constant is irrelevant for anything to do with the earth’s weather or climate.”
!
Join CR at the top of the class. It is obvious that neither of you have any inkling about the topic at hand. I suspect you are both mathematically illiterate. The puzzle is why you continue to demonstrate your ignorance to the world at large.
StudentDuh,
So why do you believe in to be e so look at constant is useful UI l?
StudentDuh,
So why do you believe that the solar constant is useful?
Fun and games with AI predictive text!
Psst, Anon for Q-related reasons:
https://arxiv.org/abs/2511.02864
When will you be posting these old colored sun graphs?
Asking Google for
” Influence of the solar constant’s differences over the year on weather and climate ”
currently gives the following text:
” The solar constant—the average amount of solar energy reaching the top of Earth’s atmosphere (~1361 W/m²) actually fluctuates by roughly 6.9% throughout the year, peaking at perihelion (early January) and reaching its minimum at aphelion (early July).
While this 6.9% variation occurs, its direct influence on the global, yearly average climate is minimal compared to other factors like Earth’s axial tilt.
*
Influence of Yearly Variations on Climate
Perihelion vs. Aphelion: Earth is closest to the sun (perihelion) in early January, receiving about 6.9% more radiation than at aphelion in July.
Hemispheric Differences: Because the Northern Hemisphere is tilted away from the sun during perihelion (winter), the increased intensity from closeness is largely offset by a lower angle of incidence. Conversely, the Southern Hemisphere summer is slightly warmer due to this coincidence of proximity and tilt, and its winter is slightly colder.
Seasonal Contrast: Despite the change in distance, the axial tilt (23.5 degrees) is the primary driver of seasons, not the distance from the sun. The 3% variation in distance is not considered of great importance in the overall seasonal climate structure.
*
Influence on Weather Patterns
Energy Intensity at Surfaces: The 6.9% difference means that, at the top of the atmosphere, January brings stronger solar radiation than July. However, atmospheric absorption, cloud cover, and land/sea distribution significantly modify this on the ground.
Energy Balance: While the total energy entering the atmosphere varies, the seasonal lag (due to thermal inertia of the oceans) means that the coldest and warmest days do not directly correspond to perihelion or aphelion.
*
Long-Term Solar Constant Changes vs. Yearly Variations
11-Year Solar Cycle: The sun’s activity itself changes over 11-year cycles, but this variation is small, changing total irradiance by only about 0.1% (~1 W/m²) from solar maximum to minimum.
Minimal Global Impact: These small fluctuations (0.1%) impact global average temperature by only 0.1°C or less.
Modern vs. Solar Drivers: While solar variations have historically caused minor, long-term climate shifts (e.g., the “Little Ice Age”), they cannot explain the rapid warming of the last century. ”
*
Nearly all of this matches what I have read in other sources long time ago.
*
No need to believe anything what Google AI replies, especially when you have observed many times that it replies differently if you ask in French, German or… English, he he.
No need however to arrogantly discredit and denigrate Large Language Models without of course being able to scientifically disprove them.
Bindy,
You rely on LLMs for an answer rather than using common sense and logic. LLMs do not reason, they are just a statistical noise generator.
Each year the earth takes a slightly different orbit. This is due to the other large bodies in the solar system. This is a simple fact that I doubt you are willing to challenge, especially as you would have to work out a 3 body problem by hand. NASA maps & predicts the all orbits in the solar system to a precision that is needed for space flight, the department have proved their accuracy numerous times & is not influenced by the politics of the day. Is NASA wrong in their calculations? If so prove it! I have more faith in NASA’s calculations of orbits than I do on LLMs results. Earth never has the same path year to year!!
I doubt if you are willing to argue that the inverse square law is wrong.
Combine the inverse square law with NASA’s calculations then the result is that the earth never receives the same amount of energy on the same day each year.
Do you disagree so far?
Bindy,
You wrote after reading results from a LLM
“Nearly all of this matches what I have read in other sources long time ago.”
Well yes of course it matches what you have read. That is how LLMs work. Training & test data has always been a week point of IT systems, this you should know.
Remove all references to the bible and the LLMs wouldn’t be able to “answer” any question about the bible. LLMs do not reason, they don’t have any intelligence or deductive ability.
Why you and others can’t get your collective head around the basics of LLMs is a complete mystery to me. Care to explain?
If I tell you “Kalman filter”, Anon for Q-related reasons, does that ring any bell:
https://arxiv.org/abs/2508.11703
Yeah, LLMs can do that.
Cheers.
Bonjour
Je suis écrivaine et j’ai écrit un livre sur les problématiques
de la météorologie.
Je ne suis qu’une simple lambda.
J’ai besoin de savoir si le Docteur Roy Spencer de l’Université d’Alabama exerce toujours aujourd’hui ?
C’est très important pour moi de connaître la vérité.
Merci à vous toutes et tous
Maybe Dr. Spencer is excited by the launch back to the Moon! Woot Woot!!
norman…question.
If the capsule reaches the far side of the Moon, and it could go into a stationary orbit at the point, following the Moon in it orbit, would they see the Moon rotating on an axis?
In other words, if a radial line was drawn from Earth’s centre, through the Moon and through the capsule, would the capsule then begin rotating about a local lunar axis as well, while maintaining its position on the radial line?
Easy.
If the moon did not spin the stars would appear fixed in the sky.
However, the stars appear to rise and fall on the moon as they do here on Earth.
Therefore, the moon spins.
Let’s consider the ball on the string situation. Imagine one end of the string, or rope, or steel hauser cable, has a planet on it like the Moon. Suppose the other end is anchored in the centre of the Earth on some kind of swivel where it is free to rotate about the swivel through 360 degrees. I realize that would require the Earth to be somewhat like a yo-yo, complete with a slit so the string can move freely.
So, the mini-planet is rotating about the Earth on the guide wire and you are standing on it looking out to space. Since your feet are anchored in one spot, you cannot possibly rotate about your own COG. Would the stars appear to be moving as you swept past them? And would you be rotating about an inner axis, or simply standing there, along for the ride?
If you went to where the cable was attached to the mini planet, and looked directly out, you would be facing Earth and always looking toward it. Same with the Moon.
The Moon does not need the cable to move in the same way. It has instantaneous linear momentum and no resistance to its motion. If you were standing on the Moon, you’d see the stars in exactly the same way without rotation.
On the other hand, tidal locking theory claims the tidal forces slow the Moon down. We don’t want that to happen, do we? The Moon would lose orbit and spiral down into Earth at an amazing velocity. It would be 8-ball in the side pocket for us, as we are knocked unceremoniously off into space.
I realize tidal locking theory is aimed only at slowing the alleged lunar rotation but it could not do that without applying a drag to the entire lunar mass, which would slow it down.
Here, Bordo:
https://www.youtube.com/watch?v=xCz833oVTjo
You don’t even have to think.
This below is state-of-the-art since decades, but some high specialists doubt and deny it of course without being able to technically disprove it.
*
A single photon return identifies itself in lunar laser ranging (LLR) through a combination of precise time-of-flight (ToF) gating, spectral filtering, and statistical analysis of repeated events, rather than through a unique, individual identifier on the photon itself. Because only a few photons return from the 10^17 to 10^20 sent in a single pulse, the system operates in a regime where the signal is buried in vast environmental noise (e.g., sunlight on the lunar surface, dark counts).
*
Here is how a single photon return is identified:
Temporal Gating (Time-of-Flight Tracking):
Because the distance to the Moon is known roughly, the receiver calculates when the reflected pulse should arrive within a small, specific time window (a range gate), often within a few nanoseconds. Any detected photon within this narrow expected window is highly likely to be a genuine return, while photons arriving outside this window are dismissed as noise.
Time-Correlated Single Photon Counting (TCSPC):
Stations send pulses at a high rate (e.g., 10 pulses per second, or kHz in modern systems). They accumulate data on where photons arrive in time relative to the firing of each pulse. Over thousands of pulses, the scattered noise appears randomly distributed, while the real photons align into a clear “peak” in a histogram of residual times.
Narrow Spectral Filtering:
A very narrow-band optical filter is placed before the detector, allowing only the exact wavelength of the laser (e.g., 532 nm or 1064 nm) to pass, blocking the vast majority of broadband solar background noise.
Spatial Filtering:
A narrow field of view (often just a few arcseconds) for the detector ensures that only light coming from the exact location of the lunar retroreflector array is received.
Solid-State Detection:
Modern detectors like Silicon Single-Photon Avalanche Diodes (SPADs) or Superconducting Nanowire Single-Photon Detectors (SNSPDs) offer high detection efficiency and very low “dark count” rates, allowing for the precise timing (nanosecond/picosecond) of individual photons.
*
Through these methods, the single photon acts as a “marker” that is consistent with the predicted time-of-flight, enabling millimeter-level accuracy in calculating the distance to the Moon.
We are being inundated with more slang and pseudo-verbiage from NASA during this Moon shot. The current phrase that has the media outlets gushing is ‘trans lunar burn’, a meaningless term thrown out by NASA in an attempt to appear cool.
Trans means ‘across’, essentially, unless you are into perverted sex. In that context, what does trans lunar mean? The Trans Canada Highway crosses Canada from coast to coast while the Trans Siberian Railway crosses…you guessed it…Siberia. So, if the thrusters are ‘burned’ in Earth orbit, why is it called a trans lunar burn?
The word burn obviously refers to the burning of fuel to give thrust to the vehicle, meaning a force is applied to it to cause it to accelerate. The burn itself does not supply the force, it is the explosive force (gas pressure) of the burning gases. At any rate, it is the force from that pressure that causes the acceleration required to exit the current Earth orbit. Where that thrust is applied is the critical element.
I’d call it an ‘Earth orbit exit thrust’, but that would not sound cool.
If you look at the diagrams supplied of the orbiter circling the Earth, the point at which it is released on it lunar journey is at a tangent point to a radial line from Earth’s centre. I tried to explain that the other day when I went on about Newton’s observations re the Moon moving always with a linear motion, which means at any instant, it is moving along a tangent line to the orbital curve.
At the moment the thrusters are fired, the vehicle is hopefully moving in an instantaneous tangential direction that points along the path it is intended to take. It’s similar to someone throwing a hammer at the Olympics. The ball, at the end of a chain, is released exactly at the moment its tangential direction faces in the required direction. If it is released too soon, the ball will fly to the right of the target and if released too late, it will veer to the left of the target.
Same with the orbiter, although I am sure they have it calculated to leave Earth orbit gradually, via computer control, rather than abruptly, and it will have trim features that allow the pilot to adjust if necessary. The end result is the same, to exit Earth orbit in a direction toward the Moon.
A question I have is whether they’ll need to fire the thruster again to free themselves of the partial lunar orbit? The maneuvre is being called a slingshot action but that’s not how it works in general. In a real slingshot maneuvre, a body approaches a planet or the Sun at such an angle that it is fired out the other end along a parabolic or a hyperbolic path. It uses gravity to accelerate it.
A body flying unaided, or unpowered, would not dare go into a partial orbit for fear of being trapped in it. If it became trapped in orbit it would need to expend considerable fuel to get out of the orbit again.
1. Earth’s Without-Atmosphere Mean Surface Temperature Calculation.
R = 1 AU, is the Earth’s distance from the sun in astronomical units (R = 150.000.000 km, which is Earth’s average distance from the sun).
Earth’s albedo: aearth= 0,306
Albedo is defined as the diffuse reflected portion of the incident on planet surface solar flux.
Earth is a smooth rocky planet, Earth’s surface solar irradiation accepting factor is:
Φearth= 0,47
Φ – the planet surface solar irradiation accepting factor (the planet surface spherical shape and the planet surface roughness coefficient).
Φ(1 – a) – the planet surface coupled term (it represents the NOT REFLECTED portion of the incident on planet surface solar flux, it is the portion of solar flux which gets in INTERACTION processes with the planet surface).
β = 150 days*gr*oC/rotation*cal – ( the Rotational Warming Factor constant ).
N = 1 rotation /per day, is Earth’s rate of rotation with reference to the sun. Earth’s day equals 24 hours= 1 earthen day.
cp.earth = 1 cal/gr*oC, it is because Earth has a vast ocean. Generally speaking almost the whole Earth’s surface is wet.
We can call Earth a Planet Ocean.
σ = 5,67*10⁻⁸ W/m²K⁴, the Stefan-Boltzmann constant
So = 1.361 W/m² (So – it is the Solar constant – the solar flux at the Earth’s average distance from the sun).
Earth’s Without-Atmosphere Mean Surface Temperature Equation Tmean.earth is:
Tmean.earth = [ Φ (1-a) So (β*N*cp)¹∕ ⁴ /4σ ]¹∕ ⁴
Τmean.earth = [ 0,47(1-0,306)1.361 W/m²(150 days*gr*oC/rotation*cal *1rotations/day*1 cal/gr*oC)¹∕ ⁴ /4*5,67*10⁻⁸ W/m²K⁴ ]¹∕ ⁴ =
Τmean.earth = [ 0,47(1-0,306)1.361 W/m²(150*1*1)¹∕ ⁴ /4*5,67*10⁻⁸ W/m²K⁴ ]¹∕ ⁴ =
Τmean.earth = ( 6.854.905.906,50 )¹∕ ⁴ =
Tmean.earth = 287,74 Κ
And we compare it with the
Tsat.mean.earth = 288 K, measured by satellites.
These two temperatures, the calculated one, and the measured by satellites are almost identical.
–
Link: https://www.cristos-vournas.com
The 288K is measured at Earth’s surface with atm. by thermometer, Christos, not by satellite radiometer. Since Christos knew the answer could be 288K, Tmean.earth employed a fudge factor Φ for its calculation.
Satellite radiometers measure 255K in their orbit over given time periods.
Thank you, Ball4, for your response.
There are other reasons, not the presence of atmosphere, that make Earth warmer than the Moon by +68°C!
–
Link: https://www.cristos-vournas.com