
 Home/Blog
I’m told by John Christy that there has been considerable discussion amongst the state climatologists about March temperatures in the U.S. setting a new record. If true, the media will no doubt lecture us on how this is evidence for global warming. (Why do we never hear about cool months being evidence against global warming?)
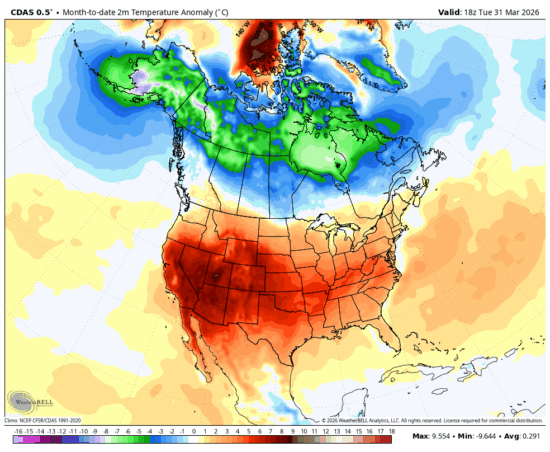
It is human nature to think the weather we experience has some sort of global significance. But look at NOAA’s best estimate of March 2026 temperature departures from “normal” (1991-2020 average) over North America (below). Yeah, the U.S. was unusually warm. But what about all the unusual chill over the northern parts of North America? Alaska and most of Canada were below normal.
UAH Satellite Lower Tropospheric Temperatures for March 2026
As part of our monthly global temperature updates (posted separately) here are the March temperature departures from normal for the lower troposphere, 1979 through 2026 in the Lower 48 (top panel of Fig. 2). Last month was clearly the warmest in the 48-year satellite temperature record.
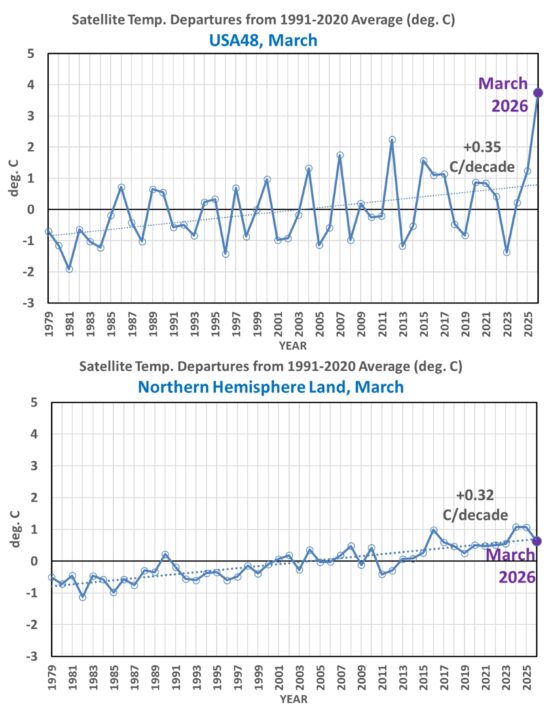
But when we examine the bottom panel in Fig. 2 we see that, averaged over all land areas of the Northern Hemisphere (including Canada and Alaska), March 2026 was uneventful, and was even cooler than 2024 and 2025. In fact, 2026 was right on the long-term trend line.
The message here is that the unusual (and likely record) warmth of March 2026 in the U.S. was largely due to normal month-to-month weather variations, while the large-scale climate signal shows March was a continuation of the slow (and largely benign, and possibly even beneficial) warming trend we have been experiencing in recent decades.


Extreme heat is always a headline, while extreme cold is just a footnote. Somewhere is always hotter than normal… this time it’s going to be a big headline because it’s the U.S. that’s hotter than normal.
For USA48 March, it isn’t just an extreme month, it is a record month in the UAH record. The first since 2012. Speculating on how a record cold March might have been reported in the media is pure conjecture since that hasn’t happened since 1981.
But the real story is the trend lines. Always up.
Dr. Spencer
In the western U.S. (where the largest temperature anomalies have occurred), snowpack has been at or near record lows this winter, further reducing surface albedo (leading to earlier spring heating) and soil moisture (partitioning more energy into sensible heating rather than evaporation).
When the recent heat wave developed on top of these conditions, it may have allowed the same type of pattern to produce more extreme temperatures than in the past.
And of course, the long term reductions in snowpack in the West are attributable to global warming.
This seems to be consistent with the mainstream scientific understanding that a warmer baseline leads to higher temperature anomalies.
What are thoughts?
your
Dr Roy asks: “Why do we never hear about cool months [in U.S.] being evidence against global warming?”
Doesn’t your Fig. 2 answer that?
* March 2023 was exceptionally cold — but it only ~ tied 1996 and wasn’t as cold as 1981.
* March 2026 was exceptionally hot — and clearly surpassed 2012 (which clearly surpassed the previous high, which clearly surpassed the previous high).
I suspect other months would have a similar trend. A “typically cold month” is not news; a “record-shattering warm month” *is* news.
…and it occurred during recovery from the most unusual period in the satellite record, which possibly was caused by the Hunga Tonga event.
I am not sure how that point resolves the peculiarity of Dr. Spencer’s statement: “Why do we never hear about cool months [in U.S.] being evidence against global warming?”
Even if we exclude data after 2023 from the UAH USA48 time series, the months with the largest positive temperature anomalies are still concentrated mostly in the past two decades.
On the other hand, the most negative anomalies are largely found earlier in the record.
When data from 2023 and later are included, this pattern becomes even more pronounced rather than weaker.
This is fairly evident with even a modest look at the data.
Kynqora
The ‘big Reveal’ boy Tim S lacks any technical let alone scientific competence with regard to weather and climate affairs, despite being a graduate of one of the world’s most prestigious universities (though interestingly, he remained silent about his academic standing, let alone his final exam grades).
*
All what he is able to is:
– to follow UAH’s monthly graph with global anomalies;
– to discredit people who show with running means what the data can’t show, e.g.
https://drive.google.com/file/d/1Q8KYVf7WCUa1fEvjHJ9fkF8Vy7NEcdNL/view
*
” This is fairly evident with even a modest look at the data. ”
Exactly!
Ascending sort of the UAH March months:
1981 3 -1.91
1996 3 -1.42
2023 3 -1.36
1984 3 -1.22
2013 3 -1.17
1980 3 -1.16
2005 3 -1.14
1983 3 -1.03
1988 3 -1.02
2001 3 -0.98
Ascending sort of all UAH months:
1979 1 -3.23
1983 4 -2.65
1989 12 -2.24
2010 2 -2.16
1983 12 -2.15
1981 3 -1.91
2009 12 -1.86
2000 11 -1.78
1979 2 -1.76
1985 1 -1.61
*
Descending sort of the UAH March months:
2026 3 3.74
2012 3 2.24
2007 3 1.75
2015 3 1.57
2004 3 1.32
2025 3 1.25
2017 3 1.14
2000 3 0.97
2020 3 0.87
2021 3 0.85
Descending sort of all UAH months:
2026 3 3.74
2012 3 2.24
2017 2 2.06
1981 4 1.97
2026 2 1.91
1999 11 1.87
2016 11 1.84
2021 12 1.81
2007 3 1.75
2015 3 1.57
*
Cela explique tout.