
 Home/Blog
The Version 6.1 global average lower tropospheric temperature (LT) anomaly for July, 2026 was +0.48 deg. C departure from the 1991-2020 mean, which is statistically unchanged from the June, 2026 value of +0.46 deg. C.
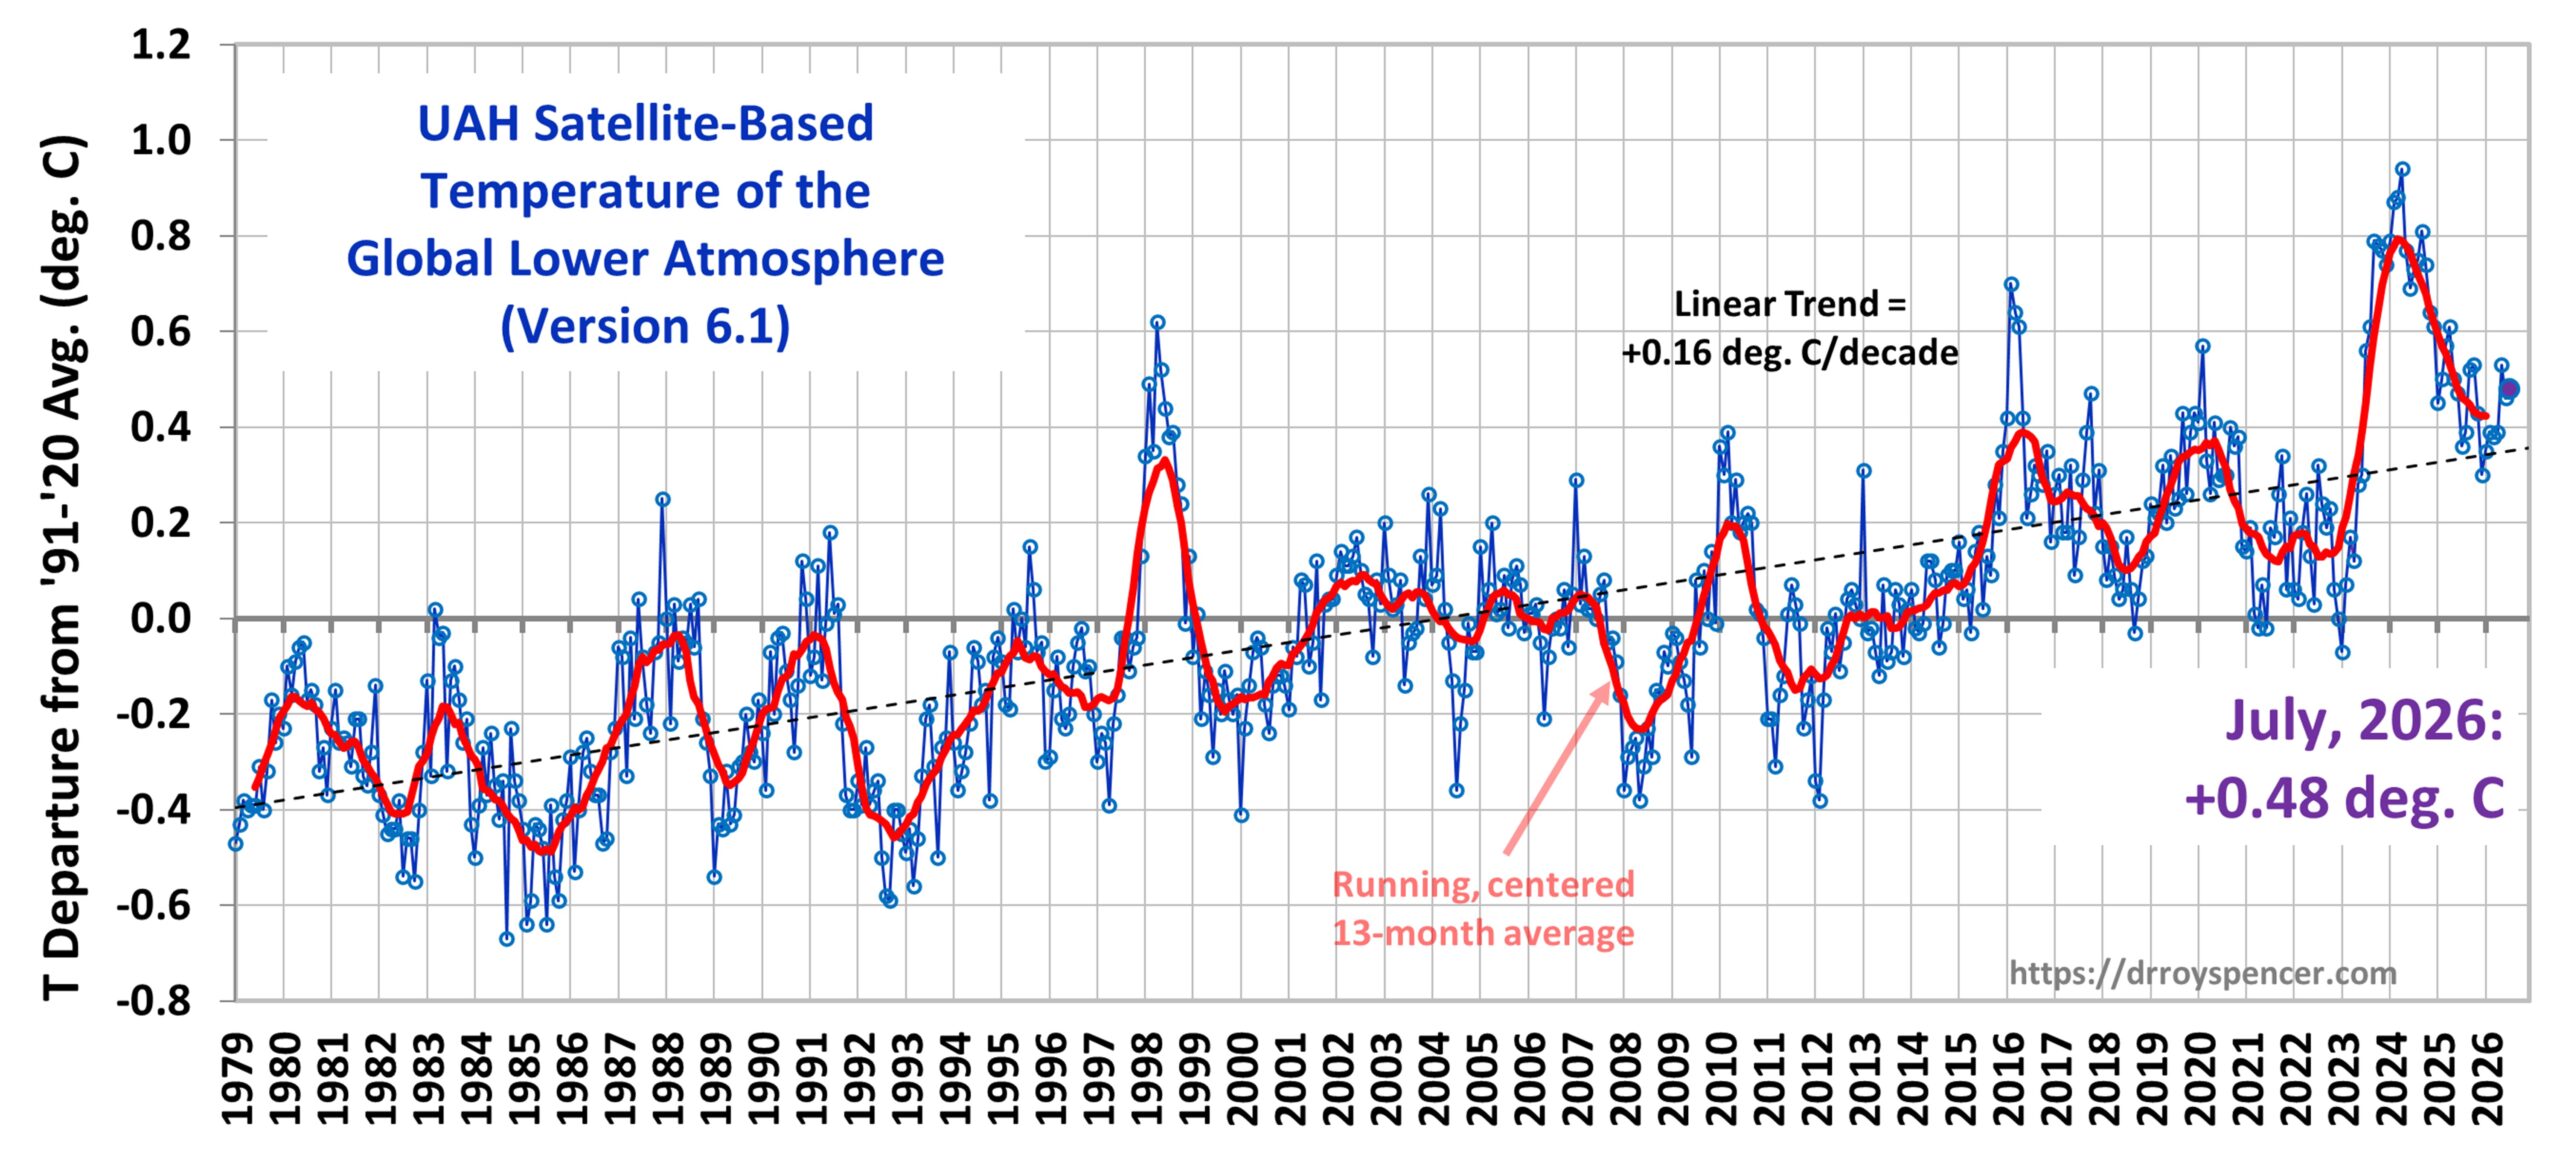
The Version 6.1 global area-averaged linear temperature trend (January 1979 through July 2026) remains at +0.16 deg/ C/decade (+0.22 C/decade over land, +0.13 C/decade over oceans).
The following table lists various regional Version 6.1 LT departures from the 30-year (1991-2020) average for the last 31 months (record highs are in red).
| Year | Mon | Globe | NHem | SHem | Tropic | US48 | Arctic | Aust. | Can. |
| 2024 | Jan | +0.80 | +1.02 | +0.57 | +1.20 | -0.19 | +0.40 | +1.12 | +0.97 |
| 2024 | Feb | +0.88 | +0.94 | +0.81 | +1.16 | +1.31 | +0.85 | +1.16 | +2.45 |
| 2024 | Mar | +0.88 | +0.96 | +0.80 | +1.25 | +0.22 | +1.05 | +1.34 | +1.12 |
| 2024 | Apr | +0.94 | +1.12 | +0.76 | +1.15 | +0.86 | +0.88 | +0.54 | +1.39 |
| 2024 | May | +0.77 | +0.77 | +0.78 | +1.20 | +0.04 | +0.20 | +0.52 | +0.67 |
| 2024 | June | +0.69 | +0.78 | +0.60 | +0.85 | +1.36 | +0.63 | +0.91 | +0.19 |
| 2024 | July | +0.73 | +0.86 | +0.61 | +0.96 | +0.44 | +0.56 | -0.07 | +1.15 |
| 2024 | Aug | +0.75 | +0.81 | +0.69 | +0.74 | +0.40 | +0.88 | +1.75 | +1.36 |
| 2024 | Sep | +0.81 | +1.04 | +0.58 | +0.82 | +1.31 | +1.48 | +0.98 | |
| 2024 | Oct | +0.75 | +0.89 | +0.60 | +0.63 | +1.89 | +0.81 | +1.09 | +0.89 |
| 2024 | Nov | +0.64 | +0.87 | +0.40 | +0.53 | +1.11 | +0.79 | +1.00 | +1.61 |
| 2024 | Dec | +0.61 | +0.75 | +0.47 | +0.52 | +1.41 | +1.12 | +1.54 | +1.65 |
| 2025 | Jan | +0.45 | +0.70 | +0.21 | +0.24 | -1.07 | +0.74 | +0.48 | +1.04 |
| 2025 | Feb | +0.50 | +0.55 | +0.45 | +0.26 | +1.03 | +2.10 | +0.87 | -0.35 |
| 2025 | Mar | +0.57 | +0.73 | +0.41 | +0.40 | +1.24 | +1.23 | +1.20 | +0.80 |
| 2025 | Apr | +0.61 | +0.76 | +0.46 | +0.36 | +0.81 | +0.85 | +1.21 | +0.45 |
| 2025 | May | +0.50 | +0.45 | +0.55 | +0.30 | +0.15 | +0.75 | +0.98 | +0.81 |
| 2025 | June | +0.48 | +0.48 | +0.47 | +0.30 | +0.80 | +0.05 | +0.39 | -0.22 |
| 2025 | July | +0.36 | +0.49 | +0.23 | +0.45 | +0.32 | +0.40 | +0.53 | -0.23 |
| 2025 | Aug | +0.39 | +0.39 | +0.39 | +0.16 | -0.06 | +0.82 | +0.11 | +0.62 |
| 2025 | Sep | +0.53 | +0.56 | +0.49 | +0.35 | +0.38 | +0.77 | +0.30 | +2.44 |
| 2025 | Oct | +0.53 | +0.52 | +0.55 | +0.24 | +1.12 | +1.42 | +1.67 | +2.59 |
| 2025 | Nov | +0.43 | +0.59 | +0.27 | +0.24 | +1.32 | +0.78 | +0.36 | +1.47 |
| 2025 | Dec | +0.30 | +0.45 | +0.15 | +0.19 | +2.10 | +0.32 | +0.37 | -1.86 |
| 2026 | Jan | +0.35 | +0.51 | +0.19 | +0.09 | +0.30 | +1.40 | +0.95 | +1.17 |
| 2026 | Feb | +0.39 | +0.54 | +0.23 | +0.03 | +1.91 | -0.48 | +0.73 | +0.32 |
| 2026 | Mar | +0.38 | +0.33 | +0.42 | +0.07 | +3.74 | -0.48 | +1.14 | -3.17 |
| 2026 | Apr | +0.39 | +0.43 | +0.34 | +0.23 | +1.20 | +0.30 | +0.70 | -0.89 |
| 2026 | May | +0.53 | +0.46 | +0.60 | +0.58 | +0.21 | +0.34 | +0.10 | +0.21 |
| 2026 | June | +0.46 | +0.54 | +0.38 | +0.57 | +0.64 | +1.01 | +0.38 | +0.99 |
| 2026 | July | +0.48 | +0.68 | +0.27 | +0.85 | +1.14 | +0.53 | -0.22 | +0.78 |
| Year | Mon | Globe | NHem | SHem | Tropic | US48 | Arctic | Aust. | Can. |
Time Series Plots for USA48, Canada, and Australia
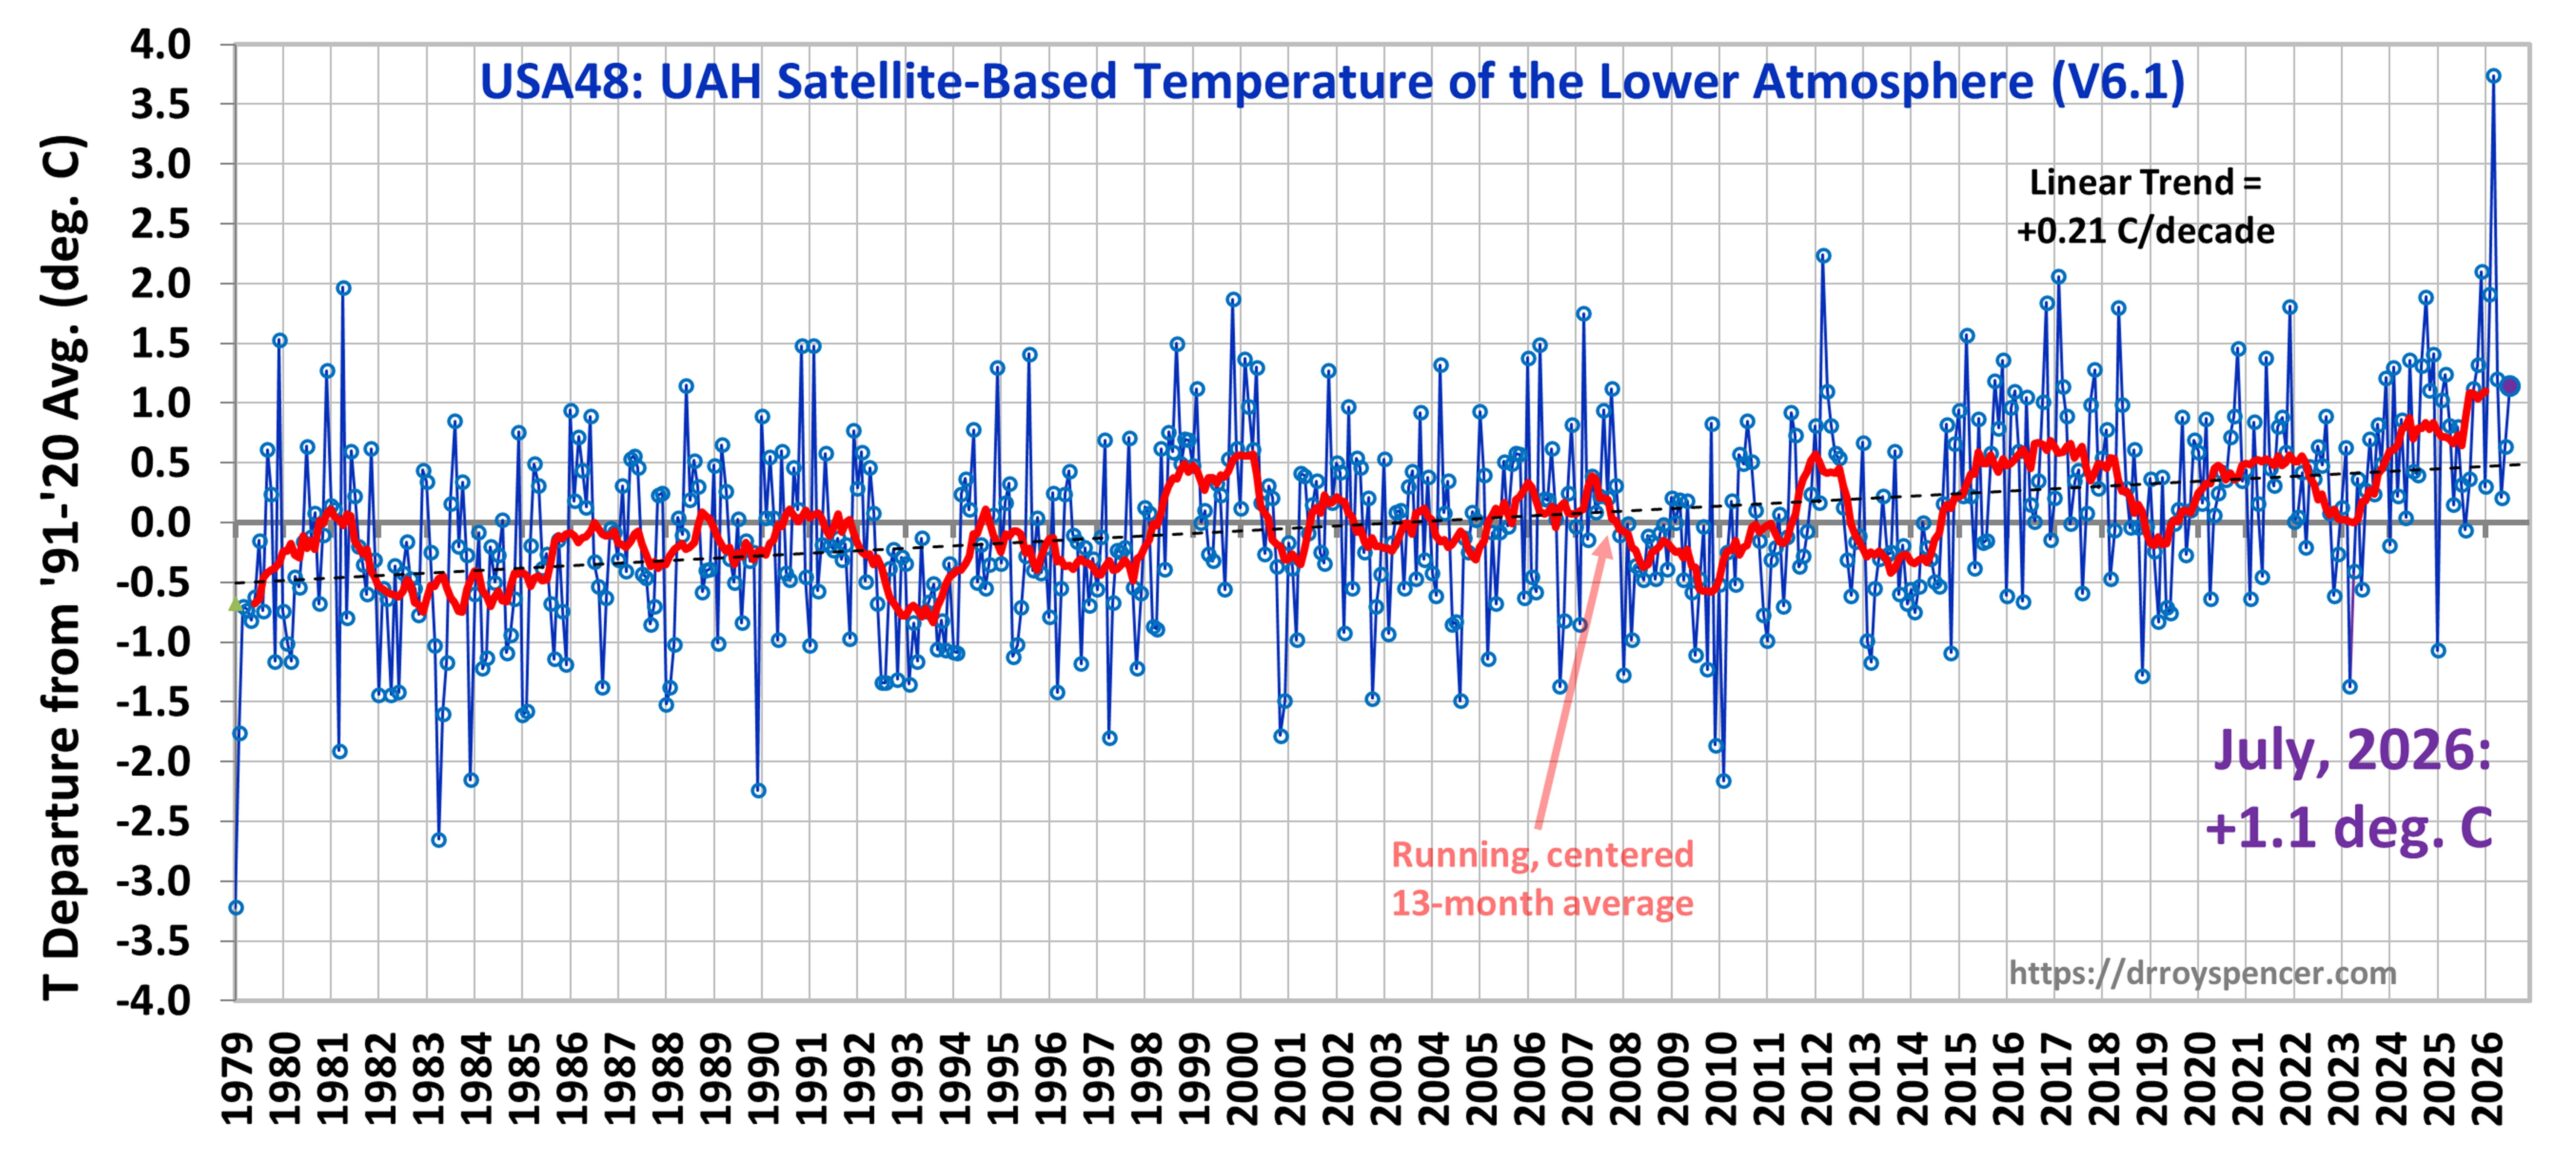
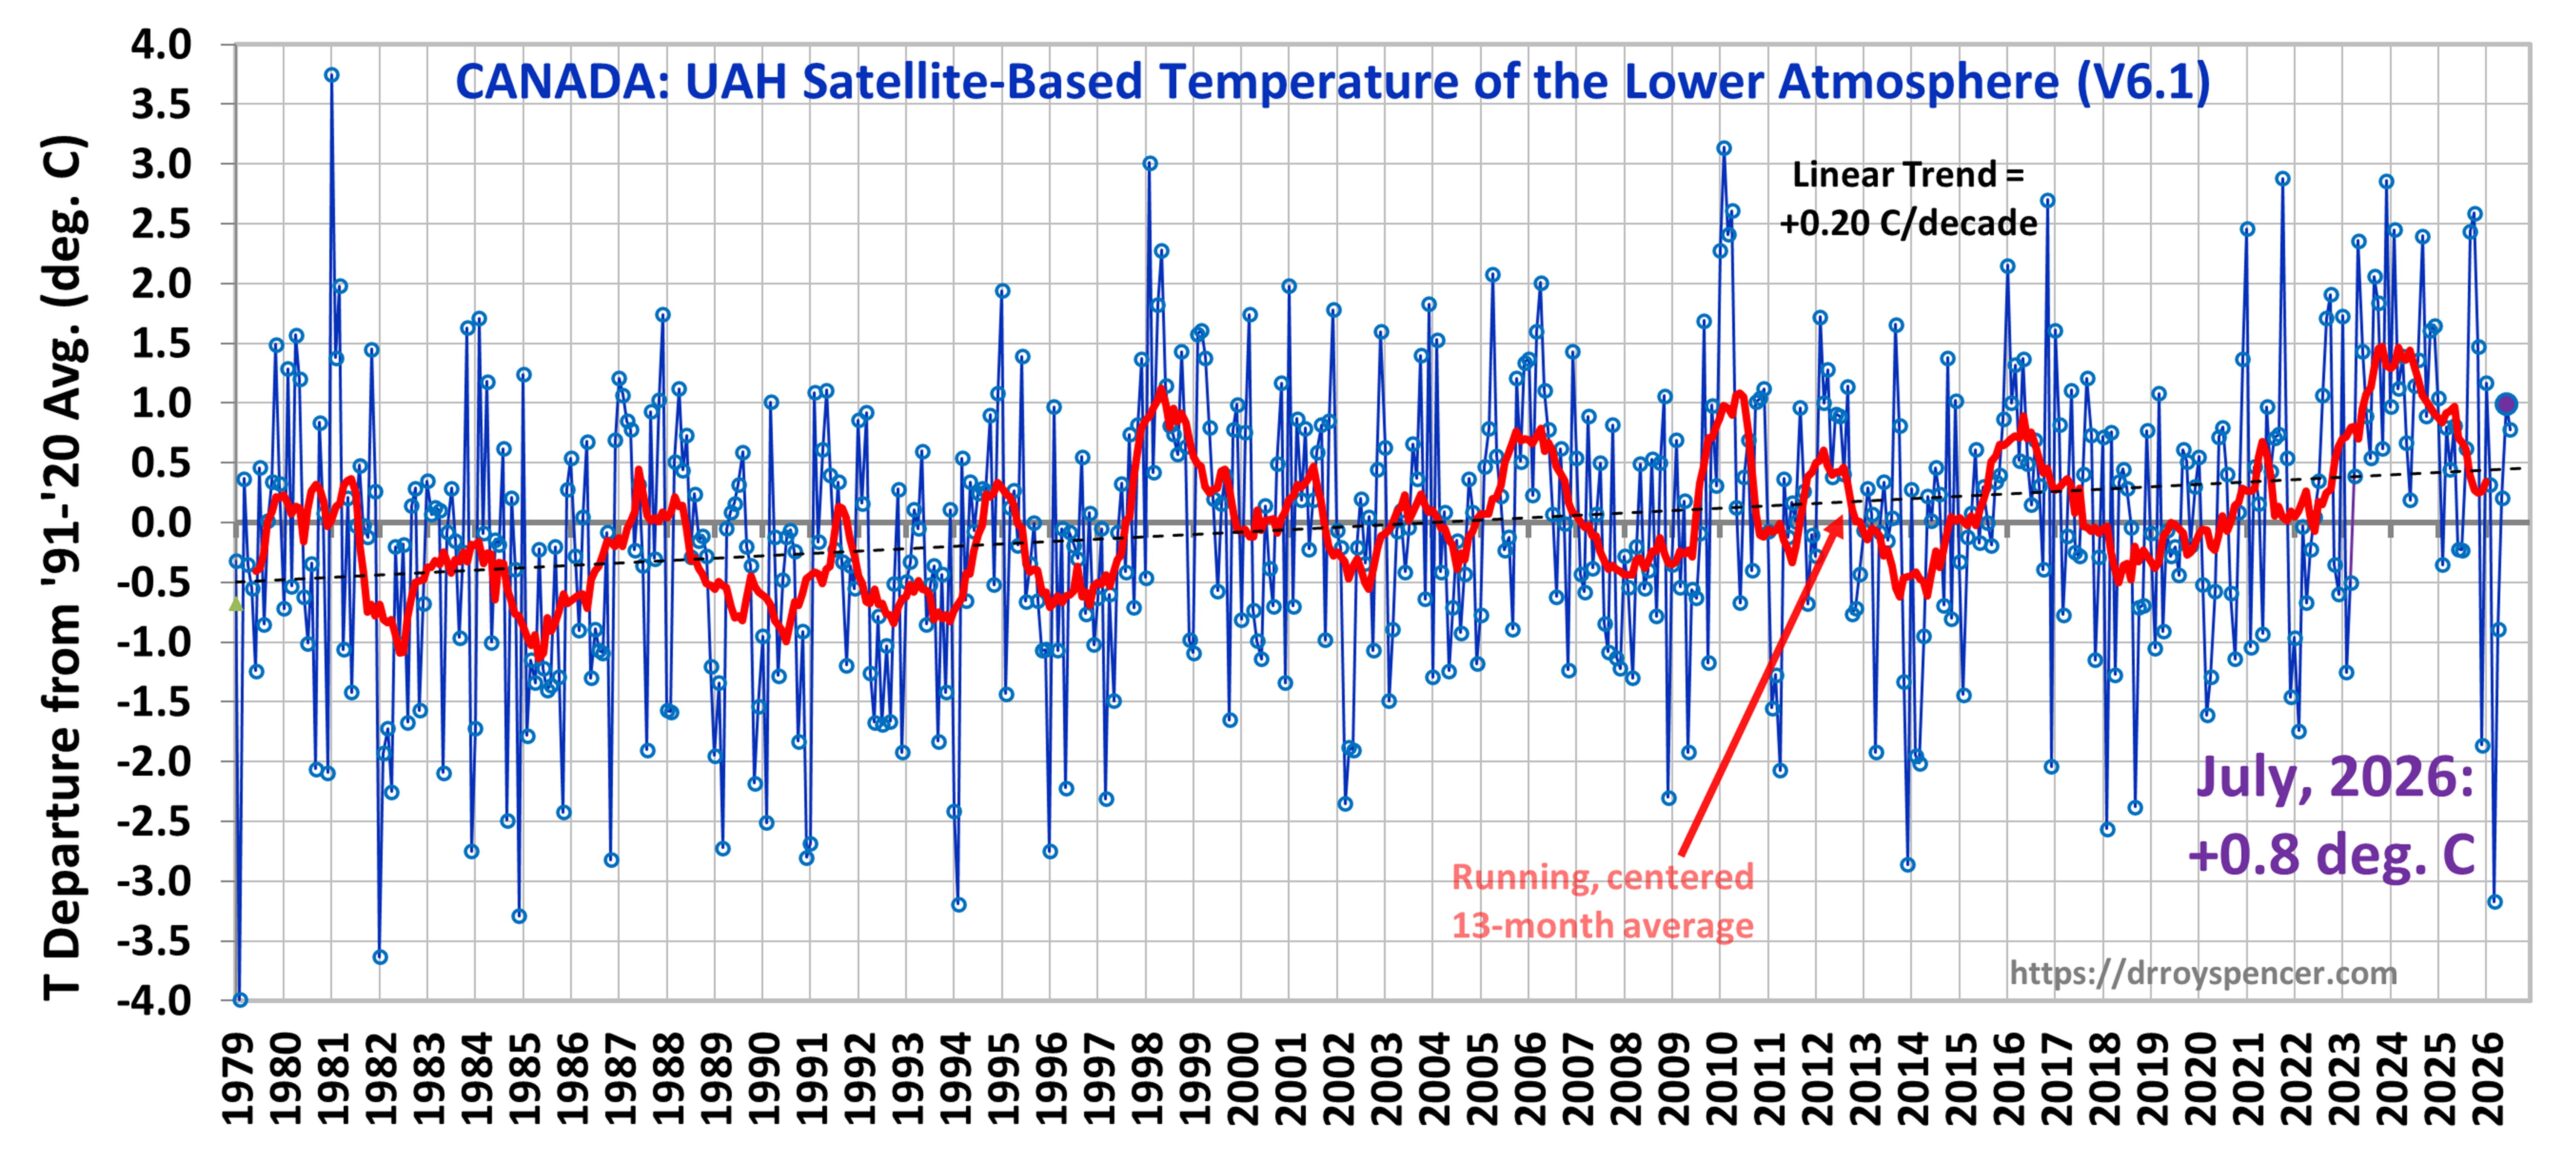
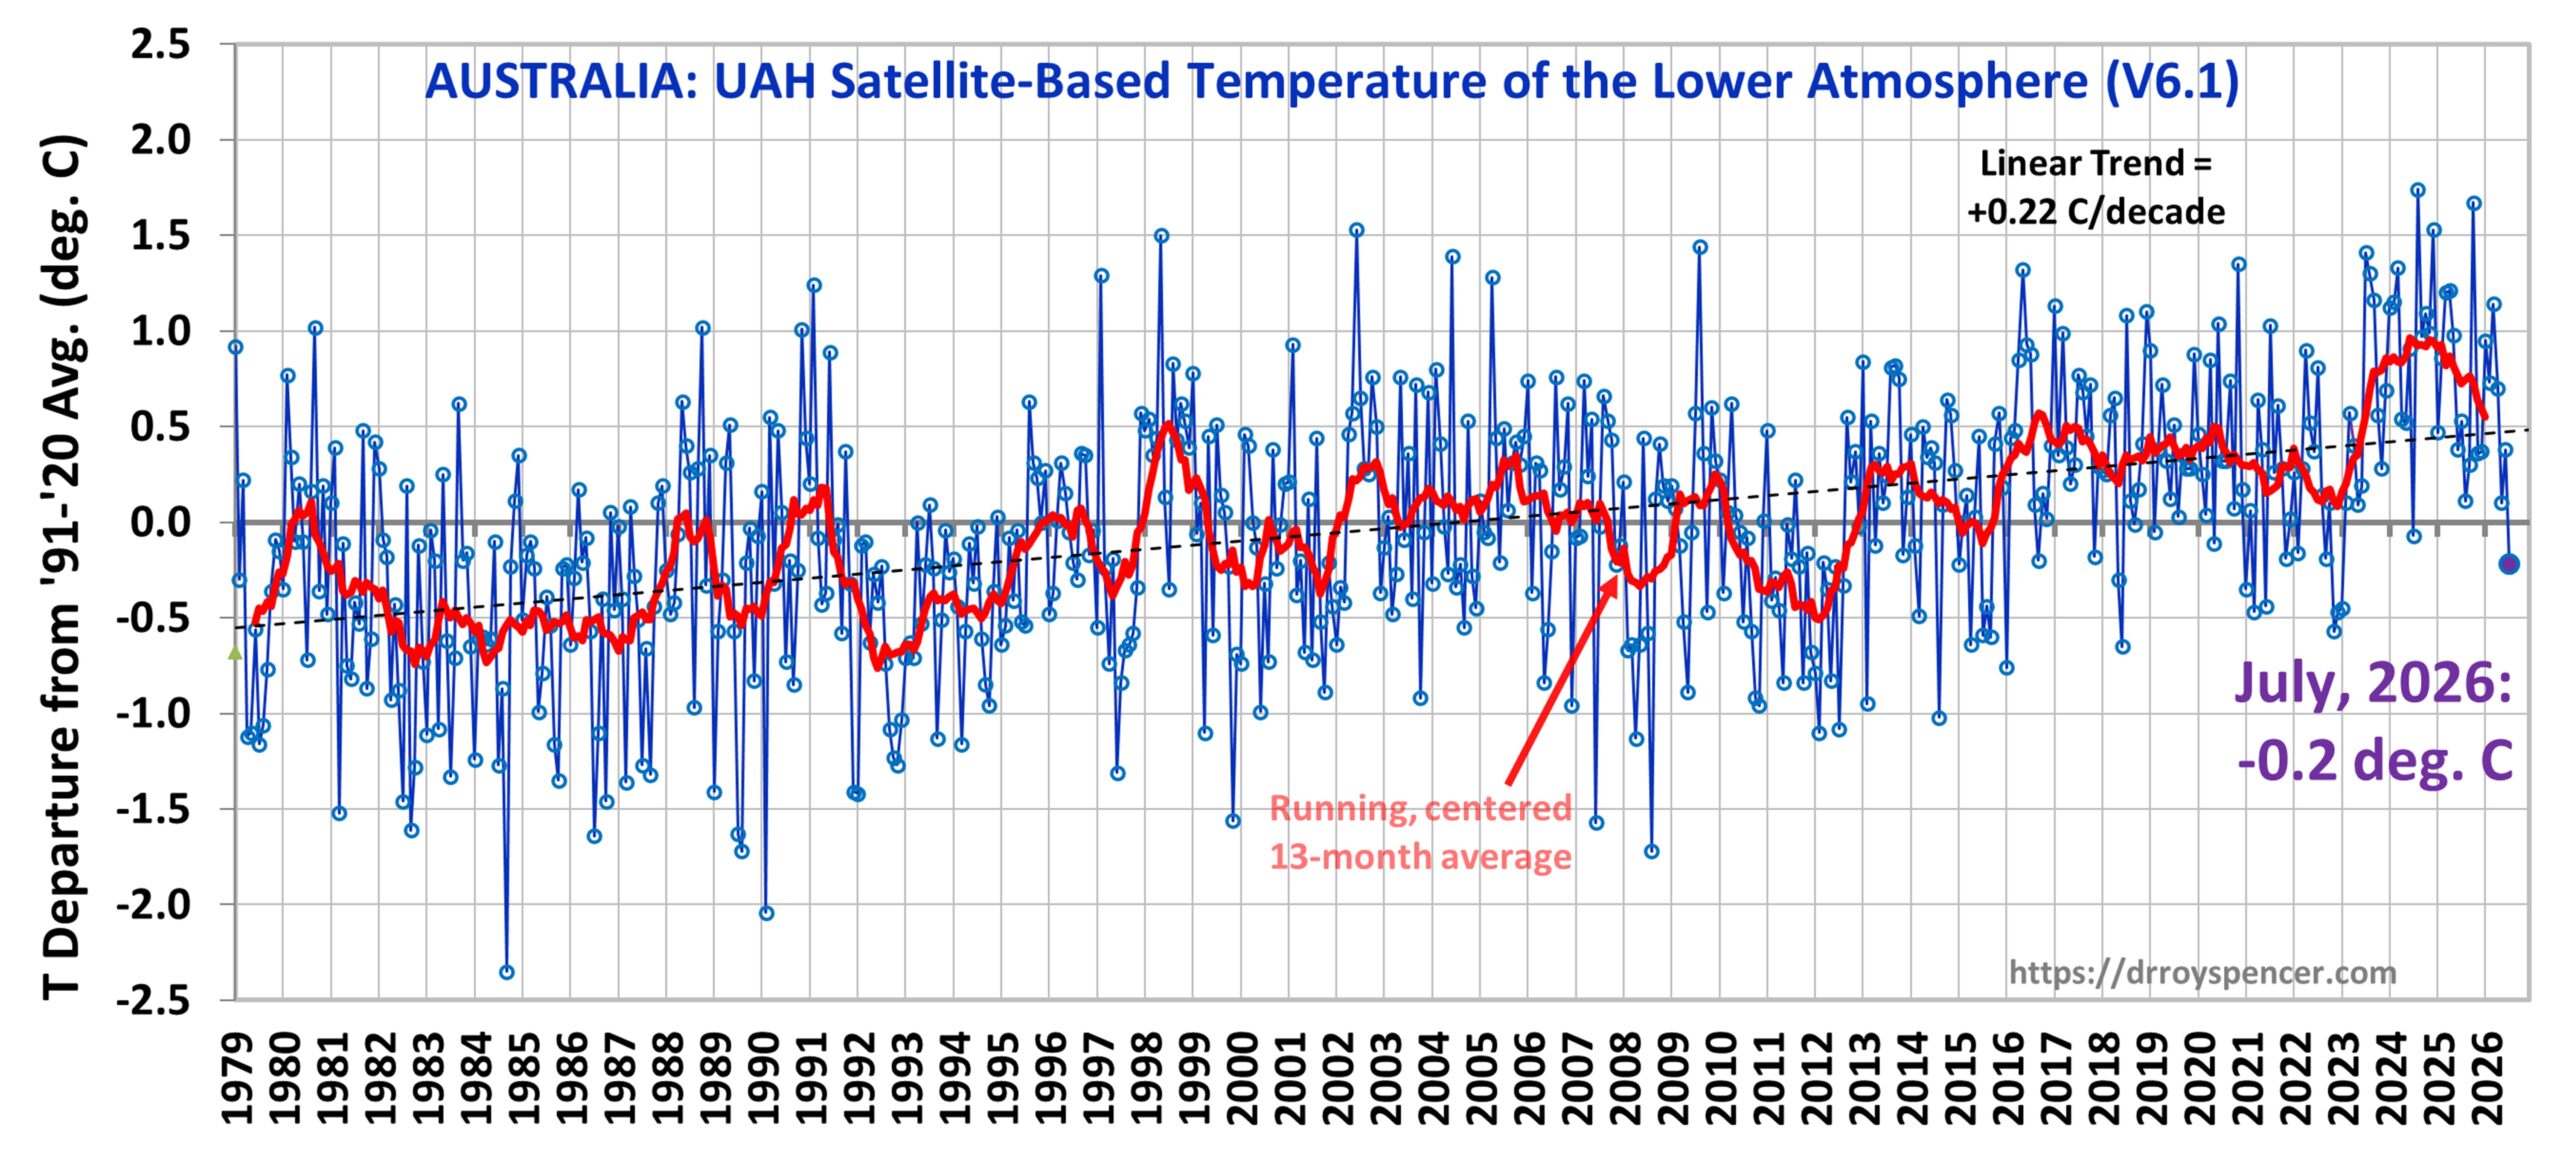
The full UAH Global Temperature Report, along with the LT global gridpoint anomaly map for July, 2026 and a more detailed analysis by John Christy, should be available within the next several days here. John officially retired on July 1, 2026, but will continue working as a part-time employee of UAH.
The monthly anomalies for various regions for the four deep layers we monitor from satellites will be available in the next several days at the following locations:

+1.14C is a new warmest July record for US48. Beats the previous July record (2011, +0.92C) by over +0.2C.
Year-to-date (Jan-Jul), US48 average is +1.3C; a fair bit ahead of the next warmest Jan-Jul period (+0.9, 2012).
Tropics up too, maybe showing first signs of El Nino?
I have recently been trying to learn more about oscillations other than ENSO. Can someone comment on where we are on other oscillations…AMO, PDO, etc? Whether you are a climate action advocate or a skeptic they are obviously important. We are in an interglacial warming period (perhaps closing in on the end of one) and likely near the end of a 40 year AMO. But that’s sort of just the beginning for various oscillations of temperature, isn’t it? I would love to read a thoughtful discussion of this. For example, what is the effect when several of these are in phase at the same time? I just got a recently published Oceanography text and was disappointed that it only addressed ENSO.
Thomas, you are on the right track. See
https://ocean.dmi.dk/arctic/plus80n/daily/daily_ts_2026.png
This is showing record cold summer temperatures in the high Arctic. IMO, the is being driven by a natural cycle of Arctic sea ice. The affects of this cycle are what drives the AMO index. This is often referred to as a 60 year cycle although it tends to vary between 60-80 years. Right now the warm phase of this cycle is in control and has been since the mid 1990s.
If I am right, we should see an increase in the Arctic summer sea ice minimum this year and in the future. This increasing sea ice extent will continue and eventually expand out into the North Atlantic. This is exactly what happened in the early 1960s which led to the global cooling scare of that period.
This cycle appears to be affected by the PDO. When the PDO is negative and this Arctic sea ice cycle is in its cool phase. That leads to cooling. When both are in their warm/positive phases, you get warming.
If the PDO remains negative and this phase change continues we can expect a lot of cooling following the current El Nino.
I agree—take a look at the Western Arctic.
https://i.ibb.co/FbG7Lf6w/r02-Chukchi-Sea-ts-4km.png
I had July even warmer, at 0.53C. That was based on an angry ENSO, and all the high temperatures in NH. We’ll see anomalies that high, and higher, in the next few months. This ENSO means business….
Clint, I suspect some of the El Nino warming has been countered by the Atlantic Nina and the high Arctic cooling. The El Nino will win out over time, but might not be as strong as it might have been.
Yes, I believe you are correct.
More relevant data about Arctic above 80 N from the Danish DMI
Poster Palmowski has shown this useless picture last month already:
https://ocean.dmi.dk/arctic/plus80n/daily/daily_ts_2026.png
I replied to this on July 8, 2026 at 3:35 PM:
https://www.drroyspencer.com/2026/07/uah-v6-1-global-temperature-update-for-june-2026-0-46-deg-c/#comment-1748297
*
It is complete nonsense to look all the time at the summer temperatures at a latitude like 80 N, as they for simple reasons never change.
*
1. Monthly series of absolute data
https://drive.google.com/file/d/1GwYOyCfKK9vzBW8R2tNieuiLZLcxCYnc/view
Already here you easily can see that the summer temperaturesw did not change sonce 1958: they never move far from +- 0.0 °C.
2. Seasonal split DJF versus JJA
https://drive.google.com/file/d/1gwa8bpETqbw179pcQacl7AVzAKhH6X3p/view
Here it becomse ven more evident that all warming happens outside the summers.
Seasonal trends for 1958/59 till 2025/26, in °C / decade
Jun/Jul/Aug: -0.04 ± 0.02
Dec/Jan/Feb: +1.20 ± 0.13
*
During Arctic summers, the Sun just has enough power to partly melt ice and snow but doesn’t manage to additionally warm the ambient air – despite shining 24h a day.
Thus, as long as there is ice to melt, ambient temperature won’t move much about 0 °C.
This is the reason why the average summer temperature did not increase since 1958.
No oscillation here… only a constant increase in winter temperatures, oh so moderate: 1 °C per decade. That’s nothing, move along.
*
DMI Data source
https://download.dmi.dk/pub/plus80N_temperatureindex/
**
Now, about:
” If I am right, we should see an increase in the Arctic summer sea ice minimum this year and in the future. ”
Maybe! The Sep/Oct/Nov increase happened after all last year already, even before Richard M mentioned it:
https://drive.google.com/file/d/1cL57UakZj8Hqw7QAv2c6XSqto6iHH5Sv/view
*
” This increasing sea ice extent will continue and eventually expand out into the North Atlantic. ”
Wow. That’s a courageous, audacious forecast, isn’t it?
https://drive.google.com/file/d/1il2mz5XU13p0YjV_8CZUVjevmRZv1GOP/view
Wait and see :–)
**
” I suspect some of the El Nino warming has been countered by the Atlantic Nina and the high Arctic cooling. ”
High Arctic cooling? Show it us please.
See point (1) above.
Poor Bindi is in a bind. He’s now forced to pre-deny events that haven’t happened yet and ignore simple facts like the high Arctic summer is the coldest on record. Just think what it will be like after the biggest cause of recent warming, the 60 year cycle, moves further into its new cool phase.
How will it explain increases in Arctic sea ice almost every year?
How will it explain global temperature anomalies falling almost every year?
How will it explain the billions wasted on fake science?
Richard,
This “the biggest cause of recent warming, the 60 year cycle, moves further into its new cool phase.” is just not supportable by the facts.
Here we see the supposed 60 y AMO cycle in green, which operates in the North Atlantic. It is scaled to fit the detrended N. Hemisphere temperature, in red.
We also see the raw N. hemisphere temperature (no detrending) in blue (up to 2020). The further rapid increase 2020-2026 is unavailable at this site.
It should be obvious to all that the 60 y cycle amplitude is much smaller than the observed N. Hemisphere warming trend. And it has even less influence on the S. hemisphere.
https://www.woodfortrees.org/plot/hadcrut4nh/mean:60/offset:0.38/from:1880/to:2000/detrend:0.65/plot/esrl-amo/mean:60/scale:0.65/from:1880/to:2020/plot/hadcrut4nh/mean:60/offset:0.38/from:1880
So it makes no sense for you to keep asserting that the 60 y cycle is the “biggest cause of recent warming”, when you just don’t have the evidence to support it.
I intentionally avoided to reply immediately to Richard M, and it showed.
Nate did a perfect job.
Nate’s graph is similar to what I posted many times for years in reply to Richrd M, based on a comparison of the two AMO variants – detrended vs. original (curiously named ‘undetrended’):
https://drive.google.com/file/d/1Rli_V3tzq9lFsxZY4YdDCafOt4mVLNJl/view
All the time, Richard M dismissed this evidence.
*
Even today, he fails to grasp — or actually better: refuses to acknowledge — that the detrended AMO is and remains a fictitious construct devised solely to isolate its cyclical core.
For at least a decade, he has been pestering us almost monthly with his 60-year cycle which seems to be increasingly out of touch with reality.
**
I now move to the reply he definitely deserves.
He writes above:
” … and ignore simple facts like the high Arctic summer is the coldest on record. ”
*
On August 4, 2026 at 5:53 PM, I posted a graph with this text:
” 2. Seasonal split DJF versus JJA”
Who saw this graph immediately understood that I displayed summer data together with winter data, and that the summer data was flat just because the winter data had increased incredibly during the same period!
Here are the temperature graphs with winter and summer data displayed separately:
Winter
https://drive.google.com/file/d/1Ms21aJIwMsqC11q7-GXtDaCwhfDkJofq/view
Summer
https://drive.google.com/file/d/1jRoXSnGdbHeMWan6n21FmOWEsm4Tywfg/view
*
How is it possible to stubbornly scrutinize with a strong magnifying glass the slight trend of -0.4°C per decade during the summer months, together with an indeed unusual drop this year, while simultaneously dissimulating the massive trend of +1.2°C per decade during the winter months?
Incredible.
**
Then he writes, as would he live on another planet:
– ” How will it explain increases in Arctic sea ice almost every year? ”
https://drive.google.com/file/d/1Bd4DlbcGDVPF8xOjkugJK-r39_B2apaP/view
*
” How will it explain global temperature anomalies falling almost every year? ”
https://drive.google.com/file/d/1VMNui_SggO_B4xlTups5smR581QAA-OD/view
*
Who behaves so dishonest, opinionated and ignorant better should refrain from speaking about ‘fake’ science.
Relative to the older 1979–1998 baseline (one of Dr. Spencer’s former reference periods: https://www.drroyspencer.com/2010/01/december-2009-uah-global-temperature-update-0-28-deg-c/), the July 2026 anomaly is +0.67°C.
https://drive.google.com/file/d/1vhvmO4Q4ae60h67HU6ennKTIFRByOT5q/view?usp=sharing
I’ve started keeping track of that too. Thanks!
Always a chance for a mea culpa from co2-forcing denialists on here. You can always just admit you were wrong, and that you were swayed by ego and right wing media. But I wont hold my breath waiting.
Jesse,
There are many natural and man made reasons why the climate is changing. Pinning your hopes on it just being CO2 is being a science denialist. Why not be honest and say that you are anti freedom, anti individualist, and anti freedom market.
Think with your swipe at the right wing suggests that you think a trans-women are women.
Pretty sure everyone knows climate can change naturally — that’s hardly a groundbreaking revelation.
The leap skeptics make is conflating the fact that “climate change can occur naturally” with the entirely different claim that “today’s climate change is being caused by natural factors.”
They hand wave toward the AMO and PDO while ignoring the actual data. The PDO is currently in a negative phase, and the AMO has shown little overall change since 2005. As a result, these factors cannot explain the magnitude or pattern of contemporary global warming.
Here is the AMO time series:
https://postimg.cc/XXFq1wXY
(This is the detrended version of the North Atlantic sea surface temperatures).
The underlying data can be downloaded here:
https://psl.noaa.gov/data/timeseries/AMO/
Yet another 3rd warmest month this year.
Ten warmest anomalies for July
2024 0.73
2023 0.56
2026 0.48
1998 0.38
2025 0.36
2022 0.32
2020 0.30
2016 0.26
2019 0.23
2010 0.20
It’s noticeable how much of an outlier 1998 is for the last century. Next warmest 20th century July is 1988 in 20th place with an anomaly of +0.03.
“Yet another 3rd warmest month this year.”
That’s my mind playing tricks. It seemed that so far every month had been around 3rd warmest, but in fact it’s only been June and July.
Current rankings are
Jan 6th
Feb 6th
Mar 5th
Apr 5th
May 2nd
Jun 3rd
Jul 3rd
The media reports that Europe is the fastest warming area on the globe. Would it be possible to confirm or falsify that by doing a Time Series Plot, similar to USA48, Canada, and Australia?
Thanks to you and John for some many years of providing this data. And may John have a wonderful retirement! Is he still running?
It certainly seems that Europe, especially central Europe has been warming faster than most areas in the summer. Here’s my own analysis of trends for the month of June. The 20 fastest warming countries are
1 Austria +0.61 ± 0.20 °C / decade
2 Slovenia +0.60 ± 0.20 °C / decade
3 Luxembourg +0.59 ± 0.21 °C / decade
4 Switzerland +0.59 ± 0.20 °C / decade
5 Czechia +0.59 ± 0.20 °C / decade
6 Germany +0.56 ± 0.20 °C / decade
7 Croatia +0.56 ± 0.20 °C / decade
8 Slovakia +0.55 ± 0.19 °C / decade
9 Hungary +0.55 ± 0.19 °C / decade
10 Belgium +0.53 ± 0.22 °C / decade
11 Bosnia and Herz. +0.50 ± 0.20 °C / decade
12 Serbia +0.48 ± 0.20 °C / decade
13 Netherlands +0.48 ± 0.22 °C / decade
14 Poland +0.47 ± 0.20 °C / decade
15 Romania +0.47 ± 0.18 °C / decade
16 Moldova +0.46 ± 0.19 °C / decade
17 Montenegro +0.46 ± 0.21 °C / decade
18 Italy +0.46 ± 0.19 °C / decade
19 France +0.44 ± 0.17 °C / decade
20 Ukraine +0.41 ± 0.21 °C / decade
Note, this is based on the UAH gridded data, but the division into countries is entirely my own work. There’s probably a lot of room for improvement.
Here’s the trend by continent for all months up to June 2026. (I’ve included Russia on its own as I don;t have a mapping that divides it by continent).
Europe +0.28 ± 0.05 °C / decade
Russia +0.26 ± 0.05 °C / decade
Asia +0.25 ± 0.03 °C / decade
North America +0.22 ± 0.04 °C / decade
Oceania +0.21 ± 0.03 °C / decade
Africa +0.20 ± 0.02 °C / decade
South America +0.20 ± 0.02 °C / decade
Antarctica +0.11 ± 0.06 °C / decade
And here’s the trends for Northern Hemisphere summers (Jun – Aug) up to 2025.
Europe +0.33 ± 0.08 °C / decade
Oceania +0.28 ± 0.08 °C / decade
South America +0.25 ± 0.06 °C / decade
Russia +0.25 ± 0.08 °C / decade
Africa +0.21 ± 0.05 °C / decade
North America +0.19 ± 0.07 °C / decade
Asia +0.14 ± 0.05 °C / decade
Antarctica +0.00 ± 0.21 °C / decade
I calculate the new Monckton Pause at 38 months (3years, 2 months). Would that be right?
Skeptikal, no offense, but you’re an idiot.
“No offense, but you’re an idiot.”
What does that mean?
If you say “no offense” first, then that negates the offense?
I would like to retract what I said and apologize for it.
Skeptikal’s interest in the Monckton Pause doesn’t necessarily mean he endorses it.
bdgwx keeps track of it as well, but his interest is in examining the idea, not endorsing it. Skeptikal may be doing the same, so I was premature in my earlier comment.
That said, Stephen, do you really think a period of just 3 years and 2 months constitutes a meaningful climate trend?
Eldrosion, trying to be superior and failing yet again
It looks like he was asking others’ opinions if this is part of the step change after 2015 or have there been two step changes since 2015.
I suspect the reason no one has resurrected “the pause” discussion recently is because they know this upcoming El Nino will probably kill it in its infancy.
However, they may be able to stretch a few more years’ ‘pause’ out of this El Nino, if it’s as big as they say.
It’s just a matter of starting your trend at the most recent peak, which is usually the month closest to the last big El Nino peak. As we have seen in the past, a really big El Nino can yield a decade or more of misleading “pause” claims, for those desperate to manufacture one.
[“kill it in its infancy.”]
It’s not like the previous periods analyzed were very long to begin with:
https://wattsupwiththat.com/2021/01/14/a-new-pause/
According to the 95% confidence interval for the trend over the period discussed in this blog post, the underlying slope is not well constrained; the estimated range extends from approximately -2.7°C/century to +2.1°C/century.
And that is not even accounting for the fact that ENSO persistence means the data points aren’t completely independent from one another.
Skeptics can be a little silly at times.
Bellman, as always, schooling the swivel-eyed Monckey and the rest of the deniers.
https://wattsupwiththat.com/2021/01/14/a-new-pause/#comment-3162991
Aug. 2025–Jul. 2026 averaged +0.64°C, making it the 2nd warmest La Niña period on record.
Major El Niño developing.
Earth’s albedo continues to decline.
Yet deniers continue to focus on short 3 year windows.
What about looking at a longer timeframe? From June 2008 to the present, the trend is +3.4°C/century.
Eldrosion,
Finally you stumbled onto some truth and haven’t distorted it into something cult nonsense.
“Earth’s albedo continues to decline.”
Now being a sport and work out how much the earth has warmed due to the change in albedo. Unlike your usual gaslighting that it’s all CO2 aka capitalism, rather than changes in albedo, earth orbit, solar orbits, solar output and clearer atmosphere due to less pollution.
This is why those who follow the science and have no fear of the lefts cancel culture doubt the excessive claims of people like you on the left who don’t follow the science and believe men can become women.
Q-Anon, trying to be superior and failing yet again.
Anon for a reason
“Unlike your usual gaslighting that it’s all CO2 aka capitalism, rather than changes in albedo, earth orbit, solar orbits, solar output and clearer atmosphere due to less pollution.”
You are treating albedo as though it is an independent driver of the recent warming.
The observed albedo change is not independent at all. The cryosphere is shrinking, exposing darker land and ocean surfaces that absorb more sunlight.
The question then becomes: Why is the cryosphere shrinking? GHG-driven warming.
As for cleaner air, that is NOT a controversial point.
Plenty of climate scientists have discussed the reduction in sulfate aerosols as contributing to recent warming:
https://www.tandfonline.com/doi/full/10.1080/00139157.2025.2434494#abstract
Nobody well-informed claims that recent warming is “all and only CO2.” The mainstream view has always been that multiple forcings and feedbacks operate simultaneously, with CO2 and other GHGs being the dominant long term forcing.
So you are criticizing a position that neither I nor climate scientists actually hold.
And you should REALLY tone down your politics. They make a bad match with science.
You think climate science is liberal because liberals accept it. Maybe the simpler explanation is that liberals are more likely to accept the scientific findings.
Sea surface temperatures again at new record levels.
https://climatereanalyzer.org/clim/sst_daily/?dm_id=world2.
And, as predicted, the El Nino is a record level monster:
https://climatereanalyzer.org/clim/sst_daily/?dm_id=nino3.4
Looks like this will again be another record warm year.
Is 1.6 degrees per 100 years a problem?
Is the warming equivalent of an ice age in three years a problem?
You never disappoint with a stupid answer,
Is a question an answer?
Additionally, the trend could change over time, so another 1.6°C of warming above the current level is not a certainty.
Yes. And a one degree C warming (at Earth’s surface) in 50 years is even worse.
Yes. And a one degree C warming (at Earth’s surface) in 50 years is even worse.
8000bc Northern Europe and the UK experienced a 5c temperature drop in 5;decades.
Was the 8.2-kiloyear event a problem?
Ian Brown,
“8000bc Northern Europe and the UK experienced a 5c temperature drop in 5 decades”
Yes, LOCAL temperature changes can be quite dramatic, taking place over a few years. Changing Earth’s average temperature is something totally different. Ocean current changes, for example caused by melting of enormous ice sheets, can affect LOCAL temperatures. GLOBAL (average) temperature changes are caused by changes of the in/out energy balance, or TEMPORARILY by the oceans’ ability to store and release energy over a few years (El Nino, la Nina, etc.).
In the last 600 million years , only the Carboniferous Period and the Ordovician Period have been as cool as our current Age. The Quaternary.
In the last 600 million years , only the Carboniferous Period and the Ordovician Period have seen temperature as cool as our current Age. The Quaternary.
More and more people are realizing that ocean oscillations are a major part of climate change. The problem is, we just don’t have enough data to arrive at meaningful studies. Due to UAH, we’ve got a good handle on where Earth temperatures are, but not with the oceans. The ARGO float program will help immensely, but it is still in startup mode, with only about 20 years of data in only about one quarter of its fleet. (Final installation will be over 4000 floats.)
Here’s what ChatGPT says about ocean oscillations:
If only we had a “UAH” style group tracking ocean oscillations….
[“Due to UAH, we’ve got a good handle on where Earth temperatures are, but not with the oceans.”]
Actually, lower tropospheric anomalies over ocean grid cells do exist in the UAH dataset.
Here is a plot of what the UAH shows over Northern Hemisphere ocean grid cells:
https://drive.google.com/file/d/1_l8UwbaAqifWfdVsmg6hwS2xoQOIl_2P/view?usp=sharing
Agree with your comment about oscillations. They are very important for Earth’s climate. Some alarmists do tend to overlook the role of natural oscillations.
I believe he was referring to deep-layer ocean, not atmosphere.
Clint
I knew there were a few ocean systems didn’t know it was quite that many. Thanks for that
Re: ocean circulation and other oscillations
Someone must have done a meta study on oscillations, as spotty as the data may be. Maybe a dissertation? If not, it is a shame. It’s not as if we (industrialized nations) have not been spending a lot of money on climate research/earth science.
Appreciate a citation if anyone finds one on this topic.
Here is one regarding specifically the Pacific Decadal Oscillation (PDO):
https://www.nature.com/articles/s41558-024-02088-x
It is paywalled, but the authors explicitly analyze the PDO.
During a negative PDO, the eastern North Pacific tends to cool while the western North Pacific tends to warm.
However, the observed warming is basin-wide, with strong warming in both the eastern and western North Pacific.
As a result, they conclude that the PDO cannot be the primary explanation for the recent warming.
Instead, the authors argue that the warming is being driven by reduced vertical mixing caused by increased upper-ocean stratification. The resulting shallower mixed layer means the same amount of heat warms less water, amplifying sea surface temperatures.
If the PDO cannot account for the observed basin-wide warming in the North Pacific, it seems unlikely that it could account for the broader global warming trend.
Kynqora – PDO is one of 8-12 ocean circulations that are being tracked (see Clint R above) and apparently several more that are not routinely monitored. It would be very interesting, if it were possible, to track their cumulative effect, especially the ones that have a stronger influence on atmospheric temperature. What happens when these are in phase? Then throw in ocean floor volcanism, especially mid ocean rise volcanism, happening on every ocean floor, the basis for plate tectonics. Many of these may be insignificant by themselves, but collectively? If ENSO is so important to global temperature fluctuations over short periods, why wouldn’t it be possible that the net effect of these oscillations could be significant for global temperatures. When I win the lottery I may fund this research.
That’s fair. Those are definitely some interesting questions to think about, especially how all these different factors might interact and influence global temperatures collectively.
It seems that we are at an inflection point in the data. The 13-month average has turned flat. With the current El Nino condition that is forecast to get stronger, it would be very unusual if we do not see a warming period in the data.
We will soon see various people on TV and here on this site who will claim victory — we predicted this. That could be followed by the next statement of victory that we must take action now to stop the worst effects of climate change. The supporting data will be the fact that “we have passed 1.5 C”, or maybe even the dreaded 2 C, when really horrible things will result.
The problem with all of these claims and projections is that growth in CO2 emissions will continue to come from the developing world, not the developed world. For many of those people, it is not a political game, it is survival. The notion that “we must do our part” sounds convincing, but only if doing out part is done rationally. Panic is usually not a good place to start.
Every step of the “new green deal” has problems. Electric energy production, storage, and distribution using renewable resources is a very difficult problem to solve. The fist problem is production capacity. The various components take time and money to produce.
If human carbon emissions double, they will only be 10% of the total. The Green New Deal’s only goal is a means for leftists to control capitalism. It is Marxist extremism cloaked in altruism. (Mamdani) Property rights don’t matter, majority tyranny rules.
Stephen, “If human carbon emissions double, they will only be 10% of the total.”
Eh? Human carbon emissions are positive. Natural carbon emissions are negative, as natural CO2 sinks are larger than natural sources. in other words, the CO2 increase (which is currently hundreds of times faster than in the past) is entirely man-made. You didn’t know this?
Gadden – Can you explain your comment about natural CO2 sinks a bit further? I am not questioning it (or accepting it) on a scientific basis, since I am not a scientist. But if that is true, then we should have a fairly long term record of falling CO2.
In very long time frames (not our direct interest today) CO2 was much higher. Falling (cooling levels) of CO2 actually helped moderate earths temperature, since solar intensity was increasing. But life at all scales, fauna and flora, thrived at considerably higher (1-5F higher) temps and CO2. The Cambrian and several other “explosions” of life (and new life forms) occurred under those conditions. Lower CO2 and corresponding lower temps are not good for life, especially large animals and man.
The “greening of the earth” seems to be an unintended, beneficial consequence of fossil fuel burning. All that green is adding to the sink in plant/algae growth (and I assume soil), removing CO2 and giving us oxygen to breathe.
Gadden,
Not according to the IPCC. Human emissions are about 5ppmv annually and natural emissions are 100ppmv annually. That number you cite is net emissions. The claim is natural emissions just recycle and the only emissions are human. That claim assumes a human CO2 and a natural CO2 are seen differently by nature. If you look at the math your claim (not you specifically) is impossible.
> Not according to the IPCC.
Gadden was referring to the forcing:
https://www.carbonbrief.org/analysis-why-scientists-think-100-of-global-warming-is-due-to-humans
This addresses both “but there were historical times with more CO2” (which forgets we had a tropical Antarctica), and “but the human contribution is tiny” (which omits that natural sinks are net negative).
“Gadden was referring to the forcing:”
He was replying to my comment which had nothing to do with forcing and there isn’t any CO2 forcing anyway.
There’s something about “human carbon emissions are positive. Natural carbon emissions are negative” that seems to be escaping troglodytes. Too much Newscorp in their information diet?
Tinkerbells go off topic and stay off topic. It’s called use deflective propaganda when the math isn’t on your side.
I think Tinkerbell is the second lady in checkered pink top.
https://www.youtube.com/watch?v=WXuDwfQTkKc
Troglodyte’s friend likes em “on the young side”, as would say Donald:
https://www.npr.org/2026/08/03/nx-s1-5918341/chuck-edwards-ethics-report
That gives a whole new meaning to “prayer and reflection.”
Besides, Troglodyte’s squirrel has very little to do with our Ivy Leaguer’s usual “but prediction” rant. It’s just Edwin’s crap all over again, which is a variation on “but trace gas”.
And of course Gadden’s point refutes it: Edwin has been told a thousand times.
All emissions are positive with respect to adding CO2 to the atmosphere. Isn’t that rather tautological? The opposite of emission is absortion which occurs when CO2 is absorbed by land and ocean sinks. People who believe humans are responsible for the total increase in CO2 (the H1 hypothesis) should read the works of Hermann Harde, Murray Salby, and others. See https://edberry.com/co2coalition/ section 1.4 on page 6 for a list of “Papers that show H(1) is false.”
Tinkerbell,
Peter is calling you back to Never Never Land.
Troglodyte might appreciate ICE has spent more than $2B to purchase four private prisons from CoreCivic, who keeps the contracts to run these places.
Is this…socialism?
It certainly is amusing, but not in any way informative to observe stephen p anderson and Willard debate who knows the least about science in general and CO2 concentrations specifically.
Depending on location in the world, CO2 measuring stations show anywhere between 5 ppmv and more than 30 ppmv annual variation. This is due entirely to the fact that the northern hemisphere has more land mass and biological turnover than the southern hemisphere.
The high peak is typically in May as the growing season get underway, and the low peak is in September as the growing season ends and leaves begin to rot. In general the drop off during the summer is faster than the rise during the winter.
Along with this variation is a very steady increase of about 2 ppmv per year due to human CO2 emissions. Various calculations consistently show that less than half of human emissions accumulate in the atmosphere due to ocean absorption and greening of the planet.
Tim S,
I use the Mauna Loa data. So, the 2ppmv increase per year is only due to human emissions? Explain how that works. Start with human emissions at 5ppm and natural at 100ppm. Somehow nature was keeping 50% of human emissions 10 years ago but not it is only keeping 40%. Oh, and by the way, Tinkerbell doesn’t debate. He’s a propagandist like you. You have to know something about math or science to debate.
Tim S,
P.S.-The change last year was only 1.8ppm at Mauna Loa from June to June while human emissions continue to climb. Why don’t you explain how that works?
Tinkerbell,
No, it isn’t socialism. First, start with the preamble then deduce from there.
Socialitism:
https://www.nbcnews.com/politics/justice-department/least-half-dozen-top-trump-administration-officials-appear-jeffrey-eps-rcna258749
Thomas Hagedorn,
Natural sinks are larger than natural sources NOW. Before humans started messing with the carbon cycle, natural sources and sources were of course more or less in balance, as CO2 concentration in the atmosphere was relatively stable. Even during the deglacializations, which are among the most rapid CO2 concentration change periods we’re aware of, CO2 concentration grew at a rate of ‘only’ around 10 ppm per MILLENNIUM. Compare that with today’s 25 ppm per DECADE. Natural sinks are of course increasing as the partial pressure of CO2 is increasing.
Earth, like any other large system, will usually be in a relatively stable state (i.e. any changes are slow) unless there is some ‘force’ disturbing it. We are that ‘force’.
You don’t get it. Nature emits 780 gigatons CO2 per year and absorbs 800 gigatons. Humans emit (or at least generate) 35 gigatons and absorb none. How can you not see that the annual 15 gigatons CO2 increase in the atmosphere is caused by us? (The numbers aren’t exact but that’s irrelevant as they are in the ballpark.)
I’ll dumb it down:
Let’s say you receive $100 from Peter every year, in $1 bills. Peter also takes $100 from you every year so the net of these transactions is zero. This goes on, year after year. One year, Peter’s friend Paul shows up. He gives you $5 every year, in $1 bills, from then on and doesn’t take anything back from you. Peter now sees an opportunity to get some more money. He continues to give you $100 every year but he also takes $103 from you every you.
So now you receive $105 every year from Peter and Paul and you also lose $103. So you will GAIN $2 per year and this gain will accumulate year by year. Would you now say that Peter or Paul is causing your money to grow? Does it matter if the specific $1 bills that you accumulate in this way came from Peter or Paul?
(These are rhetorical questions so don’t bother replying. Either you understand it or you don’t.)
Stepen p,
Of all the sceience denial arguments I’ve seen (so far), the “we are not causing the CO2 increase” has got to be the most stupid one. This isn’t rocket science.
https://www.climate.gov/news-features/climate-qa/how-do-we-know-build-carbon-dioxide-atmosphere-caused-humans
Stephen p anderson,
My “you don’t get it” comment on August 26, 9:07 AM is directed to you, about your post in which you seem to think it matters where the individual CO2 molecules comes from. Do you know how banks work? Do you think they keep track of which SPECIFIC dollar that came from which customer?
Gadden,
“You don’t get it. Nature emits 780 gigatons CO2 per year and absorbs 800 gigatons. Humans emit (or at least generate) 35 gigatons and absorb none. How can you not see that the annual 15 gigatons CO2 increase in the atmosphere is caused by us? (The numbers aren’t exact but that’s irrelevant as they are in the ballpark.)”
That’s propaganda that professes to be science. If Nature emits 780Gton per/year and humans emit 35 Gton/year for a total of 815Gton/year, doesn’t the natural and human CO2 mix in the atmosphere? And wouldn’t they be ab.sorbed by sinks in proportion to their ratio in the atmosphere? How can sinks differentiate between a human and natural CO2 molecule?
Gadden
Your arguments are excellent. They won’t help with lunatic right-wing stephen p anderson!! He has no logical sense and i don’t believe he is able to think on his own! He has accepted that the science of Climate Change is a Marxist Global Government Conpiracy so his brain is shut-down. He only accepts right-wing nonsense and is not able to think about them. He just repeats right-wing lies, the dude is in a cult and will not think at all until he wakes up but the right-wing ensures none of their mindless pawns wake up, they call thinking and observing on your own “Woke” which is very bad. You will never get intelligent thoughts from this poster!
[TROGLODYTE] Nature emits 780 gigatons CO2 per year and absorbs 800 gigatons. Humans emit (or at least generate) 35 gigatons and absorb none.
[ALSO TROGLODYTE] How can sinks differentiate between a human and natural CO2 molecule?
Stephen p anderson,
“How can sinks differentiate between a human and natural CO2 molecule?”
Strawman argument, duh. I’m not saying they can differentiate. Look, if I give you $780 (in $1 bills) and my friend Paul gives you $35 (also in $1 bills), and I then immediately take $800 from you, you have $15 left. Are you with me so far? So your net gain after these transactions is $15, right? Would you thank me or my friend Paul for thus gain? Some of those fifteen $1 bills you gained are most likely from me. So does it make sense for you to thank me for those, even though I took more money from you than I initially gave you.
Think about it, for as long as it takes to make the penny drop. Did I or Paul cause your capital to grow. (This is math for nine-year-olds, by the way.)
Gadden,
“Strawman argument, duh. I’m not saying they can differentiate. Look, if I give you $780 (in $1 bills) and my friend Paul gives you $35 (also in $1 bills), and I then immediately take $800 from you, you have $15 left. Are you with me so far? So your net gain after these transactions is $15, right? Would you thank me or my friend Paul for thus gain? Some of those fifteen $1 bills you gained are most likely from me. So does it make sense for you to thank me for those, even though I took more money from you than I initially gave you.
Think about it, for as long as it takes to make the penny drop. Did I or Paul cause your capital to grow. (This is math for nine-year-olds, by the way.)”
That isn’t the correct analogy. If you give me $780 and Paul gives me $35 then I have $815. Then if you take away $800 I have $15 remaining. However, of the $800 you took away, $767 was what you gave me and $33 was what Paul gave me. Of the $15 dollars I have left, $13 came from you and $2 came from Paul.
Gadden,
By the way, you, Tinkerbell and Norman flunk physics and calculus 101.
“[TROGLODYTE] Nature emits 780 gigatons CO2 per year and absorbs 800 gigatons. Humans emit (or at least generate) 35 gigatons and absorb none.
[ALSO TROGLODYTE] How can sinks differentiate between a human and natural CO2 molecule?”
Does Canada not offer psychiatric treatment?
I have a question for you guys. Are they just not teaching math in school anymore? Do they make you use pencil and paper and no cell phones?
Troglodyte gloats about maths yet fails to master the concepts of positive and negative numbers.
Still, let’s go for more cOMplEX AnD DEtaIlEd:
https://courses.seas.harvard.edu/climate/eli/Courses/EPS281r/Sources/Greenhouse-effect/Arrhenius/1-WG1AR5_Chapter08_FINAL.pdf
The notion of Effective Radiative Forcing (ERF) is related, but different to the “technical” concept of Radiative Forcing (RF). Hence my earlier use of “forcing” simpliciter.
Troglodyte’s guru makes two claims:
(B1) Humans don’t increase CO2 emissions.
(B2) CO2 can’t increase climate change.
Sometimes he pads these claims using words such as “significantly”. Troglodyte confuses the two claims, although his actual jabs are related to B1. That’s where his “human CO2” and “natural CO2” are trying to lead Gadden. Since that argument is absurd (natural sinks are net negative), it might be best to address B2 directly: CO2 indeed increases climate change, for it’s a positive forcing.
Astute readers should never expect a real argument from troglodytes.
Stephen p anderson,
“Of the $15 dollars I have left, $13 came from you and $2 came from Paul.”
Sure, but the question remains. Paul’s net contribution was to give you $35 and my net contribution was to take $20 from you. So which one of me and Paul is causing your capital to grow? Can you answer that?
I sure hope you don’t work in a bank. it would be a nightmare to try to keep track of which SPECIFIC dollar came from which SPECIFIC customer and belongs to which SPECIFIC customer. Stocks and flows are clearly not your forte.
Let’s review Troglodyte’s “maths”:
You give me 780…
No, you gave me 767.
Who would ever want to deal with Troglodyte?
Gadden,
“Sure, but the question remains. Paul’s net contribution was to give you $35, and my net contribution was to take $20 from you. So which one of me and Paul is causing your capital to grow? Can you answer that?
I sure hope you don’t work in a bank. it would be a nightmare to try to keep track of which SPECIFIC dollar came from which SPECIFIC customer and belongs to which SPECIFIC customer. Stocks and flows are clearly not your forte.”
You just said sure, and then you tried to make an argument against it but failed. You are causing my capital to grow more than Paul. $815 is put into the pot, $800 is taken out. Since you are putting more in you are causing capital to grow the most. That’s called differential calculus. Your argument is you are putting in $780 and pulling $800 out so Paul is making it grow more but you can’t tell whose dollars you are pulling out. Maybe you’re pulling all $35 of Paul’s dollars and $765 of your dollars. Then you’re contributing all $15 of the net.
“Let’s review Troglodyte’s “maths”:
You give me 780…
No, you gave me 767.
Who would ever want to deal with Troglodyte?”
LOL. Poor Tinkerbell. Math deficient. What are you doing on science blogs?
Let’s hope Troglodyte does not have any business partner. They would have to deal with him taking money out of their business account and pretend nobody can know for sure it’s not the clients that are scamming them…
For those in the back:
– the natural sinks are net negative;
– the antropogenic sinks are net positive.
Even Harde accepts these facts. But then Harde still has a reputation to maintain, whereas Troglodyte just needs to spin on Step 3 – Saying Stuff.
I think Harde understands there is no such thing as a natural sink and an anthropogenic sink. It is called the equivalence principle.
> I think Harde understands there is no such thing as a natural sink
Another usage of Step 1 (Pure Denial) that conceals Step 2 (Sammich Request):
https://retractionwatch.com/2018/04/23/flawed-climate-science-paper-exposed-potential-weaknesses-in-peer-review-process/#comment-1598326
Even Edwin’s model posits three buckets. His “equivalence principle” is another thing altogether. In terms of my B&W model, we don’t need to know the provenance of each specific buck in our account to know that Muricans are being scammed by rent seekers, not workers.
Contrarians are natural time sinks.
Tinkerbell,
You continue to lie by omission and cherry picking. You are a lying propagandist. Nowhere in that statement does Harde claim there are natural sinks and anthropogenic sinks. There are only sinks. Also, this is from a blog comment in 2018. Harde has written paper after paper (with friend Murray Salby) since then supporting natural emissions as the cause of CO2 rise.
I think readers can realize that after a crank denies “nature is a net sink”, that crank will keep asking for receipts or else skip to Step 3 – Saying Stuff. Troglodyte does both. At some point he might also go for Step 4 – Cheap Bargaining, and discuss residence time.
Meanwhile, Ohio Republican Representative Max Miller’s attorney publicly released a sensitive image of the congressman’s 2-year-old daughter in a domestic abuse case. Miracle Mike, who’s used to the missteps of Donald’s thugs, shrugged.
Stephen p anderson
“You are causing my capital to grow more than Paul.”
Oh dear. You’re saying that if you’re a bank and the following transactions occur, I am causing the bank’s capital to grow more than Paul is causing the bank’s capital to grow.
Transaction 1: I deposit $780 in the bank.
Transaction 2: Paul deposits $35 in the bank.
Transaction 3: I withdraw $800 from the bank (which means that the net effect of MY two bank transactions is that I have taken $20 from the bank).
For your information, if I take $20 from the bank I do NOT contribute positively to the bank’s capital growth. How can you not understand this?
“The 13-month average has turned flat. With the current El Nino condition that is forecast to get stronger, it would be very unusual if we do not see a warming period in the data.
We will soon see various people on TV and here on this site who will claim victory — we predicted this.”
Nobody on this site – except sometimes skeptics – makes the mistake of confusing short term fluctuations in global temperatures with long term trends.
I doubt you’ll see anyone being ‘victorious’, either.
We may get record warm global temps with this el Nino. Who knows? But we will one day in the next 15 years, when a strong el Nino combines with the underlying long-term rise in global temps.
I’ll lay bets on it.
So barry, is it your turn to play Nate’s game with the drive-by quotes? Did you read the whole comment? Do you represent everyone who comments about climate here and in the general public? You did not comment on my conclusion. Was that because you agree with it?
Laughable that Tim regularly baits and trolls me, but when I challenge his science claims with facts and sources, we get crickets from him.
He seems to be truly afraid to debate me on science.
Nate, have you considered the possibility that he knows you are going to expose the flaws in his argument and can’t respond? So he feels the need to attack you in advance to make you seem less credible before you have even presented your rebuttal.
Eldrosion,
Do you notice any similarity between our Ivy Leaguer’s rhetorical ploy and Ray-Gunn’s preemptive strike doctrine? See for instance:
https://inkstickmedia.com/reagan-preemptive-strikes-doctrine/
In fairness, Q-Anon and Troglodyte are doing the same.
“So barry, is it your turn to play Nate’s game with the drive-by quotes?”
I bet you light up every room you leave.
W,
Tim went to an Ivy League school? That explains why he’s so vitriolically pompous…
I find it rather interesting that someone whose main purpose is to argue and disrupt the discussion finds me “pompous”. The fact is that I will correct any mistakes I see on either “side”, and most importantly I avoid making it personal.
If you don’t like being corrected, then don’t respond to my posts.
Tim sez: “most importantly I avoid making it personal.”
OMG, the lack of self-awareness with this guy is astonishing.
“Gadden was referring to the forcing:”
No, I wasn’t. I was referring to the fact that the natural contribution to CO2 is currently negative while Man’s contribution is positive. In other words, we are causing the rapid growth. This is well-known although stephen p anderson apparently can’t wrap his head around this basic fact.
> In other words, we are causing the rapid growth.
Often called a forcing.
” In more technical terms, it is defined as “the change in the net, downward minus upward, radiative flux (expressed in W/m2) due to a change in an external driver of climate change.”[3]:”
That’s why Tinkerbell stays away from the actual math and science and sticks to the propaganda. He doesn’t understand it.
That comment goes here:
https://www.drroyspencer.com/2026/08/uah-v6-1-global-temperature-update-for-july-2026-0-48-deg-c/#comment-1751116
Let’s illustrate T’s so-called argument with two accounts: Billionaires (B), and Workers (W).
Ws give us more than we give them, say by N. Bs take more than they give, say by M. Thus Troglodyte subtracts Bs’ debit from Ws’ credit, because “differential calculus”.
In other words, he amortizes what is paid to billionaires the population like the closet socialist he is. Instead of recognizing rent-seeking behavior, he’ll blame workers for being inefficient.
So maths. Much difficult. Wow.
Let’s be clear. If you mud wrestle with a pig, you both get dirty, but the pig likes it. My consistent and ongoing complaint is that any reply to my complex and detailed comments has to include the conclusion. My definition of a “drive-by” is very clear and obvious. A drive-by is the method of taking a sentence or phrase out of context and then making an argument that is actually answer in the conclusion. People who cannot be honest, and then attempt to distort the full meaning of the comment, do not deserve anything more than to be revealed for what you are doing.
People are at liberty to take any part of a comment and agree with it or contest it. When agreement arrives it is met with acceptance or silence. For some reason it’s only when a portion of a comment is contested that people get snooty about such partitioning.
Word to the wise, lose the snoot and stick to your topic. You’ve seen what follows snoot, but you don’t seem to learn from it.
If you want to practise right here, return to the topic. I didn’t have a go at you in my first reply, but you opened the door. The tone can shift right now, if you want.
Here you go barry, take a shot at this. It is a direct quote from my original comment:
“The problem with all of these claims and projections is that growth in CO2 emissions will continue to come from the developing world, not the developed world. For many of those people, it is not a political game, it is survival. The notion that “we must do our part” sounds convincing, but only if doing out part is done rationally. Panic is usually not a good place to start.
Every step of the “new green deal” has problems. Electric energy production, storage, and distribution using renewable resources is a very difficult problem to solve. The first problem is production capacity. The various components take time and money to produce.”
The reason I didn’t comment on the whole post was that the 3 paragraphs were only loosely connected, and seemed to be three separate talking points.
I’ll leave the ‘panic’ comment aside as it’s rhetorical.
There is a long-running, ongoing discussion about balancing the needs of burgeoning economies late to the fossil fuel party and mitigation to prevent long-term global warming. It’s a multi-layered, nuanced topic, rarely oxygenated in blog chats.
I see little to no evidence of ‘irrational’ policy-making on CO2 mitigation. More commonly, pushback is hyperbolic and selectively argued. Economic armageddon doesn’t seem to have collapsed the economies of countries implementing mitigation policies. A little temporary economic depression, perhaps, which is expected – but that might be some people’s idea of irrational. It comes down to a cost-benefit analysis on uncertain futures. I’ll go with precaution when we don’t get a do-over.
I don’t know which “new green deal” you’re referring to, but yes, mitigation is challenging when fossil fuel is the historical bedrock of an economy. It’s a long list of things to balance.
Jim on July 9, 2026 at 3:47 AM
” Has anyone compared the worldwide time graphs since 1979 for the 4 levels of the atmosphere? ”
*
Apologies – I overlooked your question.
Some years ago I made such a comparison:
https://drive.google.com/file/d/1kBkDZhSsVCHn7GOPp1SYl9tuyY4TsKec/view
No problem to update it if necessary…
Firefighters are battling around the clock as the Spokane Complex Fire remains 0% contained, fueled by extreme heat, dry conditions, and strong winds forecast to reach 30 mph.
The wildfire has now burned more than 10,000 acres, destroyed over 700 structures, and forced more than 65,000 residents to evacuate. Hundreds of additional firefighters have been deployed as crews race to protect communities and critical infrastructure.
Authorities warn that worsening weather conditions could lead to rapid fire growth over the coming days.
#Spokane #Washington #Wildfire #BreakingNews #FireSeason #USA
“Sparked” by an arsonist who has been arrested.
The causes of wildfires have not changed; malice, carelessness or natural causes.
The difference is that in large areas of CONUS and Europe the climate has changed.
Warmer wetter Winters allow more vegetation to grow. Hotter drier Summers dessicate that vegetation and turn it into extra fuel for wildfires.
Regardless of cause, wildfires which would once have fizzled out on their own or burned a few acres are now spreading over many square miles, destroying landscapes and cities.
Entropic man,
You forgot to include the biggest cause of wild fires being larger. That of poor forest management which have been going on Gor the last few decades.
Admittedly it is caused by climate change but not of the weather type of climate change. It has been caused by the left wing climate cult and their Willard style of thinking. The left never thinks of consequences unless they can get more control, more money and more vanity point for their fragile egos.
Ent, once again you display your inability to learn.
Wildfires have been here since well before you were born. They are NOT new. And we’re in a natural warming trend, nothing we can do about it. Adapt!
You’re addicted to cult beliefs and that causes you to make stupid claims, like passenger jets can fly backward.
Grow up and face reality.
” It has been caused by the left wing climate cult and their Willard style of thinking. ”
Not sure how a specific style of thinking can ignite a fire.
You need flammable fuel and an ignition source like lightning.
Keep showing everyone just how badly right-wing ideology mixes with science.
🙂
H2O was here before humans existed. That means Puffman’s bath tub can never spill because he’s too busy ranting online under various sock puppets. CO2 was here before humans existed. That means soda cans are UNPOSSIBLE. Et cetera.
Our troglodytes tolerate Puffman’s nonsense, for some reason.
Another typhoon is forming in the western Pacific.
https://i.ibb.co/d0X2QsL6/mimictpw-wpac-latest.gif
The cult kids are still clinging to their cult beliefs. They’re ABSOLUTELY SURE that CO2 is warming the planet. They have no science to support that. They are only going by their cult beliefs that since CO2 ppm is going up, then temperatures are going up. They no not understand correlation is NOT causation.
If that were true we could say the soaring stock market (now at record highs) is due to increasing CO2.
Kids these days….
It’s rather the extremist points on both ends of the debate that I find ridiculous.
One side: It’s all CO2!
Other side: CO2 contributes nothing!
Personally, I don’t think the radiative theory of the greenhouse effect is accurate.
But I can’t rule out CO2 doing something.
It probably is just by far not the dominant driver of increasing temperatures.
That’s most likely decreasing cloud cover and changes in albedo.
1% in albedo decrease translates into 1 degree Celcius gain – no CO2 needed.
Old albedo estimates in literature were 0.31, newer estimates are below 0.29.
Ron v. F.
” Personally, I don’t think the radiative theory of the greenhouse effect is accurate. ”
So, you don’t think?
Not one of the ‘Skeptic’s, even not Claes Johnson let alone Ed Berry, were able to scientifically disprove it.
Are you?
Ron,
Yes, staggers the imagination. Eab=S(1-a) a=albedo
It’s math. Their God NASA said albedo has been decreasing. This explanation is completely ignored.
Yes Ron, for a Solar Constant of 1371 arriving Earth’s “disk”, the following albedos would result in maximum disk temperatures as follows:
Albedo******Temperature
0.31 ********* 86.2C
0.30 ********* 87.6C
0.29 ********* 88.9C
Don’t forget ocean oscillations. As various oceans oscillate (cycle in and out of phase) the results can vary surface temperatures for 5 to 80 years. We’ll know more about the oceans if the ARGO data remains “unadjusted”.
And remember, CO2’s 15μ photons can NOT raise Earth’s 288K surface temperature.
“Not one of the ‘Skeptic’s, even not Claes Johnson let alone Ed Berry, were able to scientifically disprove it.”
False. Berry applied mathematics to the data that is already out there to disprove the IPCC carbon cycle model. The logical conclusion is his model is correct and that most of the CO2 rise is due to natural emissions. Therefore, the warming is not due to anthropogenic effects.
[Q-ANON, August 5, 2026 at 12:18 PM] rather than changes in albedo
[ELDROSION, August 5, 2026 at 11:25 PM] The observed albedo change is not independent at all. The cryosphere is shrinking, exposing darker land and ocean surfaces that absorb more sunlight. The question then becomes: Why is the cryosphere shrinking? GHG-driven warming.
[TROGLODYTE, August 7, 2026 at 9:33 AM] Their God NASA said albedo has been decreasing. This explanation is completely ignored.
Not only do we need better contrarians, but we need better cranks.
CO2 does have an effect. It just isn’t warming. As CO2 increases it leads to an increase in downwelling IR (DWIR). This does not cause any warming due to conductive feedback, but it does cause increased evaporation.
More evaporation enhances the water cycle which is a cooling effect. The added water vapor increases low atmosphere buoyancy which leads to stronger convective currents. While this leads to some direct cooling by carrying warm, moist air higher in the atmosphere, there’s also a secondary effect. This is the part climate science continues to deny.
Stronger convection pushes air currents into a colder part of the atmosphere. This increases latent heat removal and decreases residual water vapor. Both of these add to the cooling effect. Less latent heat gets carried back to the surface in downdrafts and the lower residual water vapor in the upper troposphere allows more radiation to be emitted to space.
The bottom line is the small warming effect of CO2 itself is canceled and we also get a little more precipitation. Both of these help plants grow bigger and stronger.
“Not only do we need better contrarians, but we need better cranks.”
And somehow they have convinced themselves they know more than the scientists who have spent years earning advanced degrees, conducting research, analyzing data, and dedicating their careers to understanding the climate.
A lifetime of expertise apparently loses out to a few confident opinions.
“Not only do we need better contrarians, but we need better cranks.”
Propagandists don’t need better liars, they have you.
I guess when you don’t have any math or science skills (or logic), then lying is your fallback.
I guess when you don’t have any math or science skills (or logic), then lying is your fallback.
> A lifetime of expertise apparently loses out to a few confident opinions.
Contradictory opinions, to boot. Between contrarians, between cranks, oftentimes the same crank.
To confuse the residence time of individual molecules (years) with the adjustment time for an enhancement of atmospheric CO2 (centuries) so confidently takes some kind of talent.
@Bindidon
“So, you don’t think?
Not one of the ‘Skeptic’s, even not Claes Johnson let alone Ed Berry, were able to scientifically disprove it.
Are you?”
Are you able to prove it?
That’s the thing: You can’t prove or disprove it.
It’s all about correlations and assumptions based on physics from way simpler experiments than the chaotic climate system of Earth is.
And we don’t have another Earth to try something to prove it.
I would be personally very curious how and if an increase in atmospheric mass would change the temperature on this 2nd Earth.
“87.6C”
Gee, what Earth observation does this ‘theory’ match?
SOLAR MINIMUM UPDATE
South Korea Heatwave Kills 19, Suspends Baseball After Fan Cardiac Arrest
https://www.techtimes.com/articles/323226/20260805/south-korea-heatwave-kills-19-suspends-baseball-after-fan-cardiac-arrest.htm
For some reason the NYT headline only mentions baseball being cancelled.
“For some reason”…and you don’t understand why?
Dullard
You seem to be unaware that the NYT and WP are left of centre.
So why would a left of center newspaper not report the heat wave?
Q-Anon embraces the political compass of troglodytes, which is US-centric. Newspapers of record present the viewpoints of the establishment. In WaPo’s case, it’s Jeff Bezos’. In the Grey Lady’s case, who knows what it tries to do with opiniators such as Bret Stephens, David French, David Brooks, and Ross Douthat, who left for CBS News, now owned by David Ellison.
Donald is a massive money launderer and cut off by the bank that discovered it, yet the story barely registered with the legacy media. Ronnie Ray-Gun redid the tax code that led Murica to its golden age, with overwhelming journalistic support. It’s all about catering for the membership base.
Q-Anon self-identifies with billionaires, for some reason.
A powerful cold front will cause damaging winds, heavy rain, hail, snow and bitterly cold temperatures across the southern half of Australia towards the end of this week. ⚠️ This blast of wintry weather is likely to cause severe weather in at least 4 states
There’s a small problem, because winter weather is determined by the pattern of the polar vortex in the stratosphere. El Niño will, at most, cause a drought in eastern Australia.
https://i.ibb.co/0p9YJ9rc/npst30.png
Two cold fronts will pass over Australia. The first will bring heavy snowfall to the Australian Alps.
Global
https://climatedatablog.wordpress.com/2026/08/05/uah-global-for-jul-2026/
Tropics
https://climatedatablog.wordpress.com/2026/08/05/uah-tropical-for-jun-2026-2/
1. UAH … 12 month Median low pass still wrong
https://drive.google.com/file/d/1S_YhqAC3w7WBv7yanp0nt8gdedS-1QYt/view
2. UAH … 5 year Median low pass still missing
https://drive.google.com/file/d/1NuDlpNz2ujFwbQ7Jf-7wRBVSklyb3Mgm/view
https://drive.google.com/file/d/1OVdyXa1WK0HVXd6HQiei1goDXL4y5QkV/view
This months Data
https://climatedatablog.wordpress.com/
Can anyone point me to global water vapour trend data. Ideally to now, or at least into 2026?
It’s well known, by those who know it well, that Climate Reanalyzer provides the ECMWF ERA5 global Total Column Precipitable Water record, including anomalies through the present: ERA5 World (90°S-90°N) Total Column Precipitable Water Anomaly (kg/m²).
Being a global atmospheric reanalysis, ERA5 is observationally constrained rather than a satellite-only product, and it is updated to within days of the present.
Remote Sensing Systems also publishes a satellite microwave Total Precipitable Water record, although that record primarily represents the ice-free oceans rather than the entire globe.
There is a more scientifically interesting point here: Comparing the ERA5 water-vapor trend directly with ERA5 global temperature would make the result much more physically informative than simply viewing the raw curve, because Clausius-Clapeyron predicts roughly a 6-7% increase in atmospheric moisture per °C of warming under approximately constant relative humidity.
It never ceases to amaze how deniers have never looked at the very data they so adamantly deny. It just confirms that anthropogenic climate change science denial is nothing more than Kayfabe.
¯\_(ツ)_/¯
Thanks.
SOLAR MINIMUM UPDATE
The rise in Nino 3.4 region sea surface temperatures over the past few weeks has been nothing short of astonishing.
We are now hotter than any days during the 1997/1998 super El Nino event, and we are still many months from the peak.
https://bsky.app/profile/zekehausfather.com/post/3mseh3hse6d2f
Last couple of months I’ve commented on the visual distortion of data presented in the monthly graph resulting from hiding the original multi-decadal baseline, and on the lack of acknowledgement from our host that the UAH data shows the rate of warming is increasing.
Here’s a recently (March 6) published study of the global temperature record with most of the short-term cyclical ‘noise’ (El Niño/Southern Oscillation, volcanism, and solar variation) removed. And folks I’m here to tell ya the line goes up, and it goes up faster and faster:
https://agupubs.onlinelibrary.wiley.com/doi/10.1029/2025GL118804
“…our analysis of GMST data after removing the best estimate of the influence of three natural variability factors reduces the noise level sufficiently to reveal a large and significant acceleration of global warming, regardless which statistical method is used. Note that the adjustments reduce the global temperature in 2024 and minimally in 2023 by removing effects of El Niño as well as the solar maximum. The evidence is thus strong that the statistical significance of warming acceleration is not due to outlier years in 2023 and 2024, but that global temperature has departed from its previous path since around 2015.”
It’s happening right in front of us. Go look.
MFA, Dr. Spencer is only following the convention of the “industry”, to adjust the baseline every 10 years.
But your “paper” did not remove ALL of the natural variability. They just removed the things they knew about! That ain’t science.
“But your “paper” did not remove ALL of the natural variability. They just removed the things they knew about! That ain’t science.”
The goal of the paper was to remove short-term variability in order to isolate the underlying global warming signal.
Grant Foster (Tamino) and Stefan Rahmstorf first applied this approach in 2011, showing that the so-called “pause” largely disappeared once short term influences such as ENSO, volcanic aerosols, and solar variability were accounted for. This new paper extends that analysis through the mid 2020s.
Figure 1 (of this new paper) is particularly informative:
https://i.postimg.cc/kXTxNwZG/FR2026-Figure1.png
Looking at the figure, it is difficult to reconcile the observed warming with the idea that multidecadal ocean oscillations are driving the long-term increase in global mean surface temperature.
#1: An oscillation, by definition, swings between positive and negative phases, averaging out to roughly zero over time. It can speed up or slow down warming for years or even decades, but it cannot, on its own, explain a persistent global warming trend lasting more than a century.
#2: There is no clear multidecadal cooling phase in the instrumental record that would correspond to the negative phase expected from an oscillation dominating the temperature record. The cooling observed from roughly 1940 to 1975 is well explained by increasing sulfate aerosol emissions, whose cooling effect partially offset the underlying warming, rather than by a reversal of the underlying warming trend.
Don Easterbrook predicted global cooling back in December 2008 based partly on ocean oscillations:
https://wattsupwiththat.com/2008/12/29/don-easterbrooks-agu-paper-on-potential-global-cooling/
But that, of course, did not happen.
The first six months of 2026 have averaged a staggering +0.64°C above the 2008 annual average (UAH).
Funny how every failed denier prediction gets quietly swept under the rug, while the IPCC and Al Gore are expected to have a perfect crystal ball forever. Apparently accountability only applies to one side.
How long are climate deniers going to keep selling themselves and everyone else the same tired fantasy?
“The goal of the paper was to remove short-term variability in order to isolate the underlying global warming signal.
Correct, the “paper” did not remove ALL of the natural variability. They just removed the things they knew about! That ain’t science.
“They just removed the things they knew about! That ain’t science.”
Science – where we remove things from our analysis that we don’t know about.
Hahaha. This is the most backward, upside down definition of science yet. Perfect.
“Correct, the “paper” did not remove ALL of the natural variability. They just removed the things they knew about! That ain’t science.”
If that is your concern with the paper, I don’t think it quite fits with what the paper was trying to do. Its purpose was to account for the WELL-KNOWN short-term variations that usually complicate temperature trend analysis.
Sorry Eldro, but as usual you don’t understand any of this.
The “purpose” of the paper was to alarm. They tried to show some scary acceleration by claiming they had removed all natural variability. But, they didn’t do that.
For example, just consider the short period 2022 to now. Take out the known natural variability, HTE and ENSO. What is the July value for UAH Global then? (Show all work.)
Hint: It ain’t alarming!
Irrelevant.
The conclusion that warming has accelerated does not depend on the years after 2022. The authors explicitly addressed that possibility in the paper. Their analysis indicates that the global warming rate began increasing around 2013–2014.
You are misinformed, MFA. Roy is following the definition of climate which is the 30 year average of weather. Every 30 years, he recalculates the baseline, which is scientifically correct.
Your link points to an article by uber-climate alarmists, Rahmstorf and Tamino.
el d….”An oscillation, by definition, swings between positive and negative phases, averaging out to roughly zero over time. It can speed up or slow down warming for years or even decades, but it cannot, on its own, explain a persistent global warming trend lasting more than a century”.
***
Re-warming from the the Little Ice Age can explain the warming but I have never heard Tamino or Rahmstorf or any alarmist admit that.
________
“There is no clear multidecadal cooling phase in the instrumental record that would correspond to the negative phase expected from an oscillation dominating the temperature record”.
***
Some of the oscillations like the AMO work over 40 year periods. Others like ENSO operate over a period of a few years, even months. How can you expect any revelation of cooling when the AMO and PDO were not even discovered till very recently?
________
“The first six months of 2026 have averaged a staggering +0.64°C above the 2008 annual average (UAH)”.
***
Natural variation can explain that and there is still no proof that a trace gas can.
I love it when skeptics resort to:
“it is just natural variation”
which effectively is the same as:
“something is happening but I refuse to accept there is a physical cause involved”
i.e. it must be the hand of God.
If God is involved, then possibly he/she is trying to send us a message? My bet would be that he/she wants us to stop polluting the atmosphere, the land and the oceans. In which
case reducing CO2 emissions would seem to be a wise move.
CO2 is NOT pollution!
What are they teaching poor students these days?
CO2 is needed for live on Earth. We’re trying to get levels between 600-800 ppm. It’s hard work, but somebody has to do it….
“We’re trying to get levels between 600-800 ppm.”
They see me trollin’, they hatin’, patrollin’, tryna catch me ridin’ dirty.
” Every 30 years, he recalculates the baseline, which is scientifically correct. ”
Here you can marvel at the level of scientific knowledge possessed by the average pseudo-skeptic… OMG
It is painfully obvious that, despite arm-waving and predictions of doom from climate alarmists, the red-running average curve has a negative trend. And a rather steep negative trend since whatever caused the 2024 warming spike.
The warming spike is theorized to be a product of the Hunga Tonga volcanic explosion that dumped millions of tons of water vapour into the stratosphere, a normally very arid environment. The spike is taking its time to dissipate but we mere mortals must await an explanation, if one is forthcoming.
Meantime, the alarmists bray propaganda about it being somehow connected to a trace gas in the atmosphere.
“red-running average curve has a negative trend.”
Ain’t a trend, it’s a rolling average. If it was a ‘trend’ it would be massively statistically insignificant. IE, not a trend.
After years and years, basic concepts like ‘trend’, and ‘learning’ are still beyond you.
You were proven right so fast, Barry:
“Nobody on this site – except sometimes skeptics – makes the mistake of confusing short term fluctuations in global temperatures with long term trends.”
Might be a bit more than “sometimes,” though.
Yes indeed.
If anyone is interested where stephen p anderson gets his terrible material from it is from Edwin X Berry paper on CO2 from 2019.
Here is the logic Berry uses (which is flawed!! but Anderson is so lost in right-wing lies he will not understand the flaw at all even when you clearly explain it to him).
“Therefore, natural and human CO2 do not “add” CO2 to the
atmosphere. Both natural and human CO2 “flow through” the
atmosphere. As CO2 flows through the atmosphere, it raises
the level of atmospheric CO2 just enough so CO2 outflow
equals CO2 inflow. Nature balances CO2 in the atmosphere
when outflow equals inflow.
You pump air into a tire or inner tube that has a leak. As
you pump air into the tube, air leaks out of the tube. The
faster you pump air in, the faster air leaks out. If you pump air
into the tube at a constant rate, the air pressure in the tube will
find a level where outflow equals inflow.
River water flows into a lake or a pond and flows out over a
dam. If inflow increases, the water level increases until
outflow over the dam equals inflow from the river. Then, the
water level will remain constant so long as inflow remains
constant. The river does not “add” water to the lake. Water
“flows through” the lake and finds a balance level where
outflow equals inflow.
Similarly, human and natural CO2 flow through the
atmosphere. The inflow creates a balance level that remains
constant so long as inflow remains constant.”
https://www.sciencepublishinggroup.com/article/10.11648/j.ijaos.20190301.13
The flaw in the logic is the outflow will increase to match the inflow and that does not have to happen! The river can continue to increase the lake level if the outflow remains a constant and the river flow increases.
Here is another unscientific comment he put in his paper.
“Of course, nature is a “net carbon sink” because nature
absorbs human CO2 emissions. However, absorption of human
CO2 has no bearing whatsoever on how much natural CO2
flows into the atmosphere. Nature can set its inflow as it pleases,
no matter how much human inflow nature absorbs. The 98-ppm
natural flow can double or reduce to one-half while nature
continues to absorb the outflow of the human addition to
atmospheric CO2. So, the IPCC argument is absurd. ”
What??!! “Nature can set its inflow as it pleases,” That might be one of the most unscientific comments seen in a supposed science paper!!
“The flaw in the logic is the outflow will increase to match the inflow and that does not have to happen! The river can continue to increase the lake level if the outflow remains a constant and the river flow increases.”
There is no flaw in logic. It is the solution to the differential equation. The level will tend toward the balance level according to 1-1/e, the eTime, until it reaches equilibrium. If inflow remains constant, then inflow minus outflow will eventually reach equilibrium. The math cannot be argued with. Here’s the math:
dCO2/dt = Inflow – Outflow =
Human Emission + Natural Emission – Natural Outflow
Using a Te of 4 yrs:
2ppm/yr = 438ppm/4yr – 430ppm/4yr
= (5ppm + 104.5ppm) – 107.5ppm
= 109.5ppm – 107.5ppm
It has to be this. This is the historical data from Mauna Loa. dCO2/dt is approximately 2ppm annually.
Outflow is proportional to level where mass is proportional to pressure and the higher the partial pressure of CO2 then the more the collisions occur with the sinks. If you have a level of 430ppm (which it is now) then 5.14ppm of the outflow will be human and 102.36ppm will be natural. You can see most of the 2ppm rise is due to nature. It is a random process. Human and natural CO2 are mixed completely in the atmosphere and indistinguishable by nature.
Why is the rate of CO2 accumulation in the atmosphere increasing?
Why does the rise coincide with anthropogenic emissions, both in terms of onset, velocity and acceleration?
Why is there more CO2 over time with the isotopic signature of fossil fuel-burned CO2?
Why do all these correlations and empirical evidence not satisfy ‘skeptics’? Do they have something to lose by accepting that is both intuitively obvious and extremely well verified?
Berry has shown us the solution to the differential equation
dCO2/dt = Inflow – Outflow
and that nature is the cause for most of the rise.
Why don’t you look for other reasons now that you know the rise is mostly due to nature instead of jumping to conclusions that support your preconceived notions?
Berry confuses gross inflow with net accumulation, confuses residence time with adjustment (relaxation) time, and gets the isotopic ratio argument completely arse up.
His mass balance formula relies on several false assumptions, the most significant of which is that the outflow is neither constant nor uniform. Different sinks have different exchange rates and and swap ratios.
But more compellingly, he does not remotely adequately address the powerful evidence for the mainstream understanding, which I’ll list again and more thoroughly.
250 years ago the millennia-long natural equilibrium was disturbed and a rise in atmospheric CO2 occurred.
1. The onset, timing, velocity and acceleration of atmos CO2 correlates precisely with emissions.
2. The total anthro emitted in that time is twice the atmospheric increase:
ΔAtmos CO2 = Human emissions – Net sinks
Berry fails to address this mass balance equation without asserting the his flawed-assumption model.
3. Observed sinks have increased in this period, and Berry offers no compelling observational evidence the contrary, once again asserting his flawed model to argue that there *must* be natural sources.
Confronted with empirical observations that undermine his thesis, he dismisses the entire research field in favour of his model.
4. The trend in atmospheric isotopic ratio change for both ¹³C and ¹⁴C matches the rise in fossil fuel-burned CO2 (bar nuclear test spikes). There is no known natural sink that can produce this effect, and the known sinks corroborate the anthro origin (eg, ocean CO2 is increasing, and the isotope ratio changes match the atmosphere).
Berry confirms the already known single molecule residence time with his post-nuclear test computation, and then asserts this confirms his model/equation. This line of argument doesn’t address the flaw in his assumptions, nor adds anything new to general understanding.
5. Berry (to my knowledge) does not explain O2 depletion over time. O2 depletion is a direct effect of burning, and nothing has been burned as much as fossil fuels.
For his model to work, his ghost natural source would need to be either a catastrophic, planetary-scale collapse of the biosphere (massive forest burning and accelerated soil decay) or extreme volcanism — none of which is observed. A volcanic source is instantly disproven by the steady drop in atmospheric oxygen, while a biosphere source is disproven by satellite observations showing a net greening of the planet. Already mentioned is the observation that oceans have been gaining, not outgassing CO2.
Berry’s thesis suffers from flawed assumptions, ignorance or dismissal of real-world exchange rates with various sinks/sources, a model that treats the carbon cycle as a black box with a simplistic formula, empirical observations that fatally undermine it, and circular reasoning that asserts his equation instead of meeting the significant problems with it.
“jumping to conclusions that support your preconceived notions”
Obviously that’s not what’s happening here. I’ve read up substantially on this topic over 20 years.
An AGW skeptic took a deep dive into the topic, if you’re interested. It’s hard to find a more thorough analysis from a non-expert.
https://www.ferdinand-engelbeen.be/klimaat/co2_origin.html
https://www.ferdinand-engelbeen.be/klimaat/co2_variability.html
Nate,
Not all CO2 will have either carbon 13 or carbon 14. So that alone doesn’t prove anything. A c12 might have been recycled 100s of time by nature before it is analysed.
Can’t you cope with even the most simple of concepts. Is that why you follow the sheep?
> Not all CO2
Not all men abuse women either:
https://www.theguardian.com/politics/2025/sep/19/go-to-trope-how-the-far-right-are-exploiting-violence-against-women-and-girls
But Grauniad. But Grauniad. But Grauniad.
In any event, Eldrosion was right:
https://www.drroyspencer.com/2026/08/uah-v6-1-global-temperature-update-for-july-2026-0-48-deg-c/#comment-1751021
Contrarians are very good at forcing open doors.
“Not all CO2 will have either carbon 13 or carbon 14. So that alone doesn’t prove anything.”
Main isotope of C is 12. So you are confused, Anon.
Norman,
If I could capture a couple of molecules of CO2 can you tell me if they were many made or natural,?
Isotope analysis tells us a lot.
Fossil fuels completely lack C14, while natural CO2 has it. And they differ in C!2/C!3 ratio.
No one is claiming there is no CO2 due to fossil fuels in the atmosphere. It is just that most of the CO2 is due to nature and most of the increase is due to nature.
As always, you ignore contradictory isotope evidence that showed Fossil Fuel Carbon built up in the atmosphere.
More than that, Troglodyte hides his non sequitur behind an “and”, in “most of the CO2 is due to nature and most of the increase is due to nature”.
That most CO2 input is natural doesn’t mean our current increase is natural. It’s like saying high cholesterol is natural because most of it is produced by your liver.
More strange points by Edwin X Berry in a later paper:
“Furthermore, the argument – that because cumulative human carbon exceeds the measured carbon level proves human carbon caused all the increase – is not valid because cumulative natural
carbon is much greater than cumulative human carbon, and if natural carbon did not flow rapidly out of the atmosphere the measured carbon level would be much greater than the measured
carbon level today. So, that argument omits proper account of the flow of human carbon out of
the atmosphere.
Another invalid argument used to support the IPCC basic assumption is because nature absorbs
human carbon from the atmosphere, therefore nature cannot add carbon to the atmosphere. This
argument neglects the physics model superposition principle that explains why the natural carbon cycle is independent of the human carbon cycle.”
What neither Edwin X Berry or stephen p anderson can understand about logical thinking, is that CO2 emission and that which is absorbed is a continuous process, there is not a cumulative natural flow. CO2 is emitted by some parts of the ocean and absorbed at other places. It is a continuous process. He uses some gibbly-gook nonsense logic about residence time, how long emitted CO2 reamins in the air. He does not understand what is meant by man emitted CO2 lasting 100 years. This does not mean that the CO2 emitted by mankind is just lingering in the air, it means that the amount we added would take 100 years for sinks (at net rate of around 2 PPM a year) to take in all the carbon dioxide emitted by humans. Not that human emitted CO2 sits in the air. That is why all the math he does is pointless.
Nature acts (currently) as a CO2 sink removing around 2 or so PPM of the human emitted 5 PPM. The net gain by mankind emission is 2 to 3 PPM a year and this will accumulate as nature is only taking out half of what humans emit. Berry’s whole argument is terrible logic and his points are not real good.
https://www.reddit.com/r/climatechange/comments/1o4zoam/what_does_everyone_think_of_this_article_can/
Some opinions of Berry’s paper.
Norman,
Reddit?
“What neither Edwin X Berry or stephen p anderson can understand about logical thinking, is that CO2 emission and that which is absorbed is a continuous process, there is not a cumulative natural flow. CO2 is emitted by some parts of the ocean and absorbed at other places.”
That is exactly what Berry’s model describes, a continuous process. dCO2/dt= Inflow – Outflow describes the process.
“It is a continuous process. He uses some gibbly-gook nonsense logic about residence time, how long emitted CO2 reamins in the air. He does not understand what is meant by man emitted CO2 lasting 100 years. This does not mean that the CO2 emitted by mankind is just lingering in the air, it means that the amount we added would take 100 years for sinks (at net rate of around 2 PPM a year) to take in all the carbon dioxide emitted by humans. Not that human emitted CO2 sits in the air. That is why all the math he does is pointless.”
Now this is gibberish. Human CO2 has the same Te as natural CO2. Therefore, they flow through the atmosphere independently and indistinguishably.
“Nature acts (currently) as a CO2 sink removing around 2 or so PPM of the human emitted 5 PPM. The net gain by mankind emission is 2 to 3 PPM a year and this will accumulate as nature is only taking out half of what humans emit. Berry’s whole argument is terrible logic and his points are not real good.”
These are statements without any mathematical basis and no solution to the differential equation above which describes CO2 in the atmosphere. I asked you to show your math and all you do is make blind religious statements.
This is a little unclear:
“He uses some gibbly-gook nonsense logic about residence time, how long emitted CO2 reamins in the air. He does not understand what is meant by man emitted CO2 lasting 100 years. This does not mean that the CO2 emitted by mankind is just lingering in the air, it means that the amount we added would take 100 years for sinks (at net rate of around 2 PPM a year) to take in all the carbon dioxide emitted by humans. Not that human emitted CO2 sits in the air. That is why all the math he does is pointless…”
A single molecule of anthro emitted CO2 takes on average 4 to 5 years to leave the atmosphere once emitted. Same with naturally emitted molecules.
But because anthro emitted molecules can be stored temporarily in the ocean and spat back out, it would take a few decades to completely clear the atmosphere of anthro CO2 molecules if emissions ceased entirely. Long term, or permanent sinks would eventually take it all out.
The excess CO2 in the atmosphere would take centuries to millennia to return to natural levels.
The biosphere sinks do not distinguish between natural and anthropogenic CO2. Human emissions are the cause of the rise in the last 200 years. This is now excess CO2 that has accumulated faster than the natural sinks can put away. The long relaxation time has nothing to do with the source of the molecules, only to do with the ability of natural sinks to process CO2 above the natural, equilibrium baseline.
Berry doesn’t confuse anything with anything. This idea of residence time is highly misunderstood. There is no “accumulation.” Those are physical concepts that have no relation to reality. IPCC calls residence time, turnover time. The solution to the differential equation involves “e folding” time which is (1-1/e) time. 1-1/e is equal to 0.693. So eTime is the time it takes for the atmospheric CO2 level to go 0.693 the distance from the level to the balance level. Right now, level is 430 ppm. Balance level is some level above this defined as inflow times eTime. So, if total inflow is about 5ppm + 104.5 = 109.5ppm then the balance level is 109.5ppm x 4=438ppm. However, we don’t know what eTime actually is. IPCC estimates it between 3.5-5 years. I think it is a little larger. We don’t know, but Berry proves in his three papers that human eTime and natural eTime are the same. So, human CO2 doesn’t accumulate in the atmosphere.
“There is no “accumulation.” Those are physical concepts that have no relation to reality”
So no steady rise from 280ppm to 427ppm over two centuries. Gotcha.
Berry’s main flawed assumption is to equate residence time of a single molecule to relaxation time of the mass of excess CO2 above the equilibrium baseline.
His model presumes a one way flow of carbon into and out of the atmosphere, whereas the reality is the flow is bidirectional.
Because the biosphere and ocean is a dynamic, bidirectional equilibrium pump, it continuously swaps molecules back and forth with the air in balance with baseline conditions (such as happened for thousands of years prior to the industrial revolution). By treating the atmosphere as a simple, single-pass bucket, Berry’s model fails to see that while individual human carbon molecules are quickly shuffled into sinks, the ocean is forced to spit older, natural molecules back into the sky to maintain balance. The specific molecular ‘identity’ changes, but the total volume of water in the bucket continues to pile up solely because of the human tap.
Even more fundamentally problematic is the simple mass balance equation, where twice the accumulated atmos CO2 since the industrial revolution has been emitted due to human activity.
In order for the total human contribution to be greater than the total atmospheric accumulation, the biosphere HAS to be a net sink.
There is no way around this straightforward arithmetic, and Berry has no answer for it.
This is such a flawed model. First, there is no accumulation. If you have a hose with running water going into a tank with a constant level of water with a drain and outflow, and you increase the inflow there will be a new level based on inflow. Inflow sets the level. The outflow will increase too based upon height of the water. When inflow equals outflow then level stops rising. (Look at any fluid dynamics textbook.) There is no relaxation time above an equilibrium base. The differential equation for the atmosphere is
dCO2/dt = Inflow – Outflow
When you solve this equation your relaxation model above an equilibrium base falls apart. You can’t just make up a solution that fits your narrative. That narrative (the math) only works if you completely omit natural emission. If you want to be stubbornly foolish and ignore the math, then who is the ijit? Presenting a model that has no basis in nature and can’t describe anything is what propagandists do. To be honest it doesn’t matter if you don’t accept it. The math is the math.
“In order for the total human contribution to be greater than the total atmospheric accumulation, the biosphere HAS to be a net sink.”
Human CO2 moves through the biosphere like natural CO2. Human CO2 moves to the surface ocean and the deep ocean and land. But it does it with the same eTimes as natural CO2. Berry calculated all of this in his third paper. He used the same eTimes as the IPCC in their carbon cycle model. There were four differential equations:
dCO2/dt(atm), dCO2/dt(surface ocean), dCO2/dt(deep ocean), and dCO2/dt(land). All four equations are independent linear differential equations and describe dCO2/dt for each system. He falsified the IPCC carbon cycle model using their eTimes.
You quoted me there but didn’t address the math or the point.
If anthro CO2 emitted to the atmosphere is double the amount that stays in the atmosphere, then the biosphere/oceans have to be a net sink.
It’s the most basic math and should end the conversation.
Berry has no answer for this except to point to his model and claim it has all the answers. I’m not surprised you mirror his blind spot.
His model is silent on this – and many other fatal challenges to it – such as the fact that natural reservoirs have increasing, not decreasing CO2. Berry ignores these challenges. He just circles back to his formula as if these issues don’t matter.
Same as you are doing now.
The simple issue of mass balance (ΔAtmos CO2 = Human emissions – Net sinks) is unanswered and will remain so. You don’t realise it, but you are ignoring this conundrum and pointing to Berry’s model of the carbon cycle and asserting its validity. Berry’s model doesn’t account for this mass balance.
Berry has the wrong model:
“If you have a hose with running water going into a tank with a constant level of water with a drain and outflow”
Berry’s math only works if carbon leaves the planet through an open drain. It fails in reality because the carbon cycle is a closed loop where reservoirs exchange with each other, and the 4-5 year residence time for a single molecule travelling in one direction – into and out of the atmosphere – entirely fails to account for the net changes occurring while reservoirs pump CO2 into and out of each other.
Berry’s model is an open system where carbon leaves it. The real word is a closed system where carbon never leaves. He’s only looking at a portion of the real world carbon cycle and building his thesis on that.
“And you increase the inflow there will be a new level based on inflow. Inflow sets the level. The outflow will increase too based upon height of the water.”
When Berry’s model becomes a series of reservoirs passing water back and forth towards each other on different time scales, it will start to look like reality. It will also account for the fact that CO2 is increasing in natural sinks (ocean/biota etc).
Berry’s calculations could be wonderfully elegant and perfectly logical, but as the results end up rejecting measured reality they are no better than thought bubbles on a whiteboard.
So, your model is half of all human CO2 ever emitted has stayed in the atmosphere. It has stayed in the atmosphere since the 1700’s. Explain how it did that?
“Berry’s math only works if carbon leaves the planet through an open drain. It fails in reality because the carbon cycle is a closed loop where reservoirs exchange with each other, and the 4-5 year residence time for a single molecule travelling in one direction – into and out of the atmosphere – entirely fails to account for the net changes occurring while reservoirs pump CO2 into and out of each other.”
So, you’re saying this differential equation,
dCO2/dt = Inflow – Outflow
incorrectly describes carbon flow through the atmosphere?
“When Berry’s model becomes a series of reservoirs passing water back and forth towards each other on different time scales, it will start to look like reality. It will also account for the fact that CO2 is increasing in natural sinks (ocean/biota etc).
Berry’s calculations could be wonderfully elegant and perfectly logical, but as the results end up rejecting measured reality they are no better than thought bubbles on a whiteboard.”
This is the Bern Model. You believe the Bern model is correct, and natural CO2 is different from human CO2, they have different eTimes and nature can distinguish the two?
“So, your model is half of all human CO2 ever emitted has stayed in the atmosphere”
Not at all. Anthro CO2 is responsible for the NET rise over the long term. Individual molecules (of any source) enter and leave the atmosphere on an average of 4 to 5 years.
Berry takes this 4-5 year residence time for individual molecules and applies it to everything.
“So, you’re saying this differential equation,
dCO2/dt = Inflow – Outflow
incorrectly describes carbon flow through the atmosphere?”
Absolutely.
I’ll try an analogy, and I’ll stick with the one-way flow he uses for simplicity.
Your employer pays you $2000 a month, and you have an automatic transfer moving $2000 a month from that account to another. This goes on for years, ad is as steady as a rock.
Now you get a side hustle going, and it nets you $100 a month. You keep getting $2000 a month from your regular job, and you spend exactly $2000 a month. And you put the $100 a month in the account your get your wages paid into.
Berry would say the cause of the increase is mostly because of your employer raising your wage, and only a tiny bit to do with the $100 side hustle. He sees $2100 going into the account each month, and then apportions the increase according to the ratio of inputs.
With his elegant equations, you learn that your employer has increased your wage by $95 a month, and your side hustle is only responsible for $5 of the monthly increase to your bank account.
Someone urges you to look at your wage receipts to verify you got a raise, but Berry is so convincing that you don’t feel the need to do that.
“I’ll try an analogy, and I’ll stick with the one-way flow he uses for simplicity.
Your employer pays you $2000 a month, and you have an automatic transfer moving $2000 a month from that account to another. This goes on for years, ad is as steady as a rock.
Now you get a side hustle going, and it nets you $100 a month. You keep getting $2000 a month from your regular job, and you spend exactly $2000 a month. And you put the $100 a month in the account your get your wages paid into.
Berry would say the cause of the increase is mostly because of your employer raising your wage, and only a tiny bit to do with the $100 side hustle. He sees $2100 going into the account each month and then apportions the increase according to the ratio of inputs.
With his elegant equations, you learn that your employer has increased your wage by $95 a month, and your side hustle is only responsible for $5 of the monthly increase to your bank account.
Someone urges you to look at your wage receipts to verify you got a raise, but Berry is so convincing that you don’t feel the need to do that.”
No, that scenario isn’t Berry’s model. For inflow and outflow to reach equilibrium you would eventually be pulling out $2100 each year. d$/dt=0. So, you’d be pulling out your $2000 plus your side hustle of $100. Look, this model is standard classical physics, fluid dynamics. Why do you want to deny classical science?
I’m not denying classical science, I’m defending it against a model that completely misunderstands it.
The fluid dynamics model only works if the atmosphere is a pipe draining into an infinite, bottomless void. But the Earth is a closed system. The ‘outflow’ from the atmosphere goes directly into a finite reservoir, the ocean. In real fluid dynamics, when you pump fluid into a closed, connected system, the receiving reservoir fills up and builds back-pressure. The ocean isn’t a bottomless drain, it’s a tank that is visibly filling up and acidifying right now. We have the measurements to prove it.
The reason dCO2/dt hasn’t reached zero is because the ocean cannot absorb the backlog fast enough. You can’t use an equation for an open pipe to describe a closed loop.
And still you are doing exactly what I said you would, and this mirrors what Berry has been doing for years.
I asked you to explain why the mass balance equation that requires the bisophere to be a net sink doesn’t work. You didn’t do it. You just pointed back to the model.
Berry has never had an answer for this. It’s fatal to his thesis and he just re-asserts his thesis in response, as you do here.
Berry never deals with the fact that the known sinks he says must be primarily responsible for atmospheric increase are not losing CO2 but rather taking more on.
I listed these as part of a longer list that refutes his thesis.
Until Berry (or you) can answer this without pointing back to his model, then there is nothing to concede to. The fatal challenges remain unanswered, and the mainstream thesis remains far better corroborated by empirical reality.
Here, I’ll ask you now, directly, to take those two challenges on, ad actually respond to them, explaining in physical terms what is *really* happening, without just reasserting Berry’s equations.
And observe yourself, please, as you fail to do that. Please notice how you skip the meat of these challenges and simply reassert Berry’s model.
“So, you’re saying this differential equation,
dCO2/dt = Inflow – Outflow
incorrectly describes carbon flow through the atmosphere?
Absolutely.”
OK, so give us your differential equation that describes carbon flow through the atmosphere.
OK, so you think the sinks are backlogged. All the sinks are the oceans, soils, wetlands, forests, grasslands, peatlands, and ice. And you disagree with the analogy of outflow is proportional to height (partial pressure and mass) and that the number of collisions will increase and you disagree with Henry’s Law of partial which explains ocean acidification. So, your differential equation is what?
dCO2/dt= Inflow – what?
“I asked you to explain why the mass balance equation that requires the bisophere to be a net sink doesn’t work. You didn’t do it. You just pointed back to the model.”
You seem to be talking out of both sides of your mouth. On the one hand you’re saying the biosphere (which includes the ocean) is a net sink and then on the other hand you’re saying the biosphere is closed, the ocean is clogged, the drain is clogged. It can’t accept any more CO2, even though it is acidifying, which is evidence to the contrary.
“Not at all. Anthro CO2 is responsible for the NET rise over the long term. Individual molecules (of any source) enter and leave the atmosphere on an average of 4 to 5 years.”
No, human CO2 is responsible for part of the net rise. It can’t be responsible for all of it or even most of it. Most of the net rise is due to natural emissions based on differential calculus. Back to your analogy, the correct analogy is you’re putting $2000 per month in the bank and taking out $2000, so d$/dt=0. You are living on 100% per month. Then you get a side hustle and start putting $2100 per month in the bank. You will start taking out $2025, then $2050 until you are taking out $2100 per month and d$/dt=0 again. So, you’re spending has adjusted.
There is no evidence that the planet’s sinks are clogged. Outflow is proportional to level and as level increases, outflow increases because partial pressure increases and collisions increase.
I said:
“I asked you to explain why the mass balance equation that requires the bisophere to be a net sink doesn’t work. You didn’t do it.”
You said:
“You seem to be talking out of both sides of your mouth. On the one hand you’re saying the biosphere (which includes the ocean) is a net sink and then on the other hand you’re saying the biosphere is closed, the ocean is clogged, the drain is clogged. It can’t accept any more CO2, even though it is acidifying, which is evidence to the contrary.”
Which again does not answer the mass balance issue. Instead you query some alleged doubletalk.
I never said the biosphere is closed, I said it is filling up and pushing back. It can’t take ALL the extra CO2 pumped out by humanity, it absorbs roughly half. This is the NET balance, which works on different timescales to the residence time of single molecule.
Anthro CO2 molecules quite literally get absorbed by the ocean and get spat back out without being changed. So a molecule can go from an industrial chimney to the sea and back from the sea to the atmosphere. Berry’s equations don’t track that, which is why he could never understand why it would take decades to remove every anthro CO2 molecule pumped out in a given year. His entire model is built on that 4-5 year residence time of a molecule in a one-way flow.
I asked you to note that you did not deal with the mass balance issue. Seems you didn’t do that, so here I am telling you yet again what I predicted you’d keep doing way upthread. Because Berry has no response to this other than asserting his model, you do what he does.
If anthro emissions are twice the amount of CO2 actually accumulated in the atmosphere, then the only possible source of the net rise in atmos CO2 can be anthro. The straight arithmetic allows no other possibility.
The backdrop for this is the equilibrium prior to the industrial revolution, where for thousands of years the biosphere pumped 800Gt of CO2 between the atmosphere and sinks every year. Anthro emissions perturbed that equilibrium, and the biosphere is only able to absorb half the perturbation.
If a balanced system suddenly gets a surplus from another source, then it is not the system that is responsible for the change in balance; the system only responds to it.
And that leads to the other main fatal flaw in Berry’s theiss – the system is not losing CO2 from its short-term reservoirs to the atmosphere, it is gaining CO2 IN those reservoirs.
Berry’s elegant equations determining inflow from natural sources is completely belied by observations of those sources.
Berry completely ignores these empirical observations that are devastating to his theory. And thus, so do you.
Carbon cycle equations describing reservoir exchanges on different timescales:
https://unfccc.int/resource/brazil/carbon.html
“Back to your analogy, the correct analogy is you’re putting $2000 per month in the bank and taking out $2000, so d$/dt=0. You are living on 100% per month. Then you get a side hustle and start putting $2100 per month in the bank. You will start taking out $2025, then $2050 until you are taking out $2100 per month and d$/dt=0 again. So, you’re spending has adjusted.”
The correct analogy starts with an independent source of monthly income (your employer/the natural world), and the same amount automatically transferred to your spending account immediately your pay lands (the natural sinks). This is the situation prior to the industrial revolution, when steve starts a business and builds a factory.
Let’s say that you set your transfer from income to spending account to be 50% of the excess in the spending account.
First month your side hustle generates $100 and $50 is transferred out. Next month you generate the same (for simplicity), and now half of $150 is transferred, leaving you with $75 in your income account.
This excess keeps building each month.
It will never get back to the equilibrium of zero excess while you keep generating any amount at all and depositing it in there.
But you have been successful in your enterprise. You actually deposit a little more each month, and, crucially, the acceleration of the excess in your income account precisely matches your accelerated input.
Clearly, it is your side hustle that is responsible for the excess as well as how fast it rises or falls, as proven by the direct correspondence of the rate of change in the excess amount in the account.
This is not a direct analogy of the carbon cycle; that would entail multiple accounts exchanging funds with each other and zero spending. It is a simple accounting analogy to help pinpoint what it is that is perturbing the prior equilibrium between income (inflow) and spending (outflow).
In the real world we have receipts for each account and forensic analysis. We know that your employer has not started paying you more, and that the excess in the income account was generated purely by you.
stephen, I think that if I asked where the natural CO2 is coming from, you would say it doesn’t matter, because of Berry’s math.
But it absolutely does matter when we have been inventorying the gain of CO2 in those reservoirs.
There is one reservoir of carbon that we know is being depleted – the lithosphere; the geological reservoir from which we take fossil fuels.
The mass transfer is going from the geological reservoir to the other reservoirs, and the first stop is the atmosphere. This ongoing pulse, this injection of carbon from that reservoir into the atmosphere is then buffered into the other reservoirs at different rates. Those reservoirs are unable to keep pace with the ongoing injection, which is why the atmospheric reservoir is increasing.
So far the ocean has kept a fairly steady pace, absorbing a relatively fixed fraction of excess CO2 (not anthro; excess – anthro causes the excess, but fast overturning dilutes the anthro pulse with natural CO2).
Here’s the arithmetic for mass balance for an example year.
Atmospheric increase (16.5Gt CO2) = Human input (36.6Gt CO2) – Nature’s net absorbed (20.1Gt CO2)
or
Human input (36.6Gt CO2) – Atmospheric increase (16.5Gt CO2) = Nature’s net absorbed (20.1Gt CO2)
Now, how could Berry’s math be explained counter to this mass balance equation?
For this to be falsified, total natural sources need to be, every single year, larger than (sinks + anthro emissions) by the exact amount of the rise.
And this needs to happen:
1. Every. Single. Year.
2. Exactly at the same time we started burning fossil fuels
3. At the same velocity as our consumption of fossil fuels
4. At the same acceleration of our consumption of fossil fuels
5. From a source we’ve never identified
6. That depletes isotopic ratios of both ¹³C and ¹⁴C
Anthro CO2 does all that. Occam’s razor applies so heavily there’s nothing left to cut.
Maybe we can just take this one step at a time. You are good at spitting out tons of propaganda to match your narrative.
(1)I asked you to offer a differential equation for the atmosphere and you spit out propaganda to match your narrative. What is your differential equation?
dCO2/dt = what?
(2) You do agree we can use an eTime or a turnover time of 4-5 years. Is that reasonable?
(3) The ocean doesn’t spit CO2 right back out. It has an eTime too just like the atmosphere, just like land, just like deep ocean. Or you don’t believe IPCC either?
(4) It appears you do agree that human emission is about 4.5% of total emissions? Am I correct?
“Let’s say that you set your transfer from income to spending account to be 50% of the excess in the spending account.
First month your side hustle generates $100 and $50 is transferred out. Next month you generate the same (for simplicity), and now half of $150 is transferred, leaving you with $75 in your income account.
This excess keeps building each month.”
That’s not exactly how nature works. Outflow is a random process based on the number of collisions that are proportional to mass that is proportional to pressure. It can’t take half the human mass every year and all the natural mass. Doesn’t work that way. Sure, human emissions add to the level and human emissions are rising. Berry’s theory says so. But based on Berry’s third paper which takes into account the CO2 that goes into the surface ocean and land and eTimes from the IPCC (most recent AR) that atmospheric human CO2 can’t be any more than about 25% of the rise. That’s about 30-35ppm. Also, the excess isn’t building each year. It turns over. Emissions set the balance level. Level tends toward the balance level and eTime sets the rate. I’m trying to answer your question by explaining the model to you, but you refuse to accept it. You only want to accept an answer that fits your narrative.
Let’s take a closer look at your analogy. I’ll even add to your side hustle every month:
In the beginning $2000 in and $2000 out. d$/dt=0
Then, $2100 in and $2050 out. d$/dt=$50
Then, $2105 in and $2077.5 out. d$/dt=$27.5
Then, $2110 in and $2093.8 out. d$/dt=$16.2
Then, $2115 in and $2104.4 out. d$/dt= $10.6
Is that what we’re seeing?
Let’s try your analogy a different way:
Suppose initially $2000 in, $2000 out. d$/dt=0
Then, $2100 in $2050 out. d$/dt=$50
Then, $2105 in $2052.5 out. d$/dt=$52.5
Then, $2110 in $2081.3 out. d$/dt=$28.8
Then, $2115 in $2098.1 out. d$/dt=$16.9
Still not what we’re seeing, is it? I’m trying to be open minded here.
“(1)I asked you to offer a differential equation for the atmosphere and you spit out propaganda to match your narrative. What is your differential equation?
dCO2/dt = what?”
I already linked you:
https://www.drroyspencer.com/2026/08/uah-v6-1-global-temperature-update-for-july-2026-0-48-deg-c/#comment-1751482
The math here (algebraic decay curve) accounts for the different exchange rates of the various carbon reservoirs after an initial pulse of CO2 into the atmosphere. Berry treats the carbon cycle as having two reservoirs and no exchange, only a single direction flow through. The Bern model (for example) has multiple differential equations behind their final result – which you can see at the link, as well as some explanation.
Here’s an early paper with more detail on the carbon cycle math.
https://onlinelibrary.wiley.com/doi/pdf/10.1034/j.1600-0889.1996.t01-2-00006.x
Don’t ask me to parse it. Calculus is way beyond me.
“(2) You do agree we can use an eTime or a turnover time of 4-5 years. Is that reasonable?”
Yep, for only one metric – the residence time of a single molecule (of any source) of CO2 in the atmosphere before being taken up by another reservoir.
“(3) The ocean doesn’t spit CO2 right back out. It has an eTime too just like the atmosphere, just like land, just like deep ocean. Or you don’t believe IPCC either?”
The ocean has multiple eTime, from the surface (a few years), to the upper layer (decades), to the deep ocean (centuries to millennia).
The quick-exchange time of a few years is relevant to counting how many anthro molecules are in the atmosphere at any given moment. But this doesn’t account for the MASS of CO2 lingering throughout the fast turnover. If we stopped emitting, after 50 years all the anthro CO2 would be gone (‘permanently’ mixed out by the 2nd layer of ocean), but there would still be a net concentration of atmospheric CO2 above equilibrium that would take longer to bleed into the long-term reservoirs.
Berry doesn’t get that. He thinks we stop emitting and in 4 years we’re back to equilibrium.
“(4) It appears you do agree that human emission is about 4.5% of total emissions? Am I correct?”
Yes. Natural emissions on an annual basis are about 95% of total.
Where Berry diverges from the mainstream is how he accounts for the sinks, which he sees as a single, unified box-model, with only one sink rate and no exchange. He categorically rejects the view that different reservoirs have different sink rates that affect the relaxation time of a pulse into the atmosphere.
“Then, $2100 in and $2050 out. d$/dt=$50
Then, $2105 in and $2077.5 out. d$/dt=$27.5
Then, $2110 in and $2093.8 out. d$/dt=$16.2
Then, $2115 in and $2104.4 out. d$/dt= $10.6”
That’s not the model I wrote.
You set your income account to transfer 50% of your side hustle income to your spending account. Seems your side hustle increases by $5 a month, so:
Then, $2100 in and $2050 out. d$/dt=$50
Now you have $50 in the income account
Then, $2105 in and $2052.5 out. d$/dt=$52.5
You have $102.50 left after your side hustle has grossed $205
Then, $2110 in and $2055 out. d$/dt=$55
Side hustle gross $315 leaves $157.50
Then, $2115 in and $2057.5 out. d$/dt= $57.5
Excess in your income account (the atmosphere) is half your gross side hustle earnings. Yes, that is what we see.
Why is the system set up to transfer half your side-hustle income? Why did I put this constraint there?
Because in real life the oceans don’t take on the full pulse of the excess in the atmosphere, year by year. Year by year the biosphere sinks (about) half the excess emissions.
And we know this because CO2 in the oceans actually is increasing.
This is one of the fatal challenges to Berry’s model that you have been completely silent about while I’ve responded to pretty much everything you throw my way.
As predicted days ago, you have not even mentioned this, let alone replied to it. Berry also avoids this. He simply does not contend with empirical evidence that fast sources for CO2 (sea surfaces/land vegetation) is gaining, not losing CO2.
Assuming you’re never going to directly deal with the challenges to Berry’s thesis, I’ll just repeat the most succinct version of them and let this be.
——————————————————–
Here’s the arithmetic for mass balance for an example year.
Atmospheric increase (16.5Gt CO2) = Human input (36.6Gt CO2) – Nature’s net absorbed (20.1Gt CO2)
or
Human input (36.6Gt CO2) – Atmospheric increase (16.5Gt CO2) = Nature’s net absorbed (20.1Gt CO2)
Now, how could Berry’s math be explained counter to this mass balance equation?
For this to be falsified, total natural sources need to be, every single year, larger than (sinks + anthro emissions) by the exact amount of the rise.
And this needs to happen:
1. Every. Single. Year.
2. From exactly the same time we started burning fossil fuels
3. At the same velocity as our consumption of fossil fuels
4. At the same acceleration of our consumption of fossil fuels
5. From a source we’ve never identified
6. That depletes isotopic ratios of both ¹³C and ¹⁴C
7. While known natural sinks are gaining CO2
Anthro CO2 does all that. Occam’s razor applies so heavily there’s nothing left to cut.
“I’m trying to be open minded here.”
I do see that and appreciate it.
For one thing you’re a liar and a propagandist. This is exactly what you wrote:
“Let’s say that you set your transfer from income to spending account to be 50% of the excess in the spending account.
First month your side hustle generates $100 and $50 is transferred out. Next month you generate the same (for simplicity), and now half of $150 is transferred, leaving you with $75 in your income account.
This excess keeps building each month.”
But now since you changed (50% of the monthly side hustle instead of 50% of the excess) it you have another problem. Only half the monthly side hustle gets transferred out and the rest just accumulates. That gives half of your monthly side hustle an infinite eTime. We don’t see that either, do we? If violates the Equivalence Principle.
Yes, the oceans are getting higher amounts of CO2, they have to be due to Henry’s Law. But they were designed to accept it. There is huge alkalinity buffering and there is no bottleneck. And there are also other sinks besides the ocean. Lots of sinks.
So, this is your differential equation:
dCO2/dt = 100% human + %100 nature – (%100 nature + %50 human)
Every year.
You’re going to need to explain how nature does that. You’ll need to explain how nature assigns two different eTimes to CO2 molecules and explain how it differentiates it. We’re not seeing that, are we?
P.S.- Also with your newfound model we would be seeing dCO2/dt growing every year in direct proportion to human emission growing. We are not seeing that either, are we?
“(2) You do agree we can use an eTime or a turnover time of 4-5 years. Is that reasonable?”
Yep, for only one metric – the residence time of a single molecule (of any source) of CO2 in the atmosphere before being taken up by another reservoir.”
That’s what we’re talking about, one molecule multiplied by about 10^43.
“(3) The ocean doesn’t spit CO2 right back out. It has an eTime too just like the atmosphere, just like land, just like deep ocean. Or you don’t believe IPCC either?”
The ocean has multiple eTime, from the surface (a few years), to the upper layer (decades), to the deep ocean (centuries to millennia).”
Well, according to the IPCC there is surface ocean and there is deep ocean. But yes, each reservoir has eTimes. The eTime from surface ocean to atmosphere is about 10 years according to IPCC.
“The quick-exchange time of a few years is relevant to counting how many anthro molecules are in the atmosphere at any given moment. But this doesn’t account for the MASS of CO2 lingering throughout the fast turnover. If we stopped emitting, after 50 years all the anthro CO2 would be gone (‘permanently’ mixed out by the 2nd layer of ocean), but there would still be a net concentration of atmospheric CO2 above equilibrium that would take longer to bleed into the long-term reservoirs.”
If we stopped emitting human carbon then level would fall toward the new balance level. In approximately 4 years it would be within 37% of the balance level. Witin 8 years it would be within 1/e^2 or 14% of the balance level and so on.
“Berry doesn’t get that. He thinks we stop emitting and in 4 years we’re back to equilibrium.”
Berry doesn’t get that, LOL. Let’s see he studied at CalTech(BS), his MS at Dartmouth, and his PhD at Nevada. He has many patents on droplet formation software for cloud prediction used by NWS but somehow, he doesn’t get it.
“(4) It appears you do agree that human emission is about 4.5% of total emissions? Am I correct?”
“Yes. Natural emissions on an annual basis are about 95% of total.
Where Berry diverges from the mainstream is how he accounts for the sinks, which he sees as a single, unified box-model, with only one sink rate and no exchange. He categorically rejects the view that different reservoirs have different sink rates that affect the relaxation time of a pulse into the atmosphere.”
OK, so preindustrial levels were believed to be 280ppm. That gives us natural emissions at about 70ppm. Now they are about 100ppm. How and when did they get there?
“For one thing you’re a liar and a propagandist. This is exactly what you wrote:”
I made an error in my first go around. It’s not half the excess, but half the emissions. If you look up the thread, you’ll see me regularly speaking of the increase being half the emissions, which is what I should have said. I didn’t realize my mistake until you pointed it out just now. The name-calling isn’t necessary.
“So, this is your differential equation:
dCO2/dt = 100% human + %100 nature – (%100 nature + %50 human)”
No, you keep asking me to give the same kind of equation Berry does, presuming this is the right mathematical method to describe the carbon cycle. It isn’t. The proper maths to work out relaxation time includes various different exchange rates at different eTimes. I linked you to that, so you can hardly be telling me what *my* equation looks like.
What were your thoughts on the equations I linked you to? I’ve described the problem with Berry’s math. What do you have to say about the math you requested and I provided? What’s with the silence on that?
“Well, according to the IPCC there is surface ocean and there is deep ocean. But yes, each reservoir has eTimes. The eTime from surface ocean to atmosphere is about 10 years according to IPCC.”
The deep ocean and lithographic reservoirs have eTimes in the hundreds and thousands of years. When the ocean and the biota are buffering CO2 increase, it is these longer term reservoirs that take up some of the partial pressure (pCO2) of the faster reservoirs.
Berry’s thesis all begins with his misunderstanding of the mainstream view of the carbon cycle. Here’s his 2021 paper.
“A basic assumption of climate change made by the United Nations Intergovernmental Panel on Climate Change (IPCC) is natural CO2 stayed constant after 1750 and human CO2 dominated the CO2 increase. IPCC’s basic assumption requires human CO2 to stay in the atmosphere longer than natural CO2.”
No, the mainstream view is that the injection of anthro CO2 is the cause of an excess amount above equilibrium that takes a long time to relax out. It absolutely is not contending that anthro CO2 behaves differently to natural CO2 through the carbon cycle. The language in the IPCC sometimes gives this impression, but it’s just not how mainstream science views the carbon cycle.
Fast exchanges (annual ocean respiration mainly) process natural and anthro CO2 equally, keeping the proportion of athro to natural constant. But fast exchanges do not process ALL the excess above equilibrium. The ‘pulse’ has a relaxation time dependent also on the longer eTime reservoirs.
Berry’s thesis is based on how long a CO2 molecule takes to go through the atmosphere to a sink, mistakenly believing that he’s correcting an IPCC misconception about turnover time for anthro CO2 being different to natural. From the early part of his paper:
“This paper assumes human carbon transferred to the fast carbon cycle stays in the fast carbon cycle forever. This paper focuses on how long human carbon stays in the atmosphere in the fast carbon cycle.”
This is a misguided approach – it mixes up the NET mass of excess carbon with GROSS anthro emissions. Basically assuming that the turnover for a molecule of anthro CO2 is the benchmark for the relaxation time of the NET remaining CO2 (excess above average, includes CO2 molecules regardless of source) in the atmosphere.
“OK, so preindustrial levels were believed to be 280ppm. That gives us natural emissions at about 70ppm. Now they are about 100ppm. How and when did they get there?”
I don’t understand this. Where does 70ppm come from?
Preindustrial concentration = ~280ppm
Preindustrial there is a massive annual exchange between atmos and sinks, the normal respiration of the planet, and those huge Gts of exchange were in equilibrium.
In the geological record previous CO2 changes of ~100ppm occurred on millennial, not decadal time scales.
What Berry asks us to believe is that at after nearly a miullion years of slow rises and falls in atmos CO2, a natural source starts degassing at a rater we;ve never seen, and this occurs at exactly the same time, by some amazing coincidence, as humans start burning coal.
Not only does it start at the same time, this natural source increases at the same rate our own emissions increase, and keeps doing this for a century.
Not only that, the natural source accelerates its degassing as the same rate we increase out emissions.
Not only that, the isotopic signature that comes from burning f/f is matched, somehow, by this degassing source.
Not only that, this source lowers the ratio of oxygen in the atmosphere at a rate consistent with increased burning of fossil fuels, and this decline also coincides with the industrial revolution.
Does this sound credible to you? But it gets worse.
Berry wants us to believe his maths determines a primarily natural source, without ever explicitly naming what that source is.
He refers without committing to other authors suggesting the oceans are responsible. It is the strongest candidate for the quick pulse.
However, the oceans are gaining, not outgassing CO2.
In short, Berry is asking us to believe in an unnamed natural source for CO2 increase that just happens to match the timing, rate, rate of increase, oxygen depletion and isotope depletion of anthro CO2, while being unable to identify that source, which supplies an injection of CO2 at a rate massively outpacing any other atmospheric injection in the geological record.
Anthro CO2 ticks all the. No known natural source does.
If the extraordinary consiulience of empirical evidence doesn’t convince, then Occam’s razor should cut natural sources in a blink.
Stephen,
Been over this with you several times. You dont listen or learn.
This paper showed (first) that the ocean properties prevent it from absorbing increases in atm Co2 rapidly enough to keep it from building up in the atmosphere.
https://climatepositions.com/wp-content/uploads/2014/03/n8._Bolin___Eriksson__1958corrected.pdf
It has built up, agreeing quite well with their predictions from 66 years ago.
But you don’t understand the paper, so simply dismiss it.
That is called argument from ignorance.
“Stephen,
Been over this with you several times. You dont listen or learn.
This paper showed (first) that the ocean properties prevent it from absorbing increases in atm Co2 rapidly enough to keep it from building up in the atmosphere.
https://climatepositions.com/wp-content/uploads/2014/03/n8._Bolin___Eriksson__1958corrected.pdf
It has built up, agreeing quite well with their predictions from 66 years ago.
But you don’t understand the paper, so simply dismiss it.
That is called argument from ignorance.”
Nate,
And I keep explaining to you the paper is wrong in their conclusions. dCO2/dt(atm) takes into account all outflow, all sinks. No one has provided any evidence that eTime has changed.
The best test of any theory is whether it can successfully predict. This paper passed that test.
How bout Berry, what prediction has he made that could test his theory?
Berry’s model almost perfectly predicts CO2 level in the 0.63Te time. We don’t know exactly what Te is or inflow. We are just making our best guesses.
What observations has it correctly predicted, Stephen?
His theory has been around for what, 10 years or more? What observables today did his theory predict 10 y ago?
Does his theory even explain the rise in atmospheric CO2 over the last century?
Does his theory explain the rise of CO2 in the ocean?
Lacking any of that, his theory has no use.
I hate to be alarmist, but these news items are worth noting:
Wildfires have increased by 57% since 2022, with climate change driving more frequent and intense fires, threatening communities and health.
Drought, overuse and climate change are driving a major Colorado River crisis, with proposed cuts threatening water security across the US Southwest.
Seems like way too short a time frame to attribute the increase to much more than natural variability.
I have two friends, a couple, that worried about the collapse of the Antarctic ice sheets until I set them straight about the timeline.
I prefer no alarmism on this blog.
Don’t be an alarmist. Lookup the wildfire of 1910 in Idaho.
Wildfires will continue. Don’t be so quick to attribute them to a minor elevation in temperature. Wildfires threatening or destroying human communities is not actually relative to temperature change, that is relative to humans building in questionable areas. Why do humans build in flood plains, on barrier islands, on mudslide prone hills etc. The reason the Colorado river is a “CRISIS” is because people build and farm in arid areas, depending on the river as a water source. Native Americans left the southwest long ago because changes in weather patterns made the land uninhabitable.
For an interesting history on western lakes, lookup the Idaho State University site on the Lake Bonneville Flood.
Warmer is better,
Lewis Guignard
Best wishes.
I prefer no denialism on this blog, too.
“This systematic review synthesizes findings from 42 studies across global, continental, and regional scales to assess emerging patterns in fire frequency, intensity, and seasonality, and to identify climatic, ecological, and anthropogenic drivers shaping these changes. Across biomes, evidence shows increasingly fire-conducive conditions driven by rising temperatures, vapor-pressure deficit, and intensifying drought, with climate model projections indicating amplification of extreme fire weather this century. Boreal ecosystems show heightened fire danger and carbon-cycle vulnerability; Mediterranean and Iberian regions face extended fire seasons and faster spread rates; tropical forests, particularly the Amazon, are shifting toward more flammable states due to drought–fragmentation interactions; and savannas display divergent moisture- and fuel-limited dynamics influenced by climate and land use. These results highlight the emergence of biome-specific fire–climate–fuel feedback that may push certain ecosystems toward alternative stable states. The review underscores the need for improved attribution frameworks, integration of fire–vegetation–carbon feedback into Earth system models, and development of adaptive, regionally tailored fire-management strategies.”
https://www.mdpi.com/1999-4907/17/1/104
Also
https://www.frontiersin.org/journals/remote-sensing/articles/10.3389/frsen.2022.825190/full
Studentb – Way too many people, businesses, farms, etc in the U.S. southwest and the California from San Francisco Bay down to the border. Many progressives – who presumably are concerned about climate change – have been flocking to Colorado for about 30 years now.
The IPCCs 2021, AR-6, Working Group 1 work generally does not support your level of concern relative to wildfire weather and wildfires (which are much more dependent on human activity outside of CO2 production). Hopefully, AR- will be forthcoming soon. If its conclusions change dramatically from the last, I will be suspicious. 6, 7, or 8 years of data and new research would not be likely to change long term trends and earlier findings. It’s not like we haven’t been looking at this for some time. But I will give it a fair shot.
A question – a warmer atmosphere should be able to carry more water vapor, right? Assuming the same amount or more instability in a warming atmosphere (I think climate change action advocates call for more stormy weather) should we have more snow/rain in the Colorado basin, not less?
Student Duh,
What you mean you “hate being an alarmists” typical Orwellian double speak from you. For something you “hate” you sure spend a lot of time promoting the alarmists narrative.
The wild fires might just be man made, not from Climate, but from poor management, arson, Gavin Newscum policies, the fact that a lot of water is being taken from the rivers for new crops etc etc etc.
Not everything is climate related.
” It is painfully obvious that, despite arm-waving and predictions of doom from climate alarmists, the red-running average curve has a negative trend. ”
Maybe this one, for example?
https://drive.google.com/file/d/1fj9wkFBJHGirBiRDaQfRbs4CLB7QZW2D/view
*
” And a rather steep negative trend since whatever caused the 2024 warming spike. ”
Can the trend for a time series starting high and ending low be positive? That would be new to me.
The Trump administration is doubling down on its ongoing war against our public lands by working overtime to kick native wildlife off federal ranges. The Bureau of Land Management just caved to intense political pressure from the livestock lobby, executing a politically motivated reversal to strip conservation groups of essential bison grazing permits on *your* public land (doesn’t matter what state you live in). Instead of letting the American prairie heal with the species that shaped it, Trump and his Interior Department appointees are bending over backward to prioritize industrial cattle and private commercial interests.
In response to this blatant federal overreach, the Western Watersheds Project, represented by the Western Environmental Law Center, officially filed a federal lawsuit challenging the administration’s unlawful decision this week. The Trump administration invented a vague, bad faith “production oriented” loophole out of thin air to ban America’s great national mammal from public acres, all while catering to corporate agriculture and political donors. (article and image by @michaelhodgesauthor)
Bison evolved alongside these ecosystems, keeping grasslands healthy and resilient in ways that domestic cattle simply cannot match. Conservation groups are taking this administration to court because public lands belong to the public and to the native wildlife that built them, not to a White House willing to sell out our ecological heritage for political favors.
https://www.facebook.com/groups/1539638139935160
Don’t know where I stand on issues like this. As a theist, I believe, as do probably a large number of other inhabitants of planet earth, that all life – and for that matter – the entire cosmos has been created by a Supreme Being (or beings, depending on the faith tradition) who requires a moral code from the highest form of life – Homo sapiens. That code varies wildly among various faith traditions, but generally we are to – at a minimum – respect lower creatures. Most faiths do allow for using them to sustain our lives. In fact, Homo sapiens would not exist without the food, clothing, etc provided by most levels below us. Since we are the predator at the top, we get to call the shots.
So, things like this require a balanced approach, people like meat, and consumed in reasonable amounts, it can sustain us in healthy ways. If we decide we need to preference domestically raised mammals over wild, “curated” animals (buffalo might have gone extinct absent the concerns of the U.S. government and conservation groups), I an ok with that. Let’s try to balance this off. Ranchers also have a right to make a living off their business.
Sometimes, it seems like environmentalists treat humans like “they” (we) are not part of the ecosystem. We are and we are NOT an invasive species. If we desire to protect certain areas to try to keep them in an “untouched by man” state, that’s fine. But that should not be the general rule.
(BTW, we should not use the pejorative term “invasive species”. Species are mobile, as well as are their means of propagation. They will naturally seek out (whether self-aware or not) environments that will support them. Earth’s history shows that. Continents move, land bridges open and close. Some species prosper and some don’t. Some go extinct. That is the way of this world. But if you are still concerned about all this, stop eating sushi. Tuna counts are WAY down. Easy for me, I don’t like sushi.)
Preventing bison from moving around will lead to a reduction in the gene pool and the degradation of the species. Bison and prairie dogs are the best gardeners of the prairie, and no one can replace them in this role.
When we hear stories like this, I don’t know if we’re hearing all the facts, but I am concerned about the preservation of the environment and all species (like most MAGA). I think more people than Trump are involved in the decision. I do trust Trump and his people to make good decisions. But I want everything to be transparent and out in the open. No Fauci crap.
I have no problem with Ie Ireneusz’s Bison and Prairie dog argument. Ranchers HATE prairie dogs. I saw a reality show recently where a rancher was shooting them, flooding them out, gassing them and then blowing up their tunnels. They are bad for his herd and the grass that they need.
But every dispute like this should involve a cost benefit analysis. Economists can do these, even trying to assign values to intangibles. Often, this is not done on environmental questions.
It’s amazing how far off the subject of climate we can get!
Buffalo (the term used for bison) and prairie dogs (often confused with gophers, ie, Richardson’s ground squirrels) are given much more reverence than required, by city folks. Buffalo have no problem taking care of themselves.
https://www.youtube.com/watch?v=UutX80lYkQg
The rancher I worked for was more than happy for me to kill all the gophers I saw. Not only were the little monsters eating grass, but he was fearful one of his cows would step in one of the holes and break a leg. Worse, the gophers attracted coyotes. Coyotes won’t mess with an adult cow, but in calving season the newborns are vulnerable to coyotes.
https://en.wikipedia.org/wiki/Richardson%27s_ground_squirrel
There are thousands of buffalo (250,000 estimated) being properly maintained, both by the Forest Service and commercial operators. Where do you think your “Buffalo Steak” comes from?
Herds are properly “cross-pollinated” to preserve the species. Government agencies monitor the DNA to eliminate the bulls that have been produced from cattle. (Yes, bison and cattle can interbreed.) The effort is to maintain a “pure” bison.
There’s no need to worry about the mighty buffalo.
Now, can we get back to climate?
Over one hundred years ago, Teddy Roosevelt wanted to turn the plateau on the North Rim of the Grand Canyon into a deer hunting preserve. He hired a guy named “Uncle Jim” to hunt and kill all of the mountain lions. He used dogs to tree the cats and then shoot them. He killed over a thousand in about 18 months. The next year there was an explosive growth of deer. A mountain lion eats 2 to 3 a month, so do the math. The year after that there was an extreme famine because too many deer ate everything in sight.
Congratulations Teddy!
https://wildlandtrekking.com/blog/uncle-jim-trail/
Uncle Jim Trail is named after game warden James T. Owen, whom Theodore Roosevelt hired in 1906 after he created the Grand Canyon Game Preserve. During this era, it was widely believed that predators needed to be eliminated in order for prey and other worthy animals to thrive. Even as a conversationalist, Theodore Roosevelt hunted mountain lions. James T. Owen killed many mountain lions in his time at Grand Canyon, in hopes of benefiting the Kaibab deer population. Not soon after, the deer population skyrocketed to over 100,000, and with so many in the area, they destroyed much of the vegetation. This led wildlife managers to realize the importance of the predator’s role in an ecosystem.
The statistic on artic temperature is above average while the temperature present by danish institute is below the average ?
https://ocean.dmi.dk/arctic/meant80n.uk.php
This is not the first time, I observed that .
Thank you for your response.
In the Arctic, the deep-layer tropospheric temperature departure from average can be quite a bit different from the surface air temperature, especially in the summer when the Arctic near-surface temperature is limited in how warm it can get because of the sea ice (or nearly-freezing ocean surface) temperature. -Roy
In addition to what Mr Spencer answered, please note that while DMI’s stats are about 80N+, UAH’s stats are about… 60N+.
Two different worlds.
A nice look at the developing 2026/27 El Nino…
https://i.postimg.cc/28bkZrtN/Climate-Ranalyzer-SST-anoms-080826.png
*
By the way, the Mediterranean sea looks very nice too.
” Move along, nothing unusual! “
Well, I don’t know if I should feel sorry for the Peruvians and Chileans anymore. I guess only because of the drought and the cold.
https://i.ibb.co/JFvKTH40/cdas-sflux-sst-samer-1.png
One the one hand I thank Mr Palmowski for his very honest and sensitive comment above, timestamped on August 8, 2026 at 3:07 AM.
*
On the other hand I’m wondering about his reaction on temperatures in South America right now, compared to what they will experience in a few months, wenn the nice little El Niño boy grows up.
It’s winter now there.
For Peruvians, the most threatening months during an El Niño event are December through April, [i.e. in NH June through October… ], with February and March typically marking the peak danger window.
During this peak rainy season, warm coastal waters trigger torrential downpours, flash floods, and mudslides (huaicos) across northern and coastal Peru.
For the ENSO region visible in the Climate Reanalyzer’s chart, here is a comparison of sea surface temperatures with temperatures inferred by UAH in the lower troposphere above the region:
https://drive.google.com/file/d/1mDFVqX3AXOm-9d8CGfDnez25rMz5md6v/view
*
Trends in °C / decade
– from 1979
— UAH: 0.10 ± 0.01
— HadISST: 0.04 ± 0.01
– from 2020
— UAH: 1.00 ± 0.34
— HadISST: 0.94 ± 0.28
*
We’ll see how the two series develop in the next 12 months.
The typhoon is making landfall in Zhejiang Province in eastern China, south of Shanghai.
https://e360.yale.edu/digest/china-clean-tech-developing-countries
“Chinese solar and wind manufacturers are not only driving a massive buildout of renewable energy in China but also propelling a rapid shift away from fossil fuels in much of the developing world, according to a new analysis.”
Those who assume only the rich countries are adopting renewable energy are wrong.
Nate,
Yet China themselves are still using ~90% fossil fuels in their energy mix. If you stop accepting the party line and think for yourself you might just understanding the true scale of the issue.
re. China’s power production energy mix – about 43% of China’s power generation is from non-fossil fuel sources. You can look at final consumption numbers in different ways, but there is no way by which China is “still using ~90% fossil fuels in their energy mix”
Anon, if you thought for yourself you could understand that a snapshot of the energy mix at the moment is not the story here.
Only because of the money not the environment, to many useful western idiots have paved the way, belt and road.
I’m not sure Mother Earth is “screaming” or asking us to rescue her. Earth has survived asteroid impacts, mass extinctions, ice ages, hothouse climates and enormous changes in atmospheric composition. The planet will be fine.
The question is whether we are making the relatively stable climate in which human civilization developed increasingly hostile to ourselves.
Fire, floods, extreme heat, drought and other climate-related hazards are not messages from nature. They are physical consequences whose risks we can measure, and in many cases we are making them worse.
There is also something here resembling what Nassim Nicholas Taleb calls the Lucretius Problem: our tendency to imagine that the worst thing we have seen establishes some upper bound on how bad things can get. It doesn’t. The largest flood, hottest summer, worst drought, or most destructive wildfire in the historical record is simply the largest we have observed so far. And when the underlying probability distribution itself is changing, relying upon historical experience becomes even more problematic.
Perhaps Mother Earth is simply done with humans, the ultimate invasive species. Homo sapiens has been around for only about 300,000 years, while dinosaurs persisted for well over 100 million years. On geological timescales, we are very recent arrivals. Our technological success should not be confused with evolutionary permanence.
Mother Earth does not need rescuing. We do.
Related: https://www.theclimatebrink.com/p/the-strongest-el-nino-ever
Ark, the only “invasive species” here are the whiny cult kids that can’t face reality.
You’re correct, they do need rescuing….
Where do you get the silly idea that we are making the weather worse, when history proves you wrong.
Ark – I don’t find your argument very convincing. First, we are in an interglacial warming period, so warming is expected. Second, the current ice age that we are in is about 2.5 MY, so the overall trend from here should be cooling. Third, as you pointed out, we began our existence about 300,000 YA and have survived both colder and warmer periods, some with higher CO2 than today. Fourth, I see little evidence around me of changing temperatures, water levels, severe weather that concern me. For example, summer high monthly records are still randomly distributed over our (Cincinnati, Ohio, USA) area throughout our long temperature record (1873-2026). Winter low monthly records DO show the effects of warming – no winter month since December 1999 has set a record. Hurrah! That is not a problem. In fact, it likely is saving lives, since extreme cold kills many more than extreme heat.
So, I am enjoying life and worrying about other things, like potential loss of personal freedom, the growth of socialism and communism, unchecked crime in our Democrat-run cities, our culture being changed negatively by massive illegal immigration, massive debt, government spending and fraud. I believe in a spiritual dimension so I try to keep informed (as I will about climate), do what I can as one citizen about these problems, and pray to a Supreme Being who I believe is responsible for all of creation and has the ability to change history if He so chooses.
Thomas Hagedorn
Maybe you should be more worried that so many blindly follow an extreme liar who intentionally wants some to suffer. Not a good leader. Right-wing liars create false fears so that MAGA will not see the real danger to our system, an Authoritarian who is not held in check by the other branches of Government. A real fear and one occurring as I post this.
If you are MAGA Thomas please watch this video, maybe you will see Trump is not good in any way for our Nation or the World!
https://www.youtube.com/watch?v=mwPPfWHGI38
This person explains very well how Trump is an Anti-Jesus!!
Wow Norman, did you find something else on the Internet you don’t understand?
This is how you function. You find things that support your beliefs, and then believe you’re right! That ain’t maturity. That’s cultism.
You’re unable to think for yourself, and you’re unable to learn. You don’t understand that video is computer generated. It’s “AI”. That’s not even a real person. They used a Black so as to trap you weak WOKE types. Being WOKE makes you feel “holy”.
What you can’t understand is you could use that same video about ANY politician. Just change the name and references to match either Biden, Clinton, Kamala, or Obama. You’re too political to recognize your own hypocrisy. If anyone disagrees with you, they’re automatically wrong. Even in science, if it doesn’t fit your beliefs, it’s wrong. That’s why you still can’t accept simple concepts that Moon does NOT spin, or ice cube can NOT boil water.
Now, what crap will you throw against the wall next?
Oh, yeah, also worrying about the hundreds of millions of Muslims who would have EVERYONE return to the 7th century, hate everyone who is non-Muslim, and, similar to many of the Japanese until August 1945, would gladly die as martyrs in suicide attacks for allah or emperor.
Meanwhile, no one has responded to my observation of local weather and the modest effects I see in our official temperature records from 150 years of intensive use of fossil fuels.
As for Trump, I come here to learn about and discuss climate and weather, not politics (I know, I just went on a rant about things I worry about a lot more than CO2 induced warming).
My post was about risk under a shifting probability distribution. That is why the Lucretius Problem is relevant.
Suppose city X has experienced floods ranging from small to enormous during its instrumental record. The existence of the enormous historical flood tells us nothing about whether an even larger flood is physically possible. More importantly, if climate change alters precipitation intensity, then the probability distribution from which future floods are drawn is no longer necessarily the distribution represented by the historical record.
Observing that city X has experienced extreme weather previously therefore doesn’t rebut my point. It illustrates why relying exclusively upon historical extrema can be misleading.
Ark – Fine, but you can’t have it both ways. Extreme weather MIGHT get worse…or it might lessen. The IPCCs 2013 AR-6, Working Grouo 1 isn’t very concerning. Instead of speculating about the future, I’ll wait to see what AR-7 says. It can’t be too far down the road.
Climate change for dummies: https://ibb.co/RGcH5jQj
Ark – Of course, you are right, IN GENERAL, hence the climate change for dummies reference. But, as I understand it, each form of extreme weather needs to be, and has been defined so that events can be observed and studied. As of AR-6 we either don’t know if events are getting worse or we don’t see it in the CURRENT (pre-2021) record. Hence, I await AR-7.
Just watched on TV news, there is an ongoing typhoon in Philippines. The correspondent dutilly informed the typhoon is very devastating because of Global Warming caused by humans!
According to the established Global Warming concept, which claims that the additional ~150 ppm (parts per million) of CO2 since ~1850, have overhelmed the Earth’s natural cooling trend (the natural cooling predicted by Millutin Milankovitch – a brilliant scientist, whom I very much respect for his devotion to science and for his titanic work), and those the additional ~150 ppm CO2 is the reason of the rapidly accelerating Global Warming phenomenon.
Wait a minute! Since the “Holocene Optimum” , according to the established Global Warming concept, Earth, for long-long ~10500 years was in a natural and accelerating cooling pattern…
*************
It is obvious the entire concept is mistaken!
The “Holocene Optimum” was the coldest, not the warmest period.
The CO2 warming concept is a mistake.
Milankovitch mistakenly predicted cooling, instead of warming.
Milankovitch didn’t say anything about CO2.
It is an orbitally caused warming.
What we do is to explain the new concept.
–
https://www.cristos-vournas.com
SOLAR MINIMUM UPDATE
The August NMME runs are now in (though CFSv2 and CanSIPS have already been updated), and continue the trend of each month showing yet-higher model forecasts of an unprecedented El Nino by the end of the year
https://bsky.app/profile/zekehausfather.com/post/3msoglmiwev2k
How can it be unprecedented when we have no clue about the past?
Does Ian have anything else than local anecdotes and appeals to ignorance?
Has anyone.compared the trend for lower stratosphere with that of lower troposphere ?
Temperature will be much different but how about trends.
E.g.
Will thr lower stratosphere trend in the same direction as the lower troposphere?
Jim
Comparison LS vs. LT, made for years:
https://drive.google.com/file/d/1jFVD4AOyXQXIAotsDflm6ISagb5SpOtb/view
The trend lines are missing, but it’s evident from the series that they go in opposite directions.
Jim [2]
I forgot to add that you can always compare the trends for LS and LT with these two links:
https://www.nsstc.uah.edu/data/msu/v6.1/tls/uahncdc_ls_6.1.txt
https://vortex.nsstc.uah.edu/data/msu/v6.1/tlt/uahncdc_lt_6.1.txt
Not clear to me where alarmists like Binny and Barry studied math. Both have questioned my reference to Roy’s red-running average which I claim shows a negative trend since the high in 2024.
A trend does not have to be a long term statistical average, in fact, in basic calculus it can be found locally by taking the 2nd derivative of the graph equation. The 1st derivative indicates a tangent line to the curve at any point while the 2nd derivative sign indicates whether the tangent line is increasing or decreasing. That is the 2nd derivative indicates the trend of the curve, hence the data in this case.
Of course, visual inspection often reveals that without resorting to derivatives. It is plain to me that Roy’s red-running average curve is trending in a negative direction. Since Roy’s curve indicates how the data is trending, it is clear that global temps are on a downward slope since 2024.
That’s all I was claiming but Barry and Binny felt it necessary to cherry pick a specific meaning of trend. That’s a typical issue with alarmists, unable to see the forest because there are trees in the way.
Robertson is once more a blatant liar.
He wrote above,in his recent post
https://www.drroyspencer.com/2026/08/uah-v6-1-global-temperature-update-for-july-2026-0-48-deg-c/#comment-1751206
” It is painfully obvious that, despite arm-waving and predictions of doom from climate alarmists, the red-running average curve has a negative trend. And a rather steep negative trend since whatever caused the 2024 warming spike. ”
It is absolutely clear that he meant the curve in its entirety, and NOT, as he now wrongly claims right now, only the period following 2024.
*
It is therefore also absolutely clear that I was right in replying to his utter nonsense with my comment
https://www.drroyspencer.com/2026/08/uah-v6-1-global-temperature-update-for-july-2026-0-48-deg-c/#comment-1751233
*
As I wrote often enough, this is a clear hint on Robertson’s permanent denial attitude.
I guess Binny, whose native language is French, and who speaks German since he lives in Germany, is having comprehension issues reading English.
He admits that I posted…
“…the red-running average curve has a negative trend. And a rather steep negative trend since whatever caused the 2024 warming spike. ”
I made it clear that I am referencing a trend since 2024.
In case anyone wonders why I’d claim a negative trend since 2024, it’s because alarmists are freaking out about forest fires and heat waves, seemingly inferring a connection to CO2. Just yesterday, the UN has been fear-mongering, claiming the forest fires, etc., are a sign that we must limit global warming to so many degrees C, as if we have any say in the matter.
Since the peak in 2024, that was likely due to the Hunga Tonga eruption dumping millions of tone of water in the stratosphere, the only place the trend can go is back down to where it was before the eruption. Anyone who thinks the warming trend since 1850 will progress continually due to a trace gas, needs to get out more.
” I made it clear that I am referencing a trend since 2024. ”
This is again a blatant lie.
As are all pseudoskeptics, Robertson isn’t even able to admit the sense of what he himself wrote.
I repeat: It is absolutely clear that he meant the curve in its entirety, and NOT, as he now wrongly claims right now, only the period following 2024.
By the way, Robertson doesn’t even know what a linear trend is, let alone how exactly it is computed.
Gordon,
“Anyone who thinks the warming trend since 1850 will progress continually due to a trace gas, needs to get out more.”
It seems like you’re unaware of scientific basics discovered in the 1800s. Ever heard of Foote, Tyndall and Arrhenius?
As long as we increase atmospheric CO2, Earth will get warmer. This is textbook-level atmospheric physics. The effect isn’t linear but logarithmic so with constant CO2 emissions, the warming would be (slightly) less for each additional CO2 increase than for the previous one. It will continue though. We simply have to deal with this now (or very soon) to avoid making the future a nighmare for ourselves, not to mention future generations.
Gordon,
You clearly don’t know what a trend is and you obviously don’t even know what a 2nd derivative is. For your information, the 2nd derivative of the UAH graph is NOT negative all the way from 2024 to now. Anyone (well, not you) can see that the 2nd derivative of the red curve is positive since around the transition from 2024 to 2025. It’s been positive for a year and a half now. It’s the 1st derivative that’s been negative since 2024 up until now.
If you are really interested in the trend, I suggest you visit https://datagraver.com/climate-data-set-uah/
“That’s all I was claiming but Barry and Binny felt it necessary to cherry pick a specific meaning of trend”
When dealing with time series data the word ‘trend’ is constrained to mean long-term statistically significant trajectory.
This isn’t cherry-picking or even nit-picking, it’s being accurate with language in a given context.
ark…”The largest flood, hottest summer, worst drought, or most destructive wildfire in the historical record is simply the largest we have observed so far”.
***
I am still awaiting, breathlessly, your explanation for how a trace gas is causing these issues. You seem more focused on discrediting skeptics through remote philosophical innuendo than applying science.
There is a negative trend from 2024 because you are starting your analysis at the peak of an El Niño and comparing it to a La Niña period.
That is blatant cherry-picking, Gordon.
We saw similar short-term declines from 1998–2000 and 2016–2018, and we now know those were temporary fluctuations within the broader warming trend. Global temperatures continued to rise after both periods.
Given that Gordon has been discussing climate change science on blogs since at least 2008, he should know better.
Once again, you failed to grasp the meaning of trend in the context in which I presented it. I was referring only to the red-running average curve which has obviously trended negatively since its peak in 2024.
You guys are trying to apply the overall positive trend from 1979 till present to what I said and that suggests to me that you are all anal-retentive with regard to the broader meaning of trend.
anal-retentive…”An anal-retentive person is someone who is overly organized, neat, and focused on small details. People often use this label for someone who wants total control and gets upset when things are messy or not done right”.
https://en.wikipedia.org/wiki/Anal_retentiveness
” I was referring only to the red-running average curve which has obviously trended negatively since its peak in 2024. ”
Robertson of course does not know that a centred running mean should have (at least over longer periods) nearly the same trend as the time series it was generated out of.
Let us compare their trends (°C / decade) within the mean’s active window
– since 1979
UAH data: 0.1567 ± 0.006
13 m mean: 0.1560 ± 0.005
– since the peak in Apr 2024
UAH data: -2.83 ± 0.29
13 m mean: -2.36 ± 0.08
– from the peak in Apr 1998 over the same period as above
UAH data: -4.93 ± 0.29
13 m mean: -3.59 ± 0.24
As said: just for fun…
*
” You guys are trying to apply the overall positive trend from 1979 till present to what I said… ”
No, no one did that here.
As opposed to Robertson, who all the years tried to hide UAH’s overall trend behind lots of subtrends fitting his narrative, we use exactly the same scheme as does Roy Spencer in his monthly report:
…….. Globe Land Ocean NH Land Ocean …
Trend… 0.16 0.22 0.13 0.19 0.24 …
*
… and that suggests to me that you are all anal-retentive with regard to the broader meaning of trend. ”
Apart from his utterly reprehensible anal allusion, the highlighted text clearly shows that Robertson – as always – confuses what actually is (the full data) with what he takes it to be (a tiny cherry-pick out of it): one of the hallmarks of egomaniacal pseudoskeptics.
Richard M made another nonsense coolista comment on WUWT:
https://wattsupwiththat.com/2026/08/09/open-thread-202/#comment-4227386
He writes:
“We are currently at 4). This is when the warm phase of the cycle ends and the cool phase begins.”
His #4 is:
“4) Eventually, the warm water runs out which leads to the formation of more sea ice.”
Hahahah, no!
Recent observations are definitely not screaming “cool phase.”
The 2025 annual Arctic sea-ice extent was the second-lowest on record, surpassed only by 2020.
It is true that the September minimum has shown little statistically significant downward trend since about 2007. But that is a very different claim from saying Arctic sea ice as a whole has stopped declining.
The apparent slowdown is seasonally dependent, and the recent 2025–2026 observations restored a statistically significant decline in winter sea ice:
https://www.pnas.org/doi/10.1073/pnas.2614134123
Coolista crystal balls rely on cherry picking noise, declare the long-awaited cooling phase imminent, and move the goalposts when reality refuses to cooperate.
For a fun little trip through the coolista prediction archives, see Richard M’s comment posted on May 1st, 2020:
“This drop follows what I’ve been saying for a long time. All we have seen in recent years is the effect of natural factors such as ENSO pushing up global temperatures. There is no indication that the climate baseline has changed this century.
In April the effect of the ongoing Pacific El Nino and the winter AMO driven Arctic enhancement were both in effect. Next month the Arctic influence will likely fall again. Due to the lag that occurs with El Nino, we will continue to see those effects for a few more months even if it fades away.
My prediction for this month was .40-.45 so we got more cooling than I expected. Next month will probably be in the .30-.35 range.
Overall, if the ENSO returns to neutral we have a chance of returning to the 21st century baseline by September.”
https://web.archive.org/web/20201001191915/http://www.drroyspencer.com/2020/05/uah-global-temperature-update-for-april-2020-0-38-deg-c/#comments
That prediction aged about as well as you’d expect. September 2020 was exceptionally warm, and 2020 as a whole went on to rank among the hottest years in the instrumental record at the time.
Correction: It is true that the September minimum has shown little, non statistically significant downward trend since about 2007.
Good catch; and I don’t wonder at all that Richard M, despite having been clearly contradicted on this blog
https://www.drroyspencer.com/2026/08/uah-v6-1-global-temperature-update-for-july-2026-0-48-deg-c/#comment-1750915
now moves to WUWT with nearly the same stuff…
I noticed that too.
And like you, I’m not surprised either. That’s what they do.
Even after being debunked thousands of times, they just keep repeating the same talking points and ignore every correction, as if no one has ever pointed any of it out to them.
Sorry, the Wayback Machine link I posted did not take you to the exact comment.
See here:
https://web.archive.org/web/20201001191915/http://www.drroyspencer.com/2020/05/uah-global-temperature-update-for-april-2020-0-38-deg-c/#comment-466151
And here is another comment posted on December 4, 2020, in response to Barry:
https://web.archive.org/web/20210125051727/http://www.drroyspencer.com/2020/12/uah-global-temperature-update-for-november-2020-0-53-deg-c/#comment-564288
A second Antarctic front will cause a significant drop in temperatures in southern Australia.
The surface temperature of the open ocean does not exceed 31°C. I think this is due to the constant average atmospheric pressure in the tropics. Consequently, an increase in solar radiation automatically leads to increased evaporation in the tropics.
https://www.tropicaltidbits.com/analysis/ocean/cdas-sflux_sst_global_1.png
A large increase in water vapor in the troposphere can cause an increase in the total mass of the atmosphere and an increase in atmospheric pressure, which in turn can raise global ocean temperatures.
El Niño raises global sea surface temperatures, which may lead to heavier snowfall in the Northern Hemisphere during the winter.
https://i.ibb.co/kVccPYzS/global.png
Ocean temperatures have the greatest impact on the weather. The troposphere is too thin to retain heat for long periods of time.
https://ds.data.jma.go.jp/tcc/tcc/products/clisys/STRAT/gif/zt_sh.gif
Yes, modern tropical SSTs do indeed exhibit a pronounced upper tail around 30-31°C, and there is substantial literature on why.
No, 31°C is not a physical upper limit imposed by atmospheric pressure.
Paleoclimate reconstructions of Eocene (55-34 Ma) tropical SSTs have shown well above 31°C, with some estimates reaching 35-40°C.
Atmospheric pressure during the Eocene was not remotely different enough to explain tropical SSTs rising above modern values through your proposed pressure mechanism. What was different though was the climate’s energy balance and greenhouse state.
@Arkady Ivanovich
“Paleoclimate reconstructions of Eocene (55-34 Ma) tropical SSTs have shown well above 31°C, with some estimates reaching 35-40°C.
Atmospheric pressure during the Eocene was not remotely different enough to explain tropical SSTs rising above modern values through your proposed pressure mechanism.”
This is only an assumption as there is just no reliable proxy or reconstruction of Earth’s pressure over time. The uncertainties of the existing estimates are huge and there is no final consensus.
Plus the unsolved Faint Sun Paradox that could be solved by higher pressure but seems to be contradicted by the so far analyzed pressure proxies.
It can well be that the higher SSTs have been due to pressure. The existing data is not good enough to rule this out.
Geologic Proxies for Atmospheric Pressure
– Fossilized Raindrops: Scientists measure the size of raindrop
impressions left in ancient volcanic ash or mud. Because atmospheric density limits the terminal velocity of a falling raindrop, maximum print size can place an upper limit on how thick the air was billions of years ago.
– Vesicle Size in Lava Flows: When basaltic lava cools at the surface, gas bubbles (vesicles) form. By comparing the size of bubbles at the top of a lava flow to those at the bottom, researchers can calculate the weight of the air pressing down on the lava when it solidified.
– Fossil Insect Wings: The mechanics of flight require a certain air density to generate lift. The maximum size and wing-loading capabilities of giant ancient insects (like the Carboniferous Meganeura) are used to model the minimum density of the ancient atmosphere.
– Nitrogen Isotope Ratios: Earth’s total atmospheric mass is largely dictated by its nitrogen content. By analyzing nitrogen isotopes trapped in ancient rocks or organic matter, scientists try to estimate how much gas has escaped into space or been sequestered in the mantle over time.
The assertion “this is only an assumption” might be farfetched.
@Willard
I did not say that there is no proxy that is used in the paleobarometry field.
I just pointed out that there is no good reliable proxy, no consensus and the uncertainties are huge.
For instance, the reason why insects are used is that we have still insects to compare them to.
The range of different pressure estimates to enable their size goes from 1-1.7 bar. Not a very thin constraint.
But there is also the paradox of the long-necked dinosaurs (e.g. apatosaur) that would need a second or gigantic heart (some speculate up to eight additional hearts) or extensive evolutionary developments like the lungs reaching into the neck, if higher pressure would not have be present to aid via the siphon effect.
Then there is the other paradox of the gigantic flying dinosaurs (e.g. quetzalcoatlus) that could not fly in today’s atmosphere.
They don’t have the skeletal features to climb easily which makes the theory that they mostly glided difficult.
If the atmosphere was denser, they could just have flown.
So if Mesozoic atmospheric pressure was substantially higher (roughly 2–5 bar), all these paradoxes are solved at once.
Moreover, the Faint Sun Paradox would be solved by higher pressure, too.
If you look carefully at the existing proxies in the literature, there are always assumptions that are made for the interpretation of the data and to be fair, those are not unlikely.
But other explanations are also not unlikely, but discarded.
Going by Okham’s razor, higher pressure is the minimalistic parameter to solve all those paradoxes.
As with the tectonic plate theory, it could take generations of scientists to explore something this is discarded by today’s dominant view.
Ron,
My point should be simple. You said “this is only an assumption”. This is false.
You keep using the word “assumption”: it might not mean what you make it mean.
Willard,
then call it a(an educated) guess, based on data, that’s interpretation is based on additional assumptions which can’t be proven or falsified (and can simply be wrong, particularly if alternatives exist).
Therefore, you can only assume that it is correct but you can’t know it.
Your interpretation of the data will only be as valid as your assumptions are correct.
Empirical sciences are nothing more than then a series of educated guesses, Ron. Some are more educamated than others.
As Bob often says, proof is for formal stuff or alcohol.
Willard,
you are confusing direct measurements with proxies.
You might also not understand what a proxy is and its limitations.
That would fully explain why you don’t see any issues.
Some might be more educated than others.
Ron,
Measurements don’t turn educated guesses into something else, and to speak of “proxies” don’t turn them into non-measurements.
Even if you hold that refutation is the name of the science game, you’ll have to accept that it’s conjectures all the way down.
You’ll have a better chance citing stuff, modelling stuff, analyzing stuff than waving your arms like someone who has never studied these general matters.
Willard,
a proxy makes the assumption that the correlation between two or more parameters that you have found once holds true at another time at another place.
There might be a lot of reasons why this is not true and it is a very active field of debate within the paleoclimate community which proxy series are suitable and which are not, which model is best etc. pp.
Such a debate lead a big group of scientists leaving the PAGES 2K consortium, in which they had been a part for years and published collaboratively, and publishing there own temperature reconstruction.
You can find how much they differed from PAGES 2K in Fig 5 of this paper:
https://www.sciencedirect.com/science/article/pii/S1125786520300965
That’s how ‘direct’ a proxy is as measurement.
Ron,
The duck test is enough to judge if someone is a contrarian or not. You have yet to fail it. For instance, you forgot to tell the year of the IPCC report in which Lamb’s cartoon appeared.
Lamb himself did not put much weight in that graph. It only matters to those who cling to the idea that we had some very big MWP. For some reasons, the same auditors have very Big Concerns about data quality. Go figure.
These auditors also fail to appreciate that if we were to take Lamb’s cartoon very seriously, climate sensitivity would be more substantial than what is usually promoted at Roy’s.
If what I just said remains mysterious to you, then I would suggest to pipe down.
Welcome to Climateball!
“Such a debate lead a big group of scientists leaving the PAGES 2K consortium, in which they had been a part for years and published collaboratively, and publishing there own temperature reconstruction.”
That was an interesting paper. Summertime temps in a narrow latitude band. Proxy for the annual global temps they are comparing?
I was curious about your characterisation of these experienced authors defecting PAGES 2K. So I checked and they still work with PAGES. They’re still in the tent, and this work is a normal part of the scientific process of interrogating the data and and results.
This from their 2022 reply to critical analysis of the paper you linked.
“Since its foundation in 1991 by the United States and Swiss National Science Foundations, PAGES (Past Global Changes) provides support for the gathering and synthesis of observations, reconstructions, and the modelling of past climate, ecosystem, environmental and societal dynamics. Resulting collaborations, datasets and publications became valuable benchmarks in paleoclimatology and global climate change research. Among many other advantages, PAGES offers unique opportunities for early career researchers and interdisciplinary studies. One of the flagship products is undoubtedly the latest PAGES 2k reconstruction of global mean surface temperature for the past 2000 years (PAGES2k Consortium, 2019; hereinafter P19), which applied seven different statistical reconstruction methods on the same proxy and calibration datasets (Cowtan and Way, 2014, PAGES2k Consortium, 2017).”
Which concluded:
“Given agreement that no climate reconstruction is perfect and effective communication of the remaining uncertainties must continue, we propose that the IPCC considers for future reports inclusion of a dedicated chapter on paleoclimate, as well as representation of a variety of independent temperature histories rather than selection of a single product.”
https://www.sciencedirect.com/science/article/pii/S1125786522000625
The authors are still running workshops for PAGES:
https://x.com/THERA_4ever/status/1580555825500008450
Other papers authored by the ‘PAGES consortium’ seek to interrogate the data and methods in different ways.
https://www.nature.com/articles/s41597-023-02489-1
https://www.nature.com/articles/s41467-023-37643-1
https://www.nature.com/articles/s41598-018-25862-2
It seems Esper et al have a beef not with PAGES, but with how paleoclimate is represented in the latest IPCC report. Here’s a more recent note on that.
https://www.nature.com/articles/s43247-024-01371-1.pdf
Their proposed reconstruction doesn’t differ much from the mean P2K19 reconstruction used in AR6, just adds more lines and wider error bars.
I found some of the lead authors quoted on the then record global warmth of 2023.
https://www.cam.ac.uk/research/news/2023-was-the-hottest-summer-in-two-thousand-years
Thanks for piquing my interest, Ron.
Willard,
I thought you are reading your sources. The year is written there.
But in case of any selective illiteracy: 1990.
Did you talk to Lamb yourself or where do you get this information from that he did not put much weight in this graph? Did he give an interview? Can you quote his words with source?
He gave it enough value to update it a bunch of times to expand the time series towards the present.
And btw, I did not say anything about the quality of Lamb’s research nor the curve.
I merely pointed out to you that if anybody is to blame for Wegman using it, it is the IPCC not him. They put it in their report and said it is representing global temperatures.
And for beginners: if you don’t want people to take your schematic diagram up to scale, don’t put specific units like degrees Celcius on its Y-axis and stay away from using tick marks. That might help.
barry,
from my understanding, the beef is mainly between Kaufman/Neukom/Steiger and Büntgen/Esper.
See:
https://www.sciencedirect.com/science/article/pii/S1125786522000625#bib15
https://www.sciencedirect.com/science/article/abs/pii/S1125786522000455
It started with the 2013 PAGES-2K reconstruction:
https://www.nature.com/articles/ngeo1797
All five still on PAGES-2K (and others from the Büntgen 2020 & 2022 papers).
But then Neukom et al. 2019 happened
https://www.nature.com/articles/s41561-019-0400-0
and then the new PAGES-2K 2019 reconstruction came out on top with way less authors than 2013.
https://www.nature.com/articles/s41561-019-0400-0
The Neukom et al. interpretation was pushed to PAGES-2K and the IPCC report altogether and a lot of people (namely 6) that were on the 2013 PAGES-2K paper were on the IPCC criticism paper you shared but not on the 2019 PAGES-2K paper.
My respect goes to the editors and reviewers of Dendrochronologia who allowed both dissenting views and the criticism of both sides towards each other to be published.
Although this should be the standard in science, it is not often anymore.
Ron,
I know about Lamb’s cartoon. Everyone who played Climateball for a little while knows about it. Here are some breadcrumbs to get you up to speed:
https://neverendingaudit.tumblr.com/tagged/DemingAffair
You still forgot to mention that this “schematic diagram” was taken from the first IPCC report, in 1990. An interesting omission, if you ask me.
Five years is a lot in science. Thirty-five years is nothing in Climateball. For contrarians like you to be able to create new talking points, they’d have to work. They seldom do.
I’m still waiting for you to show that you can carry your weight. When you will, I might be able to find where you got your talking point about PAGES2K. Deal?
Willard,
you did not answer any of my questions I asked.
You are dodging them, throwing out red herrings.
That makes any interaction a waste of time.
“You still forgot to mention that this “schematic diagram” was taken from the first IPCC report, in 1990. An interesting omission, if you ask me.”
Of course I did.
You were in the wrong thread.
“So if Mesozoic atmospheric pressure was substantially higher (roughly 2-5 bar), all these paradoxes are solved at once.”
Hahahaha.
But I digress.
What independent geological or geochemical evidence do you have that supports a Mesozoic atmospheric pressure of 2-5 bar (200-500% of modern atmospheric pressure)?
Ron,
Speaking of red herrings, the “claim” you’re talking about isn’t in this specific sub-thread. I’m still waiting for you to show the homework you pretend having done. If what I said was obviously false, you should be able to refute it, right?
By “what I said” I am referring to whatever you have in mind, which you have yet to identify properly. You said a few times that it’s the “initial claim”. Do you really dispute that almost all hominins disappeared during the Ice Age?
Also note that your “initial” comment on teh Wegman Affair did not mention that Lamb’s cartoon was the first IPCC report. You simply said:
https://www.drroyspencer.com/2026/08/uah-v6-1-global-temperature-update-for-july-2026-0-48-deg-c/#comment-1751738
Either you say “I thought you are reading your sources”, which presumes you did not stated that the Lamb cartoon was from 1990, or you claim “Of course I did”. Doing both makes you look like an ordinary contrarian.
Wegman’s report has been published in 2006, BTW.
Willard,
I was referring to those questions you have not answered in this subthread:
“Did you talk to Lamb yourself or where do you get this information from that he did not put much weight in this graph? Did he give an interview? Can you quote his words with source?”
Lamb published it three times. Last time 1982. That does not make it automatically outdated.
You were ridiculing that Wegman said it was “a cartoon”.
You were not criticizing that he used something outdated. This would be a different criticism.
And how outdated it is in its general depiction of Earth’s climate history, this is still under debate as the Dendrochronology papers show.
Your claim was all but one hominids survived and that only in Africa.
Your use of ‘Almost all’ which could be one or more and then ‘Only a single species survived’ puts them in direct dependency. The second defines the first undefined number.
Otherwise, you imply that more than one species survived.
Did they?
If not, you need to be more specific.
And you have still failed to answer the question about your “at only one place: Africa” reference.
I’m all ear.
> this subthread
Here’s how this subthread starts, Ron:
https://www.drroyspencer.com/2026/08/uah-v6-1-global-temperature-update-for-july-2026-0-48-deg-c/#comment-1751628
You’re confusing asking questions and throwing squirrels around using sentences that end with “?”.
Nothing makes anything automatic, except some kind of automatism. Should that mean something? Why on Earth should we need any kind of automatism here?
Do you only have one ear? That might explain why you’re so tone deaf.
Here’s what making assumptions looks like:
[RON] If Young Earth had higher pressure than we currently believe, then we could perhaps solve the Faint Sun Paradox.
The “if” part is the assumption.
For some reason, you forgot to provide any evidence for that part.
One has to wonder why.
Gordon,
Eldrosion clearly AGREED there’s a a begative trend from 2024 until now. The point, however, is that this short trend is hardly surprising as it starts at the peak of an El Nino and ends in the start of the next El Nino after a La Nina in between. So i have no idea why you incorrectly say Eldrosion doesn’t understand what a trend. He or she just pointed out the following:
“There is a negative trend from 2024 because you are starting your analysis at the peak of an El Niño and comparing it to a La Niña period.”
When it comes to temperature time series, deniers are left with nothing but noise:
https://web.archive.org/web/20100107040041/http://tamino.wordpress.com/2006/11/12/picking-cherries/
One thing everyone has in common is the fact that before the beginning of the 17th century temperature data does not exist, so we are left with data over a tiny period of time and the climate is changing as it has always done, climate changes,and sometimes well withing a person’s lifetime.
“Finny333 says:
July 7, 2026 at 8:36 AM
“…the amounts are so tiny…”
Try adding 5 parts per million (not 425 parts per million, as is the case with CO2 in the atmosphere) of arsenic to your bloodstream and let us know how that tiny amount affected you. (Actually, just in case you believe that tiny amounts are safe, don’t do it – just think about what would happen. Ask AI, if you prefer).”
–
The additional 150 ppm of CO2 don’t harm a prosperous with 350 ppm CO2 planet!
–
https://www.cristos-vournas.com
How come the trend is that clearly linear when the CO2 in the atmosphere is not?
July 2026 was the warmest month on record for CONUS:
https://www.ncei.noaa.gov/news/national-climate-202607
“Berry doesn’t get that, LOL. Let’s see he studied at CalTech(BS), his MS at Dartmouth, and his PhD at Nevada. He has many patents on droplet formation software for cloud prediction used by NWS but somehow, he doesn’t get it.”
Lol, deniers actually care about expertise?
Interesting. Where is all that respect for expertise when it comes to the 97%+ of climate scientists who reached a conclusion they, of course, do not like?
No, obviously THEY’RE all in on the evil global conspiracy to confiscate your constitutional rights, destroy your freedom, and, most horrifying of all, come for your gas-powered leaf blower!
Eldro,
First, consensus is an oxymoron in science. Berry is one guy. But to say that Berry doesn’t get it is comical. It would be like saying Feynman doesn’t get it. Berry used to be part of the 97% until he started applying the math. Berry lets the math speak for itself. There is no math with the 97%. A lot are part of the 97% because it is in their best interest. It has nothing to do with the actual science. You insulting Berry, is like a fly insulting Issac Newton. It is hilarious.
I never insulted Berry.
I am simply pointing out what I see as a selective appeal to expertise here.
You, like other skeptics, argue that scientists are motivated to stay in line with the consensus, implying that the consensus position isn’t particularly objective.
But Exxon scientists themselves were predicting anthropogenic global warming in the 1970s, so…
https://www.climatefiles.com/exxonmobil/1979-exxon-memo-on-potential-impact-of-fossil-fuel-combustion/
Eldro,
I don’t see how that differential equation is wrong. You have math going at AGW two different ways and says it is wrong. Man might be warming the planet. But he’s not doing it with CO2 emissions. I tend to believe it is a natural cycle of warming. All of modern man has evolved during the Holocene. At least that is all we know. Interglacials are warming periods. So, a warming period coincides with the evolution of modern man. CO2 lags temperature on short, intermediate and long, time scales. I think we’re missing the big picture.
This is another great example of how the cult kids work.
Eldro is throwing some more crap against the wall, hoping something will stick. He claims “But Exxon scientists themselves were predicting anthropogenic global warming”, but his link calls it “a study conducted by an Exxon summer employee named Steve Knisely”.
We know, even today, many advocates of the CO2 nonsense have no understanding of radiative physics or thermodynamics.
Kids these days….
Eldrosion,
As you can see, troglodytes are good with “but consensus”:
https://climateball.net/but-consensus/
They also excel with “but my guru”:
https://climateball.net/but-my-guru/
That allows them to inject “but debate me”:
https://climateball.net/but-debate-me/
In other words, they try to burden Team Science with commitments they don’t have, using cheap rhetorical tricks. And if that does not work, there’s always red baiting:
https://climateball.net/but-politics/
There are other squares, but they are few innovations.
97 percent? that was debunked years ago, where have you been?
Quite right. It’s more 99.9%:
https://journals.sagepub.com/doi/10.1177/0270467616634958
Contrarians are just a little slow on the uptake.
Cranks are the worst.
Dullard,
Would these 99.9999% of scientists be the ones who get research grants for mentioning climate change? Or is it the 99.9999% of the climate cult being surveyed? Or was the question so broad it was meaningless, like do you believe in climate change? Because I would be answering yes to that one. But would answer “Hell No!!!” if the question was do you believe in the extreme scenarios.
Subtle differences, that are way over your head.
Q-Anon,
We are indeed talking about scientists who would become multi-millionaires if not billionaires would they falsify AGW.
Those same scientists could become millionaires would they follow the contrarian path, like Willie Soon:
https://www.theguardian.com/environment/2015/feb/21/climate-change-denier-willie-soon-funded-energy-industry
The Southern Company gladly funded him as long as its association was kept in the shadows:
https://climateinvestigations.org/willie-soon-harvard-smithsonian-documents-reveal-southern-company-scandal/
The economic establishments can thank you for your services, which we might hope are free.
Dullard,
Did you as actually read past the first sentence of the so called article?
That amount of money is spread out over 14 years, so a normal academics budget. Unlike the money Fauci made each year risking the lives of millions of people.
No wonder you cry yourself to sleep if your maths is that poor.
> the so called article
Who called it an “article”, Q-Anon?
The Kochs alone funneled more than 125M in two decades. By serendipity, Dubya’s department settled a 350M case for discharging toxic chemicals from a refinery in Corpus Cristi. Some might call it a good investment.
The list goes on and on:
https://www.theguardian.com/environment/2015/jun/09/secretive-donors-gave-us-climate-denial-groups-125m-over-three-years
You don’t have the stamina to play that ClimateBall line.
Trying to catch up this morning, I see Ark just debunked his cult’s “unprecedented” nonsense:
“It illustrates why relying exclusively upon historical extrema can be misleading.
Yup.
And the other cult kids are upset with Richard M. Richard and I seem to be on the same page, but for different reasons. That’s interesting, as I only give my prediction about a 50-50 shot, but now with Richard maybe it’s 60-40, or even 70-30? I think that’s called synergy.
But even if we’re wrong, it just means we still don’t know enough about all of the cycles involved. The hard science tells us CO2’s 15μ photons can NOT raise the temperature of Earth’s 288K surface. The IPCC should know that….
“CO2’s 15μ photons”
Still flogging that dead horse?
Give it a rest, you are now boring.
Obviously you’re not bored child, if you’re still triggered by reality.
Accepting reality is part of growing up.
Get used to it….
zzzzzzzzzzzzzzzzz….
SOLAR MINIMUM UPDATE
Extreme heat is threatening Italy’s “cheese banks,” where hundreds of thousands of Parmigiano-Reggiano wheels are stored as loan collateral.
https://fortune.com/2026/08/10/italy-5-billion-cheese-economy-heat-wave-climate-change/
Cue to “but what about year 1234 next to where I live” or “but communism”, both missing the loan collateral bit.
Speaking of where I live Willard, a few historical facts C/O Cambridge archives works by Edward Sabine, Gordon Manley, Hubert Lamb ,Gottshawk and parish records,
592ad drought and great heat all across the land
605ad drought and great heat
679 till 681ad drought with great heat,many deaths,st Wilfreds drought
720ad long hot summer London and southern England
741ad drought London
910 till 930ad two decades of drought wildfires and heat
955ad long hot summer England
990ad widespread drought many deaths,people and livestock
1078 extremely hot summer many wildfires all across the land
1102 great drought many dying from the heat
1114 very dry ,rivers and wells dried up
1135 1136 two very dry hot summers,
1155 great drought ,Thames and many rivers almost dry
1202 great heat and drought corn cut by June 24th
1212 hot and dry
1222 dry for months very hot London
1236 drought London and the South
1241 drought,no rain from March to October
1251 1252 two years of heat drought with crop failures
1260 great drought London and the South
1276 1285 1287 1288 all very hot dry summers
1305 same story hot and dry
1324 1325’1326 very hot widespread drought and famine,
1342 great drought London and the South
1351 1353 two year drought with great heat many deaths
1370 till 1380 a decade of droughts and crop failures
1390 dry and hot London
1473 till 1479 great drought and hardship dysentery all across the land
1490 great drought in London,just a handful of the dozens of reported hot dry summers before 1500, Englands green and pleasant land is a myth C/O William Blake, I stopped at 1500 because after that date there are many periods of drought and hot summers , life is too short to list them all, I will mention one, the great Tudor drought 1538 1541 one report had the Rhine dry from Cologne to the Netherlands
Perhaps one day you’ll cite your source, Ian. Speaking of whom, here’s what Ed Wegman said of his pet graph:
https://en.wikipedia.org/wiki/Wegman_Report
Perhaps you should have a word with Ron. He’s a fellow contrarian, but tends to dispute the efficacy of qualitative proxies.
Willard,
I’m not a contrarian.
Just a Ph.D. who is way too familiar with problems related to data quality and absolute claims based on data and assumptions made that are just not matching up.
Maybe you go also back and check your cartoon quote about context.
Wegman had taken the “cartoon” directly from the IPCC report. So if it was made-up or inaccurate data used to generate, the IPCC reported something false and Wegman just used it.
“Maybe you go also back and check your cartoon quote about context.
Wegman had taken the “cartoon” directly from the IPCC report. So if it was made-up or inaccurate data used to generate, the IPCC reported something false and Wegman just used it.”
Potentially you could forego the innuendo and just quote the IPCC on the Lamb graph and make a real point. I, for one, could possibly be interested.
The text under the figure in question was as follows:
“Schematic diagram of global temperature variations for the last thousand years. The dotted line represents conditions near the beginning of the twentieth century.”
The history behind the graph ist actually quite interesting:
https://interpretingcc.wordpress.com/2023/06/24/ipcc-1990-schematic-of-temperature-during-the-last-1000-years/
I just have to criticize the author in the link above that he kind of ridicules the research because it was done by just one person.
Some of the most cited papers in science have been written by only one author.
If the findings hold true is the only currency in science, the rest is tribal behavior.
So it’s the 1990 report. The legend reads:
My emphasis.
“The author” of that post is actually Tim Osbourne, who says:
Op. Cit.
Also note that “But tribal” may not cohere with the intimation to give credit to troglodytes. It still hits the contrarian Bingo:
https://climateball.net/but-consensus#tribal
You should need about Tim:
https://research-portal.uea.ac.uk/en/persons/timothy-osborn/
He’s a swell guy.
Willard,
you are familiar with the appeal to authority fallacy?
Probably not.
But you should.
Mr. Osborn blurbs out FAR EXCEEDING on his wordpress space when the statement of the very own paper he contributed to in (on only 3rd position of 30 authors) stated the following:
“The red and blue curves illustrate the differences that can occur between a filtered curve and one composed of non-overlapping 50-yr averages, and also that recent measured warming MAY BE COMPARABLE WITH PRESUMED EARLIER WARMTH”
(emphasis from me)
Maybe the other authors just disagreed with his personal opinion. Maybe not. I was not there.
Ron,
I do know about appealing to authorities. Sometimes it’s fallacious. Sometimes it’s not. What would be the appeal to authority that I made?
You really are having difficulties identifying claims.
My point was simply that you must be new to Climateball. It shows with every move you make. Including your ignorance of who’s Tim Osbourne.
Now, when was Lamb’s cartoon, again? If you clicked on links I provided, you should know.
Here’s a hint: it’s not in 1990.
Oh, and you also need to identify what you’re talking about a little better. “the statement of the very own paper he contributed to”? Come, now.
> Now, when was Lamb’s cartoon
To clarify, I’m asking for the first publication date.
To clarify furthermore, I’m not asking because I don’t know.
I’m asking because I already gave resources to find the answer.
Willard,
I don’t care about ‘climateball’. And I am not visiting an insecure website.
“Now, when was Lamb’s cartoon, again? If you clicked on links I provided, you should know.
Here’s a hint: it’s not in 1990.”
Another red herring.
That has nothing, absolutely nothing to do with where this started.
You can go down this rabbit hole yourself.
Maybe you should just read the wordpress entry more carefully. The link to the paper is shared there and even the quote I cited you can read already there without reading the paper.
Ron,
Seems like last comment got lost, so let’s cut to the chase.
There are two main reasons why you didn’t mention that Wegman’s 2006 report cites a cartoon from 1965. The first is that you did not know. The second is that you’re playing Climateball, just like everybody else here.
Here’s how I read how you proceeded. First, you started with B20:
https://doi.org/10.1016/j.dendro.2020.125757
You presumably liked the “but volcanoes” bit and it PAGE2K criticism. Yet emphasizing volcanoes only reinforces the colding effect of natural forcings. Consistency is not to be expected at Roy’s.
Perhaps you already know that E&B are buddies, e.g.:
> We argue that more proxy records are needed to accurately reconstruct first millennium CE temperature variability and value regional studies producing such data.
Esper’s name should be familiar to auditors. Perhaps not you.
Then, you presumably realized that this attracted a response, N22:
https://doi.org/10.1016/j.dendro.2022.125965
B admitted “previous scaling issues” but pressed on:
https://doi.org/10.1016/j.dendro.2022.125982
His activism has increased circa 2024:
https://doi.org/10.1038/s44168-024-00126-0
That op-ed almost immediately got some contrarian traction:
https://www.wsj.com/opinion/a-more-honest-climate-science-82f928a0
The “honest broker” gambit is here to stay. Writing an op-ed does not seem to count as activism for Ulf. Yet he cites Ravetz, Funtowicz, von Storch – names that still have some Climateball currency. E&B also wrote something else in 2024:
> While the IPCC’s conclusion on the uniqueness of latest-decade warming is thus not supported by comparison with these smoothed paleotemperatures, **it is still likely correct as ice core-derived forcing timeseries show that greenhouse gases were not elevated during any pre-instrumental period of the Holocene.**
https://doi.org/10.3390/atmos15040405
In any event, criticism of the IPCC is what Team Science does just about every day, e.g.:
https://doi.org/10.1016/j.quascirev.2022.107537
That’s why it got so strong over the years.
The proper picture is this: a consensus emerges over some claim C. Then C gets criticized, and adjusted to D. Then D becomes the consensus. Most of the time, D is not very different from C. But at some point in the alphabet, a discontinuity appears. Some call that a paradigm shift.
Whatever.
Perhaps you’ll like this more recent paper from E:
> Our reconstruction reveals that the series has warmed by 1.5 °C during the modern observational period (1970–2023), which is 0.5 ± 0.4 °C above the pre-industrial baseline (1210–1850 or 1850-1900), making the summer of 2024 the warmest in the past eight centuries. This unprecedented warming amplifies winter runoff in the Brahmaputra, Indus, and Salween headwaters through a cascade of atmosphere-cryosphere feedbacks: enhanced meltwater and spring soil-moisture persistence promote earlier and lusher vegetation growth, which reduces summer albedo and further accelerates regional warming.
https://doi.org/10.1038/s41612-025-01254-y
Or not.
I started at the Auditor’s.
You’re misusing too many concepts to be a serious researcher.
After a wet and stormy start to the week, Perth and surrounding areas just shivered through their coldest August morning in around a decade.
Sydney just experienced its warmest June and one of the warmest Julys. Because June was so anomalous, and August has maintained above average warmth it looks like 2026 will have the warmest winter in the record for Sydney.
Road access to the iconic ski resort of Portillo in Chile by road has now been closed for what’s thought to be an unprecedented four straight weeks.
The ski area has had an up and down season with two little snowfall to open initially as planned in June, then a few weeks after opening in July, was hit by a massive storm. It has now had 6.6 metres (22 feet) of snowfall over the past four weeks, most of it in the first week in mid-July.
The road was closed on Tuesday, July 14 in advance of the storm. Ski slopes were closed for a little over a fortnight as resort teams worked to make them safe and runs re-opened at the start of August, but with guests only able to arrive and depart via helicopter.
How it comes the 250 ppm CO2 and the water vapour (H2O) ~1% in Earth’s atmosphere didn’t kept warming Earth (since “Holocene Optimum”) all this time, ~10500 years till 1850 (?), and Earth (according to Milankovitch prediction) should had been cooling?
Because Earth simply hadn’t been cooling!
–
https://www.cristos-vournas.com
As the Earth’s axial tilt decreases, stronger solar radiation reaches the tropics, and the seasons in mid-latitudes may become milder. However, weaker radiation in the polar regions will promote the accumulation of ice.
For the same reflectivity, the Northern Hemisphere in our times reflects less solar energy, because when in Northern summer Earth is at Aphelion (153 millions km) and therefore the solar irradiance is weaker.
Northern Hemisphere’s reflectivity is higher than the Southern Hemisphere’s reflectivity, because continents reflect much stronger than oceans. There are much more continental areas in Northern Hemisphere than in Southern Hemisphere.
Therefore in our times Earth – in a yearly basis – reflects less solar energy, than Earth was reflecting 10500 years ago.
In our times, there is a reduced total yearly solar energy reflection. Therefore year after year Earth is able to accumulate more and more heat and that is why Earth becomes warmer.
–
https://www.cristos-vournas.com
BACK AT THE RANCH
The National Oceanic and Atmospheric Administration (NOAA) is pulling its support from an Arctic climate and environment report it has helped with in the past.
Rick Thoman, lead editor for the 2026 Arctic Report Card, said that participants were informed Monday that they would no longer receive assistance from the government agency.
“We were informed in a phone call with NOAA yesterday that effective immediately NOAA was ending all support for the Arctic Report Card,” Thoman told The Hill.
“No rationale was given at all,” he added.
https://thehill.com/policy/energy-environment/6023519-noaa-ends-arctic-report-card-support/
Rumors have it that they’re considering generating a report using the comments from our troglodytes.
“There’s a fire. Should we gather more information about it?”
“Nah. Cut funding for the people studying the fire. If we don’t measure it, maybe we won’t have to think about it.”
Willard – I rarely address you directly, but I feel it incumbent upon me to tell you or remind you that you may owe your very existence to ancient Troglodyte ancestors who survived a brutal ice age in the comforts and protection offered by their cave homes.
BTW, it seems that man is capable of surviving in temperatures a lot colder (and warmer) than we have today or even projected for the next few centuries. Of course, they had the survival instincts to use all resources available. If alive today, I am certain they would be using fossil fuels and their power to drive devices like air conditioners. Pity some of their progeny don’t have that same degree of common sense.
Tom,
Almost all hominins disappeared during the Ice Age. Only a single species survived, at only one place: Africa. That feat has been immortalized by a song:
https://www.youtube.com/watch?v=FTQbiNvZqaY
Troglodytes of yesteryear lived in cave, some of them all through Middle Age. The Climateball commenter I call “Troglodyte” survives Roy’s with a very portable playbook: red baiting and hiding behind his pet guru’s robe. You borrow half of that playbook, e.g.:
https://theconversation.com/return-of-the-red-scare-how-the-us-right-is-weaponising-the-word-communism-288715
The main difference between him and troglodytes is that the latter cooperated. You should learn that skill. The modern world does not owe its prosperity to religulous integrists like you.
@Willard
“Almost all hominins disappeared during the Ice Age. Only a single species survived, at only one place: Africa”
You might check your facts on that cause the coldest snap of the last glacial happened between 12-13k years ago and homo sapiens took this opportunity to cross the Bering Land Bridge which is, last time I checked, pretty far away from Africa.
Willard- I recommend some remedial education relative to: troglodytes (dating and location of cave art and other artifacts) and the essential role of the Christian religion to the incredible burst of creativity and advancement that western civilization made from the Renaissance onward…literacy, scientific method, opposition to slavery, education, humane treatment of the physically and mentally ill. The west’s retreat from Christianity in the 20th century is as least partially responsible for its obvious decline. It is happening in the U.S.,but also at a slower pace. If we go, the world will enter into a new dark age.
> You might check your facts on that cause […] between 12-13k years ago
What cause was discussed, Ron? So like “assumption”, “cause” might not mean what you make it mean.
Also note that the last Ice Age started more than 115K years ago or so, which means you’re basically 100K years off.
Tom,
We already have a pompous prick. He at least went to an Ivy School. That’s what he pretends, which we must take with a grain of salt almost as big as for Bordo.
Here’s a semi-regular reminder:
https://www.drroyspencer.com/2026/07/uah-v6-1-global-temperature-update-for-june-2026-0-46-deg-c/#comment-1750486
Back in my days, Jesuits had class. Their politeness was sincere. They were too competent to peddle contrarian crap.
Caveat emptor.
Willard,
you might excuse informal English and the use of ’cause’ instead of ‘because’, but you could also have tried for a change to grasp the context.
You don’t have the facts sorted about when the coldest period of the last glacial was compared to when it started and when the different branches of homo sapiens died out.
Homo sapiens sapiens lived through the whole glacial also in Eurasia.
And you are probably confusing your mentioned “all-hominids-died-out-but-not-in-Africa-in-the-last-glacial” event with the much earlier event that was 930k–813,000k years ago and did not involve homo sapiens that came around ~600-500k later.
You’re not only off by numbers but also by species.
tl;dr
There is no evidence for your initial claim within the scientific literature.
Ron,
Any formal meaning would be odd here. Which one would you have in mind–Granger causality?
Mere relevance would suffice.
That humans got out of Africa and spread all over the world after being almost wiped out is well-known, e.g.:
https://www.nhm.ac.uk/discover/when-how-did-modern-humans-homo-sapiens-spread-out-of-africa.html
That they crossed the Bering strait long after that is also well known, e.g.:
https://www.livescience.com/archaeology/did-humans-cross-the-bering-strait-after-the-land-bridge-disappeared
That we alone among hominins survived does not imply anything triumphalist. It’s mostly a happenstance. We could have been wiped out many times. To think otherwise would be to indulge in survivor bias.
There are indeed troglodytes true troglodytes today:
https://www.youtube.com/watch?v=DSbQ3t-j41Y
These caves were well picked and well engineered.
None of that matters much for what we usually mean by troglodytes:
https://www.youtube.com/watch?v=iW4Gdsnr2Bg
Hope this helps.
Willard,
you have still failed to support your initial claim
“Almost all hominins disappeared during the Ice Age. Only a single species survived, at only one place: Africa.”
So are you admitting with your citations that you have been wrong?
Ron,
You quoted two claims. You must have done a lot of research one one of them to be able to claim:
“There is no evidence for your initial claim within the scientific literature.”
Where have you searched, and for how long?
I’m starting to doubt you ever done any research.
Willard,
you made the initial claim.
It is up to you to prove it. Not me.
I attended an advanced class out of curiosity called “Evolution of Men” in college during my master classes, taught by the professor of developmental biology.
Where did you learn that all homo sapiens died outside of Africa in the last glacial?
Ron,
You quoted two claims. You speak of one claim. It is up to you to be able to identify claims properly.
You also said that “There is no evidence for your initial claim within the scientific literature.” Do you really think that relying on Pure Denial, i.e. the first step of the Contrarian Tango, shows you’re not a contrarian?
You are dodging to answer again.
That is denial, but differently executed.
Maybe you think this is smart.
But it is just ignorance cultivated.
Or you are semantically so challenged that you don’t recognize that this is only one claim in two sentences:
“Almost all hominins disappeared during the Ice Age. Only a single species survived, at only one place: Africa”?
Who knows.
“You also said that “There is no evidence for your initial claim within the scientific literature.””
If there is evidence, then show it.
Ron,
Here is a dodge:
[DODGING RON] It is up to you to prove it.
The indefinite “it” is your way to pick the topic you wish to discuss. That denial contains an assumption:
[ASSUMING RON] Everyone is always under obligation to satisfy my demands.
Denial is saying “no”. Like here:
[DENYING RON] Not me.
As you can see, dodging and denial are two different speech acts.
That matters because it is indeed up to you to support your own claims, like here:
[BRAGGING RON] There is no evidence for your initial claim within the scientific literature.
That bragging also contains denial. That denial is used to shy away from having to provide evidence you looked at the scientific lichurchur. Which is why you try to shift the burden of proof:
[SHIFTING RON] If there is evidence, then show it.
It is not up to me to prove that you’re bragging about having checked a whole field of lichurchur without showing anything.
That’s as clear as day. Had you checked, you’d know one way or the other. You wouldn’t raise your hands in the air and say “who knows”.
You still have not identified which of the two claims you would like to be supported.
I hope this is enough to show that if there’s someone who is “semantically challenged”, that’d be you.
Why did the vast ice sheet in the north melt 10,000 years ago? About 11,000 years ago, the Earth’s axis was tilted at its maximum angle toward the Sun, and the angle at which the Sun’s rays struck the Arctic Circle reached its maximum. It is clear that these processes occur with a time lag. The same thing will happen now. When the axial tilt reaches its minimum, the ice sheet in the north will grow very rapidly.
” When the axial tilt reaches its minimum… ”
… around the year 11,800 CE (about 9,800 years from now).
Since the Milankovitch cycles operate on a timescale of tens of thousands of years, we are unable to perceive changes within a human lifetime. Let us remember, however, that humanity has already survived an ice age and massive floods that submerged, for example, Doggerland in the North Sea, which had been settled by humans.
Humanity as a species survived. Doesn’t mean lots of people didn’t die.
Tropical storms will now develop in the tropical Atlantic and the Gulf of Mexico.
Ireneusz Palmowski – excellent observation about time scale of Malankovch cycle. We bottom line for me is that we know so little about gradual (the time frame of a couple generations) climate change that I am reluctant to believe those who warn of impending (or even inevitable) doom. I can be convinced but I need solid evidence that fits together in a coherent way.
Mass extinctions or conditions that prevented life from existing or evolving that occurred quickly in the past were either from cosmic radiation, solar radiation spikes, asteroid collisions, or volcanoes. And most (not all) of them were from rapid FALLS in temperature or solar radiation, not from WARMING. Yes, the earth can get to a temperature level that is difficult for life, but we are not even close to that. In fact, the agricultural record since the base period (1850-1900) to today shows incredible increases which have literally allowed the world’s population to reach 8.1B. Satellite images clearly show a “greening” of the globe.
If you look at previous interglacial warming periods (we are currently in one) temperatures actually got 3C or 6F higher. Man had nothing to do with that warming or its current “pause.” Early in this interglacial (12.5-9,000YA) temps rose 8C (14.5F). This coincides with the beginning of civilization and the flourishing of the plants and animals that we domesticated.
People aren’t moving north to retire, they move south. People generally want to travel to warmer locales for vacation or holiday.
So, the climate is slowly (0.3F/decade where I live) warming? Great. Until solid research (not models unaccompanied by confirming data) shows I should worry.
Thomas,
Seem you are interested in the interglacial periods I read/heard recently that the rate of sea level rises at the beginning of the interglacial periods was 10+ mm/year!
Different scale of problem compared to the warming we have at the moment.
> I read/heard recently
Q-Anon is not really here to share anything except silly political jabs.
SOLAR MINIMUM UPDATE
The brutally hot summer is set to cost the EU economy €180 billion this year — that’s equivalent to roughly 1 percent of GDP, which is all the growth the bloc was expected to generate in 2026, according to new analysis.
France could lose 1.4 percentage points of growth, which is enough to push its economy into a 0.6 percent contraction, while an 0.8-point hit could almost wipe out the Netherlands’ expected expansion.
“The result is not simply ‘the hottest countries lose the most,’” notes the analysis by Triodos Bank. “Spain and Italy have the highest physical exposure and the most hot days in absolute terms, but decades of acclimatisation imply that the marginal effect of any single hot day is comparatively small.”
https://www.politico.eu/article/europes-scorching-summer-could-erase-blocs-2026-growth/
yep recycling bad news for Europe is what the mainstream media loves to do.
At the beginning of 2026 gdp growth was expected to slow by the major prognosticators from a paltry 1.5% in 2025 to .8% to 1.4%.
Then the Iran war got going and that meant high energy costs for Europe and that was expected to shave .4% to 1.5% by the prognosticators.
Now the summer heat is expected to hammer off yet another 1% of this years gdp
gloom and doom sells and Willard loves to purvey it.
The Iran War mostly costs Murican tax payers:
https://iran-cost-ticker.com/
Gill’s cynicism increases with his bad health.
Let’s hope he’ll get his hips back.
Not a problem if they had not wasted billions of Euros chasing rainbows with no result, there is quote which says,it is dangerous to be right if the establishment are wrong,power and money as the poor get poorer.
Losing a year’s growth in GDP is nothing to reactionary cranks.
As long as Nigel prospers, all is well:
https://www.theguardian.com/politics/2026/jul/05/nigel-farage-finances-robert-jenrick-to-the-rescue
No problem there.
The geological record shows that Earth experienced five conventionally recognized major mass extinctions during the Phanerozoic, and substantial evidence links several of them (and numerous lesser extinction crises) to rapid climate and carbon-cycle disruptions, commonly associated with massive volcanism, greenhouse warming, ocean acidification and deoxygenation.
The conspicuous outlier among the Big Five is the K-Pg extinction whose primary trigger was an asteroid impact.
A growing body of conservation research argues that human activities are now driving a sixth mass extinction through multiple interacting pressures, including habitat destruction, exploitation, invasive species, pollution and increasingly climate change. Call this on the Anthropocene extinction.
Ark, you realize that’s just beliefs, don’t you?
There’s no reality there. It’s all beliefs. It’s all based on imagination, assumptions, guesses, and fantasies. But if you believe all that happened naturally, why can’t you believe we’re now in a natural warming period?
It appears your beliefs have a strong bias….
Ark – you will waste my time no more. The idea of an Anthropocene Epoch was originally proposed in 2000 and finally rejected in 2024…at least in part…drum roll, please…because it was too political!
Wow! That little piece of mental gymnastics would break the back (or the mind) of most people.
“Anthropocene” – what propaganda! Bad, I might add. Orwell would not be impressed. Literally creating a new geological epoch to fit a political narrative. If one thinks about it, it is self-defeating semantics. The alarmists are trying to tell us that an existential event is happening now and will worsen in the very near future, on a time scale that is far shorter than geology typically deals with (100-150 years). Laughingly, Ark compares the effects of man’s addition of CO2 with truly massiveevents like huge asteroids crashing into the earth and volcanic eruptions quickly changing the air and sea. Nope. Sorry, the record is there. Maybe like the torrid 1930s and the Medieval Warming Petiod you and Michael Mann can perform a statistical magic trick and make them disappear.
Joint statement on executions in Iran
” Canada, Albania, Austria, Australia, Belgium, Croatia, Cyprus, Czech Republic, Denmark, Estonia, the High Representative of the European Union, Finland, France, Germany, Hungary, Iceland, Ireland, Italy, Latvia, Lithuania, Luxembourg, Montenegro, the Netherlands, New Zealand, North Macedonia, Norway, Portugal, Romania, Slovakia, Slovenia, Spain, Sweden, and the United Kingdom condemn in the strongest terms the ongoing executions of protesters and use of the death penalty by the Islamic Republic of Iran.
The use of capital punishment to silence dissent, intimidate communities, and punish individuals exercising their human rights can never be justified. The people of Iran must be free to exercise their rights to freedom of expression and peaceful assembly without fear.
“We call on Iran to immediately end the use of the death penalty and release all those arbitrarily detained.
“We further call on Iran to listen to the voice of its people as they demand change, and to take meaningful steps toward ensuring respect for human rights.” “
Iran and Islamic terrorists wont listen to anyone. It is the job of the UN to deal with such nations but they are too busy spreading propaganda about climate disaster through the IPCC.
If the UN ever did the job they were designed to do, the world would be a far better place. As it stands, they are a useless organization that is of no use to anyone. Same with the WHO, the World Health Organization.
As far as Canada being on your list, we have issues with Muslims here in Canada. Their treatment of women is contrary to our Charter of Rights and Freedoms and if anyone criticizes them on such breaches those people are labeled as Islamophobic.
Canada and the other countries protesting the actions of Iran are hypocrites who only like to hear themselves talk. It’s too bad that Trump has isolated his former allies because the only real way to deal with rogue nations like Iran is working together.
Then again, I don’t think we should ask the young people in our armed forces to fight such battles for us. If it is voluntary, that is one thing. However, there is no point fighting a limited war like Vietnam, Iraq, or Afghanistan. Rooting out evil requires an all-out campaign with no handcuffs on our fighting people.
Gordon,
Sadly the UN has been captured by the activists. October 7th highlighted how bad it was when the propaganda was being issued by the UN on the behalf of hamas.
Iran is a terrible regime and, like you said, won’t really pay any attention to the liberal West. Repeatedly chopping off the head of the hydra wil eventually kill it, but it will take time. Time which the people of Iran may not have.
Earth reaches its maximum planetian reflectivity when Earth on its orbit is positioned around the June’s Solstice.
And Earth reaches its minimum planetian reflectivity when Earth on its orbit is positioned around the January’s Solstice.
–
https://www.cristos-vournas.com
BACK AT THE RANCH
NIH limits funding for research on the health effects of public policy
https://www.nature.com/articles/d41586-026-02489-2
Dril, baby, dril!
Products that have increased health, longevity and life expectancy all across the globe, before the industrial revolution life was short and miserable.
Ian loves lamp.
Polling shows only 14.8% of Americans deny the basic sixth grade science behind global warming. To put that in perspective, as much as 10% of the population still believes the Earth is flat.
This is the celebration of harvesting the crops of seeding ignorance and the success of dumbing down the education system. The results are particularly spectacular and visible.
Utter nonsense,
Plants consume H2O for photosynthesis and most importantly they consume CO2, and produce hydrocarbonates…
There is stil plenty of water (H2O) on the planet. It is the CO2 what has been dangerously depleted by photosynthesis and has been accumulated in the earth as the coal, oil, and gas.
Mother Nature never considered accumulated in the earth as the coal, oil, and gas hydrocarbonates as fossil-fuels.
Life on Earth was on the edge of ecological catastrophe – it was the appearance of humans with the fire ignition skills who started burning fuels and releasing the so much necessary for photosynthesis CO2 back into the carbon cycle – back into the life’s cycle.
–
https://www.cristos-vournas.com
What do you mean by “hydrocarbonates”?
It is chemistry. Various combinations of H=C bonds, hydro for H and carbon for C.
It is the subject of organic chemistry.
–
https://www.cristos-vournas.com
Spare me the chemistry lesson. The word you are looking for is hydrocarbons, not “hydrocarbonates.”
Hydrocarbons are compounds consisting of carbon and hydrogen. “Hydrocarbonate” is not the English chemical term for a compound of hydrogen and carbon. Hydrogen carbonate, or bicarbonate, is HCO₃⁻ and contains hydrogen, carbon, and oxygen.
If you’re going to condescend to someone about chemistry, it helps to get the chemistry right.
Thank you for your correction, Arkady.
I contend that humans burning these substances returns CO2 to the active carbon cycle, aiding photosynthesis and averting ecological collapse, framing it as beneficial rather than harmful.
–
https://www.cristos-vournas.com
What is your evidence that absent industrial emissions, atmospheric CO2 was actually headed toward ecological collapse on a human-relevant timescale?
The timescale is important: https://www.climate.gov/sites/default/files/2025-04/ClimateDashboard-atmospheric-carbon-dioxide-image-paleo-20250428-1400px.png
How much below the 300 ppm CO2 a plant can do it?
We do not know the CO2 content in the atmosphere before the direct measurements ~200years ago.
–
https://www.cristos-vournas.com
You have now made three claims:
1/ “Life on Earth was on the edge of ecological catastrophe”
2/ “I contend that humans burning these substances… averting ecological collapse”
3/ “We do not know the CO2 content in the atmosphere before the direct measurements”
Do you see the problem?
If 3 were true, what’s the evidence for 1 and 2?
We do not know the CO2 content in the atmosphere before the direct measurements…
But you do know. Do you see the problem?
–
https://www.cristos-vournas.com
Climate change has been in the news for 114 years.
On August 14, 1912, exactly 114 years ago today, the Rodney and Otamatea Times in New Zealand published this:
Atmospheric CO2 then was 300ppm. Today it is ~428ppm.
They had an excuse for not understanding the science in those days.
Today, we’re striving for 600-800 ppm.
That’s progress….
“This tends to make the air a more effective blanket for the earth and to raise its temperature. ”
Air is not a blanket for the Earth.
–
https://www.cristos-vournas.com
And? What was atmospheric C02 during the Roman and Medieval warm periods, and as gullible western fools cut emissions and growth,the far east continues to increase it’s hydrocarbon use,
“And?” indeed.
Ever had a belch so satisfying you have to blow your nose afterward?
Watch out for the use of C02 in place of CO2. Nothing says “ignorance” more eloquently.
On August 8, 2026 at 4:38 AM, entheorie raised a question wich sounds a posteriori surprising:
” The statistic on artic temperature is above average while the temperature present by danish institute is below the average ? ”
Here are temperatures presented by DMI, in absolute form:
Fig. 1
https://drive.google.com/file/d/1PVdIn8d4CpbgslyHgsemkJL1woGmQCSI/view
My question is: why did entheorie look at that part of the blue 2026 line below the red average line, but not at the part above it?
Would he have asked the same is the temperatures were presented in departure form, i.e. as differences between the 2026 daily data and the red baseline for 1958-2002 visible in Fig. 1?
Fig. 2
https://drive.google.com/file/d/1SjXTJSf_G_jEdHdH9LEITIXfiobwDACv/view
Source
https://download.dmi.dk/pub/plus80N_temperatureindex/
This is how the media lies. Trump is asked about the USS Abraham Lincoln being deployed for so long. He answers that it is being replaced. Then the follow is this: Is THE deployment too long? Trump says it should be longer. A reasonable person — even a fake news reporter — would ask or seek clarification if he was referring to the one aircraft carrier or “the” whole deployment. Instead, they are all running the story that he said the USS Abraham Lincoln deployment was not long enough. They can’t help themselves. They will take any chance to cause trouble.
Are we discussing science or politics here? I received a lot of pushback lately from the usual people who do not know anything, but just want to argue. I explained the compelling reason why the lab leak of SARS-CoV-2 has other evidence than an outright admission from the Chinese Communist Party. I pointed out the huge flaw in the zoonotic conspiracy theory, that the crossover animal does not exist.
Now, there is a new book out from a highly qualified scientist who presents the evidence. He is an expert in the field and presents a comprehensive case study. He gives the scientific details of my claim that the COVID-19 outbreak happened too fast from a virus that was highly efficient at infecting humans right from the start.
https://www.amazon.com/Code-Witness-Reveals-Origins-Outbreaks/dp/1641774711
Here is a very lengthy excerpt:
https://disinformationchronicle.substack.com/p/book-excerpt-the-code-as-witness
https://en.wikipedia.org/wiki/Steven_C._Quay
“The origin of COVID-19 has sparked relentless debate since 2020. But if we truly follow the science, the evidence for a lab-based beginning is undeniable. In The Code as Witness, physician-scientist Steven Quay delves into the virus’s genome, tracing compelling clues encoded into the virus’s genetic material that point directly to human engineering…
…Irresponsible gain-of-function research, like the kind that created SARS-CoV-2, is accelerating at an alarming rate, unregulated and unchecked…
…If left unchecked, such research could lead to pandemics that are far more devastating than COVID-19.”
> He is an expert in the field
See for yourself:
https://www.politico.com/news/2026/08/04/steven-quay-anthony-fauci-niaid-covid-lab-leak-01024080
Is our Ivy Leaguer discussing science or politics here?
Did you read the book? Did you read the excerpt? Do you have even the slightest clue what a furin cleavage site is?
Now for the fun part. Did he get the job offer before or after he wrote the book? Does it matter? Are you really that dumb?
Why present a guy who has no formal training in infectious diseases as an “expert in the field”?
Why did our Ivy Leaguer forget to tell that Quay was in line for the job of director of the National Institute of Allergy and Infectious Diseases?
Why promote COVID lab leak theories on a climate science blog at the same time of RFK’s witch hunt and the nomination of CEO in a biotech company?
Has anyone checked ATOS’ price since its IPO?
Our Ivy Leaguer is pompously posturing, once again.
In Willard’s fantasy world with Troglodytes, villains, beasts, and other objects of hatred, there is no understanding of the difference between an “expert in the field” which covers a wide range of people, and a Subject Matter Expert (SME) who is an expert among the other experts. People who do not work in the real world, or participate in high level discussions with other experts, often make that mistake.
troglodyte, noun: a person characterized by reclusive habits or outmoded or reactionary attitudes — aka Willard.
In Ivy Leaguer’s world, physicians who turned biotech investors can opine authoritatively on anything body-related:
https://www.medpagetoday.com/washington-watch/washington-watch/122503
Vaccines. Breast cancer. Penny stocks. Same thing.
Perhaps Our Ivy leaguer forgot Quay has been on the lab leak conspiracy for many years when he rhetorically asked “Did he get the job offer before or after he wrote the book”.
Besides:
https://www.flamewarriorsguide.com/warriorshtm/troglodyte.htm
The last characteristic shows that our Ivy Leaguer has Troglodyte traits. Quay is also a senior fellow at the Hudson Institute, another troglodyte think tank. Quay has been introduced as a witness by Rand Paul at the time, another troglodyte.
Our Ivy Leaguer’s silly No U’s are getting sillier and sillier.
I made a reference to “Willard’s fantasy world”, and he responds with a reference to a fantasy web site. Okay! Got it!
Our Ivy Leaguer must be new to the Internet:
https://www.youtube.com/watch?v=iW4Gdsnr2Bg
One possible explanation why he did not realize his “Did he get the job offer before or after he wrote the book” was rather silly is his own ignorance.
Primitive, close-minded, or aggressively old-fashioned. Pretends to be educated, however.
BACK AT THE RANCH
A controversial 2024 study that some vaccine skeptics used to argue that millions of people likely died as a result of COVID vaccines has been retracted over misinformation and issues with the research.
The article was originally published in the BMJ Public Health in May 2024. It analyzed data from 47 Western countries and concluded that there had been more than three million excess deaths between 2020 and 2022, a statistic known as excess mortality.
The study did not specifically cite vaccines and lockdown measure as the reasons for the deaths, but the authors noted that COVID vaccines that were deployed to save lives also appeared to be responsible for a large number of “suspected adverse events.” At the time of publication, the findings were taken by some prominent vaccine skeptics and critics of governmental pandemic responses—including several Republican lawmakers in the U.S.—as proof that the science and policies around COVID were flawed or even nefarious.
The results also immediately garnered skepticism in the weeks following publication. A month after the study appeared in the journal, the BMJ began an investigation into its quality, as did the Netherland’s Princess Máxima Center, a pediatric hospital, where three of the paper’s four co-authors then worked. One of them, corresponding author and now independent researcher Saskia Mostert, testified before a U.S. congressional subcommittee about the report’s findings in June 2026.
https://www.scientificamerican.com/article/major-covid-study-that-fueled-vaccine-skepticism-retracted-over-misinformation/
An estimate is a guess nothing more,maybe a death certificate with cause of death would help, I wont hold my breath that one exists.
If an estimate is nothing more than a guess, then no wonder Ian and contrarians in general might very well believe they’re doing science by simply saying stuff.
Dullard,
Still pushing the pangolin as the source and that covid vaccines are the only vaccines that don’t have harmful side effects?
Q-Anon,
Found another conspiracy to ideate?
Here’s what it looks like:
https://www.theguardian.com/politics/2026/jul/29/george-cottrell-transferred-2m-mother-beforer-reform-uk-donations
Nuclear plants being feathered all over Europe. Even a few fossil-fuel plants. Water levels are too low, and/or the water too warm, to cool the plants effectively.
Elliott,
Guess what the solar panels are catching fire. There are a couple of hundred instances in the last year vs how many install of solar pv? Still not a good ratio.?
Solar PV is less efficient in the heat, and still doesn’t work at night time. So we still need reliable on demand supply.
NOAA has now officially declared El Niño conditions. And they are predicting stronger than average. This will, of course, be reflected in UAH results over the coming months.
As the Polar Vortex will be transitioning to the north, will UAH Global be able to get above 0.7C? UAH anomalies won’t start dropping until the El Niño is gone.
More flooding in California and Texas, is likely.
In an usual blah blah posted on August 15, I read:
” NOAA has now officially declared El Niño conditions. ”
*
You just need to search for reality, and find on June 11 (!!!):
” El Nino forms, expected to strengthen, say NOAA forecasters
Prolonged period of above-average temperatures in the equatorial Pacific expected to peak this winter ”
*
What you read right now is of course not what was written two months ago:
” El Niño is strengthening, with a greater than 90% chance of a very strong event during the Northern Hemisphere fall and winter 2026-27. ”
*
To understand what this means, you just need to save NOAA’s daily forecasts from tine to time:
April
https://i.postimg.cc/sXVbBdVp/nino34Mon-060426.png
June
https://i.postimg.cc/FKC8NktZ/nino34Mon-070626.png
August
https://i.postimg.cc/vTW01qGQ/nino34Mon-070826.png
Quite simple.
*
Others prefer to endlessly repeat their incredibl<y stupid nonsense, e.g.:
" Got a working model for orbiting without spin? "
despite being themselves unable to present their own nonsensical model.
Yes Bindi, “NOAA has now officially declared El Niño conditions.”
But in all your rambling word salad you appeared to be confused about NOAA’s “advisory” versus “warning”. As usual, science confuses you cult kids. Just like you still don’t understand the difference between “orbiting” and “spinning”.
But, keep stalking me. Some kids have eventually learned by doing that.
On electric cars
https://www.youtube.com/watch?v=noWrkucztJg
Ark,
Nice to see you are an avid recycler. Have you got anything new to say rather than presenting an alternative reality as the foundation of your argument?
That’s a clever satire. Makes all sorts of points at once, and the main one for me pokes a big hole in habit and complacency.
Yes, a clever bit of satire, made even better by the fact that its imagined reversal is not entirely imaginary. Electric cars actually appeared before the practical gasoline automobile.
European economies are taking a hammering from the heat and drought, with several countries now estimated to lose about 1% off GDP. France is the worst at 1.4%. It gets 2/3 of its electricity from nuclear plant, 15% of which is expected to be offline on Friday.
“Two-thirds of UK news articles about wildfires this summer haven’t mentioned climate change”
https://uk.themedialeader.com/two-thirds-of-uk-news-articles-about-wildfires-this-summer-havent-mentioned-climate-change/
Elliot is a dyed in the wool uber-alarmist who unsuccessfully tried to introduce an app here whose sole purpose was to stifle skeptics.
He has the same problem as other alarmists, he tries, in vain, to associate weather disasters with a trace gas in the atmosphere while supplying zero scientific proof of how that is possible.
The wildfires are due to simple weather anomalies driven by unknown forces that occasionally act in unison to produce weather havoc. Those unknowns produced an entire decade of weather havoc in the Canadian and US prairies in the 1930s decade. Coincidentally, the worst wildfire season locally in Canada occurred in 1939.
Here in the province of BC, Canada, the worst local fire is burning in a very arid region. How arid? Sage brush and cactii grow naturally in the region (Summerland). I mean, this area is notorious for droughts yet modern pundits want to blame it on climate change.
Wildfires, like covid, have gained an unprecedented popularity due to the media over-indulging in speculation and propaganda. I am sure Europe has suffered such catastrophes many times and they all went unreported.
A good news, warning for the MAGAmaniacal Trumpistas:
” Trump’s long-shot bid to overturn $5M verdict in Carroll case rebuffed by Supreme Court
The president was found liable of sexually assaulting and defaming E. Jean Carroll in the high-profile civil case. “
Yes, I saw this. Unfortunately the “President” has now reached the stage of lurching around the White House in his pyjamas trying to superglue bits of gold leaf to the marble. When he’s not threatening to bomb your allies he will undoubtedly come up with some other dodge to avoid paying, and thus evade paying up like a man.
Clumsy redundancy in that last comment. Sorry, I’m sure you know what I mean: He’s not a man.
Just as a reminder, I have added a “tarderase” plugin to the stores for Firefox and Chromium-based browsers which allows you to block the trolls on this blog. It doesn’t stop their posts from being delivered in your feed, but it adds a “Mute” button which renders the denialists invisible on your side. This site has a persistent problem with trolls and liars and I recommend just muting them, as Dr. Roy’s attempts to block and moderate them are persistently circumvented. The plugin also adds some visual polish, such as embedding linked images in the posts, which makes the blog a lot more engaging. (IMO)
Dr. Roy, have you considered colonising one of the major blogging sites? You could redirect your URL to such a page and you’d get the benefits of these and other features as part of the package. Medium is my favourite.
ark presents us with a fat advertising executive trying to point out the folly of combustion vehicles. He presents his argument as if the electric car has become the norm and some VW engineer is trying to replace the electric vehicles with a combustion engine-driven contraption.
Why do alarmists contrive to present their pseudo-science as a norm that has to be disproved?
He has conveniently ignored the downside of electric vehicles…
1)the need for a lengthy charging period after a short driving experience. With combustion engines, you pull into a gas station and you are out in a few minutes after refueling. Apparently yhey have fast commercial chargers but having worked in the electrical/electronic field all of my life, I am wary of fast-chargers and the potential for explosions.
2)batteries stop working around 0C. That applies to the battery used to start a combustion engine but we have battery warmers to get around that in cold climates. You can use the warmers on an electric vehicle battery but then you take the chance of the Li-ion batteries exploding and burning your vehicle to the ground with anything else in the vicinity like your home.
The combustion engine battery only needs a brief output of 600 amps or so to start the vehicle. After starting, the turning motor turns an alternator to recharge the battery. Can’t do that very well in an electric vehicle since the current draw on the batteries is to high to replace with the same motor.
3)An average electric vehicles draws 150 to 300 amps to power it on the flat. Constant acceleration on the flat, or driving up hills can increase that current draw to 500 to 1000 amps. In other words, EVs are power hungry monsters.
4)the battery packs will eventually wear out in an EV and the cost to replace them will be high. Replacing the battery packs could range from $5000 to $25,000+.
The combustion engine battery can be purchased for about US$100 and lasts 8 to 10 years.
Thanks, I’ll stick with my reliable combustion engine.
Let’s put numbers on it – EV batteries last 15 to 20 years currently, and the lifespan is increasing with better technology.
They work fine under 0C, though with reduced driving range. In freezing subzero weather they can lose as much as 40% of range, partly from being used to provide cabin warmth.
Modern ICE vehicles last on average 18 years before bering scrapped and broken down for parts. They suffer major failures that costs thousands to fix – blown head gasket, cracked seals and rubber components, gearbox stripping etc. Maintenance costs are comparable.
In the subzero cold ICE vehicles, unless specifically designed, can suffer a range of issues, from just starting up, to a loss of efficiency and higher fuel usage (reducing range) to heat the cabin.
Compare EV vehicles with cars from the 1950s – after 30 years of real life testing, innovation and refinement, these cars could barely go further tan 100,000km (60,000 miles), required lots of maintenance etc.
Electric cars have far fewer moving parts, and far less to go wrong.
Final note: I think some people don’t know the difference between intelligent satire and a ‘fake alternate reality’.
The point was to say “what if” and build a point. It was a soiund point.
Or rather, a collection of points, including the fact you can refill your car at home. You don’t need to drive to a gas station. This went over Gordon’s head apparently. Yes, it takes longer to fill, which is why EV stations are now being built inside shopping centre car parks.
Quite possibly most of the bays in car parks could include a charging facility, getting two jobs done at once – storing the car and filling it up while you shop.
We’ll see what happens in the future.
Gordon,
Have you priced batteries lately?
Bien sûr que le CO2 a une action !
Φυσικά και το CO2 έχει κάποια επίδραση!
//////////////////////////////////
It is too small, CO2 doesn’t warm anything!
The entire CO2 warming concept is a huge mistake!
It is an ecological- religious dogma now.
No one argues there is God. But there is a discussion about what is God’s will?
It is ecologically pure to believe in CO2 warming effects. But there aren’t any.
Am I a good ecologist?
Christos
–
https://www.cristos-vournas.com
Front-page story in today’s Washington Times (hardly a Biden-friendly newspaper): Rebranding: Trump embraces some Biden policies amid economic crunch
Economic constraints are beginning to dictate policy more than ideology is; high borrowing costs, deficits, and affordability don’t care whose name is on the program.
We Are in the Anthropocene—Now What? https://agupubs.onlinelibrary.wiley.com/doi/epdf/10.1029/2025EF007730
Johan Rockström and colleagues have published a thought-provoking paper arguing that the most important question is no longer whether we are in the Anthropocene, but what kind of Anthropocene we will create. Rather than focusing on the geological debate over its formal definition, they examine the Earth’s trajectory over the next thousand years using Earth system models.
Their central conclusion is sobering: even under optimistic mitigation scenarios, the climate does not naturally return to Holocene conditions on human timescales. Because atmospheric CO2 persists for millennia and the climate system has enormous thermal inertia, the Earth remains committed to long-lasting warming. They further show that even very small residual emissions (on the order of 5% of today’s emissions) could be sufficient to maintain elevated temperatures for centuries to millennia unless offset by carbon removal.
The authors also distinguish between a “manageable,” “dangerous,” and “unmanageable” Anthropocene. The greatest uncertainty is not simply future emissions but whether Earth system feedbacks (such as weakening carbon sinks or increasing climate sensitivity) could amplify warming beyond current model expectations. They emphasize that there is no evidence we have already crossed such a threshold, but neither can the possibility be dismissed.
Perhaps the paper’s most important message is that we still retain agency. The Earth system continues to buffer many of our impacts, but those buffering mechanisms cannot be taken for granted indefinitely. Our actions over the next few decades will shape environmental conditions not merely for our grandchildren, but for thousands of years.
“The authors also distinguish between a “manageable,” “dangerous,” and “unmanageable” Anthropocene. The greatest uncertainty is not simply future emissions but whether Earth system feedbacks (such as weakening carbon sinks or increasing climate sensitivity) could amplify warming beyond current model expectations”.
***
The author’s are full of it. They are arguing basically on semantics and consensus, omitting any reference to real, hard science.
In their introduction, they point out that the term anthropocene is not generally accepted. There are several references used to the IPCC, a corrupt outfit pushing lame theories from the 19th century.
Nowhere in the IPCC reviews since 1990, is one shred of hard scientific evidence presented that a trace gas can cause the havoc predicted in IPCC reviews. The basic argument of the IPCC is based on Tyndall’s experiment of 1850 or so that gases like CO2 can absorb infrared energy and warm.
That claim by Tyndall is not under dispute, the argument is over how much the CO2 can warm and how much a concentrations of 400 parts per millions can affect the temperature of the atmosphere. None of that was addressed by Tyndall and none of it has been addressed since with suitable scientific evidence that the trace amount of CO2 in the atmosphere presents any problem whatsoever.
The IPCC has incorrectly blamed the nearly 1C warming of the atmosphere since 1850 on that trace gas. They avoid the real question related to re-warming from the Little Ice Age and how much the current warming is related to that rewarming.
No sir, before we start talking about an anthropocene, we must first establish the real cause of modern warming.
“They are arguing basically on semantics and consensus, omitting any reference to real, hard science”
105 references to peer reviewed literature, if we exclude science newsletters and any IPCC references.
105 references you never even glanced at. Remarkably, your confidence is inversely proportional to your diligence.
So, the intervening 165 years of spectroscopy, quantum mechanics, atmospheric observations, satellite remote sensing and radiative-transfer physics since Tyndall is “lame theories from the 19th century”, while “recovery from the Little Ice Age” is the alternative physical theory?
Recovery is a description, not a forcing mechanism.
The Earth’s temperature cannot simply “recover” for no physical reason. A sustained, long-term change in global temperature requires a change in Earth’s energy balance. That’s elementary physics.
So, what forcing caused your supposed “recovery from the Little Ice Age”? Name the mechanism, quantify it, and show that it explains the observed warming.
Yeah, the concept of a new geological period called the Anthropocene has been formally rejected. One of the reasons? Too political. So, shall we drop the political science and get back to climate science?
Some of the most worthwhile research begins not with a conclusion looking for confirmation, but with an interesting observation, a plausible mechanism, and an unanswered question that can be tested. Reading these two papers, it occurs to me that this may be another such opportunity for a young researcher.
Rockström et al. emphasize commitment: once enough fossil carbon has been transferred into the atmosphere-ocean-biosphere system, returning to the previous state is extremely slow. Even their optimistic pathway leaves global temperature elevated for centuries, while modest residual emissions can maintain substantially elevated temperatures for a millennium.
In a new study, Larcombe & Bierwirth effectively ask a different but related question: what happens if human biology is exposed throughout an entire lifetime to atmospheric CO2 concentrations increasingly outside the range under which our species evolved?
That is quintessentially an Anthropocene question and precisely the longer perspective Rockström et al. argue is missing from much public discussion.
Larcombe & Bierwirth offer preliminary evidence for a testable hypothesis: the changing atmospheric composition characteristic of the Anthropocene may already be detectable in population-level human physiology. Their analysis does not establish causation, but that makes the question more interesting, not less.
For a young researcher, this could make an excellent research topic because the answer is genuinely not yet known. It sits at the intersection of climate science, environmental health, physiology, epidemiology, and exposure science.
A concrete scientific challenge would pose the research question as follows:
But “CO2 is plant food!”
Westland, home of the largest greenhouse industry in the world, is in drought. Freshwater supplies are so constrained that irrigation from surface water has been prohibited. Hundreds of growers risk losing their vegetables or flowers if they cannot secure enough water, potentially costing the industry millions of dollars.
https://www.youtube.com/watch?v=0NdCSjzZ6uA
It turns out plants cannot live on CO2 alone. ¯\_(ツ)_/¯
Arklady,
You have strayed into the world of Willard with your Bindy Goebells levels of malinformation. Who on these posts ever declared that plants don’t need water?
What is true is that plants thrive on extra CO2, we ith their stoma reducing the loss of water vapour with higher levels of CO2. But to conflate that with plants not needing water is dishonest at best.
Q-Anon might like to know that a stoma is a surgical opening made on the surface of the abdomen.
Perhaps he should leave “but plant food” to Puffman and other cranks:
https://www.theclimatebrink.com/p/is-co2-plant-food
Or perhaps not.
Dullard,
Do you want to have a little hold star for finding yet another malapropism in my posts? You found that I posted stoma rather than stomata, between fast typing and predictive text. So we ho’s a clever little Willard.
You can’t deal with logic, reason or abstract argument. Instead you flounder around trying to understand each word. Did your little brain glitch with a malapropism?
Q-Anon,
I rather found that your Climateball talking points are often no better than our cranks’:
https://www.nature.com/articles/nclimate1043
Next you’re gonna write love letters to Deleterious Donald.
ark…”So, the intervening 165 years of spectroscopy, quantum mechanics, atmospheric observations, satellite remote sensing and radiative-transfer physics since Tyndall is “lame theories from the 19th century”, while “recovery from the Little Ice Age” is the alternative physical theory?”
***
Once again, I was clear that I was referencing only Tyndall’s revelation that certain gases could absorb IR and warm. You have responded with a red-herring argument that tries to imply I was referencing all science.
I have demonstrated clearly over the years how sciences like quantum mechanics have rejected the anthropogenic theory. There are no atmospheric observations that support the theory either. No sat observation has supported the theory as far as actually revealing how much CO2 may have contributed to atmospheric warming, a trivial amount at best. In fact, sciences that work directly with gases using the Ideal Gas Law reveal how trivial the warming factor might be.
Spectroscopy has nothing to do with anything wrt the anthropogenic theory.
I don’t know why you insist on referencing radiative-transfer apart from thermodynamics, a well established science that refutes most of the claims of climate alarmists. Radiative transfer is one of the methods used to transfer heat from a hotter source to a cooler surface but climate alarmists have redefined the basics like the 2nd law as a net transfer of heat to meet their crude theories. Using the net-transfer version, they can claim that radiative transfer stands separately from the 2nd law, a claim refuted by Clausius, who created the law.
In fact, quantum theory itself rejects the anthropogenic theory. Although QM has been turned into sci-fi by uninformed zealots, it is a relatively simple science in its most basic sense. It simply associates orbiting electrons in atoms with the more positive nucleus. However, it is still not possible to locate and measure an individual electron hence QM has become based on the likelihood of finding an electron in anyone space about a nucleus.
The zealots have used this lack of precision to reduce Newtonian physics to a laughing stock, even though 99%+ of modern science still relies on Newtonian mechanics. NM admits freely the lack of instruments to measure at the atomic level while QM advocates bray lies about their precision.
QM, which was only developed some 70 years after Tyndall, and of which he’d not have had the slightest clue, revealed the problem with the minor claims of Tyndall and Arrhenius re warming of the atmosphere related to a trace gas. Both Tyndall and Arrhenius offered only opinions on how much CO2 should warm the atmosphere but neither offered an actual scientific amount of warming mainly because they had no idea how to measure it. Oddly enough, no one has measured the warming to date.
Based on Bohr’s definitions that underlie QM, increases and decreases in the kinetic energy of electrons in atoms decide the warming factor. That’s because heat in a mass of atoms is the total KE associated with individual electrons. The same electrons also explain why heat can only ever be transferred hot to cold and cannot possibly be a net heat transfer.
If you apply this to the Ideal Gas Law re mass proportions, it is clearly revealed that CO2 at 0.06% mass of the atmosphere cannot possibly warm the atmosphere more than 0.06C per 1C overall atmospheric warming.
Neither Tyndall nor Arrhenius had that information available to them hence their speculation as to how much CO2 could warm the atmosphere. That has not stopped the IPCC and other climate alarmists from basing their incorrect theories on such speculation.
First of all, an orbital ≠ an orbit.
A quantum-mechanical orbital is a quantum state described by a wavefunction. Bohr’s 1913 model posited electrons moving in permitted circular orbits around the nucleus. It was an important precursor to quantum mechanics, but it was not the quantum mechanics subsequently developed by Heisenberg, Schrödinger, Born, Dirac and others in the 1920s.
Second, you’re confusing heat, which is energy transferred because of a temperature difference, with internal energy, which is a state property. Heat in a body is not “the total KE associated with individual electrons.”
Third, the Second Law establishes the macroscopic direction of net spontaneous heat transfer. It does not require individual microscopic energy transfers to occur only from hot to cold, much less because individual electrons somehow know which object is hotter.
If a 300 K body faces a 250 K body, photons do not travel exclusively from the 300 K body toward the 250 K body; both bodies emit thermal radiation toward the other. What the Second Law requires is that the net energy transfer is from the warmer body to the colder body.
I misspoke when I wrote “heat in a body.” A body does not contain heat; it possesses internal energy.
Gordon,
If you are discussing kinetic energy of electrons, you should realize that each Proton and Neutron in the atom masses 1800 times as much as each electron. They moves as well.
That means the kinetic energy of the electrons does not make a significant contribution to internal energy.
That’s quite the Gish gallop, none of which answers the questions I asked.
Please stay on topic.
Stay with the specific claim you made about Earth’s climate “re-warming from the Little Ice Age and how much the current warming is related to that rewarming”.
What caused the supposed “recovery from the Little Ice Age”? Name the mechanism. Quantify the forcing. Show that it explains the warming.
Saying that the climate “recovered” from the Little Ice Age is like saying that a pot of water “recovered” from being cold. It does not explain why its temperature increased. Something changed the energy balance.
So what changed Earth’s?
No wonder I didn’t obtain any reply from Robertson below my comment about his alleged ‘rewarming from the LIA’
https://www.drroyspencer.com/2026/08/record-low-lake-mead-millennium-drought-or-inevitable-result-of-demand-exceeding-supply/#comment-1752415
This is good ol’ stuff from Sun Akasofu, one of Robertson’s highest authorities after Clausius, Wood, Bohr, Smith aka chiefio, etc, which he endlessly appeals to [BUT… only if and only if they write what fits his egotic narrative].
Especially this chart shows us the huuuuge starting power of this rewarming, with a negative trend from 1850 till 1920, he he:
https://drive.google.com/file/d/13lBlvyMJETEvHDTRSX_3sh_6bnvecVIO/view
Saying that the climate “recovered” from the Little Ice Age is an example of what I think of as the Nominative Fallacy: Pretending to explain something by calling it names. It only takes seconds to ascertain that the LIA and MWP were not even global in extent, and calling a warming a “recovery” explains precisely nothing. An explanation by definition identifies a source of heat. It’s pure wishful thinking.
Saying that CO2 can “warm the planet” is an example of what I think of as the Nominative Fallacy: Pretending to explain something by calling it names. It only takes seconds to ascertain that CO2’s 15μ photons can NOT raise the temperature of a 288K surface. Just claiming CO2 can “warm the planet” explains precisely nothing. An explanation, by definition, identifies a mechanism. Otherwise, it’s pure wishful thinking.
Where’s your explanation/definition, Elliott?
Elliott Bignell at 3:20 AM
Part of the reason I continue to engage with Gordon Robertson is that he has identified himself as an electrical engineer.
As an engineer myself, I believe our profession carries an obligation to maintain professional standards even in informal public debate: to distinguish evidence from opinion, to remain within the limits of our knowledge, and above all, not to make sweeping technical claims that we cannot support with established science, quantitative analysis, and verifiable facts.
That discipline is part of what it means to be an engineer.
Ark, maybe you can help Elliott:
https://www.drroyspencer.com/2026/08/uah-v6-1-global-temperature-update-for-july-2026-0-48-deg-c/#comment-1752636
A perfectly valid choice. I’m also an engineer, of the software genus. My own view is that people like Gordon are simply a waste of bandwidth. Engaging with them creates the false impression that there is something to debate.
Elliott Bignell at 1:55 AM
I understand that view, and yes there are times when I wonder whether I’m simply wasting bandwidth myself.
But what keeps me engaged in this particular case is that Gordon Robertson has repeatedly invoked his credentials as an electrical engineer to buttress his scientific bona fides while at the same time making some remarkably unsupported claims about physics.
That is one of the strange realities of communicating science online: the most confident person in the comments often is the person who understands the subject least, while sounding authoritative enough to persuade readers who don’t have the background to recognize the errors.
So I’m not necessarily debating him in the expectation of changing his mind. I’m also trying to prevent confident misinformation from standing unchallenged for everyone else reading the exchange. There is always a larger, mostly silent audience.
If those of us with some actual knowledge of the subject eventually decide that communicating science isn’t worth the aggravation, we leave the field to those with the least hesitation about explaining things they don’t understand. That strikes me as considerably more dangerous than occasionally wasting some bandwidth.
Ain’t that the truth.
Meanwhile Trump won’t tell us where this alleged Ground Beef Product is coming from. Somehow he’s planning on sneaking it into America without telling us the country of origin, without inspection, without tax. And the odds are that it’s coming from Central or South America.
Two weeks ago the FDA recalled beef from Argentina because it wasn’t inspected! https://www.fsis.usda.gov/recalls-alerts/corte-argentino-usa-llc-recalls-raw-beef-products-imported-without-benefit-import
We can already be sure that the Trumping Boy will earn a horrendous amount from his ‘dark beef deal’.
What if it turns out that the man who arrogantly thinks he’s smarter than the markets and believes he can dictate oil prices, currencies, Treasury yields, and stock prices isn’t some economic mastermind, but just an incompetent fool with an astonishingly inflated sense of his own intelligence?
https://youtu.be/dDLjIBBSlx0
https://archive.ph/TneTQ
Bessent gets Drucked: Treasury Sec Scott Bessent drew sharp criticism from his early mentor Stanley Druckenmiller in a WSJ op-ed, in which Druckenmiller called Bessent’s doubled long-term bond buybacks a mistake (price management, not liquidity support) and said governments that fight market fundamentals always lose. Address the deficit instead.
Robertson once more tries to discredit others due to their different views:
” Elliot is a dyed in the wool uber-alarmist who unsuccessfully tried to introduce an app here whose sole purpose was to stifle skeptics. ”
At least, unlike the filthy insulting trio QAnon, Anderson and Clint R, he avoids harsh insults.
*
” Coincidentally, the worst wildfire season locally in Canada occurred in 1939. ”
This is of course plain wrong. No wonder: Robertson wrote it.
The worst season was 2025 with 8.8 Mha
Follow:
2014, 3.4 Mha
1989, 2.5
2026 (till July!), 2.4
1919 2.0
1825 1.5
1950 1.5
2018 1.3
2023 1.2
2019 0.9
2011 0.7
*
The big difference between 2025/26 and the rest is the number of affected provinces and territories (8 in 2025, 11 in 2026).
*
By the way, Elliott Bignell’s tarderase add-on does not only mute posters with excessive insults: it also shows thumbnail outputs of links to pictures and charts (Google Drive files included), what is very helpful.
Dang Bindi, you’re becoming as bad as Norman. You can’t make a comment without insulting someone.
Also I noticed you still have no viable model of “orbiting without spin”, or any “proof” Moon is spinning.
Keep proving me right. I can take it….
Hey Puffman, riddle me this:
BASH: One of the things that’s happening is there’s a push to start students down a trade school track as early as elementary school. Is that too early?
LINDA McMAHON: I don’t think so
BASH: But elementary school?
McMAHON: I think you can have some introduction of skilled trades in elementary
https://bsky.app/profile/atrupar.com/post/3mtquyyv3272w
How do you feel about child labor?
You’re off topic again, child Willard.
Get your mommy to help you.
How to Deal with a Sky Dragon Crank
Hey Puffman, riddle me this:
What was the topic, again?
Who tried to peddle in one his crankiest talking point?
Bonus:
https://bsky.app/profile/chrisjustice01.bsky.social/post/3mts6aazoks2j
Why are you as phony as Andrew Take?
The more you stalk me child, the more you prove me right.
That’s not stalking, Puffman.
Here’s stalking:
https://www.drroyspencer.com/2026/08/uah-v6-1-global-temperature-update-for-july-2026-0-48-deg-c/#comment-1752613
Where’s Mitch?
Keep proving me right, child Willard. I can take it.
How to Deal with Sky Dragon Cranks
Get new material, Puffman:
2 people die from measles in Pennsylvania, marking state’s first deaths in 35 years
https://abcnews.com/Health/2-people-die-measles-pennsylvania/story?id=135932723
Preferably not self-sealing.
Child Willard, keep proving me right every day. Even though I may not always respond, I appreciate your devotion.
How to Deal with Sky Dragon Cranks
Hey Puffman, riddle me this:
“I JUST DON’T SEE WHY YOU’RE SO ON THE SIDE OF THE BILLIONAIRES, JESSE.”
https://bsky.app/profile/thetnholler.bsky.social/post/3mtw6h7x2ns2x
Please reply to this comment.
You’re too slow. My hand is getting too full.
Projected climate loss and damages from new UK oil and gas fields unequivocally show their destruction of economic value globally
(Preprint; not yet reviewed by a journal.)
https://www.researchsquare.com/article/rs-10724670/v1
World’s oceans hit highest temperature on record as El Niño grows
https://www.bbc.com/news/articles/c62m4gpnp78o
elliott bigmick…”Saying that the climate “recovered” from the Little Ice Age is an example of what I think of as the Nominative Fallacy: Pretending to explain something by calling it names. It only takes seconds to ascertain that the LIA and MWP were not even global in extent, and calling a warming a “recovery” explains precisely nothing. An explanation by definition identifies a source of heat. It’s pure wishful thinking”.
****
I have explained the LIA over and over with in-depth evidence. Elliott pops up once in a while, sees my LIA claim, then presumes I am name dropping without evidence.
There is ample evidence that the LIA was a global phenomenon, despite the IPCC’s feeble attempt to discredit it as a phenomenon local only to Europe. Such propaganda gets them off the hook with their adherents, like Elliott, and allows them to appear as an authority figure for such deniers of science.
In Europe, in the Alps, the Mer de Glace glacier expanded enormously during the LIA. It wiped out long-established villages and farms along its path. Oceans around Europe, although saline, froze in a locally unprecedented manner to several miles offshore. The Thames river at London froze so completely that ice carnivals could be held on the ice each winter. And all this devastation due to something causing Europe only to freeze over. Go figure.
The ijits at the IPCC would have us believe such cold weather occurred only in Europe. There is amply evidence from 1600 onward that the Arctic froze so much that sailing ships were blocked from sailing anywhere in the region. That cold extended down to modern day Florida and Texas and there is good evidence of it in South America and China.
So, here’s our problem. Do we accept the feeble IPCC explanation that we have warmed since 1850 due to a trace gas or do we go with real, hard science, that the entire planet had cooled over a 400+ year period from 1300AD till 1850, when the planet began rewarming?
What we have is the excellent work of Syun Akasofu, who pioneered studies on the solar wind, a geophysicist who has ample experience of warming of the planet, or a load of wankers who send their propaganda to the IPCC and get it published without question?
binny…[GR]”” Coincidentally, the worst wildfire season locally in Canada occurred in 1939. ”
[Binny]This is of course plain wrong. No wonder: Robertson wrote it.
The worst season was 2025 with 8.8 Mha
***
The best coverage of fires came in 2025/2026 while much of the 1939 season went unreported. The propaganda re forest fires has been unprecedented in 2026.
Climate alarmists have, in a very irresponsible manner, gotten everyone fretting about natural events produced by natural weather variability.
The point is this, we have far better coverage of fires these days due to satellites and other telemetry. We are far better equipped to get people to fires. Still 1939 occurred at the end of a local heat wave decade.
Robertson never changes his mind (he keeps fixated on his small — sometimes ancient — scraps of paper or files, and is therefore still unable to adapt his unshakable “thoughts” to reality):
https://drive.google.com/file/d/1lRdIbHU1KOLwet8sa1hK0IOXVvDKjONu/view
Despite based on totally different sources AND totally different source data processing methods, Met Office’s and Berkeley Earth’s surface data both show the same, namely NO REWARMING AT ALL between 1850 and 1920 (both show the very slightly negative trend for this period, namely -0.01 °C / decade).
*
It is highly questionable that this alleged post-LIA rewarming supposedly took no less than SEVENTY years to finally become noticeable.
*
As usual, Robertson singles out one dissenting voice above all others — though only because that voice fits his egocentric narrative perfectly: would namely UAH not show all the time temperatures lower than anywhere else, he then would discredit UAH just like NOAA, NASA, Met Office, Berkeley Earth etc etc.
Exactly as he exclusively focuses on Wood regarding CO2, on Tesla regarding Moon’s spin, on Bohr regarding quantum theory, on Essen regarding criticism of Einstein, on Lanka regarding the denial of the existence of measles, on EM Smith for completely erroneous analyses of NASA or NOAA data, and so on, and so on, and so on.
Ooops!
” on Lanka regarding the denial of the existence of measles ”
should read
” on Lanka regarding the denial of the existence of the measles virus ”
See for example Lanka’s utter lie about the ruling of the German Federal Supreme Court (Bundesgerichtshof, Karlsruhe) in 2016
https://www.anonymousnews.ru/2017/01/20/pharma-luege-aufgeflogen-bgh-urteil-bestaetigt-masern-viren-existieren-nicht/
This court never confirmed anything the like:
https://www.demokratie-durch-volksabstimmung.de/files/2021/11_11_2021/Komprimiert/3-Beschluss%20BGH%20I%20ZR%2062-16%20vom%2001-12-2016%20-%20Es%20gibt%20keine%20krankmachenden%20Viren.pdf
It simply confirmed what the appeal court (Oberlandesgericht Stuttgart) wrote at the end of its ruling:
https://openjur.de/u/892340.html
” Leave to appeal on points of law is denied, as the requirements of Section 543 (2) of the Code of Civil Procedure (ZPO) are not met. ”
*
But… Robertson never cares about such minuscule details.
binny…”This court never confirmed anything the like:
https://www.demokratie-durch-volksabstimmung.de/files/2021/11_11_2021/Komprimiert/3-Beschluss%20BGH%20I%20ZR%2062-16%20vom%2001-12-2016%20-%20Es%20gibt%20keine%20krankmachenden%20Viren.pdf
It simply confirmed what the appeal court (Oberlandesgericht Stuttgart) wrote at the end of its ruling:
****
Once again, Binny comes across as an ijit. He has not the slightest idea of the two court cases nor does he understand Lanka’s position.
Lanka has never claimed the measles as an illness does not exist, he has simply claimed the so-called science used to claim a viral cause is fraught with major errors. He puts his money where his mouth is by offering a 100,000 Euro prize to anyone who can prove, using one scientific paper, that the measles virus has been isolated.
A lower German court ignored his specifications of one paper and allowed a clown to cherry pick from 6 different papers. Based on that chicanery, they awarded the prize to the clown. The upper court reversed the award and charged the plaintiff with court costs.
Lanka appealed to a higher court and to ensure there was no further chicanery, the higher court appointed its own expert. In the end, the expert agreed fully with Lanka and the court reversed the lower court decision, awarding costs to the clown.
Lanka introduced new information during the new trial. He had an independent lab confirm that cells used to infer a virus due to them dying, would die anyway based only on the pre-treatment the cells receive before an alleged virus is introduced. Based on that new info, he inferred that most viruses claimed did not do a control study to rule out that possibility.
They are so desperate to identify a virus that they cheat in labs. They pre-starve the healthy cells to ensure they are weakened then they treat them with an anti-bacterial agent to ensure no such infections affects them. Lanka proved that such re-treatment kills the cells on its own.
I have no idea why Binny and others cannot read and comprehend the simple explanations offered by Lanka. The man is an expert on viruses and the history of the same. He discovered the first virus in the oceans and his history of the virus clearly lays out seriously bad science. Louis Pasteur, for example, admits in his memoirs that he cheated.
As late as 1935, one scientist claimed that viral theory contradicts Koch’s Postulate, a literal set of rules for identifying an infectious agent. As late as 1950, science was no further ahead re viral theory then the DNA molecule was discovered. After that, all the rules were changed and became dependent on inferences based on RNA and DNA.
As late as 1970, the science of retroviruses was in its infancy. Many scientists were opposed to the theory and an early pioneer warned about inferring viruses from RNA in the human body. His reasoning was simple: RNA is found in plentiful amount in the human system and often indicates cell death due to illness.
Of course, Binny is simply regurgitating the same pseudo-science offered by climate alarmists.
Once more, Robertson tries to adapt reality to his preferred, anti-warming narrative:
” The best coverage of fires came in 2025/2026 while much of the 1939 season went unreported. The propaganda re forest fires has been unprecedented in 2026.
Climate alarmists have, in a very irresponsible manner, gotten everyone fretting about natural events produced by natural weather variability. ”
*
There is not even ONE Canadian source reporting about 1939 as the worst wildfire season locally in Canada.
Robertson very certainly confounds Canada with Australia: 1939 is namely associated with the great “Black Friday” fires, which took place in Victoria in that year.
After brazenly lying over and over and over about foreign countries paying his tariffs in 2025, Trump now unwittingly confesses the truth.
“…for the next 90 days, the United States will allow up to 300,000 metric tons of product for ground beef to be imported with no out of quota tariff…
…This deal will reduce prices for Americans …
…beef prices have increased unreasonably for U.S. consumers…”
If the SCOTUS-ruled repayment of illegal $100 billion+ tariff revenue to American companies didn’t make it obvious who foots the bill, we now have Trump’s own posts and official Whitehouse declaration saying what everyone (except mindless MAGA) knew back then.
Trump doesn’t bother remembering his lies. No need, when he has cult followers who forget his previous statements the next time he opens his mouth.
The World Adds a Third Terawatt of Solar Power
https://e360.yale.edu/digest/three-terawatts-solar
Partnership between UEFA and SolarPower Europe: Football stadiums to be outfitted with solar canopies, exploiting an obvious available surface area.
https://balkangreenenergynews.com/solar-power-to-energize-european-football-uefa-teaming-up-with-solarpower-europe/
Trump: “WE DON’T NEED ANYTHING FROM CANADA.”
Also Trump: “Selfishly, we need aluminum in this country. We don’t have it. We get it all from Canada for the most part, and we need it badly.”
Wait ’till he finds out that U.S. Farms Rely on Canadian Potash.
At this point, his greatest political opponent is the last thing that came out of his mouth.
Ultra-low emissions zones in London are found to be associated with improved lung capacity in children:
Impact of the Ultra Low Emission Zone on lung function growth in children in London, UK: a prospective parallel cohort study
Findings
Interpretation
https://www.thelancet.com/journals/lanpub/article/PIIS2468-2667(26)00163-5/fulltext
By-the-by, I understand that His Majesty the King has instructed Mark Carney that Lake Ontario is henceforth to be named “Lake Obama”.
Three weeks ago Neil deGrasse Tyson warned about an American brain drain.
Yesterday The New York Times reported about Canada recruiting 48 researchers from U.S. universities, including Harvard, Yale and MIT.
Today the Financial Times reports that the 48 U.S.-based academics include researchers from Harvard, MIT, Carnegie Mellon and Berkeley.
The TL;DR is that Canada has committed more than C$500 million as part of a government-funded effort to attract scientific talent, targeting strategically important fields ranging from artificial intelligence to climate science, with another 63 academic hires planned next year.
What makes this particularly troubling is that the Trump regime appears to be making Canada’s job easier. Researchers cite unpredictable funding, restrictions affecting foreign students and academic freedom, and attacks on scientific research itself among reasons for leaving.
For much of the last century, the US was the beneficiary of perhaps the greatest sustained brain gain in modern history. We attracted many of the world’s best scientists, engineers, physicians and entrepreneurs by offering extraordinary universities, research funding, intellectual freedom and an environment in which talented people believed ambitious work could be pursued. That accumulation of human capital helped produce American leadership in computing, biotechnology, medicine, aerospace, energy and, more recently, AI.
Now we appear to be conducting an experiment in running that process in reverse.
Competitive advantages migrate not overnight, but one laboratory, one scientist, and one generation of graduate students at a time.
The Trump regime sees reducing support for higher education and research as victories in a domestic political struggle. Canada sees the same policies as a once-in-a-generation opportunity to acquire intellectual capital that took the US decades to assemble.
We may not know which interpretation was correct for another decade or two. By then, unfortunately, rebuilding what was lost will be vastly more expensive than preserving it would have been.
There is something profoundly unconservative about destroying institutional capital accumulated over generations in pursuit of short-term political objectives, particularly when rebuilding it may take another generation.
¯\_(ツ)_/¯
File this one under “Leopards Eating People’s Faces Party.”
Milo Yiannopoulos, the British far-right agitator and early Trump supporter, has been deported from the United States by ICE after overstaying his visa and failing to appear for an immigration hearing. He entered legally in 2019; an immigration judge issued a final removal order in July, and ICE arrested him at the New Orleans airport before deporting him to Britain.
What makes the story almost too perfectly on-the-nose is Yiannopoulos’s own record on immigration. He has advocated deporting “millions and millions and millions” of people and called for ICE checkpoints at supermarkets, with immediate deportation for people unable to prove legal residency.
For anyone unfamiliar with the meme, the Leopards Eating People’s Faces Party describes someone enthusiastically supporting a policy because of what it will do to other people, only to be astonished when the same policy is eventually applied to them.
In this case, the leopard did not merely eat his face. Milo had previously been cheering it on and suggesting where it should hunt.
¯\_(ツ)_/¯
This level of self-delusion will one day have its own chapter in the Diagnostic and Statistical Manual of Mental Disorders simply titled: “I Never Thought the Leopards Would Eat MY Face.”
The term ‘self-delusion’ should be listed as a mental disorder. The term ‘self-image’ explains that adequately.
We human have a faculty for forming mental images of ourselves which are equally delusional.
A Scottish bard once noted it as…”O wad some Power the giftie gie us / To see oursels as ithers see us!”
Translation…O would some power the gift to give us, to see ourselves as others see us.
Be that as it may, what others see is filtered through their own delusions. The image itself is delusionary and the name suggests it. Image is short for imaginary, so what we see as an image of ourselves or others has anywhere from a little error to a major error.
In fact, the disconnect between self-image and reality is the source of income for many psychologists. The term as I learned it is neurosis, an inability to distinguish how one perceives the world and how it actually is.
Perfectly explains climate change hysteria and the idea that the Moon rotates on a local axis.
Other delusions of note…that time is real, that the Sun rises and sets, that the universe was formed out of nothing in a Big Bang, that life began as a fluke accumulation of inorganic elements in a medieval soup, that heat is not energy, etc.
test
Just as lunar rotation is not scientifically controversial, neither is the fact that it is impossible to understand, let alone accurately predict, the medium to long-term evolution of weather or climate without accounting for radiative transfer processes in the atmosphere. Even on very short timescales (hours), radiative absorption and emission at Earth’s surface and at cloud bases and tops have noticeable effects on everyday weather. Key examples include the initiation of convection through solar heating and the formation and subsequent evaporation of frost, dew, and ground fog. In general, as the timescale increases, radiative processes become increasingly important in determining the atmospheric and surface energy budgets and therefore the evolution of the climate system.
One important distinction should nevertheless be maintained: lunar rotation is a relatively simple kinematic fact, whereas atmospheric radiative transfer is a complex quantitative physical process. The comparison is therefore not one of complexity, but of whether the underlying phenomena are scientifically established. In both cases, they are matters of observation and measurement rather than conjecture. Lunar Laser Ranging measures the Moon’s three-dimensional rotational state and even small physical librations superimposed upon its synchronous rotation; atmospheric observations likewise directly measure wavelength-dependent absorption and emission, radiative fluxes, and radiative heating and cooling. Any quantitative description of atmospheric behavior must therefore account for radiative transfer alongside convection, latent and sensible heat transfer, fluid dynamics, and other coupled processes.
¯\_(ツ)_/¯
“One important distinction should nevertheless be maintained: lunar rotation is a relatively simple kinematic fact…”
***
Still awaiting your explanation. I have provided kinematics to prove the Moon is not rotating about a local axis but exhibiting linear motion converted to equally linear curvilinear motion. Isaac Newton agreed.
All you have to support your theory is an equally vague ‘tidal locking’ theory. There is not a shred of kinematics theory to back that theory.
In fact, your theories on global warming/climate change are equally vague.
Start here: https://www.drroyspencer.com/2026/09/uah-v6-1-global-temperature-update-for-august-2026-0-68-deg-c/#comment-1753472
And the here: https://www.drroyspencer.com/2026/09/uah-v6-1-global-temperature-update-for-august-2026-0-68-deg-c/#comment-1754295
https://ibb.co/s9jc1xHm: The COM vector (blue) follows a curved trajectory. But the body-fixed vector (green) behaves entirely different. If the Moon were merely undergoing curvilinear translation without rotation, the body-fixed vector would remain parallel to its original orientation relative to the fixed stars. It doesn’t. That is the standard kinematic definition of rigid-body rotation.
¯\_(ツ)_/¯