
 Home/Blog
NOTE: I’ve made a couple of updates/clarifications below based upon comments on this post.
Lake Mead behind Hoover Dam is now within several feet of the lowest level at which turbine power generation must be greatly curtailed. Recent news articles often blame the cause on a “millennium drought” being experienced in the West. Of course, much of the western U.S. experiences drought conditions every summer, which is part of the normal climate there. Tens of millions of people like to live where it is sunny most of the year, and agriculture thrives where photosynthesis (lots of sunshine) is abundant… assuming enough water supply for irrigation.
Obviously, people need water, which is why virtually no one lives in the Sahara Desert. Add in the beauty of the Pacific Ocean, and it was inevitable that water demand would exceed supply. Even in 1922, before most people moved out west, the Colorado River Compact was negotiated to divide up the Colorado River’s water among seven southwestern states: California, Nevada, New Mexico, Arizona, Colorado, Utah, and Wyoming.
Most of the water in the Colorado River is from snowmelt in the Rocky Mountains. Most (50% to 70%) goes to agriculture. And, yes, the annual runoff flows into Lake Mead (which was filled after construction of Hoover Dam was mostly completed in 1935) have been below “normal” in recent years. But calling recent reduced streamflow (and as a result, lower Lake Mead water levels) the result of a “millennium drought” is sloppy reporting.
Numerous studies suggest that the original Colorado River Compact of 1922 was based upon a period of unusually high precipitation. This was discussed in a paper entitled “New Streamflow Reconstructions for the Upper Colorado River Basin: Placing Recent Droughts into a Centuries-Long Context“, which is a very readable review of various studies that have reconstructed Colorado River flows at Lee Ferry over the last 500 years from tree ring data. While the paper is a little dated (2006), the conclusions remain the same today.
Here are a couple of noteworthy quotes from that paper (bold added):
“The Stockton and Jacoby reconstruction of the annual flows from 1520 to 1961 contained several important findings, including that the highest sustained flows in the entire record occurred in the first part of the 20th century, the period upon which the Colorado River Compact of 1922 was negotiated, while the most persistent and severe drought occurred in the late 16th century.“
“…Colorado River allocations were based on one of the wettest periods in the past five centuries, while droughts more severe than any 20th-21st century event have occurred in the past.”
I’ve created a chart of the annual streamflows at Lee Ferry with some annotations showing periods of 3+ year droughts, the long-term trend (5th order polynomial fit) since stream gage data started in 1906, and four different estimates of the long-term (500-year) normal streamflow at Lee Ferry reconstructed from tree ring data.(UPDATE: the 2026 estimate is not just a repeat of the 2025 measurement, it is the central estimate of several quantitative evaluations of what the 2026 water year [October through September] will be based upon Lee Ferry gage measurements.)
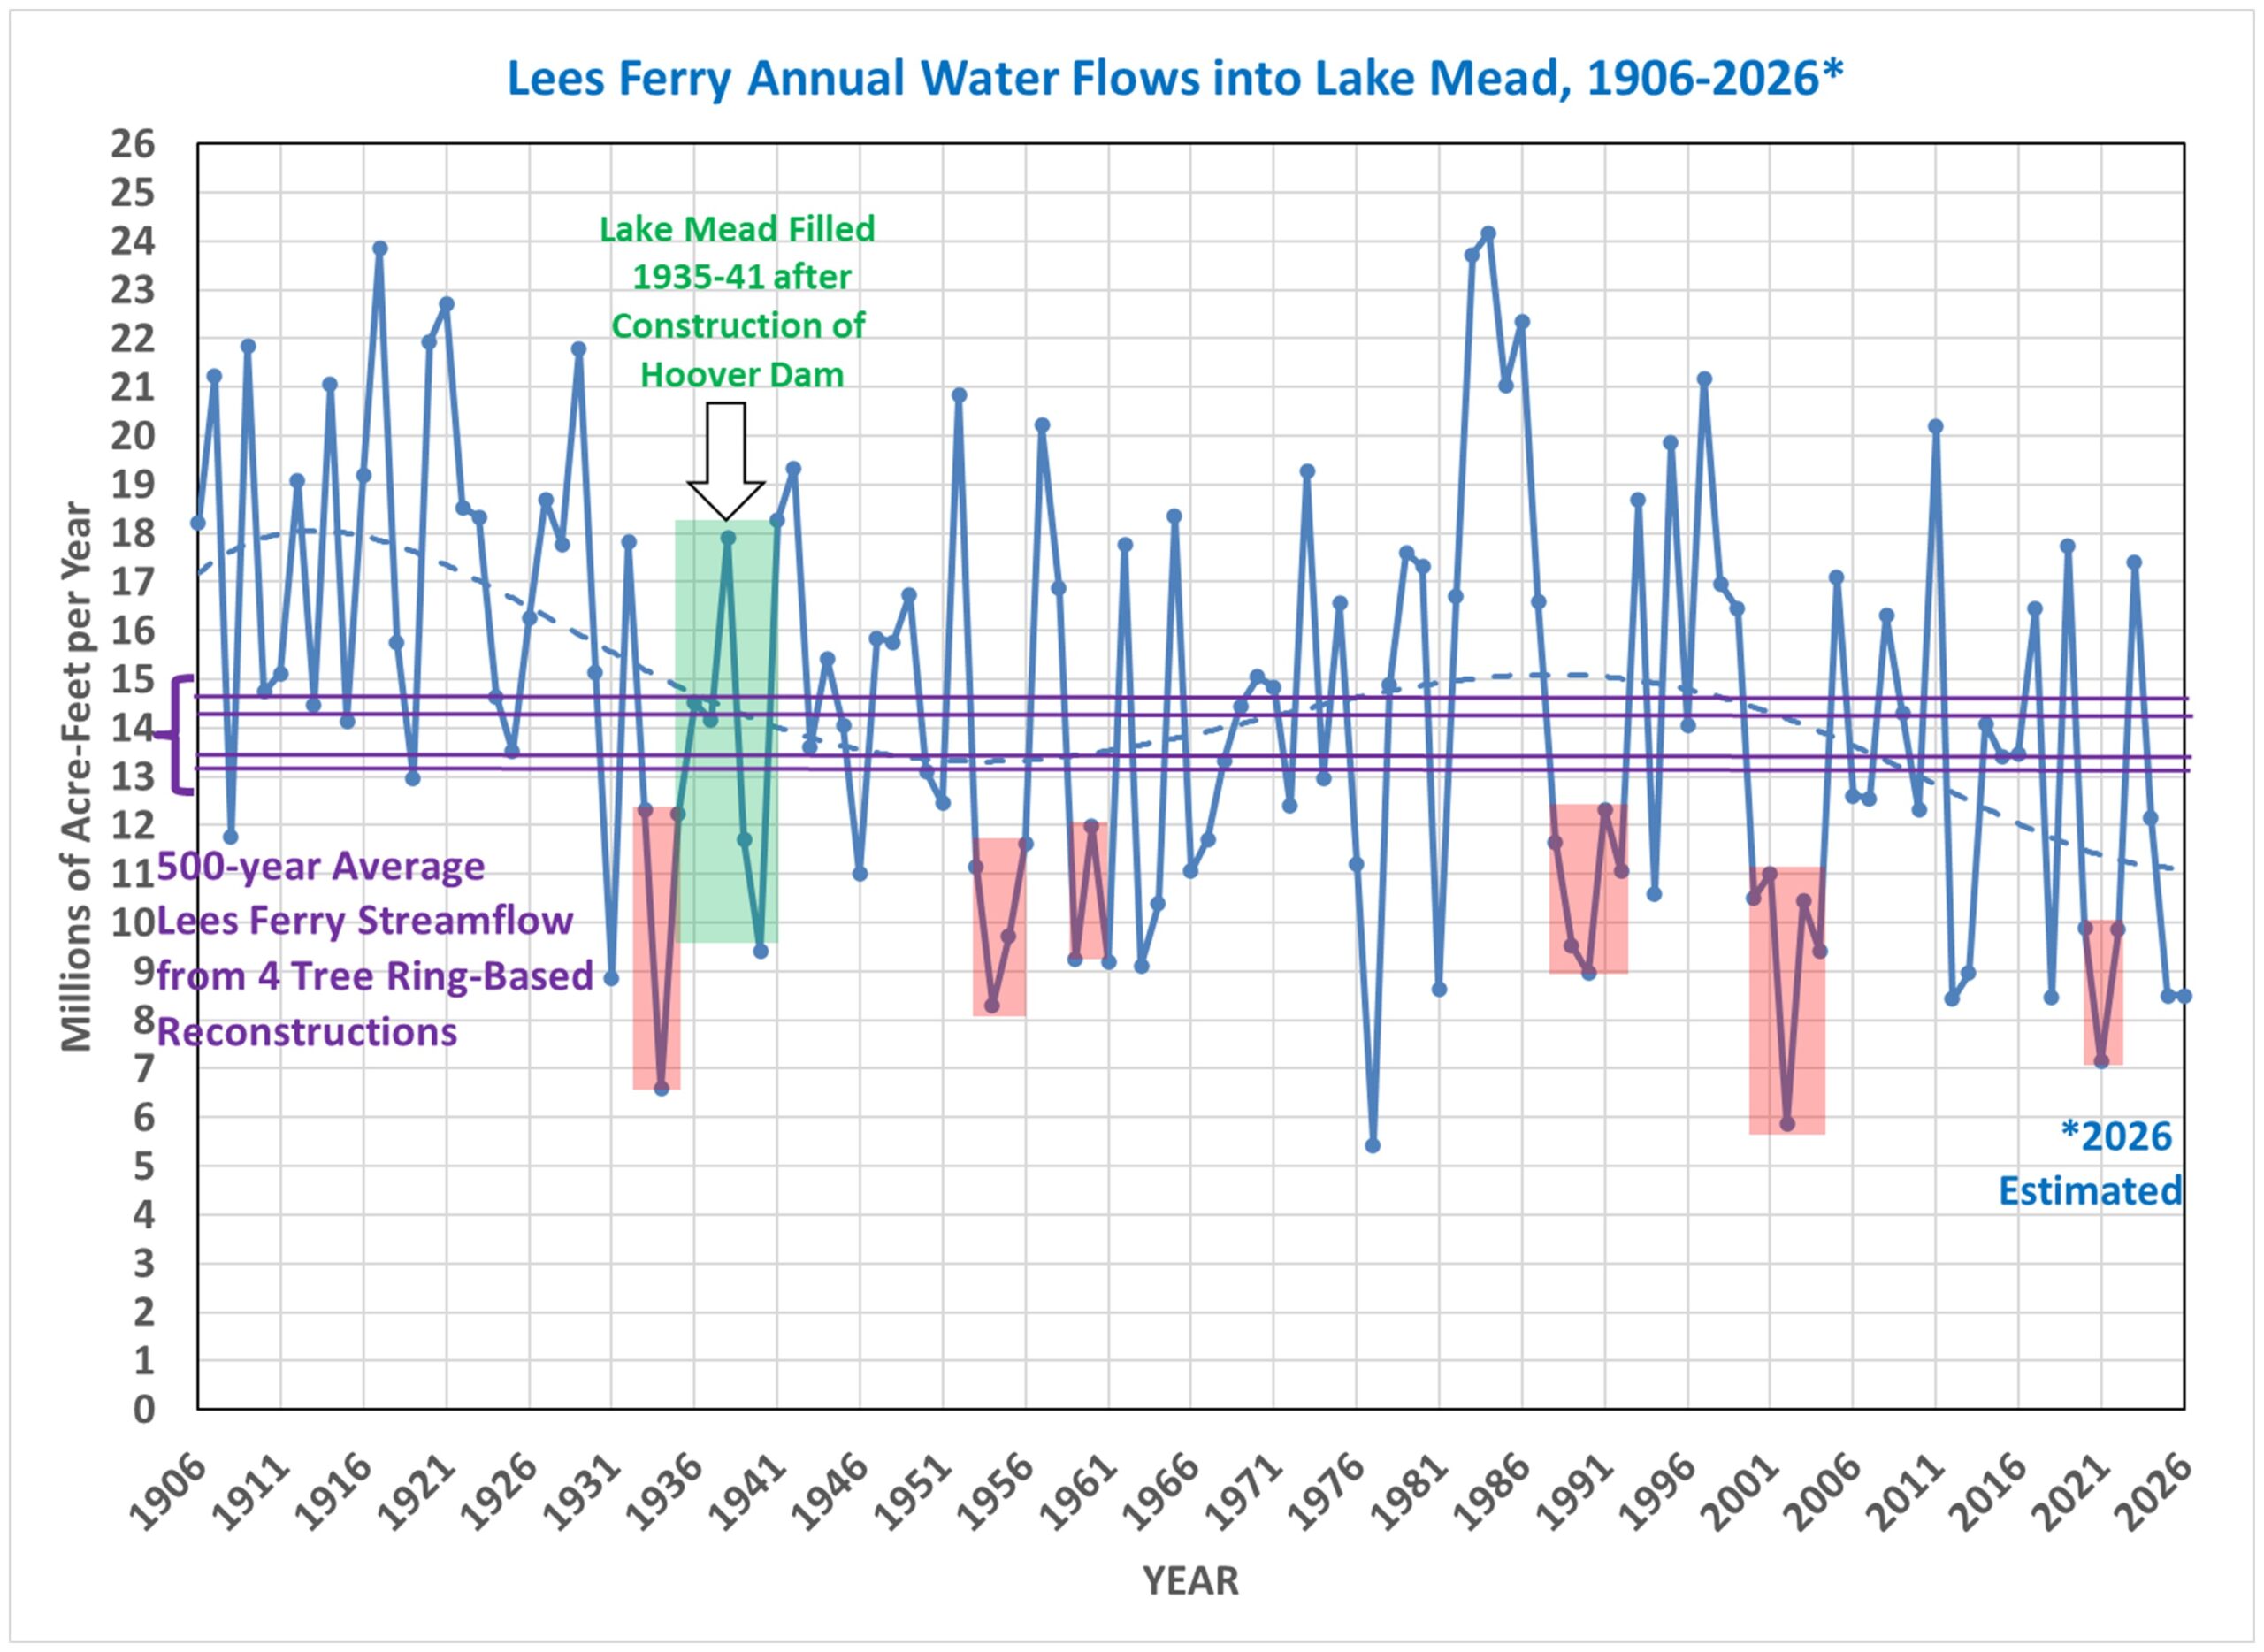
As can be seen, the period before Hoover Dam was constructed was unusually wet. From the 1930s onward, there has been little net trend with some very wet years and very dry years, with up to a factor of 4-to-5 variations in the annual flows into Lake Mead. Six drought periods of at least 3 consecutive years are shown in red. Note that it took only 5 years to completely fill Lake Mead, which was accomplished by reducing the streamflow below the dam by about 30% to 40% of what the normal flows have been in recent decades.
From the above graph, I think one would be hard pressed to say there has been a statistically significant decrease in streamflow since the 1930s. (UPDATE: the linear trend for 1932 [a wet year] to 2025 is -0.013 +/- 0.016 million acre-feet per year, so it is not significant at the 68% confidence level). The major problem is that water usage exceeds what Mother Nature can reliably provide on a long-term basis. Several years ago I discussed this problem in a post in which I included the following graph (also rather dated) of Colorado River water supply versus usage.
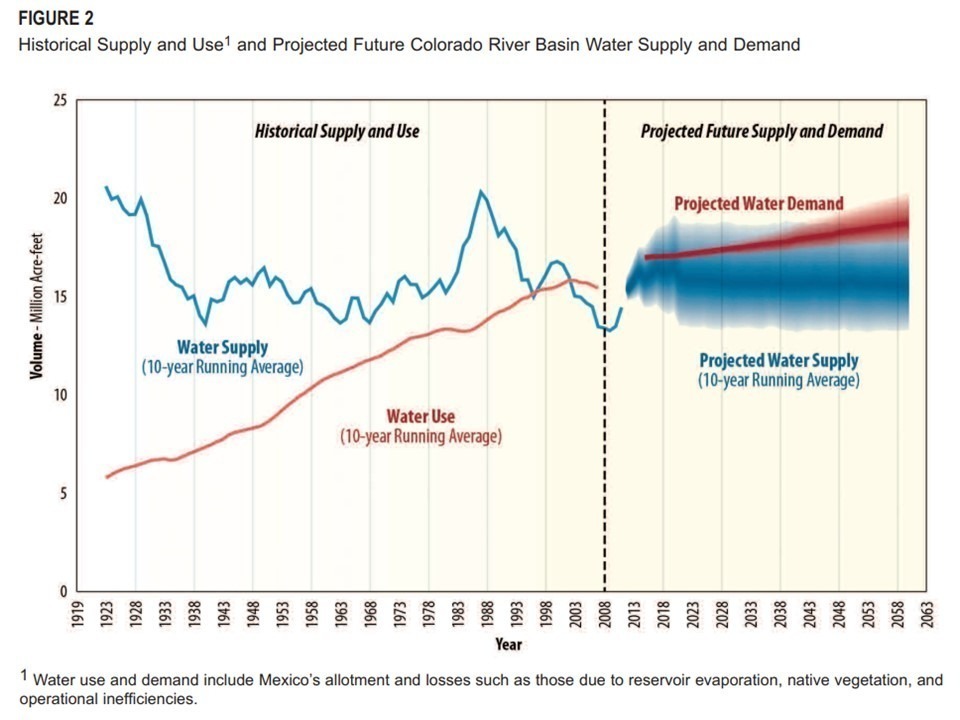
As can be seen, since about 2000, usage has exceeded supply, and given the natural multi-year variations in streamflow, it was only a matter of time before Lake Mead water levels would fall to operationally low levels.
In that same post I showed the average of over 100 CMIP6 climate model runs that show precipitation in the Colorado River watershed increasing substantially with global warming, so blaming the recent dry years on human-caused climate change seems a stretch. (UPDATE: While it is true that drought is a function of both precipitation and evaporation, and warming can cause drought even if precipitation does not change, water releases from Hoover Dam have been declining since 1998, so increased evapotranspiration from irrigation uses downstream of the dam [the main use of Colorado River water] cannot explain decreasing Lake Mead water levels. Direct evaporation from the lake surface is very small and changes little with warming. And there has been no statistically significant trend in streamflow input at Lee Ferry since 1932.)
And calling the recent dry years a “millennium drought” is just fake news

Dr Roy Spencer,
a very timely article. In the UK and the rest of Europe there is wide spread drought that is being blamed on the climate change bogeyman. The MSM will blame climate change rather than consider that even part of the issue might be natural supply Vs human demand.
I believe it is one of the main rice growing areas of India where they have been drilling deeper into the aquifer in the search of water. Yet every few years they have to go even deeper to extract the same quantity of water as the aquifer is running dry.
In Brasil, one of their main cities is suffering from too much water extraction from the aquifer. Tall building are suffering from subsidence as the artesian basin is running dry.
No doubt there are many other real world examples of demand out striping the demand.
Lake Meade cure is simple, stop wasting precious water on electric power and use nuclear! Save the water for humans and ag! Israel desalinates major portions of its water supply for people and ag!
what would it cost to water all of CA ag land annually with desalinated water plus natural rainfall??
Dr. Spencer
I just read your August 2022 post that you linked.
In your post, you point out that climate models don’t project declining annual precipitation over the Colorado River watershed, and use this as evidence against climate change causing increasing drought or water-supply problems.
The problem I see with that argument is that precipitation alone provides an incomplete picture of drought. Water availability depends not only on precipitation, but also on atmospheric evaporative demand and the resulting water losses from soils and vegetation.
You can therefore have roughly the same precipitation + higher temperatures → greater drying pressure and drought stress.
It is even possible for precipitation to increase slightly while warming still increases drought risk.
This paper addresses exactly this issue:
https://www.science.org/doi/10.1126/sciadv.1600873
Their analysis considers temperature as well as precipitation and uses drought measures such as PDSI and soil moisture, with particular attention to JJA drought conditions, rather than relying on annual precipitation alone.
It might therefore be more informative to look at something like the Southwest PDSI record alongside precipitation:
https://www.ncei.noaa.gov/access/monitoring/climate-at-a-glance/regional/time-series/107/pdsi/1/0/1895-2025?filter=true&filterType=loess
There is also a substantial long-term warming trend in the Southwest:
https://www.ncei.noaa.gov/access/monitoring/climate-at-a-glance/regional/time-series/107/tavg/3/8/1895-2025?filter=true&filterType=loess
So I don’t think the absence of declining annual precipitation is sufficient to conclude that climate change theory doesn’t support increasing drought.
You are right that human water use plays an important role in declining water levels. But that does not exclude a contribution from global warming.
Both can be, and the evidence indicates both are, contributing to this.
Kynqor,
Putting aside any changes in rainfall. Many different regions around the world are suffering from too much water extraction from rivers & artisan basins.
This is the main issue that needs to be addressed in the short term, the next couple of years. The long term changes, of 30 years, also need to be addressed.
So far governments/water companies tend to do nothing, other than smoke & mirror gimmicks.
Studies that you have found are if anything a distraction from the immediate issues. Long term they may be more useful.
> Putting aside any changes in rainfall.
Since “estimates of megadrought probabilities based on precipitation alone tend to underestimate risk”, it stands to reason that you’d put it aside, Q-anon.
Anon
That framing might have made more sense several decades ago, when global warming was largely being discussed in terms of future impacts. But we are no longer having that discussion from the perspective of the 1980s.
Here is the Southwest PDSI record, using annual averages and extending through the present:
https://drive.google.com/file/d/15yKzTky6k2ed2R5kv6K25DtcYtlgIpLx/view
Of the last 28 years, 24 have had negative (drier) annual PDSI values, and 2026 (year to date) currently has the lowest value in the 126 year record.
So the drought conditions themselves are already an immediate problem, not a distant concern.
Again, I agree that excessive water extraction is an immediate problem that needs to be addressed.
Addressing one does not make the other irrelevant.
You can simultaneously have excessive demand on the human side and a warming-related deterioration of conditions on the supply side.
Kynqora,
Is the PDSI valid for an increase in CO2? Plants have already shown that they transpire less with the increasing CO2 levels.
How often do you hear that the governments admit that they haven’t planned for increases in water extraction Vs climate change is the cause? Even in the UK the MSM will repeat Gavin Newscum, with that attitude will the near term issues are bf resolved. And as I pointed elsewhere on this is not just limited to an American region it is often repeated across many countries.
That is a real limitation you bring up.
But we also have other hydrological measures that do not depend on estimating evapotranspiration in the same way as PDSI. For instance, in this paper:
https://journals.ametsoc.org/view/journals/eint/21/10/ei-d-17-0007.1.xml
The authors calculate runoff efficiency for the UCRB, which is simply streamflow divided by precipitation. That measures the resulting precipitation-to-streamflow relationship after all the real-world processes, including any CO2 effects on plants, have already occurred.
For example, higher CO2 can cause plants to transpire less water. If that effect saves enough water to increase streamflow, that additional streamflow would already show up in the runoff-efficiency measurement.
See this time series of 10-year rolling averages for PDSI. I did this because the authors in this study calculate runoff efficiency using 10-year rolling averages:
https://drive.google.com/file/d/1j8WUgsRvLo8fsxAY8VZzNWNWd47jrdDs/view?usp=sharing
Compare that with Figure 2c in the paper I linked.
They are qualitatively consistent with each other. The early 1900s are relatively high/wet, the mid-century is generally lower, the late 1970s–80s show a substantial recovery/increase, and the 2000s onward have persistently low values.
That suggests the drying signal in PDSI is not simply an artifact of how PDSI estimates evapotranspiration.
Dr. Spencer
[“Direct evaporation from the lake surface is very small and changes little with warming. And there has been no statistically significant trend in streamflow input at Lee Ferry since 1932.)”]
Could this partly be a result of endpoint sensitivity in the linear trend?
See Figure 2a from:
https://journals.ametsoc.org/view/journals/eint/21/10/ei-d-17-0007.1.xml
1932 occurs during the transition into a low-flow period, and given the substantial multidecadal variability in precipitation in the UCRB, the estimated linear trend could be sensitive to the choice of starting year.
Perhaps choosing a different starting point, such as 1906, would produce a different result?
In any case, the recent smoothed Lees Ferry streamflow values in their Figure 2a appear to be among the lowest in the record.
The authors in this study examined naturalized streamflow at Lees Ferry (estimated streamflow with the effects of human diversions and depletions removed).
They find that runoff efficiency (streamflow per unit of precipitation) was above average during the cooler 1906–33 period, near average during the near-average-temperature 1934–87 period, and below average during the warmer 1988–2012 period. The 10-yr moving averages of temperature and runoff efficiency are strongly negatively correlated.
Furthermore, their second multiple regression separates the seasonal contributions and finds that the temperature effect is substantially stronger during the warm season (Apr.– Sept.) than during the cool season (Oct. – Mar.).
This seems consistent with a role for increased evapotranspiration from the basin.
Clearly demand for water in the Colorado Basin has increased and that’s a problem. Probably the estimates for river flow from the early 20th century were biased high by a run of particularly wet decades.
Having acknowledged this and understanding that you haven’t specified specifically how the 1906-1934 data was constructed, haven’t specifically identified where your 1935-2025 is sourced, and with the assumption that “2026 projected” is simply 2025 repeated (which is questionable given record low snow pack upstream, but probably better than leaving 2026 out all together).
The choice of representing “the long-term trend (5th order polynomial fit)” is going to be questioned by anyone with competence in curve fitting as it’s the lowest order polynomial that curves up in recent years. You’ll be accused (rightly in my opinion) of cherry picking a fit that minimizes the recent decline in flow while not obviously being statistically significant.
https://southstcafe.neocities.org/climate/lake_mead_inflow_1906_2026.png
To this point, the statement, “From the above graph, I think one would be hard pressed to say there has been a statistically significant decrease in streamflow since the 1930s” without having done the obvious significance test on a linear fit (statistically significant at the 90% level but not 95% since 1935, and very much significant since 1906) seems like a knowingly selective representation of the data.
A fair representation of the situation in my opinion includes the following three major points:
1) Early 20th century estimates of Colorado River flow were biased by apparently high than normal flow over the estimate period.
2) Water usage increased over the 20th century and probably reached unsustainable levels around the turn of the century.
3) Water flow into the Colorado is almost certainly decreasing since 1906 and likely since 1935.
Link to Google Gemini AI thread looking into this data:
https://share.gemini.google/IHKVLvkvJvzh
The incompetence or dishonesty in the media contributes to the problem in my view. I have seen some news reports which state directly that climate change is causing water districts to have to reduce their water withdrawal from the rive basin, when in fact it is the exact opposite. Increasing excessive water draw is the whole problem.
Another issue is the impact downstream from Hoover Dam. If they have to reduce power generation that is one problem, but there is already very little water left when the river gets to Mexico.
Tim,
In the UK there has been no investment in water storage for decades. Since the last major infrastructure investment the UK population has grown by 20%. Water demand has decreased due to governmental dictat, but the main issues have never been addressed.
Sadly, it seems to be the same old issue of governmental incompetence.
Once responsible gubmints get involved, things get done:
https://www.gov.uk/government/publications/a-review-of-englands-draft-regional-and-water-resources-management-plans/a-summary-of-englands-draft-regional-and-water-resources-management-plans
These gubmints tend to have the same bias as reality, and so displease troglodytes.
Tinkerbell always cherry picks information out of anything he links. That’s what propagandists do. Tinkerbell, is Mao Zedong your hero?
Troglodyte remains obvious that one cherry is enough to refute the claim that there are no cherries:
https://www.reuters.com/world/us/trumps-funding-cut-stalls-water-projects-increasing-risks-millions-2025-07-20/
He might still invest in catering trucks, however.
Just in case he needs to flee from a country.
Dullard,
Was talking about what has happened in the real world, not what might happen if everything works.but as many projects fail on the UK due to: money, over runs, lack of political will, Evo activists, great crested newts, algae, etc there is little hope that any of this will actually occur.
Anyway you mentioned that each of the schemes provide only 10 million liters per day or enough for 66 thousand people. Yet 12 million people extra people now live in the UK since the last major water storage solution was completed.
Maths is obviously not your strong point . What is??
Blabbing is Tinkerbell’s strongpoint, not math.
Q-Anon,
I thought you would have been happy to know that investments in water storage have been made, and more were on the way. Some other good news:
https://www.reuters.com/world/uk/uk-regulator-provisionally-approves-46-billion-water-companies-2026-08-13/
My mistake.
Please, do continue saying stuff.
Willard says:
”Water companies and regional groups have reviewed a large and varied number of options locally, regionally and nationally to find best value solutions.”
Best value in whose opinion? I asked google AI whether the public well understands what it costs them for the environmental regulations. And it answer this:
”No, the vast majority of the public does not understand how much this costs them, primarily because the financial trade-offs of environmental regulations are deeply hidden within complex economic systems.”
Sounds a lot like water management in California.
> Willard says
One day Gill will be able to recognize a quote.
It looks like this:
https://www.eenews.net/articles/white-house-halts-11b-for-water-projects-in-blue-states/
That should make Q-Anon sad.
Why not follow up on it Willard?
Perhaps Trump wants to focus on clean drinking water for people instead of “funding bike lanes in Cape Cod, billion-dollar fish ladders, and municipal sewage systems,” “Several notable projects under review are New York Harbor, Port of Long Beach, Baltimore Harbor, and projects in the San Francisco Bay Area.
This so funny that Troglodyte is a perfect description of everything concerning Willard. It represents a disconnected person who is out of touch and completely lost in a science discussion. That is the perfect description of Willard’s behavior here. While I am at it, Tinker Bell (sic) is a sympathetic character.
What is wrong with you people? Maybe I know.
A pesky little fairy from Never Never Land.
One good way to recognize when contrarians lost a scientific argument to Team Science is when they keep complaining about “the media”.
Here’s a semi-regular reminder:
https://www.drroyspencer.com/2026/08/uah-v6-1-global-temperature-update-for-july-2026-0-48-deg-c/#comment-1751743
Back in my days, Ivy Leaguers knew now to make more credible No U’s.
In the fantasy world, a reference to a fantasy web site seems impressive. In the real world it just makes the whole thing very humorous,
Our Ivy Leaguer is falling from his pedestal:
https://www.merriam-webster.com/dictionary/troglodyte
The high-pressure system will remain over the northeastern Pacific. The PDO has been negative since 2020.
https://i.ibb.co/nsfs8w13/ventusky-pressure-20260813t0000.jpg
Drought on the West Coast.
Our city recently had devastating flooding in certain urban neighborhoods caused by some very heavy thunderstorms that refused to move. The flooding was greatly exacerbated by a mechanical floodgate that failed to operate. We have a floodwater control system designed and put in place by the U.S. Corp of Engineers, who know how to do flood control. They designed and built the system, including the gate. Then they turned the operation and maintenance of the gate over to our incompetent, progressive city government, who failed to maintain it properly. Many homes and businesses were flooded. Then, our socialist mayor blamed a “1,000 yr flood.” Another case of blaming it on the weather!
Your point on the Colorado River Compact being based on an unusually wet period is crucial. It raises serious questions about the sustainability of current water management practices, especially with agriculture consuming 50% to 70% of the river’s flow. Considering that these allocations were made during a very different hydrological era, what steps do you think could be taken to better align water use with natural supply limits? Additionally, how might shifting agricultural practices influence future water demands?
In the current article, Spencer focuses largely on Lake Mead, its evaporation and releases from Hoover Dam. His 2022 article did briefly acknowledge that Mead levels depend on regulated releases from Lake Powell. But since Powell and Mead are operated as a coordinated reservoir system, I wonder whether combined storage isn’t the more informative metric here. Looking at Mead separately may obscure what is happening to storage and losses in the larger system.
Also related is the fact that the precipitation projection in Figure 2, carried forward from the 2022 article, is for an area approximating the Upper Colorado watershed, and much of the resulting Upper Basin runoff reaches Powell first.
Planned, but not inevitable.
https://easternherald.com/2026/06/13/hoover-dam-hydropower-cliff-lake-mead-2026-drought/
The Bureau of Reclamation planned to run out of water generator head pressure in both Lakes Mead and Powell. The link above is to a quick found one from June, but the online announcements and news articles go back to Summer 2025. The only solution offered was to buy and install generators that would be capable of using the last acre feet of Mead before dead pool.
The “water year” begins in October. Had the Bureau limited electrical output 1 hour per work week day since 1 October, there’d still be nearly a business month of water left in both dams – enough to get well into the usual September inflow.
The crash is deliberate. California will have to buy thermally generated electrical power at war-driven fuel prices, and hopefully BoR’s mandate will be rewritten in favor of conservation of resources rather than greenwashing “clean” California wind and solar. Advantage to whichever political party starts blaming first. Early lead to the climate change propaganda, but it is at its best position to be debunked.
Advantage Permian Basin, because NG there is negatively priced.
Severe thunderstorms are approaching Nebraska, Illinois and Indiana.
IPCC AR-6 Working Group 1 (2021) – has low confidence that meteorological droughts (caused by climate change/CO2) are increasing. I await AR-7.
The same IPCC report also found low confidence for increasing hydrological drought for the globe. It had the same conclusions for western North American relative to meteorological and hydrological drought. We are talking about a few data points here, NOT long term trends.
Most climate sceptics have low confidence in IPCC reports.
Why are you so confident that they are correct in this case?
Most climate fantasists/hystericals/bloviators have high confidence in IPCC reports.
Why are you so confident that they are incorrect in this case?
Team Science trusting Team Science makes sense, Bad.
Contrarians suddenly trusting tree ring studies does not.
I’ve seen a lot of movies over many decades that shot scenes in that Los Angeles River concrete basin. It is always dry. Southern California, Arizona, New Mexico, Texas, Nevada, Utah, always dry. The citizens have always lamented that they have no water. Desalination plants are very expensive. The Israelis have decided they are worth it. Florida has too. San Diego built the largest in the US at 50 MGD. It supplies about 10% of their potable water needs. The thing about the UK is the water is a lot cooler there. Desalination plants will have to have a lot more membranes to supply the same amount of water. Very expensive to build.
(I have been getting 403 errors on my IOS device, so I will try my laptop.)
So, the “science” is pretty clear on the relationship between meteorological and hydrological drought (what we are talking about on this post) and warming and CO2: There is none.
In fact, since the atmosphere can carry more water vapor when it is warmer, we should expect MORE precipitation, not less. The IPCC, in fact, had “high confidence” that precipitation had increased over mid-latitude land in the Northern Hemisphere over the last 70 years.
I will refer again to the above conclusion of the IPCCs Working Group 1 from 2021 – “low Confidence” in increasing droughts.
US Secy of Energy Chris Wright was/is the owner of Liberty Energy and his company published a booklet on energy/climate/etc called Bettering Human Lives (available online). It has a section on extreme weather (pp 104-113). It addresses droughts (and wildires) and actually illustrates its viewpoint using the Colorado River Basin as a case study. Conclusion: there doesn’t seem to be any relationship between river flow and temperatures over a recent 100 year period.
And the favorite source of many on here (sarcasm), the Heartland Institute agrees with the above two sources (IPCC and Energy Secy Wright) and adds that the US set records for the smallest amount of drought area in 2017 and 2019. They also state that the US recently went through the longest period in recorded history with less than 40% of the country experiencing “very dry” conditions. That makes complete sense when you consider the second paragraph of my post.
So, alarmists (IPCC) and their critics both seem to agree on this topic.
> hydrological drought (what we are talking about on this post)
This post is actually about a reservoir/strong> formed by the Hoover Dam.
There is also some hand waving about “recent news articles”.
And of course Tom forgot to RTFR:
https://www.ipcc.ch/report/ar6/syr/downloads/report/IPCC_AR6_SYR_SPM.pdf
Tom should peep harder before falling back on Step 1 – Pure Denial.
Entropic man,
You snarked “Most climate sceptics have low confidence in IPCC reports.” You absolute Willard! We have zero tolerance for the political tripe that the summary reports represent.
The main reports seem to be a lot more measured, but still biased about the presumption of CO2 being the cause of all ills. When the IPCC state low confidence, when for the last 20 years they have been pushing the extreme scenarios as business as usual, then we know the “low confidence” really translates to virtually zero risk. Why is that so difficult for you to understand?
Thomas, your mistake is assuming that the average precipitation trend for the Northern Hemisphere applies uniformly across the entire hemisphere.
This would be a good time for the statistics guru contrarians to explain how an aggregate average can obscure the underlying spatial distribution. Of course, they seem to reserve that particular criticism for people on the other side.
[“In fact, since the atmosphere can carry more water vapor when it is warmer, we should expect MORE precipitation, not less.”]
A warmer atmosphere having a greater moisture holding capacity does not imply that precipitation must increase locally.
Saturation vapor pressure (how much would be required for saturation at that temperature) increases with temperature, but actual atmospheric moisture and precipitation also depend on moisture supply.
If actual vapor pressure (how much moisture is actually present) does not increase as rapidly as saturation vapor pressure, the vapor pressure deficit increases and that raises atmospheric evaporative demand.
That’s why precipitation can remain unchanged while warming still increases aridity.
Thanks, that is helpful. It seems that what is needed to explain the basic problem here is the construction/anaysis of the water “budget” for the Colorado Basin. I have been out there a number of times. It is mostly dry steppe and desert. Most of the water is mountain runoff. So as far as “input” to the system, it seems to be mostly a battle between the mountain runoff and evaporation. In any event, this seems to be more a problem of water management practices than changing weather. The over settlement in parts of the west is ridiculous. As a libertarian/conservative, I would prefer the government stop trying to subsidize one type of activity over another and let the markets decide, within reason.
Certainly there is a lot of settlement in the Western US that draws on limited water resources, but the majority of water consumption is for agriculture. If the water resources were allocated by a floating market price rather than archaic allocations as they are now, I suspect the agriculture would mostly get priced out before residential uses.
Regardless, it’s not clear what entity would be setting the prices for a common resource given that it flows through a number of states and municipalities, so government at various levels is inevitably going to be involved.
https://science.nasa.gov/missions/landsat/meat-of-the-matter-colorado-river-over-consumed/
The forecast calls for severe thunderstorms over Lake Mead on the evening of August 14.
PHOENIX (AP) — Three western U.S. states would take less water from the Colorado River under a federal proposal released Friday to stave off a crisis in the beleaguered waterway.
The U.S. Bureau of Reclamation proposal spares four other states from facing mandatory cuts for now. It’s meant to be flexible, allowing deeper cuts in drier times while giving the states more time to collectively agree on how to manage the dwindling resource that flows through dams to produce hydropower.
[…]
More than 40 million people in seven U.S. states, several tribal nations and Mexico rely on the flows of the 1,450-mile (2,334-kilometer) river. Decades of overuse, along with rising temperatures, drought and climate change, mean it no longer provides what was promised in 1922.
The river’s health often is determined by how much water is in Lake Mead and Lake Powell, the two largest human-made reservoirs in the U.S. Together, the reservoirs are at their lowest point since they began filling, according to a recent paper by Colorado River experts, and approaching levels where they could no longer produce hydropower.
How the water is allocated and conserved — especially amid a decades-long drought — has led to contentious arguments among the states, including threats of lawsuits. Both basins drew up proposals but didn’t decide together on a single plan.
https://www.pbs.org/newshour/nation/arizona-california-and-nevada-would-share-cuts-under-federal-proposal-for-colorado-river
Thunderstorms in the Colorado River Basin.
https://i.ibb.co/21D2bNQx/archive-3-image.png
Fairly heavy rainfall along the Colorado River.
https://i.ibb.co/hRGGvyXY/Zrzut-ekranu-2026-08-15-073704.png
Roy, I don’t see anyone addressing this (relatively minor) point: “Of course, much of the western U.S. experiences drought conditions every summer”
In meteorology drought is typically defined as “unusually” dry conditions. So by definition, it can’t happen “most years”.
Otherwise … a useful, informative post.
it never rains in southern california, … it pours.
And one can get a lot of rain some place near you and not get any rain where you are.
And in couple days one can get a lot of rain, and rest of year, get very little- making the year in a drought.
Or it can rain a lot in California when in the summer, it is some what common, but if summer has no rain, it could be said to be a drought that summer.
On Vancouver Island, if it doesn’t rain during summer for 2 months, it’s a drought. And in winter, it is time to go ice skating on the lakes.
I continue to ponder Dr. Spencer’s choice of statistics in this particular analysis.
Why did he choose to start his linear trend at 1932 for Lees Ferry streamflow? Why not just start at the beginning of the available record?
Do skeptics really accept global warming?
Because if they really accept global warming, I don’t understand the effort to give the impression that warming-induced changes in the basin water balance should have little effect on river flow.
There is a strong climatological contrast across the Upper Colorado River Basin. Observations show that the high-elevation eastern portions of the basin are colder and wetter, while the western and southern lower elevations are warmer and drier.
The most important runoff producing regions are on the eastern side of the basin and account for nearly 60% of the basin’s total flow.
https://journals.ametsoc.org/view/journals/clim/32/23/jcli-d-19-0207.1.xml
Again, that is just the climatological and hydrological baseline, not an effect of climate change.
Acknowledging these facts is not alarmism. There is still uncertainty about what future temperature change will be.
Instead, it is merely about not pretending that temperature is somehow irrelevant to hydrology.
The 4 deserts that make up the southwest includes arizona, new mexico, nevada, and utah with significant portions of California and Texas and small portions of Oregon and Idaho. Droughts are common. The last one about almost 900 years ago (in time with largest orbital perturbation of Jupiter and Saturn) occurred during the Medieval Warm Period and is thought to have been one of the reasons that caused the Anasazi culture of the area to collapse.
Since as we we see in the ice core data cooling appears to operate more slowly, perhaps due to reflection of IR off of water in the atmosphere slowing it it may have taken ~550 years to hit bottom in 1700. And now ~325 years later we may be at a peak in this grand cycle and perhaps this is just a repeat of the MWP. Though it could be a bit bigger due to Neptune and Uranus habitating the warmest sector of sky (wrt to earth) over the past couple decades years as they haven’t been there since the Minoan Warm Period over 3,000 years ago.
To clarify: I am not suggesting Dr. Spencer is deliberately trying to deceive anyone or acting in bad faith. By “effort,” I mean the overall analytical choices that produce a particular impression, not a conscious effort to mislead.
It is more likely that his analysis reflects a particular bias or framing that understates the importance of warming to river flows.
> Droughts are common. The last one about almost 900 years ago
An event that happen every 900 years ago is not usually called common. The one Gill might be referring to happened a little more than 900 years ago:
https://www.oecd.org/en/publications/global-drought-outlook_d492583a-en/full-report/towards-a-drier-world_6f10e2e5.html
Gill only mentions 900 years because of his pet astrology, e.g.
https://www.drroyspencer.com/2026/07/uah-v6-1-global-temperature-update-for-june-2026-0-46-deg-c/#comment-1748163
Since the medieval climate optimum is said to have happened between 950 and 1250, that gives cyclophiles some rope. Yet a 33% buffer is a little loose.
And I am skeptical of his claim that orbital forcing can explain modern global warming.
The well established orbital cycles associated with Quaternary climate change operate on time scales of tens to hundreds of thousands of years.
And Northern Hemisphere high-latitude summer insolation reached a maximum during the early Holocene, thousands of years ago. We are not presently approaching another such maximum, and won’t be for a very long time.
Hays, 1976 actually concluded that, when their orbital-climate model was applied to astronomical projections, the long term natural tendency over the next 20,000 years was toward Northern Hemisphere glaciation and cooling.
https://www2.atmos.umd.edu/~nigam/AOSC617/Hays.Imbrie.Shackelton.Orbital.theory.ice.age.Science.1976.pdf
Bill, I am not sure how the planetary configuration you are describing would overcome that long-term orbital tendency and produce modern warming instead.
Skeptical is a bad word. Dubious might be better.
“Bad” is incorrect here, and since Kynqora has provided evidence to support his skepticism, “I am skeptical” is well justified.
“Bad” is incorrect here, and since Kynqora has provided evidence to support his skepticism, “I am skeptical” is well justified.
A tendency having a 20,000-year resolution isn’t evidence.
“Tendency” and “resolution” are incorrect here. Pure Denial is Step 1 of the Contrarian Tango. Revise and resubmit.
Meanwhile:
https://yaleclimateconnections.org/2025/05/how-to-deny-climate-change-using-the-ipcc-report/
Kynqora,
You wrote “I am skeptical of his claim that orbital forcing can explain modern global warming.”
It may not explain all, nor do we expect it to. But consider the claim that a rise in co2 will add the equivalent of a few extra watts per square meter. Yet the orbit doesn’t have to change that much for a few extra watts of energy to actually occur. This may not be throughout the year but as you may appreciate spring starting early will have a large effect due to the plants reaction.
Earth’s orbit is sensitive to the other planet’s orbits and where the sun is. The Milochavich cycles maybe an over simplification of the true orbital paths, they are still very useful as a guide to external influences.
> It may not explain all, nor do we expect it to. But
Q-Anon is very good at math:
https://science.nasa.gov/science-research/earth-science/why-milankovitch-orbital-cycles-cant-explain-earths-current-warming/
So good he does not even get the number sign right.
[“It may not explain all, nor do we expect it to”]
To elaborate on my previous comment, the problem with the idea of precessional forcing explaining current warming is that the configuration favoring ice sheet retreat has NH summer occurring closer to perihelion. That is when NH summer insolation is stronger.
Currently we have the opposite configuration: NH summers occur near aphelion while NH winters occur near perihelion.
Another issue detailed in Hays’ paper is that the climate records contained a strong 100,000-yr cycle, but the insolation spectra did not contain a corresponding 100,000-yr cycle.
That lead them to suspect nonlinearity. When Earth’s orbit is more elliptical, eccentricity amplifies precessional forcing, which through a nonlinear climate response can produce bigger changes in ice sheets.
Currently, Earth’s orbit is relatively circular, so precessional forcing is comparatively weak.
Again, the point being is that we are a long way from an orbital configuration strongly favorable to Northern Hemisphere summer warming and ice sheet retreat, which makes orbital forcing an unintuitive explanation for the warming occurring right now.
That’s what makes modern global warming…
…so interesting.
It runs counter to the long-term cooling trend that has prevailed for roughly the past 6,000 years, as Willard notes.
[“The Milochavich cycles maybe an over simplification of the true orbital paths”]
Well, maybe. But Hays’ paper subjected the relationship between the climate and orbital records to some pretty rigorous statistical tests, and the Milankovitch framework actually did remarkably well.
Yes, Kynqora – and don’t forget obliquity.
Earth’s axial tilt is currently decreasing, which means less extreme seasons at high latitudes and, importantly, less Northern Hemisphere summer insolation.
But CO2 keeps pushing the climate in the opposite direction.
We are moving toward a climate state that has some similarities to the Pliocene, around 3.25 million years ago, when atmospheric CO2 was roughly comparable to modern levels (~400 ppm) and sea surface temperatures may have been up to ~3.4°C warmer than present:
https://cp.copernicus.org/articles/16/1599/2020/
What is especially interesting is that the orbital configuration during this period was also relatively close to modern conditions.
The Pliocene therefore gives us a glimpse of what the very, very long term response to elevated CO2 can look like – the response after slow feedbacks involving ice sheets and oceans have had thousands to tens of thousands of years to play out.
It is actually quite unsettling to think about.
“It runs counter to the long-term cooling trend that has prevailed for roughly the past 6,000 years, as Willard notes.”
So, your claim is this paper is irrefutable evidence we should be in a cooling trend and since we’re not humans are the cause of the warming? Is that your argument? Aren’t these papers based on proxy data just a bunch of speculation? Nice coffee table material?
“Tendency” and “resolution” are incorrect here.”
That’s my point. How can you claim a tendency when your data’s resolution does not allow a tendency to be determined?
Watch Troglodyte go from “it’s not evidence” to “it must be irrefutable evidence”.
Troglodyte does not get it:
The words “tendency” and “resolution” are being misapplied here.
Or as he said earlier, they’re bad.
Stephen,
[“So, your claim is this paper is irrefutable evidence we should be in a cooling trend and since we’re not humans are the cause of the warming? Is that your argument?”]
My sole point was that orbital forcing cannot account for modern global warming. That is all I was arguing.
I am not claiming to know what is causing current global warming.
“Troglodyte does not get it:
The words “tendency” and “resolution” are being misapplied here.
Or as he said earlier, they’re bad.”
No, they’re not.
[“So, your claim is this paper is irrefutable evidence we should be in a cooling trend and since we’re not humans are the cause of the warming? Is that your argument?”]
My sole point was that orbital forcing cannot account for modern global warming. That is all I was arguing.
I am not claiming to know what is causing current global warming.”
My point was they are using proxy data and speculation to determine that the next 20,000 years should be a cooling trend and we’re still in the Holocene and a warming period. Measuring orbits and processions. is not an exact science or even knowing what they mean. The Milankovitch Cycles are hypothetical. They have no idea when the next long term cooling trend is going to start. Also, glacial periods appear to be much longer than 20,000 years. How can they make the claim? That’s a ridiculous claim. It is a ridiculous inference. They have no idea how many more natural fluctuations will occur in the Holocene or when the next interglacial will start. We could get another mini-ice age, another warming period, another mini-ice age and then another warming period. It is all speculation.
“I am not claiming to know what is causing current global warming.”
Ah, someone with a talent for science! Kynqora sets himself above the cult kids. Way above….
In science, it’s okay to say “I don’t know”. If you don’t know, say it. That opens your mind to learning. It’s NOT okay to fake knowledge, fall flat on your face, and then attack others for your failures–like the cult kids do.
Kynqora,
This is a 50-year period of warming. To make a claim that it is unprecedented or not unprecedented is ridiculous. We don’t have enough real data to make that claim. We have proxy data and speculation. We think we know that “Greenland” used to be green. We believe there was a “Little Ice Age.” We have Vostok ice core data. We don’t really have a lot to go on.
Stephen,
[“That’s my point. How can you claim a tendency when your data’s resolution does not allow a tendency to be determined?”]
Your concern about resolution is legitimate. Hays had to construct age models for the sediment cores and assume approximately constant sediment accumulation.
However, they had independent chronological constraints from marine isotope stratigraphy, and they also tested different sediment-accumulation and age models.
They also developed statistical tests that were less sensitive to errors in absolute chronology.
Despite these uncertainties, the predicted orbital frequencies still emerged clearly in the data.
> No, they’re not.
Yes, they are.
Stephen,
When they described a long term natural tendency toward cooling, that does not mean temperatures must continuously decline for 20,000 years.
It means the underlying orbital forcing and modeled climate response have an overall cooling tendency on that long timescale.
Superimposed on that long term tendency, you could still have centuries or millennia of warming, centuries or millennia of cooling, etc.
Think of it as a long downhill slope with plenty of hills and valleys along the way.
“Stephen,
When they described a long-term natural tendency toward cooling, that does not mean temperatures must continuously decline for 20,000 years.
It means the underlying orbital forcing and modeled climate response have an overall cooling tendency on that long timescale.
Superimposed on that long term tendency, you could still have centuries or millennia of warming, centuries or millennia of cooling, etc.
Think of it as a long downhill slope with plenty of hills and valleys along the way.”
OK, I agree with that. I couldn’t tell that is what you were saying.
“And I am skeptical of his claim that orbital forcing can explain modern global warming.”
google: “orbital forcing meaning:
“Orbital forcing is the effect on Earth’s climate caused by slow changes in the shape of Earth’s orbit and the tilt of its axis. These natural shifts change how much sunlight reaches different parts of the planet. They drive long-term climate patterns like ice ages and warm periods.”
google: modern global warming:
“Global warming continues to drive record-high global temperatures, rising sea levels, and intense extreme weather events. Driven heavily by human fossil fuel emissions, atmospheric carbon dioxide is over 50% higher than pre-industrial levels, making extreme heat waves, droughts, and severe wildfires more frequent worldwide”
goggle: little ice age:
“The Little Ice Age was a period of regional cooling from roughly 1300 to 1850 following the Medieval Warm Period. Average Northern Hemisphere temperatures dropped by about 0.6°C to 2°C, causing mountain glaciers to expand globally and freezing major rivers like the Thames.”
It’s recognized that orbital forcing has large effect, or causes, global glaciation and rapid rises in sea levels from the lower sea levels which were caused by the global glaciation.
And also, that sea levels were higher [than the present levels] and that Earth was warmer in early periods of our current interglacial period.
Kynqora
Isearched recently for the Hunter boy’s ‘scientific’ background for his permanently repeated claims.
*
The claim that Earth’s climate is controlled or warmed by outer planets like Jupiter, Saturn, Uranus, and Neptune stems from a mix of fringe internet theories, misconstrued solar-cycle models (such as those by researchers studying planetary orbits and solar irradiation), and climate skepticism arguing that the whole solar system is warming.
Contrarian blogs (citing minor or seasonal brightness changes on distant bodies like Neptune or Mars) falsely claimed that every planet in the solar system was simultaneously undergoing global warming.
‘Researcher’s such as Ynderstad who built theoretical “solar clock” models, study how giant planets (Jupiter, Saturn, Uranus, and Neptune) influence the sun’s barycenter oscillations or magnetic fields over centuries.
Valentina Zharkova also published a strange paper in Scientific Reports (2019), arguing that long-term global warming is driven by the Sun’s changing distance from Earth due to the gravitational pull of giant planets like Jupiter and Saturn. This paper was later retracted due to fundamental errors in orbital mechanics.
Amateurs on research platforms often repurpose these orbital mechanics to suggest that planetary alignments or the magnetic pull of ice giants directly trigger tidal heating or changes in Earth’s core.
*
The Hunter boy also belongs to this blog’s contrarian maffia which for years has discredited hundreds of astronomers, mathematicians and physicists who proved the lunar spin, by appealing among other sources to the authority of Nikola Tesla who posted in 1919 some superficial, unscientific thoughts in a small pamphlet named ‘The Electrical Inventer’, thoughts which were then replicated ad nauseam by people venerating Tesla, especially in Serbia (a former part of Yugoslavia).
Bindy Goebells,
You are supposed to be read books to help acquire knowledge. Burning them doesn’t achieve anything other than pollution and global dimming,and in your case, individual dimming.
You must be the only person on this site who is an actual science denier as you dispute gravity and the inverse square law. I hope that you know that the earth orbit is not circular . Do you actually know when the max and min distances occurred this year vs 50 years ago or even 100 years ago.
Stop gaslighting & gassing people and for once try some maths. You always boast how good you are at maths then prove it by working out the difference in energy at the TOA for the same time each year. Pick a date and time and state what the insolation is and the difference of 100 years earlier. Prove me wrong!
Oh look… The filthy QAnon stalker is here again, as always unable to reply with anything else than woefully insulting, discrediting, denigrating and, of course, utterly lying.
” You must be the only person on this site who is an actual science denier as you dispute gravity and the inverse square law. ”
I never disputed gravity let alone the inverse square law; at best would I dispute their misuse by ignoramuses like QAnon who discredit my results despite being unable
– to technically contradict them, let alone
– to publish own results.
” Prove me wrong! ”
Thats exactly what ignoramuses write instead of themselves proving you wrong.
Bindi, there’s no need for anyone to prove you wrong. You do that all by yourself!
Want another example? Let’s see you support your claim of: “…hundreds of astronomers, mathematicians and physicists who proved the lunar spin…”
Hundreds? You don’t even have ONE!
Bindy the book burner,
So you not even willing, let alone able of putting the effort in to proving me wrong about the orbits.
So just your usual little old man posturing, all yap, zero bite.
Q-Anon challenges anyone to prove that his ignorance is not infinite.
Yeah, but your only purpose is to post here to lob hand grenades, and you have no math or science skills. You’re a propagandist, nothing more. Fish.
Look who’s talking.
Troglodyte will hurl abuse until someone, somewhere takes his sammich requests srsly. According to his Very Profund logic, Milankovitch cycles don’t exist, because “resolution”.
Bindidon says:
August 16, 2026 at 10:50 AM
“Isearched recently for the Hunter boy’s ‘scientific’ background for his permanently repeated claims.”
Perpare yourself for a typical Bindidon gish gallop from a guy of zero credible scientific references.
I don’t pretend to be a scientific expert. Instead I am an auditor committed to facts and evidence and a learned ability to identify nonsense, read technical papers, examine their logical structural, follow the math, and base my opinion on empirical evidence and scientific credibility.
Bindidon’s approach is a complete antithesis to that.
To him he is going to ardently believe what his daddy told him, refuse to be critical of a lack of empirical evidence supporting that, completely ignore math and statistics, and linguistically exercise ambivalence to a lack of work done by his daddy and instead hang the entire world on a narrow definition of a word.
All I have done is, for example, stuff like this:
https://co2coalition.org/facts/temperatures-have-changed-for-800000-years-it-wasnt-us/
A widely accepted ice core study that shows strong temperature variances in central England far from the shores of the island (which pollutes our current surface temperature record to higher temperature variations due to the harbor and nearby channels of water becoming ice free each year.
This pattern shows a strong statistical relationship to the known variations created by Jupiter, Saturn, Uranus, and Neptune.
Moving the earth closer to the sun is only part of the direct effects. the fact that earth changes speed in its orbit annually can vary up to zero to 9 days of additional exposure during the earth’s closest half orbit to the sun over the number of days the earth spends in the other half of the orbit.
the major periods of this effect occur approximately once every 860 to 900 years by the combined orbits of Saturn and Jupiter. these patterns are modified over an approximate 3,500 year cycle by Uranus and Neptune. All I have done is plot out where the maximum exposure can occur from the directional nature of gravity that is tangent to the where earth is at the semi-major axes of its orbit.
this mapping of maximum effect matches very well with the patterns of orbit resonances of the 4 gas giants. . .with 10 warming spikes in ~9000 years from Saturn and Jupiter over lain with 2 of the 3 tallest spikes aligning with the ~3,500 year cycle of Neptune and Uranus.
We just saw those 4 planets transit the portion of the sky most effective at influencing a warming pattern in 2023-2024 and Neptune and Saturn both crossing the sweetest spot this past spring. Jupiter doing so in 2023.
Various scientific sources say this could create a cloud of warming effects and water vapor feedback.
According to the new normal used by NOAA/NCEI we are .5C warmer for the 1991-2020 normal vs 1961-1990 normal previously estimated.
So all we need to do is find about .17 degrees of warming from planetary rotation over that period of time.
So what are the various mean by which this could happen.
1) orbital speed variances (without considering distance effects but instead a time of exposure effect)
on top of
2) orbital distance from earth to the sun (which will be connected to the speed of earth in its orbit path as an additional immediate effect.)
3) possible connection to suns grand cycles.
4) possible question offered up by Google AI as an effect on cosmic rays.
5) possible other effects.
So Bindidon you are welcome to stand there making a fool of yourself gish galloping and attacking the messenger if you think that to be useful to science.
Bindidon says:
”The claim that Earth’s climate is controlled or warmed by outer planets like Jupiter, Saturn, Uranus, and Neptune stems from a mix of fringe internet theories, misconstrued solar-cycle models (such as those by researchers studying planetary orbits and solar irradiation), and climate skepticism arguing that the whole solar system is warming. Contrarian blogs (citing minor or seasonal brightness changes on distant bodies like Neptune or Mars) falsely claimed that every planet in the solar system was simultaneously undergoing global warming.”
I would assume that these gravitational variances can be complex like the wobbling of a top and its precessions and NOT apply contemporaneously at the same time to the different planets with different orbit variances by virtue of them not occupying the same relative position as earth at all times.
I find that thinking somewhat wanting.l But if strawmen is all you can erect a response with I would say thats a pretty bad case of erectile disfunction.
Bindidon says:
”The Hunter boy also belongs to this blog’s contrarian maffia which for years has discredited hundreds of astronomers, mathematicians and physicists who proved the lunar spin, by appealing among other sources to the authority of Nikola Tesla who posted in 1919 some superficial, unscientific thoughts in a small pamphlet named ‘The Electrical Inventer’, thoughts which were then replicated ad nauseam by people venerating Tesla, especially in Serbia (a former part of Yugoslavia).”
Its my opinion Bindidon that attacking me does nothing for your own credibility, does nothing for science, nor does it correctly present the view that DREMT and I have presented.
We simply pointed out that angular momentum can be calculated from any rotation to an axis point around which the rotation occurs. You seem to be denying that 1) the moon rotates around earth and that gravity forces from earth are the forces that turn it into one complete rotation and that rotation can been seen if one carefully looks for a seasonal pattern in any object that doesn’t just rotate around another object but may or may not have an additional rotation on its own axis.
We also acknowledged that the most common equations for the angular momentum of the moon can be broken down to what causes a rotation around another object. As to whether the great scientist Nicolo Tesla was perfect or not I have no opinion other than to note we all have imperfections.
Shorter Gill:
“in central England”
Too bad his name is not attached to the graph he claims having made.
good catch Willard. Should have said central greenland.
I continue to be disappointed in the very poor quality of comments, and this one seems to hit a new low.
Do you have any valid science to add, or just your unsupported opinion?
Could you explain specifically what you find lacking in my comment? I am genuinely open to constructive feedback and would appreciate the insight.
Attempting to be clever often results in just being dumb. You made insulting accusations using stereotypes that have no basis in fact.
If you thought you were being clever, you missed the mark. Otherwise, you have revealed yourself.
I clarified that I don’t think Dr. Spencer is intentionally trying to deceive anyone. I think his analysis reflects a particular bias. That is a criticism of how he approaches evidence, not an attack on his character or his intelligence.
That aside, why does Dr. Spencer frame his result specifically as “since the 1930s”?:
[“From the above graph, I think one would be hard pressed to say there has been a statistically significant decrease in streamflow since the 1930s.”]
What happens to the trend and its statistical significance if the entire available Lees Ferry record is used instead?
I don’t understand the resistance here, because skeptics themselves frequently bring up how warm or dry it was in the past, including historical examples of severe drought.
So why should it be so difficult to acknowledge that global warming plays a role in the hydrology of the Colorado River at all, before we even get to the separate question of whether that role is small or large?
“These time series show that from 1906 to about 1933 the streamflow Z scores are generally greater than the precipitation Z scores (Figure 2a), indicating that during the early part of the twentieth century normalized streamflow values were higher than normalized precipitation values. This indicates a period of higher-than-average UCRB runoff efficiency (Figure 2c). This period of relatively high runoff efficiency for the UCRB (1906–33) is associated with negative temperature Z scores (cooler-than-average temperature; Figure 2b). These temperatures are also consistent with a lower-than-average evaporative demand resulting in more streamflow per unit of precipitation (i.e., higher runoff efficiency; Figure 2c).”
https://journals.ametsoc.org/view/journals/eint/21/10/ei-d-17-0007.1.xml
This is why I’m curious about the choice to characterize the streamflow trend specifically as “since the 1930s.” The period immediately preceding that starting point was characterized by above-average runoff efficiency and cooler temperatures.
Dr. Roy Spencer,
‘In that same post I showed the average of over 100 CMIP6 climate model runs that show precipitation in the Colorado River watershed increasing substantially with global warming, so blaming the recent dry years on human-caused climate change seems a stretch.”
It’s worth clarifying that you used annual precipitation, which can obscure important seasonal differences because it combines precipitation from both the colder and warmer months of the year. It may not be the most appropriate proxy in this case.
Winter precipitation is particularly important for water storage because snow accumulates in the basin’s mountains and is gradually released as it melts in the spring.
By contrast, precipitation during the warmer months is more likely to be lost to evaporation and plant uptake before it can contribute to water storage or runoff.
The approaching very strong El Nino could help to bring needed water to this region. On the other hand, there is this:
https://www.popularmechanics.com/science/environment/a71573365/super-el-nino-1877/
From 1876 until 1878, a global famine wreaked havoc on Asia, South America, and Africa, cutting short the lives of an estimated 50 million people.
In recent decades, even wet years have provided only temporary drought relief in the Southwest.
2005, 2019, and 2023 all brought substantial precipitation to the region and produced noticeable improvements in drought conditions. Yet in each case, the region subsequently returned to drought:
https://www.ncei.noaa.gov/access/monitoring/climate-at-a-glance/regional/time-series/107/pdsi/1/0/1895-2026
Hot and dry seems to be the new normal for this region.
Kynqora,
Ever been to the Mojave Desert? Hasn’t changed much in my lifetime.
Interesting. Mean summer temperatures from the US Climate Reference Network station at Stovepipe Wells in the Mojave Desert show a linear trend since 2004 of about +5.25°C/century.
https://drive.google.com/file/d/10ocFLpRXqJoVGe10M_OrNR7voTnXopB2/view?usp=sharing
This is also a station specifically designed for climate monitoring, so we are not talking about a UHI contaminated station.
And it’s still a desert.
Speaking of desertification:
https://storymaps.arcgis.com/stories/9e9b7338f37b4600b00c0ffbfd27d91f
See also the Land Degradation Severity throughout the US map.
Yes. A desert can warm and remain a desert.
Here are summer daytime temperatures. There is a warming trend since 2004 equivalent to about +4.8°C/century.
https://drive.google.com/file/d/19r_rWDqBi0FSq-FKfE-XREJVec_74gxI/view?usp=sharing
Summer daytime temperatures already average about 45.1°C.
The promised ‘draining of the swamp’ in Washington becomes a tsunami flooding of the the swamp.
“Trump-appointed regulator OKs banking license for Trump-linked crypto firm.
The decision would give new powers and federal credibility to a venture in which the president and his family retain a substantial financial interest.”
https://www.politico.com/news/2026/08/14/trump-world-liberty-bank-charter-crypto-01038464
Spencer writes:
and then closes with:
Given that the Colorado River Basin’s “Millennium Drought” terminology is extensively found throughout the peer-reviewed professional hydrologic literature as a proper name for the post-2000 drought episode, a reporter is not being sloppy merely by using that term.
So, is Spencer objecting to the scientific name of the drought, or to a specific claim about its paleoclimatic ranking?
More precisely, his terminology is rhetorically loaded to dismiss as media invention a legitimate scientific term that is currently used by USGS. Whatever his intent, that framing is likely to resonate with readers already predisposed to regard mainstream climate science and reporting as exaggerated or unreliable.
¯\_(ツ)_/¯
USGS: https://www.usgs.gov/special-topics/colorado-river-basin/science/drought-versus-aridification-colorado-river-basin#overview
“a legitimate scientific term”
Okaaaay… 1000 years ago was 1026. Cnut The Great kept meticulous info on the Colorado River Basin.
You climate fantasists need to check yourselves into a clinic.
Thus Spaketh Copilot:
“Millennium drought” is not a formal scientific classification of droughts in general.”
I guess it’s just an informal jargon for insiderz.
https://www.environment.sa.gov.au/topics/water-and-river-murray/basin-river-murray-lakes-and-the-coorong/river-murray-droughts/millennium-drought
But speaking of Bill’s toy:
https://www.nbcnews.com/world/asia/usaid-fallout-nepal-aid-workers-stopped-coming-women-babies-started-dy-rcna592395
Three cheers for Elon!
Related:
Australia had a “Millennium Drought,” conventionally dated 1997-2009/10, and explicitly referenced in the Australian climate literature as such.
It no more means a 1-in-1,000-year drought than Australia’s “Federation Drought” means a 1-in-a-federation drought.
Stephen
One of the main paleoclimate proxies Hays used from marine sediments was oxygen isotopes. Here’s a good explanation of why oxygen isotopes are useful indicators of past glacial climate:
https://science.nasa.gov/earth/earth-observatory/paleoclimatology-the-oxygen-balance/
Kynqora, don’t get confused by oxygen isotope nonsense. That’s just another way the cult fools kids. It sounds “sciency”, but the errors produced by contaminations, environmental variations, and unknowns reduce it to the equivalent of alchemy.
Sure, proxies are noisy and uncertain, but that doesn’t mean they don’t contain a reproducible physical signal.
The oxygen isotopes contain the 41,000 yr and 23,000 yr periodicities matching the orbital frequencies, and those same orbital frequencies appear in other independent climate indicators measured from the same cores.
And once those frequency components are isolated for further analysis, physically meaningful relationships appear.
For instance, the oxygen isotope record, reflecting sluggish ice volume changes, lags the faster oceanic responses, as we would expect because ice sheets respond VERY slowly.
Those are not spurious relationships.
Sorry Kynqora, but you’re falling for “soft science”.
Two lab teams in isolation, given identical samples with no info about where the samples came from, could not produce the same results.
Stick with hard science that is demonstrable, repeatable, verifiable, and testable.
Orbital changes produced the Holocene interglacial.
https://railsback.org/FQS/FQS22katoFutureTemps03.jpg
The Holocene Optimum ended 5000 years ago and we entered a long term cooling phase which would naturally have continued into the next glacial period.
Unfortunately in the last 150 years this has been overridden by our artificial warming.
Who says Ent doesn’t have a sense of humor?
Entropic Man,
Do you have a pretty graph of the sea level rises? You lot of switch between temperature and sea level rises depending on what you think is the most alarming.
Please provide the necessary trigger warning for Willard he seems to be acutely susceptible to fear. Oh, and can you make it fire resistant for Bindy as he does like to burn books when he gets cranky.
What would be the main difference between seas and lakes, Q-Anon?
Here’s a hint:
https://science.nasa.gov/earth/earth-observatory/global-freshwater-abruptly-declines-153608/
John Wesley Powell – For those on here who have a genuine interest in resolving problems for humanity, please have your LLM of choice tell you who he was and what his recommendations were in his 1878 “Report on the Lands of the Arid Region of the United States.” Those of your who are on here to “score” points for or against climate change activism can just ignore.
Economists have a very useful term called “moral hazard”, basically the tendency of people or organizations to take undue risk because they are protected from the negative consequences of those risks. That is at the root of this, and many other environmental problems (as well as financial problems).
Subsidized insurance arrangements (shifting risk from those doing risky things to those using more prudence), govermental policies, even seemingly humane policies can actually prolong humane suffering into the future instead of allowing actual negative experiences to put others on warning and to end the suffering.
Look at Wesley’s Report. We didn’t listen to him. He was a geologist who risked his life in 1869 to explore the Colorado (several of his team did die).
The degree of urban settlement and agriculture in California from San Francisco Bay on down is madness. Many millions of people literally live on an active plate boundary – the Pacific and North American plates are sliding past one another, periodically producing massive earthquakes (NB 1906, 1933, 1971, 1989, 1994). And obviously, there is not enough water available to handle all the uses in place (Recal the recent devastating fires in Los Angeles).
Large urban settlement in Arizona seems to make no sense, without some sort of subsidy. Phoenix, Tucson? Many millions in a desert? Huge new investments are on the way relative to semiconductor chips and AI date centers.
The Florida, Georgia, and South Carolina coasts can provide amazing sea breezes during the day. Settlement has been massive and continues, the closer to the ooast the better. Which is timely because as I write we are entering into the most dangerous time of year for hurricanes. Government has some role in this through zoning, but insurance needs to play a part as well. Property owners should not receive ANY subsidy from the majority of Americans who don’t live close to the ocean. Simply removing subsidies of all sorts would increase costs to property owners and lessen and perhaps even reverse some of the excessive development.
Warming or not, can’t we ALL agree that better policies (which can include free market policies) could resolve a lot of these problems?
SOLAR MINIMUM UPDATE
The water level at Lake Powell, the United States’ second-largest reservoir, has fallen to a record low, heightening concerns about the ongoing crisis in the Colorado River system.
The alarming milestone at Lake Powell, reached Saturday, comes about a week after the river’s other major reservoir, Lake Mead, also hit a historic low. Plummeting water levels pose a major threat to the Colorado River Basin, which is a key resource for wildlife, hydropower and more than 40 million people in seven U.S. states.
The historic lows come as the federal government and states that rely on the river — California, Arizona, Nevada, New Mexico, Utah, Wyoming and Colorado — struggle to reach agreement on a long-term management plan for the dwindling resource. Persistent overuse combined with a record-dry winter and rising temperatures have been depleting both Lake Powell and Lake Mead.
https://apnews.com/article/colorado-river-lake-powell-mead-record-low-6a5e0706635222ba4dd364d705a39f8e
It’d be interesting to count the number of golf courses that these two lakes feed.
That’s a good little boy, Willy.
(It’s rare when child Willard can stay on topic. Even if his mother helped him, he deserves a “pat on the head”. Growing up is so hard for him.)
Hey Puffman, riddle me this:
https://thenevadaindependent.com/article/lake-meads-dive-team-operations-quietly-suspended-by-national-park-service
Where’s your DOGE dividend check?
Dullard,
Yet again you push the leftist attitude that personal responsibility should be replaced with governmental control.
Do you still want them to ban the shadows under your bed?
Troglodytes definitely prefer this attitude, Q-Anon:
https://www.miamiherald.com/news/local/crime/article316719710.html
Clint,
He just proved your point.
Troglodyte likes to tickle:
https://www.nbcnews.com/news/us-news/desantis-ally-appointee-arrested-child-sex-abuse-charges-rcna593206
A consequence of the mistake of thinking that climate change is being primarily caused by burning fossil fuels and that climate change can be stopped by curtailing the use of fossil fuels, is that humanity is neglecting to adequately prepare for natural climate change. A universal protection from the negative effects of climate change is increased availability of reliable energy at low cost.
Dan,
As actions speak louder than words I would say that a lot of the anti fossil fuel / anti capitalist lobby will ignore any adaptations just to spite. Based on the evidence so far.
But there will be some who are a bit more considered in their reasoning.
Immediate IR Emission and Reversed Milankovitch Cycle
The Immediate IR Emission issue is not only about the rotational warming phenomenon explanation.
It is also the basis of the Global Warming’s orbital nature.
Because the Immediate IR Emission overturns what Milankovitch Cycle’s prediction.
Instead of a natural cooling trend, Earth actually experiences a natural warming trend.
And, the Immediate IR Emission Phenomenon is the actual mechanism behind the temperature rise in glass houses. It is the physics of the glass greenhouses warming.
Also, the Immediate IR Emission Phenomenon is that, the common physical law between the warming phenomenon in glass houses and the atmospheric greenhouse effect.
The atmospheric greenhouse effect is very weak on Earth, it is theoretically there, but it is so weak we safelly consider it as non existent.
The atmospheric greenhouse effect is very strong on Venus though!
–
Link: https://www.cristos-vournas.com
The Milankovitch cycles are at work and will cause an increase in ice cover at high latitudes over the next few hundred years. For this to happen, there needs to be an increase in snowfall in Greenland, which is already slowly occurring. As the angle of solar radiation at the poles decreases, warm oceans ensure increased snowfall at high latitudes, while cooler summers at the poles lead to increased ice cover.
Ireneusz,
‘The Milankovitch cycles are at work and will cause an increase in ice cover at high latitudes over the next few hundred years.”
–
What is your opinion about the planetary Effective Temperature?
Christos
“Surface Rotational Warming Phenomenon (a faster rotating (N) planet or moon, or with a higher surface heat capacity (cp), or a higher their respective (N⋅cp) product, that planet or moon has a lower immediate infrared (IR) emission during insolation, so more energy is retained as heat, and, therefore, the global mean temperature is higher).”
To me, this is obvious. As for the specific temperatures of the planets, I don’t know enough about them.
I can only add that the amount of ozone—which varies due to changes in solar activity (the number of solar flares and the wavelength of UV radiation)—is very important, because a greater amount of UVB radiation can be absorbed by the oceans and water vapor, not to mention human skin. Therefore, any fluctuations in global temperature can result from many different factors. The key factor, however, is the very thin troposphere. The Earth, however, always tries to maintain an average global temperature through various mechanisms. That is the only reason life can exist on our planet.
Thank you, Ireneusz!
“Therefore, any fluctuations in global temperature can result from many different factors. The key factor, however, is the very thin troposphere. The Earth, however, always tries to maintain an average global temperature through various mechanisms. ”
That’s right.
Could the CO2 rise cause the current Global Warming?
Christos
It’s important to realize that the stratosphere and the troposphere are completely different layers of the atmosphere. In the troposphere, we have typical convection and a decrease in temperature as pressure drops. In the stratosphere, solar radiation (O₂ photolysis and ozone formation) and other types of radiation (gamma and galactic) are the dominant factors. However, in winter, the stratosphere extends so far south over the pole that it governs circulation in the troposphere at high latitudes.
https://ds.data.jma.go.jp/tcc/tcc/products/clisys/STRAT/gif/zt_sh.gif
Therefore, a significant rise in temperature can occur only if there is an increase in pressure in the troposphere. It seems that the average pressure at the ocean surface is stable. I haven’t heard of any changes in it.
Thank you, Ireneusz.
A high-pressure system remains over the northeastern Pacific.
https://www.ncei.noaa.gov/access/monitoring/pdo/
I read without surprise in Roy Spencer’s last monthly report:
” They avoid the real question related to re-warming from the Little Ice Age and how much the current warming is related to that rewarming. ”
*
I downloaded once more Bderkeley Earth’s global data (land + ocean) starting in 1850 (usually acknowledged as ‘end of the LIA’).
Ignoramuses like Robertson always discredit and denigrate Berkeley Earth, allegedly producing ‘fudged data’.
They don’t have the least idea about what is ‘fudged’ in the data (let alone would they have technical skills to prove it is), but… they ‘know’ it is, due to their unconditional appeal to ‘authorities’ like Sun Akasofu or – even worse – E.M. Smith, who all know everything better.
I don’t care about such polemically discrediting blah blah.
*
Here is the time series since 1850, together with, at the end, that of UAH 6.1 LT:
https://drive.google.com/file/d/13lBlvyMJETEvHDTRSX_3sh_6bnvecVIO/view
Anyone can see that from 1850 till 1920, there is no ‘rewarming’ at all; the trend for this period is even a bit lower than 0.
Maybe the ‘rewarming’ needed these 70 years to finally wake up?
*
Anyone can have his own meaning (what exactly those who insult me by name calling me ‘Nazi’, ‘Goebbels’ or ‘book burner’ in reality 100% deny to others).
*
But who insists on ‘fudged data’ even when looking at the same comparison within the sat era, starting around 1979:
https://drive.google.com/file/d/1iEJiB6k5CAgDa3hmwF_ZQMZwYheSLKKD/view
definitively lacks both fairness and technical understanding.
**
There is another point of interest in the 1850 picture: it’s the harsh peak in March 1878.
This peak is visible in all historical data going back to at least 1870: it is the top surface anomaly which occured during the 1877/78 El Niño. To emphasize its dimension, I added a green line showing the average anomaly decades around the event.
There are similarly strong peaks in recent times; but they are all displayed in red: that’s UAH LT data, not surface.
*
This 1877/78 El Niño is also visible is the historical time series of MEI, the Multivariate ENSO index:
https://drive.google.com/file/d/1OHWgzgJgpPucSyVxd9ttbMDOD-aBziI6/view
However, as the graph shows, MEI’s historical reconstruction placed it clearly below the 1982/83 edition.
test
Ummm…both.
Returning to the original topic, this is Donald Trump’s response to the low lake levels.
https://www.latimes.com/environment/story/2026-08-21/colorado-river-trump-administration-water-cuts
Ent acknowledges Trump is saving the day.
Is Ent becoming MAGA?
At least that’s better than him believing passenger jets fly backward….
I agree with Ent. Seems like a great response.
I rather doubt that Trump has saved the day. Lots of entertainment value still to come.
https://www.theguardian.com/us-news/2026/aug/21/colorado-river-water-crisis-plan
Now Ent backtracking linking a communist rag. Can’t make up your mind Ent?
Note that I posted the first link without comment.
You projected my approval onto it.
I’ve been following this for years. The various states using Colorado river water have behaved as though it was an unlimited resource. Now they all want someone else to use less. The Federal response is a temporary and inadequate measure.
Stars and Stripes Editor and reporters fired.
https://www.foxnews.com/media/pentagon-fires-longtime-publisher-editor-reporter-military-newspaper-stars-stripes
The fired editor states:
“According to the notice, I am being fired for stating in a CBS interview that censorship of news for service members would constitute a red line. The Pentagon’s public affairs office has charged me with insubordination,” Slavin said in a statement to Fox News Digital.
“I stand by the principle that Stars and Stripes must remain editorially independent, as required by law and by the department’s own policies.”
And it has been since WW-2.
Not anymore.
I guess he didn’t realize he reported to the Secretary of War. Their reports on the conditions on the Abraham Lincoln were ridiculous. WE are at war. Those same journalists probably would have reported about the poor miserable soldiers at Bastogne or Omaha Beach and demanded immediate capitulation to the Nazis.
As always, Stephen’s values are ditched when his tribe finds them inconvenient.
Eisenhower:
“This newspaper should be the equivalent of a soldier’s hometown newspaper, with no censorship of its contents, other than for security”
He also protected the publication’s editorial independence by telling objecting commanders,
“Stars and Stripes is the soldiers’ newspaper. We will not interfere”
Nate,
When you grow up and start working for companies I suggest that you read the contract of employment. It’s amazing what you give up in return for getting paid.
Anon, do you really want to become one of these?
https://theweek.com/political-satire/1010638/useful-idiots
Combat duty is hard. I’ve been on patrols where we would not get to sleep for a week, or be on rations during exercises, or have a piece of equipment fail and the temperature inside the submarine became almost unbearable or eat peanut butter sandwiches every meal for two weeks. That’s a combat vessel. The Abraham Lincoln is a combat vessel. We are at war. I know it must be extremely hot at times, living conditions are rough, often there is no sleep, no showers, etc. That’s what you sign up for when you join. At least most of the sailors, except for the pilots are not being shot at. There isn’t any threat of being sunk. What is your job, your mission? To suck it up and do what you’re ordered to do. To kill the enemy. Stop complaining to your wives or girlfriends or boyfriends back home about how awful it is. The Stars and Stripes editor should have been fired. He was ordered not to interview with CBS. You disobey a direct order, and you are court martialed or fired. I personally don’t believe that women should be on combat ships or in combat. They reduce the effectiveness of the unit. Women can endure arduous duty, but many do tend to complain more loudly or cause problems much more than males. Also, when you put men and women together, stuff happens.
So here’s the Sky Dragon crank position:
“Profit is the net” opposes two transfers of money.
That’s a paradox within accounting.
It’d be interested to know Gill’s opinion on that.
So here’s the Sky Dragon crank position:
“Profit is the net” opposes two transfers of money.
That’s a paradox within accounting.
It’d be interested to know Gill’s opinion on that.
Wrong thread. Oups.
While I’m here, let’s celebrate Dollar Donald’s latest achievement:
https://www.wbaltv.com/article/us-national-debt-in-four-charts/73487070
Mate,
I do say this on a regular basis that No I don’t agree with Trump on everything, but I’m English. What I do agree with is his views on biology Vs trans, his indifference to LGB, abortion, and free speech. Free speech is not absolute, you get paid by a company you are limited, you can’t defame or provoke violence. It’s commen sense.
You are the other useful idi-ots for the socialists are funny. You wail that people should follow the science, but only your version of science. But then say that truth is subjective when it comes to the trans issues. The socialists are bullies with a pack mentality.
Just to please Q-Anon, here’s Katie Lam saying she doesn’t know Joshua Bonehill-Paine:
https://bsky.app/profile/twlldun.bsky.social/post/3msdrjcqag22y
Not that this prevents him from trying to lecture other commenters on American history from time to time.
Troglodytes know they are lying. They think it’s funny. They do not care about the truth. They have a political agenda and they will say literally anything to accomplish it, whatever country they pretend to sail from.
“. . . his (Trump’s) indifference to LGB, abortion, and free speech.”
Trump’s administration is hardly “indifferent” to LGBT rights and free speech. “Actively and aggressively hostile” would be a more appropriate description to both his rhetoric and administrative policy.
“Free speech is not absolute, you get paid by a company you are limited”
Sure, I agree.
But there is a difference between you ‘CAN be fired’ and you “SHOULD be fired”.
An employee who outs his company for harming the public (eg with contaminated food) CAN be fired, but SHOULD she be fired?
If SHE is fired, she could sue, or the public will rightly be outraged and may boycott the company.
Government is there to serve the interests of the public, and in this instance, members of the military.
And it is understood that the Press is there to be a check on government malfeasance.
In this instance, as Eisenhower pointed out, this media outlet is there to serve the soldier, not to protect those in charge of them.
Mark B
There is footage of Trump defending LGB as it’s their choice and governments shouldn’t never be involved on consenting adults.
However he does, quite rightly, go after the Trans & MAPs because those people force their views onto everyone else whether they consent of not.
You don’t seem to understand morals or protecting women & children from those who are mentally disturbed. Other people do, including Trump. So,well done Mark B, you proved where your moral compass is pointing.
Nate,
Agree to a point. Yes there are ethical considerations, but who should make them? Myself or yourself? Each of us probably believes that our own moral compass is the correct one!
If the cases get to the supreme court then would you be happy with their ruling?
“go after the Trans & MAPs because those people force their views onto everyone else whether they consent of not.”
This could easily have been a comment made in 1980 about gay men.
Times change, but intolerance remains.
Never understood this ‘force their views’ “without their consent’.
How is that?
Do you imagine that seeing a man in a skirt is like some sort of sexual assault on you?
“Each of us probably believes that our own moral compass is the correct one!”
Indeed.
Well, independence of the Press was set in the Constitution.
The Stars and Stripes moral compass has been the same for 80 years.
Similarly the the Justice Depts moral compass, eg prosecutions are not directed by the White House, has been the same ethical standard for many decades.
So many such red lines have been crossed by this govt.
Now that I know what MAP means, No just No, so called ‘Minor Attracted People’ are not part of LBGT.
“Attempted Association: Individuals who use the term have occasionally attempted to position “MAP” as a sexual orientation or minority to claim space within the LGBTQ+ community.
Community Rejection: The mainstream LGBTQ+ community, advocacy groups, and the public overwhelmingly reject and condemn these efforts, viewing the term as an attempt by pedophiles to rebrand, normalize, and legitimize criminal sexual attraction to minors”
Here’s a MAP:
https://www.theintelligencer.net/news/community/2024/03/st-c-chick-fil-a-owner-arrested-on-statutory-sex-charge-against-15-year-old-in-nc-2/
The state of Ohio is well known for trans rich guys voting for DSA, obviously.
Good example of White House meddling in Justice, just uncovered.
“The Agreement: Live Nation avoided being forced to spin off Ticketmaster or divest a massive share of its amphitheaters. Instead, the deal included policy changes, restrictions on exclusive ticketing contracts, a cap on certain ancillary fees, and roughly $260 million in financial terms/fines.White House
Intervention: Investigations by the Wall Street Journal revealed that President Donald Trump directed senior DOJ officials to settle the case just days into the trial, following meetings with Live Nation CEO Michael Rapino.”
If you continue to experience very high concert ticket prices from this monopoly,
Thank Donald Trump.
Trump Threatens Suit Over Report He Doesn’t Like, Aiming to Intimidate a Critic
A report by the Center for American Progress determined that there was “no evidence” that President Trump’s deployment of the National Guard to cities across the country had affected the crime rate.
President Trump has opened a new front in his campaign to intimidate political foes, threatening a prominent liberal think tank with a $5 billion defamation lawsuit over a report concluding that his deployment of the National Guard to cities across the country has had little effect on reducing violent crime.
The threats against the think tank, the Center for American Progress, were Mr. Trump’s latest effort to use the legal system to punish critics for voicing unflattering facts and opinions generally protected by the First Amendment.
*
On Monday, one of Mr. Trump’s personal lawyers, Alejandro Brito, wrote a letter to the center warning that he would file the suit if the group did not fully retract the report, which was published on its website on July 13.
The letter, viewed by The New York Times, was addressed to the group’s president and chief executive, Neera Tanden, a longtime Democratic official who served as a senior adviser to President Joseph R. Biden Jr., and to several of its board members.
Mr. Brito claimed that the report about the National Guard was full of malicious and false statements. He gave Ms. Tanden and members of her board until 5 p.m. on Friday to retract it and apologize to Mr. Trump.
*
Ms. Tanden pushed back, saying in a statement that the center would “neither cower nor bend in the face” of legal action.
She also defended the report, asserting that while its findings might have been “inconvenient to the Trump administration,” they were “grounded in rigorous, evidence-based research and analysis.”
“This threatened lawsuit’s attack on facts and evidence is baseless,” she added.
“A fundamental protection of the First Amendment is to allow for the publication of facts and analysis that is contrary to the arguments and claims of any administration. A lawsuit is a transparent attempt to silence us.”
*
Freedom of speech… but only for my courtiers!
Bindy,
Since when have you supported free speech?
Or is memory loss setting in so rapidly that you forgot you been pushing censorship of those who you disagree with?
Never mind, it’s not as if your views are relevant, useful or accurate. But they do provide some amusement, same as a little terrier trying to yap at a Belgium Sheppard.
It’s no wonder Bindi has earned the description of “nazi”. He has no science, so tries to intimidate others to believe as he does. The best example was with Christos, about a year ago. Bindi insulted, intimidated, harassed Christos until he believed Moon is spinning!
Bindi can’t offer ANY viable model of “orbiting without spin”. He doesn’t understand science such as vectors, angular momentum, etc. Like Norman, he just relies on insults and false accusations.
Blinny Goebels believes that if you don’t agree with him then you should be imprisoned. Blinny’s credo is “Rules for Thee but not for Me.”
“It’s no wonder Bindi has earned the description of “nazi”.
Nah, its just that Binny happens to live in Germany.
Stephen lives in Tennessee, where the KKK started.
If we were as dumb as you guys, we would call him Klansman Anderson.
It’s amazing how facts trigger the ignorant.
Similar to waving a crucifix in front of Count Dracula.
Student Duh,
Yet again you struggle with people’s observations about creatures like Bindy Goebells and co .
You bunch of Marxists do not support free speech unless you iu think you can win a cheap shot at others.
The study that little old Bindy Goebells was yapping about is obviously a farce. The National Guard was deployed only after the areas had excessive crime rates. Is it he National Guard still there?? The study saying that there wasn’t any impact is wrong. Hence defamation.
Of course DSA apologists like yourself probably they no that Don Lemon was arrested on free speech issue as well.
Q-Anon goes for emotive conjugation:
I am making observations.
You are taking cheap shots.
They are Marketsists.
Oh look, how amazing!
After Anderson, QAnon, it’s now Clint R who starts Nazi-ing me, that perfectly shows what the three have in common.
*
By the way, let’s add that all three are lying: I never intended to forbid anyone to write even the hugest lies.
I just recommended to ban those who insult me as Nazi, Goebbels, book burner because that definitely goes above the acceptable, and is a 100% perversion of freedom of speech.
But… the filthily discrediting, denigrating and insulting trio doesn’t need to fear ban at any time – unless they become dumb enough as Do*ug Cot*ton, Swen*son, and start insulting the blog’s owner…
Bindi Goebells
You wrote “..I never intended to forbid anyone to write even the hugest lies.” Followed by “I just recommended to ban those who insult me”
Ever heard of irony???
Svensmark has been in the news lately. Could albedo be affecting the speed of the water cycle?
Pochas,
Possibly. Albedo is the measurement, what causes the change in albedo may well change the rainfall. Replace a carpark with a woodland would probably have increase the rainfall. Creating a large number of agricultural poly tunnels may well decrease the rainfall.
The “it depends” is a lot better than the simplistic answers.
Dr. Spencer wrote:
[“In that same post I showed the average of over 100 CMIP6 climate model runs that show precipitation in the Colorado River watershed increasing substantially with global warming, so blaming the recent dry years on human-caused climate change seems a stretch.”]
This is very perplexing.
I have been a longtime reader of this blog, and I was under the impression that a common skeptical argument was that uncertainty in climate models renders their future projections of limited value.
Yet here climate-model projections are being used to suggest that blaming reduced Colorado River flow on climate change is questionable?
Going along with this for the sake of argument, if we are going to accept model projections as relevant evidence when considering future precipitation, then consistency would require considering their projected warming – and the hydrological consequences of that warming, as well.
For example:
https://agupubs.onlinelibrary.wiley.com/doi/full/10.1002/2016WR019638
this publication’s climate-model ensemble projected about 3.6°C of Upper Basin warming by 2100 under a moderate emissions scenario.
They then combined the projected warming with published estimates of the temperature sensitivity of Colorado River flow.
One publication estimates a range of -3% to -10% of annual flow per °C of warming (with a mean of -6.5%/°C). This publication argues there is less evidence that the true sensitivity lies near the low end of that range.
At the upper end, applying -10%/°C to 3.6°C of warming gives a 36% temperature-induced reduction in flow.
More precipitation could offset some of that loss.
But the reverse is also true: prolonged precipitation deficits can occur on top of that -36% temperature-induced reduction. Severe droughts have certainly occurred in the past after all.
It is that latter scenario (prolonged precipitation deficit occurring on top of the temperature-induced flow reduction) where the risk of severe water shortages becomes particularly serious.
But again, all of this is simply following Dr. Spencer’s own premise that future climate-model projections constitute credible evidence.
I have my own reservations about that premise, but here we are.
It could be Roy was pointing out the inconsistency between Alarmist predictions and reality.
I do not think that interpretation works here.
Dr. Spencer himself framed the argument this way in his earlier post:
[“Does Climate Change Theory Even Predict Reduced Precipitation? No”]
This is from here: https://www.drroyspencer.com/2022/08/lake-mead-low-water-levels-part-2-colorado-river-inflow-variations-and-trend/
Notice the word “theory.”
That is a remarkably strong endorsement, considering that a scientific theory is a well-tested explanatory framework supported by a substantial body of evidence.
I must admit, elevating model projections to the status of scientific theory inspires considerably more confidence in climate models than I expected to find here.
The problem with getting concerned about changes in climate is that we’re too influenced by our own experiences. Anything different than what we’re used to is “change”, and is frightening. Any hot, cold, wet, or dry outside of our own experiences means it’s “Chicken Little time”.
Here’s how to handle cult kids, just ask them:
What is Earth’s average temperature supposed to be?
What is snow pack in the Rockies supposed to be?
What is sea level supposed to be?
And the trick question: What is the level of Lake Mead supposed to be? (Most of them will not even know Lake Mead didn’t use to exist!)
You get the idea….
This skeptic’s uncertainty is based upon mathematics. Two differential equations falsify the GHT. Dr. Spencer and others are lukewarmers. They don’t accept the math that falsifies the theory. They believe in GHT but believe it is over blown and there is no crisis. I don’t understand the lukewarmers’ position. If they believe in GHT then they should be concerned.
I wouldn’t sell skeptics short. There is quite a bit of diversity in their points of view.
Some reject the greenhouse effect theory, some accept it but argue the climate sensitivity is low, and others accept anthropogenic warming but dispute the severity of the impacts.
It is a pretty broad tent.
Kynqora,
Yes it’s a broad tent, and to an extent so is the other side. You had Michael Mann of all people dismissing some as doomsters. So not exactly all singing from the same hymn sheet.
On the sceptical side we don’t condemn and coerce anyone who deviates from our personal views. Can’t say the same about those who are suffering from a bad case of Marxism who will attack anyone who even thinks of wavering from the cause.
In the UK the Green Party have lost a growing number of court cases to its former members due ideology purity vs the law.
Q-Anon is probably old enough that troglodytes are trading trans and DEI for the gays, AIDS, D&D, and heavy metal. Only now is he senior enough to lead the charge. A charge financed by billionaires:
https://podcasts.apple.com/us/podcast/we-followed-jk-rowlings-harry-potter-money-heres-where/id1550508625?i=1000760424978
Q-Anon is a tool that keeps on giving to the ultra-rich.
Puffman is suddenly reminded of “but predictions”:
https://climateball.net/but-predictions/
Troglodyte often confuses his pet guru’s crank theory with true skepticism:
https://climateball.net/but-science/#skepticism
We can expect some “but semantics” and “but denier” soon enough.
Nitwit pitching his climateball. Nobody goes there but nitwits.
Troglodyte only knows Climateball:
https://bsky.app/profile/donmoyn.bsky.social/post/3mtr2wcw5c22a
The guys he’s sucking up to are playing another kind of games.
Meanwhile, in the real world where climate-model uncertainty absolutely does exist, it turns out future precipitation changes in this region are actually quite uncertain:
“On the other hand, simulated future precipitation change in the Basin is clouded with much greater uncertainty due to substantial disagreement among models and a highly uncertain ability to simulate realistic change in key phenomena such as storm-track position or decadal and longer-scale drought. Whereas climate models are in general agreement that cool season (warm season much less certain) precipitation declines are likely in the Lower Colorado River Basin, these same models disagree when it comes to the sign and amount of precipitation change that is likely in the Upper Basin. This is because precipitation change in the Upper Basin will depend heavily on the exact changes in the position of cool season jet stream and storm-tracks, two aspects of climate change that are not simulated with confidence by global climate models [Collins et al., 2013].”
https://agupubs.onlinelibrary.wiley.com/doi/full/10.1002/2016WR019638
That is not so comforting for anyone relying on increased precipitation to compensate for temperature-induced reductions in river flow.
And I have to admit, there is something interesting about climate-model projections being invoked in a skeptical argument, only for the particular metric being relied upon (future precipitation) to be one of the more uncertain aspects of those projections.
Isn’t uncertainty in climate-model projections supposed to be one of the reasons we are skeptical of their value in the first place?
Kynqora,
Started reading the article you linked to, but within the first few sentences of the abstract they state without any qualification that the temperature rise is man made. Starting with that position turns the rest of the article into meaningless word bingo and logical contortions. Is academia so broken that the authors feel obliged to take the knee on what could have been a promising article.
Change the ecology, albedo and heat of an area and it’s not a surprise that rainfall alters. Even environmental groups knew & promoted those ideas before the climate change became the bogeyman that had to be feared.
“Meanwhile, in the real world where climate-model uncertainty absolutely does exist, it turns out future precipitation changes in this region are actually quite uncertain:”
Yes, if the models are not based upon natural causes, then uncertainty will exist.
Anon for a reason,
I think you have missed why I cited the paper.
Dr. Spencer is the one who introduced climate-model projections into this argument by invoking CMIP projections as evidence about the future of the Colorado River Basin.
I do not understand that decision myself. Like many other skeptics, I think climate models leave much to be desired.
But if Dr. Spencer is going to invoke their projections as evidence here, I figure we might as well follow that premise consistently.
So if climate model research is to be dismissed because it incorporates anthropogenic GHG forcing, perhaps that criticism should first be directed toward Dr. Spencer’s use of those same models.
I must have missed your warning to Dr. Spencer that invoking model projections renders an argument “meaningless word bingo”?? I am not seeing it anywhere in the comments…
[“Change the ecology, albedo and heat of an area and it’s not a surprise that rainfall alters.”]
You might actually find the paper useful here had you continued reading it.
One of the paper’s observations is that precipitation has shown little long-term directional change in the Upper Basin, even as river flows have declined.
Kynqora,
Why my replies to you get blocked is strange. Without the link
To the the Wiley article 2016WR019638
I scanned through and found reference to RCP8.5 as being BAU. Remember that the IPCC has finally dismissed this scenario as impossible, where others like myself were sceptical of it when we first saw the graphs and projections.
Btw I don’t care who the authors are. I judge the article on its logic, not who has written it. If it’s Dr Roy Spencer then I still stand by my comments.
To paraphrase what you wrote “So if XXXX research is to be dismissed because it incorporates YYYY, perhaps that criticism should first be directed toward ZZZZ use of those same models.”
So in other words if I disagree with the rules of UK football I can’t argue a point about a foul or a goal? Hmmm
> scanning
Q-Anon should try quoting instead:
Op. Cit.
He can always try to lowball their results instead of ranting about “but RCP”:
https://andthentheresphysics.wordpress.com/2026/05/23/rcp8-5-update/
“Bad faith BS” just about covers everything Q-Anon ever contributes.
[“If it’s Dr Roy Spencer then I still stand by my comments.”]
I am still having trouble finding your comment criticizing Dr. Spencer on this issue anywhere in this forum.
Thunderstorms in the Rocky Mountains. A low-pressure system will move in from the northwest. Weather patterns in the western U.S. will change.
https://www.sat24.com/pl-pl/continent/na/hd
https://chrisgloninger.substack.com/p/the-southwest-is-30-feet-from-the
Chris Gloninger offers a useful counterpoint to Roy Spencer’s article.
Although Gloninger’s commentary has some rhetorical flourishes of its own, his substantive treatment of the underlying hydrology strikes me as more balanced and complete.
Unlike Spencer, he doesn’t frame the problem as a choice between excessive water demand and climate change. He acknowledges that the Colorado River was overallocated and that Powell and Mead have effectively been overdrafted since about 2000, while also considering what has been happening to the supply side of the water balance: declining runoff efficiency, earlier snowmelt, increased vegetation demand and greater evaporative losses as temperatures rise.
Whatever one concludes about the relative contributions of climate and consumption, both belong in the material balance. Gloninger includes both sides of the material balance rather than using excessive demand as an argument for discounting changes in supply.
Whether the long drought in the Colorado watershed is due to climate change or not doesnt really matter.
The reality is that recent inflow has been well below the levels assumed by the original agreements and is likely to remain so.
The agreements need to be radically renegotiated to reflect the reduction in available water.
No sense in the Lower Basin states sueing the Upper Basin states becase they cannot meet their original quotas. They cannot supply water which does not exist.
To an outside observer the whole situation looks bizarre. All parties are behaving as though fantasy water can be conjured by a court case or an executive order.
Bet you a dollar that they will still be bickering when the water levels in Lake Powell and Lake Meaddrop to deadpool levels and the taps run dry.
This is what is so interesting about this situation.
If the Colorado River system is entering a period of prolonged scarcity, then the stakes surrounding every water allocation decision rise.
I would not be surprised if the disputes surrounding these allocations became increasingly contentious.
El Nino is coming… They are actually a long way from dead pool. Power generation could be a larger problem. It is worth noting that level and capacity are not linear. As the level drops the surface area also decreases.
https://en.wikipedia.org/wiki/Lake_Mead#/media/File:1935-_Lake_Mead_water_level.svg
https://lakemead.water-data.com/
“Across Europe, extreme weather is drying up rivers.
From the Rhine to the Danube to the Po, critical waterways are falling to record-low levels.
Cologne’s Rhine gauge sank earlier this month to its lowest reading since 1816.
At Kaub, one of the river’s shallowest stretches, the water level gauge fell to 6 centimetres two weeks ago.
The previous record low was 25cm in 2018.”
How to handle cult kids.
What is the Rhine’s level supposed to be?
Bonus question: If all the rivers dry up, how much will sea levels drop?
What is the Rhine’s level supposed to be?
Answer: At Kaub, the long-term reference average is 208 cm.
Bonus question: If all the rivers dry up, how much will sea levels drop?
Answer: If all the rivers on Earth were to dry up completely, global sea levels would drop by 5.9 millimeters.
Easy peasy.
How to handle cult kids
Both answers are wrong. “Easy peasy” ain’t science.
You seem lost for words.
Have my answers confused you?
How to handle cult kids.
Point out their ignorance and immaturity, then move on.
I take it, then, your questions were pointless.
That’s very mature of you.
Student duh,
In other years other parts of the To be have been hot, Nd Europe had washout summers. All depends on where the net stream is and the ocean currents. Most of this is natural variability.
Like the Colorado river, many European rivers are fed at this time of year by Alpine glaciers. which have been shrinking..significantly.
Same projected for Asian rivers fed by Himmalayan glaciers.
Reliable water sources are becoming less reliable.
On the flip side, in other places, like Texas, we getting a series of record Spring floods.
Speaking of drought challenges for agriculture,
“Farmers Struggle to Get Basic Services From Depleted Agriculture Dept”
https://www.nytimes.com/2026/08/24/us/politics/farmers-federal-workers-exodus.html?unlocked_article_code=1.71A.0Bo_.KSQ_6ydcF4jN&smid=url-share
Thanks to DOGE/Trump cuts.
And yet, the National Debt has reached $40T, and the interest payments on it, at $1.2T/y, now exceed Defense and Medicare spending.
And yet, Hegseth wants 44 % more $ for his War Dept.
And yet, Social Security is set to be insolvent in 4 y.
Are you proud that we’ve Made American Govt Great Again?
I like my tax cuts but for your benefit:
We the people of the United States in order to form a more perfect union, establish justice, insure domestic tranquility, provide for the common defense, promote the general welfare, and secure the blessings of liberty to ourselves and our posterity do ordain and establish this Constitution of The United States of America.
Entitlement programs derived from the Democrat Party. Social Security, Medicare, Medicaid are all Democrat inventions. Food stamps, SNAP, EIC are all Democrat inventions. Provide for the Common Defense is the one thing expressly delineated in the Constitution. Social Security will probably be fixed at the last minute by raising payroll taxes and taxing everybody. Raise payroll taxes from 7.65 to 9.2 percent and its fixed. That’s what happened last time.
Stephen p anderson
You make a strong case to vote Democrat this cycle. Seems like you have some wealth behind you so you don’t care about Social Security or Medicare. I paid into those services! Not a freebie! Also would rather have poor people fed than revolt! Got news for you also, maybe you are a multi-millionaire but everyone in the Nation can’t be super wealthy. Economics does not work that way.
Raise payroll taxes? Why not raise the income level that FICA gets taxed?
Is it government’s job to raise the income level or get out of the way of the free market? That’s what Trump tries to do. Also, you never hear about the debt when Democrats are in office. Republicans are least responsible for the debt.
Norman,
I think Social Security was probably a good thing when it first conceived, but when they allowed Social Security disability it opened up all kinds of abuse. Funny how one of my relatives couldn’t work while he was on disability but as soon as he transferred over to traditional Social Security, he had no problem working.
stephen p anderson
Since you profess Christian beliefs you would be one to know humans are not “basically good”. Free markets get as corrupt as possible as people really do not care about the well-being of others as long as there is a buck to be made.
Here is an article for you to read about Food Industry pre-regulation. Quite bad for the consumer.
https://www.popsci.com/health/food-safety-before-fda/
Here is one on why Banking had to be regulated.
https://scholarship.law.duke.edu/cgi/viewcontent.cgi?article=3130&context=lcp
You may be living in some sort of Ayn Rand Fantasy bubble of how people by being completely selfish would work for some greater good.
Alan Greenspan, a big fan of Rand, found out the hard way people in unregulated environment will not act in the best interest. That is why we live in the regulated world we have at this time. People do not tend to do good.
Also you can read your Old Testament Bible and see how the “Free Market” was corrupt in the Ancient days where merchants would have false scales to make themselves rich at the expense of the market.
It is the same reason you need an active Police Force. This is a form of regulation on certain behaviors deemed destructive to the social order. Same with markets. Without regulation you get a very corrupt and unsafe market. I prefer to have an agency monitor food production and try to make the food as safe to eat as possible. Yes it takes tax money to pay for it. Better to pay then die from someone’s bad food product.
I think you live in some unreal world of your own making. Not at all realistic and not based upon any reality that can easily be researched. No one here can pop that bubble reality you live in.
Norman,
You need to read Thomas Sowell. Of course, people are selfish, greedy, and in it for themselves. Educate yourself on the market. Don’t trust anyone. I wouldn’t have it any other way. Caveat emptor.
“Raise payroll taxes? Why not raise the income level that FICA gets taxed?”
I don’t have a problem with this. But it won’t fix the problem. I think they’d still have about 15% shortfall. They’re going to have to raise payroll taxes.
“In 1983, approximately 90% of wages and salaries were subject to the payroll tax. But as of 2024, only 83% of earnings in covered employment were taxable. Put simply, more earned income is escaping the payroll tax over time.”
https://www.fool.com/retirement/2026/01/03/has-congress-stolen-trillions-from-social-security/
In 2019 the debt was $22.719 Trillion.
In 2024 it was $35.464 Trillion.
Who was the President and who ran the congress in that 5 year period?
Do you understand the different between mandatory spending (laws enacted by congress) and discretionary spending?
I know a liberal Democrat who is actively involved in the party. He is proud of volunteering his time to call seniors in Florida to lecture them how to vote. He says he is in favor of all kinds of taxes except his own. I am not sure if that is a joke.
Trump was President 2019 through 2020, when the budget first xploded.
One would have hoped that in his second term the budget would have begun to get under control, but No.
We got tax cuts with little substantive spending cuts.
His policies have led to higher interest rates on tbe Debt.
And the fun starts when people who are either incredibly dumb, or intentionally dishonest, try to comment on The Constitution and the workings of the Federal Government.
The Congress appropriates the money. Period. The only thing the President can do is veto. In most cases, the President cannot even refuse to spend the money once it is approved. Oh, and what happened when Trump tried to introduce the DOGE? The democrats and their socialists supporters in the media became hysterical.
For the record, it was House Speaker Pelosi and Senate Majority Leader Schumer who blew-up the federal budget and the economy with stimulus packages. They were warned repeatedly and forcefully that it would increase the deficit and cause inflation, but they did it anyway.
Democrat Senators Manchin and Sinema sacrificed their political careers for the good of the country to stop the madness. Both were threatened with physical violence and stalked. Ironically, no humorously, the final bill was called “The Inflation Reduction Act”.
Inflation reached 9% before “Too Late Jay” began making emergency — almost unprecedented — interest rate increases in a desperate attempt to save the economy. In the process he crash both the stock markets and bond markets, but it was the only choice because he was late and the Democrats failed to listen to reason.
“In 2021, the federal government issued three rounds of Economic Impact Payments (stimulus checks) to help individuals during the COVID-19 pandemic, totaling approximately $931 billion in direct payments. The most recent payment was part of the American Rescue Plan, providing up to $1,400 per individual and $2,800 for married couples, with additional amounts for qualifying dependents.”
“The Inflation Reduction Act of 2022’s energy subsidies are projected to cost between $936 billion and $1.97 trillion over the next 10 years, and between $2.04 trillion and $4.67 trillion by 2050.”
Republicans know that by cutting taxes they spur growth which leads to more tax revenue. We need tax revenue because of all the entitlements. Why is Trump increasing military spending? Trump realizes the strength of our dollar and bonds which foreigners buy is directly tied to our military power. Look at all the great civilizations of the past. What is the one common thread? Military power. Trump realizes this. When we are not the greatest military power any longer, we will start to decline. I guess that is OK for some on this board. It isn’t OK for me.
[IVY LEAGUER] Who was the President and who ran the congress between 2019 and 2024?
[OUR IVY LEAGUER’S RESEARCH ASSISTANT] “The U.S. President does not have the authority to authorize spending independently; Congress holds the power of the purse, meaning it must approve all federal spending through appropriations. The President is responsible for executing the budget and spending the funds that Congress has appropriated. National Constitution Center U.S. Government Accountability Office (U.S. GAO).
I predicted it would be fun to watch people misstate The Constitution. I was correct. Willard is simple. He sees Trump as a villain in one of his fantasy games. That is enough for him. Nate is different animal. Nate is a politician and must know full well what the Democrats did using COVID as an excuse. Why? Because he likes it. They know that there are many voters who like the idea of free stuff, and there is no better free stuff than cash in your bank account. People will vote for the party giving them free stuff especially if they have no idea how much harm that causes for people who work for a living.
Our Ivy Leaguer just can’t own his stupid stance.
What a despicable, little (as in small c) contrarian.
Yes domestically both parties and globally many countries supported government stimulus of economies during the massive Covid economic shock.
And yes, I think some of the later stimulus during Bidens term was unnecessary or excessive.
But globally, with the supply chain disruptions, and stimulus money for people to stay home and order crap from Amazon, there naturally was inflation, with many countries in Europe getting hit harder by it than the US.
By the end of Bidens term inflation was trending down to normal, but Trump promised to LOWER prices. And the gullible masses believed him.
Lets face it, that did not happen. In fact, his tariff and war policies that voters never asked for, have directly made inflation worse.
And this was an avoidable self-goal.
As far as I recall, US presidents are elected for a four-year term, not five.
The debt in 2019 (22,719) thus is irrelevant for the comparison.
And the debt difference between 2020 and 2019 was… 4,226!
Nice try, Big Reveal boy…
End of Fiscal Year — Debt — 4-year diff
2016 — 19,573
2020 — 26,945 — 7,372
2024 — 35,464 — 8,519
My advice to you is that you not try responding to any of my comments with anything approaching an insult. Be kind! Otherwise, I might be tempted to post what I really think about your competence and your behavior on this site. Stick to criticizing Gordon Robertson. He is more your speed.
Exactly 2 hours and a half after saying “and the fun starts when people who are either incredibly dumb, or intentionally dishonest, try to comment on The Constitution and the workings of the Federal Government”, our Ivy Leaguer professes kindness.
While trying to conceal Donald’s responsibility for 30% of the whole Murican debt would amount to fraud in more serious contexts, the pompous jerkitude is worse.
Oh look, search assistant is smarter than Willard! How could that happen?
“The U.S. President does not have the authority to authorize spending independently; Congress holds the power of the purse, meaning it must approve all federal spending through appropriations. The President is responsible for executing the budget and spending the funds that Congress has appropriated.
National Constitution Center
U.S. Government Accountability Office (U.S. GAO)”
https://www.gao.gov/legal/appropriations-law/impoundment-control-act
“My advice to you is that you not try responding to any of my comments with anything approaching an insult. Be kind!”
It is astonishing how rapidly hypocrisy can be revealed in a person. Here, within two consecutive comments.
Also there is this:
“The Congress appropriates the money. Period. The only thing the President can do is veto”
And if MAGA controls Congress and the Presidency, Tim will still try to blame someone else.
Under the Current govt policies and enacted legislation:
“Deficits are large by historical standards. The deficit totals $1.9 trillion in fiscal year 2026 and grows to $3.1 trillion in 2036. Relative to the size of the economy, the deficit is 5.8 percent of gross domestic product (GDP) in 2026 and increases to 6.7 percent in 2036. Deficits averaged 3.8 percent of GDP over the last 50 years (see Chapter 1).”
“Debt held by the public rises from 101 percent of GDP in 2026 to 120 percent in 2036, well above the previous record of 106 percent just after World War II.”
https://www.cbo.gov/publication/62105
And this was before the Iran War and the 44% budget increase requested for War Dept.
Nate,
But you know since you are such an astute reader of civics that MAGA doesn’t control Congress. They only have a one vote majority in the Senate and need at least 60 Senate votes for almost every bill.
Nate,
If you want to watch socialism in action, take a look at NYC or Seattle. You can watch them collapse right before your eyes.
Did they get 60 votes for their Big Beautiful Debt Bill?
No.
Those bills passed through budget reconciliation is so the other party can claim they didn’t vote for it. But they did. Both parties allowed the filibuster to be ignored under certain circumstances.
You leftists want to destroy America so you can rebuild it into your utopian vision. It would be an absolute hell hole.
Oh look… The loudmouthed ‘Big Reveal’ blowhard who isn’t capable of simplest things – for example, correctly comparing US debt levels under Biden and Trump – and who lacks even the slightest shred of expertise regarding climate data time series, is woefully trying to threaten me!
Je n’ai jamais autant rigolé sur ce blog.
I am sitting here laughing with joy. Bindidon feels threatened that his incompetence is exposed. Ask for support. Who thinks you contribute anything of value other than amusement? Your biggest challenge is that you still have not figured out what Gordon Robertson is doing to you and everyone else who responds to him. You and some of the others think the childish pet names and insults are amusing. They are not. Your fake graphs and armature analysis does not add anything of intellectual value. That is a fact. You are disorganized and lack relevance. I will repeat that you should interact and argue with people like Robertson who are more your speed. I am done with you, Nate, and others who think it is okay to be dishonest and insulting. You people need to be called out.
I have a better answer. People who arrive with a sense of curiosity and a desire to learn, do not need to have some fool mutilate the data to suit some agenda. In law, the document speaks for itself. In science the data tells the story. Claiming to reveal some kind of magical trend based on faulty assumptions is the very definition of mutilation.
Bindy Goebells,
Without fail you yap against capitalism. Do you know who else did? It’s your mate, Adolf.
YOUR kind thinks “insults are amusing. They are not”
More do as I say, not what I do, and do, and do again, says Tim S.
Absolutely hilarious.
And he is ‘done’ with me again, since he’s deeply afraid to debate me on a factual basis, as opposed to his purely derisive basis.
I fell sorry for Nate. I really do. I wouldn’t want to be like Nate. I objectively describe BEHAVIOR. He goes directly to stereotypes and insults. “Your kind”. Really? Some minority groups get really upset with that sort of thing.
How our Ivy Leaguer feels is of little concern to anyone but himself.
Which makes sense as he’s so full of it. In that regard he’s no different from Puffman.
Perhaps they should convene to get new material?
“He goes directly to stereotypes and insults.”
Never met anybody quite as lacking in self awareness as Tim S.
I respond to Tim’s posts with facts and links. His only response to these is pure derision.
Conclusion: Tim is too insecure to debate eith me on the facts.
More adapting to climate change would be the best to do!
We still have a huge electrical production reserve – the coal operated steam power plants.
Since it is clear now – the fossil fuels burning does not affect climate, because the warming is an orbital phenomenon.
So let’s use coal!
–
https://www.cristos-vournas.com
Christos,
As long as the coal burning is efficient and produces less pollution than the coal power stations of the 60s then you will not have a problem from many. Most people want cheap and reliable power when they want it. It’s also been the biggest contributor for raising standards of living across the globe.
Anon,
“Most people want cheap and reliable power when they want it. It’s also been the biggest contributor for raising standards of living across the globe.”
Exactly: “cheap and reliable power when they want it.”
The Colorado River Basin experienced a major drought during 1901-04.
The basin experienced another dry episode from 1931–40. This drought coincided with the broader Dust Bowl era and was a notable period of below average flows during the 20th century.
The basin experienced another prolonged drought during 1942-56. But areas supplied by the Colorado River generally maintained adequate water supplies:
https://pubs.usgs.gov/publication/pp372F
Then there is the post-2000 drought. Streamflows have been substantially reduced, Lake Mead and Lake Powell have fallen to historically low storage levels, and the shrinking water supply has transformed Colorado River allocation into an increasingly urgent interstate political and water management problem.
As we can see, droughts occur in the Colorado River Basin. Some are more severe than others.
There is certainly no reason for skeptics to be uncomfortable acknowledging the droughts that occur in this region:
[“And calling the recent dry years a “millennium drought” is just fake news”]
Kynqora,
Who said that there were no droughts in this region ever? As far as we are aware there have always been droughts, so why mention it every post? Many of us also push the facts that too much demand is also a huge issue. Some on your side of the aisle just want to push the climate change and/or it’s Trumps fault.
The world does better when energy is cheaper and more reliable than the net zero buffoonery that gets pushed.
Dr. Spencer is the one casting doubt on the characterization of the present event as a prolonged drought. Here are his words:
[“And calling the recent dry years a “millennium drought” is just fake news”]
And I am not sure why. I don’t understand the reluctance if we already recognize that droughts are a common occurrence in this region.
[“Many of us also push the facts that too much demand is also a huge issue. Some on your side of the aisle just want to push the climate change and/or it’s Trumps fault.”]
My side of the aisle…
I said some droughts are more severe than others. That’s not a controversial statement.
I also said somewhere above that I think the problem involves both GW and human water use.
It is people on your side of the aisle who seem to want no room for a contribution from global warming.
Kynqora,
I agree with the comment “And calling the recent dry years a “millennium drought” is just fake news”. From the point of view that droughts have always occurred in that region then amping a drought to “millennium drought” is OTT.
I also said “some on your side of the aisle” not everyone, not necessarily you either, I said “some”!
We do appear to agree on it’s a mixture of drought and excessive demand. How much is global warming is up p for debate, and also how much of that global warming is man made Vs natural climate change.
Does anyone on my side deny natural climate change? if they have I missed it. What concerns us is with all the other factors involved how much is man made?
It is called the Millennium Drought because it began around the start of the current millennium.
There have certainly been wet years since then that brought temporary relief, but the drought has repeatedly reemerged.
After roughly 26 years, this is more than just a handful of unusually dry years.
So I don’t really understand what is supposedly “OTT” about the name.
And as for what is causing contemporary climate change, I really don’t know. Climate is complicated.
I do think we can rule out certain explanations, such as orbital forcing or particular modes of ocean variability.
Kynqora,
You want to rule out orbital forcing due to what logic? An increase in temperature of the globe would be caused by only a few extra watts.
If we ignore the impossible scenarios that even the IPCC does, that leaves a more RCP 3.5 as a mid scenario. So how many extra watts go you think would cause that?
Anon
A few watts is all you need.
If you do the maths you find that retaining an extra 4 watts raises the the global average temperature by 1C.
Entropic,
“If you do the maths you find that retaining an extra 4 watts raises the the global average temperature by 1C.”
Science fiction!
–
https://www.cristos-vournas.com
It’s hard to know if Ent just made a typo or is displaying his ignorance of science, again.
It’s NOT “watts”, it’s Watts/square meter. But, that’s only the start of the problems.
Not all infrared is the same. So reducing CO2 can NOT cause a decrease in Earth’s temperature, just as increasing CO2 can NOT increase Earth’s temperature.
Ent gets confused easily. He believes “maths” is science. He believes “imagination” is reality. The combination would mean that a human could run 1000 mph because d=rt. So covering a distance of 1000 miles in one hour then results in 1000 mph. The “maths” is correct, but reality is tossed. Ent is also the one that believes passenger jets fly backward!
Kids these days….
Ent,
Why don’t you show us the maths and how they were derived? Why do Europeans say “maths” by the way?
> that leaves a more RCP 3.5
How contrarians tell they use talking points without doing any reading:
https://climate-scenarios.canada.ca/?page=scen-rcp
And that’s one generation earlier.
When they’ll discover SSPs, troglodyte brains may splode.
You felt you had to respond for Ent? You don’t believe he is capable? Don’t you know math? You always link something? So, 159/33=4.8, it isn’t 4. Show your evidence that it is 159. Show your evidence it is 33. Show how it is derived. No speculation. Show the mathematical derivation.
Troglodyte,
Who wrote this comment:
https://www.drroyspencer.com/2026/08/record-low-lake-mead-millennium-drought-or-inevitable-result-of-demand-exceeding-supply/#comment-1752713
?
Q-Anon can’t even remember one number (4.5) one day after being spoon fed.
Show me you can do logic:
[POMPOUS ASSHAT] I objectively describe BEHAVIOR
[SAME POMPOUS ASSHAT] Why? Because he likes it. They know that there are many voters who like the idea of free stuff
Even you got to admit there’s some incongruity!
I know you’re really trying to appear smart, but you ain’t.
Trogodyte cares a lot about appearance:
https://www.theguardian.com/us-news/2026/aug/27/rfk-jr-senate-confirmation-hearing-testimony-vaccines
RFK lied.
He LIED.
Lied!
Do go on. My hand is too full.
Kynqora
You wrote above:
” And as for what is causing contemporary climate change, I really don’t know. Climate is complicated.
I do think we can rule out certain explanations, such as orbital forcing or particular modes of ocean variability. ”
and obtained two replies:
1. ” You want to rule out orbital forcing due to what logic? An increase in temperature of the globe would be caused by only a few extra watts. ”
2. ” Please do not rule out orbital forcing.
**
Let us start with the assumption that the warming of 1 °C observed during the last century is not due to internal terrestrial energy changes of any kind but rather has external causes as source(s).
According to e.g. SATIRE reconstructions, TSI (total solar irradiance) over the last century has hovered around 1362 W/m².
This roughly corresponds to about 174 Petawatt of power applied at any time to Earth.
*
Looking at other information sources tells you that to achieve an increase of terrestrial temperature by 1 °C over a century, external sources then must provide for an additional power supply of at least 1 Petawatt, i.e. roughly 0.6 % of TSI’s power.
One constantly applied Petawatt: that’s a tiny bit more than ‘a few extra watts’. It’s 10^15 Watt.
*
Further information sources tell that:
– gravitational interactions between Earth and planets like Mars, Jupiter, Saturn etc, create back and forth shifts but do not generate new energy;
– Earth’s average distance from the Sun cannot experience a drift that would continuously increase solar input over century-long periods
– Milankovitch cycles change Earth’s eccentricity and axial tilt, but the total solar energy intercepted by Earth remains nearly constant, especially when a tiny period like a century (compared to the cycles’ duration) is observed.
*
Thus, anyone telling you that orbital forcing can contribute to terrestrial warming by a constantly supplied amount of 1 Petatwatt power can’t simply tell that: s/he must deliver a technically confident proof of such allegation.
Otherwise it’s no more than just saying non-committal stuff.
Bindy Goebells,
Still yapping that the earth’s orbit is roughly circular. Such a simplistic way of thinking is truly childish to the extreme. You and dullard certainly are trying to compete for the biggest simpleton.
Swapping watts per squared meter to peta watts is so typical of a supporter of democratic socialist. Yes you mention a big number but it is as a distraction that you understand little. Another big number is the tens of millions that socialism has killed in the last 150 years. Killed by your heros like pol pot, Stalin, Hitler and mao.
Even the Dullard indicated that he knew that the sun is not the exact center of the earth’s orbit. Whereas you argue against gravity.
Anon for a reason
[“Still yapping that the earth’s orbit is roughly circular.”]
But the closer Earth’s orbit is to circular, the smaller the difference in Earth–Sun distance between perihelion and aphelion becomes. That weakens the climatic effect of precession.
[“Such a simplistic way of thinking is truly childish to the extreme.”]
No, quite the opposite, actually. The importance of how circular Earth’s orbit is is not some simplistic detail.
It leads directly into the 100 kyr problem, one of the more interesting complications of Milankovitch theory.
[“Swapping watts per squared meter to peta watts is so typical of a supporter of democratic socialist.”]
Could you explain which part of the conversion from W/m² to petawatts is specific to democratic socialism?
Kynqora,
Milankovitch had a simple model at looking at the earths orbit, although saying that, his work was a lot more detailed than the resident yapping Goebells. NASA has a very detailed set of calculations which have been validated by precise observations. I think Milankovitch did well with what he had back in 1920, it was certainly not a supercomputer.
I take NASAs accurate and precise calculations of orbital paths over any person. That department doesn’t have politics as a driver, unlike some of their other departments.
If you don’t get the reference of democratic socialists using big numbers as a distraction tactic, then perhaps you need to look to what is happening in Chicago, Minneapolis, new York etc.
[“I take NASAs accurate and precise calculations of orbital paths over any person. That department doesn’t have politics as a driver, unlike some of their other departments.”]
NASA’s conclusion from those orbital calculations is that the present orbital configuration cannot explain modern global warming and, in the absence of the modern increase in CO2 concentrations, would instead favor long term cooling.
That seems somewhat difficult to square with the skepticism you expressed above about a primarily manmade explanation for contemporary climate change.
Entropic man is right: a reduction of 3.3 Watt/m² in the longwave radiative flux density measured at TOA creates an increase of Earth’s temperature by 1 °C.
*
By the way, some info for this blog’s dumbest lunar spin denier…
I wrote months ago:
” “Polar-orbiting infrared (IR) observations are transformed into global Outgoing Longwave Radiation (OLR) fluxes like 240 W/m² by converting localized radiance or brightness temperatures into broadband radiative fluxes using multispectral regression models and radiative transfer physics.”
*
Saying that deriving Watt/m² out of Fourier-transform spectroscopy data is allegedly questionable because ‘that value is obtained through a maze of embarrassing manipulations, based on the fraud of an imaginary sphere‘ – without providing a technical proof of such a ridiculous allegation! – is the same as saying that deriving atmospheric temperatures out of radiant emission by O2 in the 60 GHz range is ‘questionable’.
The devices used are very different, but the scientific methods used are very similar, beginning with the well-known ‘radiative transfer equation’ to be used in both cases.
There are very good descriptions of how the UAH team processed O2’s emission data; one just needs, however, to read them.
Bindidon,
Please do not rule out orbital forcing. Not with science fiction.
–
https://www.cristos-vournas.com
” Please do not rule out orbital forcing. ”
Vournas still did not understand:
” Thus, anyone telling you that orbital forcing can contribute to terrestrial warming by a constantly supplied amount of 1 Petatwatt power can’t simply tell that: s/he must deliver a technically confident proof of such allegation.
Otherwise it’s no more than just saying non-committal stuff. ”
*
” Not with science fiction. ”
An interesting remark, especially from a guy who not only adds specular reflection to what Earth’s balance equation contains already, but above all is brazen enough to insert it into that equation as a multiplying factor instead of as a subtracting one!
*
That is at least 100% science fiction.
Bindidon,
Please do not rule out orbital forcing. Not with science fiction.
–
“Christos Vournas
@CVournas44116
·
30m
Initial Premise Test https://cristos-vournas.com/blog/initial-premise-test…
Thought for 11s
The X post by mechanical engineer Christos Vournas links to his blog post “Initial Premise Test,” which tests the basic assumption that planetary surface temperatures scale solely with the fourth root of incoming solar flux for identical bodies.
The test normalizes temperatures of solar system bodies (planets and moons) to Earth’s solar flux distance, then successively adjusts for albedo, rotational warming via (N*cp)^{1/16}, and a solar irradiation accepting factor Φ (~0.47 for smooth surfaces accounting for specular reflection), causing measured temperatures to converge tightly around Earth’s 288 K.
Vournas uses this to argue that factors like surface roughness, rotation rate, and heat capacity explain temperature differences across bodies more than atmospheric effects, challenging standard greenhouse models with data tables showing residuals under 3% after corrections.”
Links:
https://x.com/i/grok/share/33a5fe4f67344872ad0941cdecf359ac
–
https://www.cristos-vournas.com
Kyngora,
“And as for what is causing contemporary climate change, I really don’t know. Climate is complicated.
I do think we can rule out certain explanations, such as orbital forcing or particular modes of ocean variability.”
“we can rule out certain explanations, such as orbital forcing”
Please do not rule out orbital forcing.
–
Link: https://www.cristos-vournas.com
Christos (and Anon),
I already tried to explain farther upthread: August 16, 2026 at 6:25 PM.
The short version is that the present orbital configuration is not favorable to the kind of global warming we are currently experiencing.
If you haven’t already, read the 1976 publication by paleoclimatologist James D. Hays and colleagues:
https://www2.atmos.umd.edu/~nigam/AOSC617/Hays.Imbrie.Shackelton.Orbital.theory.ice.age.Science.1976.pdf
Kynqora,
You are referring to an article written in the time before NASA was able to predict the orbits of the planets over centuries.
So, nice try but you missing the obvious.
From year to year the orbits change of all the planets. Not by a lot but enough to cause some change to the weather. Even the sun is not always at the centre of the solar system. The centre is defined by the point of which every large object orbits around.
From my view point orbital changes is a part, and is not 100% if the cause. Mans changes of the environment is another cause due to the built environment
Kyngora,
“Christos (and Anon),
I already tried to explain farther upthread: August 16, 2026 at 6:25 PM.
The short version is that the present orbital configuration is not favorable to the kind of global warming we are currently experiencing.
If you haven’t already, read the 1976 publication by paleoclimatologist James D. Hays and colleagues:
https://www2.atmos.umd.edu/~nigam/AOSC617/Hays.Imbrie.Shackelton.Orbital.theory.ice.age.Science.1976.pdf”
The conclusion the 50 years ago (Dec. 10, 1976) research:
Variations in the Earth’s Orbit: Pacemaker of the Ice Ages
Author(s): J. D. Hays, John Imbrie and N. J. Shackleton
Source: Science, New Series, Vol. 194, No. 4270 (Dec. 10, 1976), pp. 1121-1132
https://www.whoi.edu/cms/files/hays76sci_268464.pdf
came to was:
7) A model of future climate based on the observed orbital-climate relationships, but ignoring anthropogenic effects, predicts that the long-term trend over the next several thousand years is towards extensive Northern Hemisphere glaciation.”
There are – in (Dec. 10, 1976) research – there are many flaws awaiting to be corrected. Those flaws triggered an entire alarmism behavior.
///////////////////
In short, the old theory claims Earth naturally should be cooling, but fossil fuels burning overhelms the natural cooling, so Earth is warming.
Actually, the fossil fuels burning does not affect the Global temperature, because, as we have shown, Earth’s temperature rise is natural.
///////////////////
Link: https://www.cristos-vournas.com
Yes, their model of the orbital-climate relationship predicts a long term tendency toward Northern Hemisphere glaciation over the next several thousand years.
Something broke that trend…
Kynqora says:
August 27, 2026 at 2:48 PM
Yes, their model of the orbital-climate relationship predicts a long term tendency toward Northern Hemisphere glaciation over the next several thousand years.
Something broke that trend…
///////////////////
They predicted cooling instead of warming. They made a mistake! It is a warming for 6000 years now. The warming is in its culmination phase now.
I invite you, Kyngora, to visit my site. I have explained in details.
///////////////////
Link: https://www.cristos-vournas.com
Christos,
[“It is a warming for 6000 years now.”]
No. Precession driven summer insolation anomaly peaked around 12,000–10,000 years ago.
Different proxy records from across the Arctic corroborate the climatic story expected from that forcing by indicating that high latitude temperatures generally peaked during the first half of the Holocene:
https://www.researchgate.net/publication/235703851_Holocene_thermal_maximum_in_the_Western_Arctic_0-180W
It was time-transgressive across this region, owing partly to the residual ice sheet left from the previous ice age, but the broader point remains: peak Holocene warmth in these high latitude records had already occurred.
[“The warming is in its culmination phase now.”]
No, not at all. The UAH LT temperature trend is still about +1.6°C/century.
Kyngora,
“Different proxy records from across the Arctic corroborate the climatic story expected from that forcing by indicating that high latitude temperatures generally peaked during the first half of the Holocene”
The higher CO2 content in ice cores’ samples indicate for a colder climate, indicate fpr lower temperatures, not for a warmer climate and not for higher temperatures.
When at low polar temperatures CO2 is condensed, it is freezed out from air and gets sequestered in snow – that’s why the higher CO2 content in ice-core samples.
–
https://www.cristos-vournas.com
Christos, why are we talking about CO2?
Are we chasing phantoms here?
I am only interested in refuting your point that Earth has been warming for 6,000 years here…
Kyngora.
‘I am only interested in refuting your point that Earth has been warming for 6,000 years here…’
We have shown, Earth’s temperature rise is natural. Earth has been warming for 6,000 years. You cannot refute that.
///////////////////
Link: https://www.cristos-vournas.com
What I find compelling about this publication is that this conclusion is not based on a single proxy.
It uses pollen and plant macrofossils, treeline evidence, geomorphic evidence, lake sediments, etc.
It is a regional synthesis of multiple different kinds of proxies, which helps circumvent the limitations of each proxy individually.
And collectively, these proxies indicate that high latitude temperatures generally peaked during the 1st half of the Holocene.
If multiple independent proxies with different limitations converging on the same conclusion is not persuasive, I am not sure what would be.
Kyngora, please refute those proxies one-by-one. What could be more convincing it was colder then, since we have a continuous orbital warming.
There is a continuous positive and a continuously accelerating solar energy absorption rise observed from the orbital cofigurations changes.
–
https://www.cristos-vournas.com
I found an amusing summary of the Colorado River problem.
“There’s a certain poetic justice here, perhaps—communities that have built their identity on the myth of the ruggedly independent western man overcoming the hostile elements, only to find themselves entirely dependent on the socialized distribution of limited water.”
Yes Ent, your perversion of reality is amusing.
Here’s how it really works: When governments provide for a growing population with things like nuclear power plants and dams, the results make sense. When governments fail to provide for a growing population, the results are catastrophic.
Entropic Man,
You are either clueless to how the settlements were originally created where demand didn’t outstrip supply.
Or you being intentionally misleading.
Which is it?
Have you stopped beating your wife?
Entropic Man
Never resorted to violence.
Whereas you seem to think of it rather quickly.
For that reason I prefer “when will you start eating your wife”:
https://en.wikipedia.org/wiki/Loaded_question
Anon
God, you’re thick.
You tried to use the old rhetoric trick called the either-or fallacy or the false dilemma. A debator oversimplifies to two alternatives and asks their opponent to choose one. Whichever their opponent chooses makes them look bad.
The classic example of the false dilemma is the question “Have you stopped beating your wife?” Answering yes or no is an admission to wife-beating.
You are so uncultured that you don’t understand rhetoric and so ignorant of physics that you couldn’t refute a simple calculation using the Stefan-Boltzmann equation.
Please explain why anyone should bother to interact with you.
Entropic Man,
So you are not that bright yourself. The only time that works is in court room dramas or with people who are suffering from Dunning–Kruger on being able to argue logically, like yourself in this case.
Interesting that you call others lacking in physics when you can’t answer many simple questions and like Bindy Goebells you think bluster is a substitute to knowledge.
I believe that I have asked you and others on the febrile side to state what the insolation is on any particular day you choose. Funny how none of you lot can answer or don’t even know where to go to even start answering the question.
> I believe that I have asked you
Perhaps Q-Anon is able to fool himself that he did.
Why can’t troglodytes own their stupid tricks?
If the only time the false dilemma works is in courtroom dramas, why did you try it on me?
The formula I used on the back of my envelope for deriving the amount of radiation required to raise Earth’s temperature t a certain temperature is derived from the Stefan-Boltzmann equation.
(New temperature/old temperature)^4 * old incoming radiation
= New incoming radiation
(289/288)^4 * 240 = 243.86W/m^2
That’s an increase of 3.86W/m^2 for a 1C increase in temperature.
Now I’ve made your sammich, you make mine.
If you are capable(and you’re probably not) show me how you would calculate what increase in incoming radiation would raise global average temperature by 1C.
Entropic Man,
Wow, you really do need it spelt out. I gave you 2 options out of how many? It’s only two if you watch the court room dramas or you being, well, yourself.
To help you out. When you tried the immature version on me I replied with a third option you then had a little childish hissy fit. Suggest you ponder life a bit more.
A lot of assumptions and speculation in your calculations, Ent. Oh, and you have to believe in the magic GHT.
”
When governments provide for..”
So you are FOR government support for energy supply.
Got it.
Opportunistic accessibility to the ”commons” is a long held doctrine in this country. . .to the extent that one particular President had to step in over a century ago to ensure it for perpetuity.
What socialism is though is extending that far beyond the commons to the work and effort of individual persons. The commons are not free and they demand responsible management while preserving responsible accessibility. Freedom as an individual is our greatest human treasure, requiring minimal management to preserve. Teddy Roosevelt eschewed European-style conservation where huge estates were locked up by the Aristocracy and denied to the common man. Instead he created a system of conservation for the benefit of all on the premise that it is interaction with nature which produces robustness in human mind, body, and spirit. There is an authoritarian evil out there that desires to lock up humans in pursuit of their own personal objectives. This must be guarded against at all costs.
Only fools and despots can’t see or don’t care to see that distinction.
Shorter Gill –
Transferring public wealth to private interests is GOOD.
Billionaires giving back their fair share to the public is BAD.
Troglodytes act like emperors, yet they have no clothes.
Willard mistakes:
Shorter Gill –
Transferring public wealth to private interests is GOOD.
——————
the commons aren’t transferred to private interests by definition. That’s the European brand of conservation.
In America they are instead designated for usage by members of the public and not set aside for exclusive use by anybody. Apparently you are ignorant of what is going on in the commons in this country. Thats not surprising.
While Gill fabricates definitions:
https://www.americanprogress.org/article/unprotecting-american-lands-how-trump-is-dismantling-americas-bipartisan-conservation-legacy/
Each area needs to be evaluated individually as to the need and purpose of its current designation.
Protection solely for the purpose of protection doesn’t automatically meet the standard of for the betterment of mankind. In fact it’s less of a deep understanding than the depth of an earthworm in your manicured front yard
While Gill pontificates, more sell-offs:
https://www.theguardian.com/us-news/2026/aug/28/yosemite-national-park-private-developer
Boy Willard you get your panties in a knot over practically nothing.
First the developer is interested in park access for his planned resort.
Ask yourself what the purpose of the park is. Its to give access to the treasures of the park to the public. the developer is part of the public.
I can imagine that local environmentalists who treasure the park will closely monitor the developers proposals to the park service.
The park service has said there has been no political pressure related to this project.
The previous owner of the ranch wanted to build a road on an old easement it held but lost in court in 2012 because the court deemed the easement had been abandoned and thus was no longer valid.
Since then the property sold to a developer looking to build a resort. They are not claiming a right to the old easement but instead offering the park service compensation for a new easement of only a 1/4 mile long.
Beyond that I don’t know any details so I have no opinion on it. As a proponent for public conservation whether I would support this or not would depend upon how good the deal pencils out for the park service in terms of maintenance. exchanged land, and public access to the park.
As usual you are all over it with your panties in a knot claiming somebody is trying to steal the park which is expected considering all the crazy stuff you spew around here. Having worked with federal agencies for 40 years I have little doubt they will arrive at the right decision which typically is to err on the side of caution and that has never varied no matter what party was in power.
My recommendation to you is if you have a genuine interest in this get involved in the process, learn a little bit about what is going on, and act on knowledge rather than ignorance.
But you are probably too busy with the latter to do that.
Gill sure likes to write lots of words nobody reads:
https://earthjustice.org/press/2026/trump-administration-illegally-attacks-bears-ears-and-grand-staircase-escalante-national-monuments
Troglodytes’ vision of capitalism is when everybody pays to get multi-billionaires richer.
Tinkerbell thinks it is OK as long as you use NGOs to do it.
Troglodyte is OK with getting fleeced:
https://www.forbes.com/sites/alanohnsman/2026/08/17/the-cost-of-doge-americas-environmental-intelligence-is-going-stale/
As long as his Dear Leader is happy, he will vouch for Him.
Willard makes sweeping claim:
Troglodytes’ vision of capitalism is when everybody pays to get multi-billionaires richer.
Which billionaires are getting richer over the Bears Ears and the Grand staircase escalante?
Or are you just parroting what yo daddy told you.
I appreciate conservation and believe the best way to accomplish it is to identify who benefits and how that benefit honors sustainability.
When you work with the states and the citizens most effected by federal regulations you get better lasting sustainability and a net benefit for the local communities. Trump acted on those two issues at the behest of the Utah governor and the Utah legislature along with the Utah congressional delegations.
Seems to be a very popular move for those most effected. Perhaps Willard will be willing to disclose his special interest in all this.
Due to El Niño, there is a very high probability of heavy snowfall starting in the fall in the Rocky Mountains and the Sierra Nevada.
Oh boy, good skiing!
SOLAR MINIMUM UPDATE
The full extent of the deaths and damage caused by the enormous flash flood that swept down a river valley in Nepal and Tibet today won’t be clear for weeks. But initial analyses of satellite images and seismic data suggest that the collapse of a high glacier caused the disaster.
“There’s a glacier that rolls over a cliff at about 5200 metres,” says Dan Shugar at the University of Calgary in Canada. “It’s just like a perfect straight line where it snapped off and dropped over a kilometre vertically to the valley bottom.”
This collapse could be a result of global heating. “It’s not that much of a stretch to think, yes, we’re seeing one terrible ramification of human-caused climate change,” he says.
https://www.newscientist.com/article/2586497-a-glacier-collapse-is-most-likely-cause-of-the-nepal-disaster/
Oh boy, good skiing!
Nothing to do with the fact that glaciers flow down hill then, and sheer off when not supported.who writes this schoolboy rubbish?
I’m sure it made sense when you thought about writing this, Ian.
Got any glaciers in the UK to tell us about?
I’ll take that as a don’t know,why did you post something that is a normal event? a glacier that probably did not exist before the Neo Glacial,the silly made up term global heating is red flag, no scientist of any worth uses that term,we are apt to believe those we do not know and have never met, because they have not yet deceived us,Samuel Johnson.
Are you trying to suggest you know stuff other people just by saying stuff, Ian?
I’m not sure about glaciers in the Newscorp sphere, but elsewhere we know that the Himalayas are melting, which makes mountainsides slipperier. Which makes Nepal is a hotspot for climate disasters.
You can always recall that the Antarctica was ice-free more than it was not, after which I will recall that CO2 was higher than currently.
Does not hold a shadow to natural events such as the 8.2kya event that was apparently large enough to create massive global cooling.
This one is probably fairly common every ~900 years. People living in the path has no doubt increased exponentially.
https://co2coalition.org/facts/temperatures-have-changed-for-800000-years-it-wasnt-us/
Our Ivy Leaguer’s assistant chimes in:
“The 8.2-kiloyear event was a rapid drop in global temperatures”
Oups!
Willard says:
August 27, 2026 at 4:25 PM
Our Ivy Leaguer’s assistant chimes in:
“The 8.2-kiloyear event was a rapid drop in global temperatures”
Oups!
—————
Oops is right. Obviously you didn’t look at the chart.
The 8.2kya event is suspected to have been caused by a release of north american glacial lakes, followed by a rebound effect that possibly suppressed deep water upwelling via a thick cap of freshwater.
It is much too early to make any competent analysis. I have seen some analysis by professional geologists who claim it was a simple landslide that registered as an earthquake. The glacier above may or may not have contributed.
None of this will stop climate scientists from doing what they are paid to do which is to blame everything on climate change. There is clear evidence of a landslide. It is not clear if the glacier had anything to do with it.
Just for fun, there are several media reports that the flood moved at 120 mph (88 ft/sec or 28 m/Sec). This is based on the claim that it moved 14 miles in 6 minutes. If they had consulted with a competent person, they would know how really foolish that is.
Just for the fun of it, I saw an assistant report that the USGS initially recorded a 4.4-magnitude earthquake, but later determined that the landslide itself had caused a seismic signal.
None of that will stop “but the press” daily by our contrarians.
A glacial lake burst its banks after an earthquake.
As I stated above, it is still too early to make any conclusions. Here is the latest from USGS which is probably as close to an objective analysis as is available.
https://www.usgs.gov/programs/landslide-hazards/science/2026-nepal-debris-avalanche-and-flash-flood
Findings (as of 8/27/26):
The slope failure involving a glacier generated energy equivalent to a M5.2 earthquake. The debris flow and flood travelled approximately 100 kilometers (approximately 62 miles). A second seismic event was recorded approximately 3-hours later, generating energy equivalent to a M4.2 earthquake.
At this time, it is unclear if the initial slope failure was a landslide incorporating part of a glacier or a glacial collapse. A glacial collapse is where a portion of a glacier breaks off, and the debris rapidly moves downslope. The glacial debris contained water and ice that rapidly melted, picking up more material and water as it flowed downslope in the existing stream and river channels, creating a fast-moving, far-traveled landslide and flood laden with boulders and other rubble.
[“from USGS which is probably as close to an objective analysis as is available.”]
That is quite an endorsement of the USGS.
Out of curiosity, does that confidence extend to their broader conclusions on climate change?:
[“As the global climate changes, it threatens the safety and well-being of our communities, our economy, and our natural heritage.”]
From here: https://www.usgs.gov/science/science-explorer/climate
There you have it folks. Anything for an argument. There has to be something we can argue about.
Why is it that the dumbest people with nothing to add to the topic, are the first ones trying to start an argument?
In other news, new photos seem to show that there may have been 2 separate events. Most importantly, the extent of the ice debris does not extend beyond the landslide front.
It is still too early to tell, but it seems most likely to be strictly a landslide event. The influence of melting is not clear.
I was merely curious and asked you a question about your stance. I had no intention of starting an argument.
I didn’t realize that asking a question was apparently enough to qualify as one.
I will try to remember that going forward.
Thanks for the clarification.
Our pet assistant also reports:
https://www.forbes.com/sites/davidrvetter/2026/08/27/nepal-flash-flood-experts-say-climate-change-primed-disaster/
Too many people in the US. I miss the rural America of my youth in the 1960s. There was plenty of water and other resources back then and a lot less traffic!
Dr. Spencer is using tree ring reconstructions in one of his figures.
It’s worth bringing up, in that case, work published by others who also use tree ring chronologies to estimate soil moisture (different from Dr. Spencer’s metric of streamflow, but still a hydrological metric in the Southwest nonetheless):
https://www.science.org/doi/10.1126/science.aaz9600
Concludes the present US Southwest drought was the 2nd worst since 800 CE, being exceeded only by another drought in the late 1500s.
And also concludes, based on models, that GW is responsible for ~46% of the anomaly. W/out it, the drought would still be a drought but wouldn’t rank amongst the worst in the record.
Willard’s comment from earlier, I think, deserves a special mention:
https://www.drroyspencer.com/2026/08/record-low-lake-mead-millennium-drought-or-inevitable-result-of-demand-exceeding-supply/#comment-1751937
Yes, I agree. Very peculiar indeed.
More information.
https://m.youtube.com/watch?v=F8nMLkCPf4A
“So you are not that bright yourself. The only time that works is in court room dramas or with people who are suffering from Dunning–Kruger on being able to argue logically, like yourself in this case.”
LMAO, Anon thinks Entropic man has Dunning Kruger?!!
That is some spectacularly poor self-awareness. Is this Tim S. hiding behind another nym?
How can one accuse another of epistemic overconfidence while putting their own vErY ScIenTiFiC opinions above those of the people who actually study climate science?
The clown car of deniers here are the ones displaying the very Dunning Kruger behavior they are accusing others of.
They are the ones dismissing climate scientists, routinely claiming that the entire scientific community is either incompetent or corrupt.
I suppose I could ask if this is Nate “hiding behind another nym?” [sic] It is rather obvious that you not Nate. You are at least making some sense. The bigger question is whether stereotypes have any value? It turns out that I have competently and forcefully called out the various science deniers with comments that do not require sarcasm. I am also one of the only, if not the only person, on this site who has correctly described the greenhouse effect. Intelligent people will understand the difference between science denial, skepticism based on sound science, and criticism of media and political hype. Are you intelligent, or just as dumb as someone else thinks you are?
Once more, QAnon wrote his mix of lies and insults against me without any reason else than some kind of pathological hatred typical for persons with extremely far-right wing attitudes:
” Bindy Goebells,
[1] Still yapping that the earth’s orbit is roughly circular.
Such a simplistic way of thinking is truly childish to the extreme. You and dullard certainly are trying to compete for the biggest simpleton.
[2] Swapping watts per squared meter to peta watts is so typical of a supporter of democratic socialist.
Yes you mention a big number but it is as a distraction that you understand little.
Another big number is the tens of millions that socialism has killed in the last 150 years.
[3] Killed by your heros like pol pot, Stalin, Hitler and mao.
Even the Dullard indicated that he knew that the sun is not the exact center of the earth’s orbit.
[4] Whereas you argue against gravity. ”
*
To [1]
Nowhere did I ever suppose that the earth’s orbit is roughly circular.
No idea whether or not QAnon ever REALLY anything related to the motions of celestial bodies.
I read much of Kepler, Newton, and finally the genial woman Gabrielle Émilie Le Tonnelier de Breteuil, Marquise du Châtelet, who not only completely translated Newton’s Principia, but also extended this work with analytical geometry, proving by the way that she fully had understood Euler’s treatise ‘Mechanics, or the Science of Motion Explained Analytically’,in which Euler took Newton’s physical laws of motion and translated them into the language of Leibnizian differential calculus.
*
To [4]
Nowhere did I ever argue against gravity! What a stupid, brainless claim.
The contrary is the case: the concept of gravity is misused by those claiming that only gravity can explain our Moon’s motion.
**
To [2]
No idea why this derivation is typical of a ‘supporter of democratic socialist’.
But in my opinion, it’s much preferable to support such peaple than to agree to the neo-fascist ideas of far-right wing antidemocratic antisocialists like QAnon.
*
To [3]
My heroes?
Stalin, Mao Zedong, and Pol Pot—alongside Hitler, Mussolini, Franco, Pinochet, Videla, Milošević, and so on — are among the figures I despise the MOST.
***
At times, this pathological, subcutaneous aggressive hatred — typical of individuals with extreme right-wing views — manifests in actions as extreme as their mindset: namely, the killing of people.
We here in Germoney won’t soon forget the NSU…
The National Socialist Underground (NSU) was a neo-Nazi terrorist group in Germany, formed around 1999 with the aim of murdering people with a migrant background out of racist and xenophobic motives.
The three main perpetrators murdered between 2000 and 2007 nine migrants and a police officer, and committed 43 attempted murders, three bombings (Nuremberg 1999; Cologne 2001 and 2004), and 15 robberies.
**
And the very best is that QAnon is dumb and ignorant enough to link such people to ‘socialism’ because of the name they chose – exactly as he is dumb and ignorant enough to link the Nazis around Hitler, Himmler and… Goebbels to ‘socialism’ just because Hilter was in the 1920s clever enough to name his just-born party the ‘Nationalsozialistische Demokratische Arbeiterpartei Deutschlands’.
Dumber than QAnon you simply die.
I now come back to this discussion about the energy required to warm the Earth by 1°C (1 Kelvin) over a period of 100 years.
There are two standard methods in physics for calculating this amount of energy. Both yield an almost identical result.
[ Notabene: I hope the 10^xx expressions will be correctly reproduced!]
*
1. Thermodynamic approach (ocean heat capacity)
Since the oceans absorb over 90% of global warming, their mass determines the energy requirement.
• Mass of the oceans (m): approx. 1.4 × 10²¹ kg
• Specific heat capacity of water (c): approx. 4,184 J/(kg·K)
• Time period (dt): 100 years = approx. 3.156 × 10⁹ seconds
• Formula: Energy (dQ) = m · c · dT
• Calculation: 1.4 × 10²¹ kg · 4,184 J/(kg·K) · 1 K = approx. 5.86 × 10²⁴ Joules
• Required continuous power output: P = dQ / dt = 5.86 × 10²⁴ J / 3.156 × 10⁹ s = approx. 1,860 terawatts
2. Radiative physics approach (Stefan-Boltzmann law)
This approach calculates the continuous power required to maintain the system at a level 1°C higher, counteracting the increased heat radiation into space.
• Stefan-Boltzmann constant (sigma): approx. 5.67 × 10⁻⁸ W/(m²·K⁴)
• Effective emission temperature (T): approx. 255 K
• Earth’s surface area (A): approx. 5.1 × 10¹⁴ m²
• Formula for radiative forcing: dF = 4 · sigma · T³ · dT
• Calculation per m²: 4 · (5.67 × 10⁻⁸) · 255³ · 1 K = approx. 3.76 W/m²
• Required total power: P_total = 3.76 W/m² · 5.1 × 10¹⁴ m² = approx. 1,920 terawatts
*
This even a lot more than what I had read somewhere (1 petawatt, i.e. 1,000 terawatts).
This 1.9 petawatt figure is 1.1% of the 174 petawatts delivered on average since 100 years at any moment at Earth’s top of atmosphere.
Nowhere will you find any trustworthy source claiming that solar irradiance would have increased by that amount during the last century.
Neither by an increase of solar activity, let alone by a constantly modified distance between Sun and Earth due to planetary constellations – except in the sick minds of a few stubborn 360-degree refuseniks.
Bindidon,
“Effective emission temperature (T): approx. 255 K”
????
Vournas
A person like you who denies that the Earth is cooling since the last Holocene Optimum very certainly will deny anything related to 255 K.
Nevertheless, I propose that you ask Google’s AI corner the following:
Which exactly are the devices measuring 255 K at TOA?
*
Furthermore, there is this document:
https://atmos.washington.edu/academics/classes/2001Q4/211/notes_greenhouse.html
*
240 W/m² are computed out of the measurements made at TOA by several devices (by using the same theoretical background as for O2 emissions out of which atmospheric temperatures are derived e.g. by… UAH).
*
Maybe that unlike 360 degree deniers like Clint R you at least carefully read the documents, instead of writing the same waste as he endlessly does on the blog.
Bindidon,
“This effective temperature of 255 K is the temperature the Earth’s Surface would have if it didn’t have an atmosphere. It would be awfully cold! In reality, the Earth’s surface temperature is closer to 288 K (15 °C, 59 °F). This difference of 33 K is the magnitude of the greenhouse effect.”
Bindidon. 288 K – 255 K = 33 K is not, because the difference is 33 °C.
Also, you are not justified to subtract Te=255K from Tav=288K.
Measure average t-re of a human body. Calculate human body’s Te. Subtract. Does a human exhibit a greenhouse effect?
–
https://www.cristos-vournas.com
Vournas
Don’t care about the link
https://atmos.washington.edu/academics/classes/2001Q4/211/notes_greenhouse.html
It was my mistake to mention it.
I’m not talking about 288 K versus 255 K. No interest in this fruitless discussion.
*
I’m talking about the infrared radiation (measured from satellites orbiting above Earth’s atmosphere by Fourier-transform spectrographs), out of which a global average radiant flux density of 240 W/m² is computed, what corresponds to a temperature of 255 K.
Do you want to reinvent the physics on which also UAH’s temperature computations are based?
Bindidon,
According to ASHRAE the average human body exhibits ~100W/m2
When applying σ = 5.67 × 10⁻⁸ W/(m²·K⁴), the human body Te calculates Te = 205K which is -68°C.
Are you going to challenge the ASHRAE basical data?
–
https://www.cristos-vournas.com
A lot of hand waving there. That’s OK as long as it has some basis. You used the entire surface area of the Earth. Then assumed most of the heat capacity (90%) is in the oceans. Also, you used 255K. That’s a fictitious number.
Bindidon,
Stefan-Boltzmann constant (sigma): approx. 5.67 × 10⁻⁸ W/(m²·K⁴)
???????????????
Vournas
Why are you unable to contradict instead of posting your idiotic ???????????????
Bindidon, what else to contradict…
When applying σ = 5.67 × 10⁻⁸ W/(m²·K⁴), the human body’s Te calculates as low as: Te = 205K which is -68°C.
–
https://www.cristos-vournas.com
What name will Lake Huron be given?
The United States cannot unilaterally rename Lake Ontario, as it is a shared, binational body of water managed jointly by the U.S. and Canada under treaties and international agreements.
Even for purely domestic purposes, an official name change requires approval from the U.S. Board on Geographic Names, not merely a presidential declaration.
The attempt to rename Lake Ontario “Lake America” — much like the earlier attempt to rename the Gulf of Mexico “Gulf of America” — is an alarming sign of increasing senility and raises corresponding doubts about the ability to lead a country like the USA.
Even Google Maps reverted the name (albeit with the addition of “Gulf of America”, likely to avoid upsetting the MAGAmaniac Trumpistas).
Bindy Goebells
Any country can name a geographical place what they want. There isn’t just one name for every place. Just typically arrogant of you, despite having lost ww2, the rest of the world doesn’t refer to Germany as the fatherland.
The Falklands, the English channel, have dual names.
The Rio Grande is a shared binational body of water. Your assertion is falling apart Goebels.
The two filthiest of all posters just were unable to contradict me – only insults and nonsense as usual.
*
By the way, not Germany did lose WW II: it was the Nazi regime which lasted from 1933 till 1945.
US and Brit people are today still proud for allegedly having saved Europe from the Nazi dictature; it was, however, mainly destroyed by the USSR which lost about 27 million people from 1941 till 1945 (14 to 19 million civilians, 8.7 to 11.5 million military personnel).
*
I don’t like Russia at all – especially since Putin is at top of it! But without Russia’s extraordinary resistance in Staingrad, the Nazis would have dominated us all worldwide.
*
And while it is true that ‘la Manche’ and ‘the Channel’ are dual names, the UK denomination ‘Falkland Islands’ and the Argentinian ‘Islas Malvinas’ aren’t at all.
A tropical storm is approaching the Caribbean.
Increase in energy needed for each 1°C rise in temperature
Bindion states: 3.76 W/m²
Entropic Man states: 3.86W/m^2
Meh, close enough agreement. Hopefully I will have time later to respond to both bindion & entropic.
Excellent.
Discussing science is much more fun than swapping insults.
More relevant information.
https://spacedaily.com/t-2025-ocean-heat-23-zettajoules-ninth-record/
Sorry Ent, but you can’t “discuss science” until you learn the difference between “flux”, “energy”, and “heat”. Learn those concepts and then you can teach your cult….
Entropic man
Of much bigger interest than how near are our numbers (3.76 vs. 3.86 W/m²) – both based on radiative aspects – is the extreme near of the computations based on Thermodynamics and these radiative aspects: 1.96 vs. 1.92 PW.
That’s a difference of 3%…
I doubt nevertheless that a 360 degree denier a la Clint R are able to understand why this analogy matters so much, as he actually still did not grasp that radiant flux density is a power per ara, and that hence multiplying it by time gives energy per area…
Bindi is my most garrulous, rambling stalker. He makes Willard and the Fstudent look short-winded.
This has all been explained before, but the cult kids can’t learn. So just for newcomers, here it is again:
https://www.drroyspencer.com/2026/03/uah-v6-1-global-temperature-update-for-february-2026-0-39-deg-c/#comment-1737516
What fascinates me is how everything interconnects. I’ve tried over the to cross check what I read in the literature using my own calculations. They agree.
You can start with changes in incoming radiation and calculate through to expected changes in ocean heat content, temperature and sea level rise. Simalarly you can start with the change in global temperature and work back to the absorbed energy change. Calculate the energy change due to increased CO2 and you get the same energy change.
All these variables interact and, given one, you can calculate all the others. Finally you can compare the calculated figures with observation and get matches.
This isnt just bits of physics, it’s a whole paradigm. To falsify it you would need to reject most of modern physics and build something else entirely.
Stupidity, ignorance or delusion dont really come into it. Even a mere biologist like myself knows enough classical physics to do the calculations, as should a chemist like Stephen and whatever Anon and Clint are.
Stephen, Clint R,Anon.
If you want to convince me that the paradigm I am using ls wrong you will need to
1) demonstrate that the physics I am using does not correctly describe reality.
2) that you have an alternative paradigm that does better.
Ent, the mistake you continue to make, as do the other cult kids, is to deny reality. That’s why you ended up with passenger jets flying backward!
Learn to accept reality, stop perverting science and making everything about your political beliefs, then learn the basic physics.
You’ve got a lot of work ahead of you….
“This isnt just bits of physics, it’s a whole paradigm. To falsify it you would need to reject most of modern physics and build something else entirely.”
If it doesn’t conform to classical physics, then it’s probably wrong. I’m not sure I understand the term “modern physics?” Are you using String Theory? There is no such thing as the term “settled science.” People use that term when they have no foundation for their beliefs.
Entropic,
As usual you start with “Excellent.
Discussing science is much more fun than swapping insults. ” Then a post later back to your usual comments of “Stupidity, ignorance or delusion …..”
Bad as Bindy Goebells saying “..I never intended to forbid anyone to write even the hugest lies.” Followed by “I just recommended to ban those who insult me”
No wonder there are a number of us who see beyond you & Bindy Goebells veneer of pretending to be civil .
“Stephen, Clint R,Anon.
If you want to convince me that the paradigm I am using ls wrong you will need to
1) demonstrate that the physics I am using does not correctly describe reality.
2) that you have an alternative paradigm that does better.”
I’ve already demonstrated that the GHT is falsified. So, using radiative CO2 forcing is a non-starter. And I’ve showed that the lapse rate is derived from pressure. There is no radiative function in the lapse rate. A different theory for what is causing temperature variation? So, tell me anything in nature that doesn’t vary? Do you really think the temperature of the planet would stay at exactly 288K without fossil fuels? The Sun’s irradiance varies, the planet’s orbit varies, the other planets and moon vary, the albedo varies, ocean currents vary, etc. etc. There are so many things that could affect the planet’s temperature it is impossible to know. I don’t have to have an alternative paradigm. I only have to falsify yours. I thought you had a biology education?
Apparently, Clint R did not understand:
” Of much bigger interest than how near are our numbers (3.76 vs. 3.86 W/m²) – both based on radiative aspects – is the extreme near of the computations based on Thermodynamics and these radiative aspects: 1.96 vs. 1.92 PW. ”
*
And he still did not grasp that ‘flux’ and ‘radiant flux density’ are two completely different things.
Wrong, as usual Bindi. I understand perfectly. You’re drowning in your cult nonsense, and hoping blah-blah will save you. As Christos pointed out, the 255K-240W/m^2 is bogus for Earth. Those values come from your cult’s imaginary sphere.
That’s why I like to “keep it simple”, while you like to obfuscate, distract, and throw crap against the wall.
Got a viable model of “orbiting without spin”, yet? You’ve avoided that for years now. That should tell you something….
” Got a viable model of “orbiting without spin”, yet? ”
First show us yours, Clint R…
Now you’re implying I’ve never provided a viable model!
That’s just one more example of you avoiding reality, Bindi.
Kids these days….
Increase in energy needed for a 1°C rise in Earth’s average temperature from 288K to 289K, the Tmean Equation calculates
plus 33 W/m2, Solar flux instead of the present So = 1361 W/m2, the new one: So = 1394 W/m2.
–
https://www.cristos-vournas.com
On a global scale, the percentage of areas affected by drought has not increased for over 100 years. However, statistical studies show a long-term increase in areas affected by drought in Central Europe. This is likely related to the North Atlantic Oscillation (AMO), just as precipitation in the Pacific is linked to the Pacific Decadal Oscillation (PDO). The AMO may already be entering a negative phase.
The chart below shows even a slight decrease in the areas affected by drought on a global scale.
https://pmc.ncbi.nlm.nih.gov/articles/PMC9588423/
In your paper, the authors’ abstract states:
AED is atmospheric evaporative demand.
They explicitly explain the mechanism: greenhouse warming raises temperature and atmospheric evaporative demand; increased AED can increase evaporation from soils and water bodies, increase plant transpiration and hydraulic stress, and aggravate drought even when the precipitation deficit itself has not become more severe.
They conclude that they don’t see a robust global increase in precipitation-defined drought, but rising AED may increasingly intensify agricultural and ecological drought.
Arklady,
Still trying to push your warped world view onto the issue. Farming has increased, population has increased. In other words the demand has increased a lot . Yet you still want to blame the CO2 molecule.
Summary of what I have read and seen about the local devastation in Nepal
The entire event was triggered primarily by a massive rockfall. According to glaciologists, the process did not begin with an isolated glacier collapse or a simple landslide, but rather with a huge rockfall on a steep mountainside near the summit of Langtang Lirung (which reaches an altitude of 7,200 meters).
The massive block of rock broke away on August 26, 2026, at 8:37 a.m. local time; as it fell, it dragged a hanging glacier—located at an altitude of around 5,200 meters—down with it in a near-vertical drop.
Due to the steep gradient, the avalanche accelerated rapidly.
Because the detached glacier became trapped between the solid rock face and the plummeting rock mass during the fall, the intense frictional heat generated caused it to melt almost completely in a very short time.
The initial avalanche reached peak speeds of over 190 km/h during the first 20 to 22 kilometers of its path.
According to analyses by the International Centre for Integrated Mountain Development (ICIMOD), the millions of cubic meters of falling ice and rock briefly dammed a river (the Lhende River).
When this natural dam burst, an avalanche of mud, meltwater, and debris—several meters high—surged through the valleys at speeds that remained above 130 km/h.
You can view the path of this moving mass here:
https://www.zdfheute.de/panorama/nepal-sturzflut-ablauf-ausloeser-100.html
According to some sources, the danger in the immediate region has not yet passed, as the massive impact of the rock mass has left certain glacial lakes increasingly vulnerable and unstable.
The Indian Plate continues to push against the Eurasian Plate.
The Himalayas are still rising by more than 1 cm per year as India continues to move northwards into Asia, which explains the occurrence of shallow focus earthquakes in the region today.
Any Chance China will take responsibility for destabilizing the region ?
Ian,
There is a time and place for pointing the finger. Perhaps while people are still being rescued isn’t the time.
I am going to be kind, but honest. This is total crap. People should wait before they publish or distribute this kind of fake news.
In a court room, jurors are told that if they believe a witness has lied, they can disregard their entire testimony. In science, when a very obvious error is found, one can assume that the rest of the content is also incompetent.
There is a very easy calculation to show that falling ice does not melt in any significant amount. Any high school science student can do this. The First Law of Thermodynamics cannot be violated for any purpose including climate hype.
Yet the Chinese government’s own geologists warned against any heavy construction in the area,but they were ignored,
I currently lack the time needed for a precise reaction to this superficial, condescending stuff, 100% typical for the Big Reveal blowhard.
Instead of boasting and posturing with cheap insults, you could try being honest. People might start to actually respect you and your content which is clearly not competent in this case.
Just for fun, show us your calculations that ice melts from friction while sliding down a mountain slope. As I stated above, there is a very simple way to make those calculations based on the available potential energy and the latent heat of fusion. Good luck!
You may need a Facebook account to see this. It is the proof that the Tibet flood was caused by a landslide and not a Glacial Lake Outburst Flood (GLOF).
https://www.facebook.com/mirvictor/posts/latest-condition-of-source-area-of-massive-floodphotos-guoxiong-zheng/10237369972282658/
Droughts have always been a part of human history. Here’s how India coped with droughts in the 9th century.
https://youtu.be/UjubH9b4BvE
I suggested building large underground reservoirs in California a long time ago. The goal is to reduce evaporation.
Bindy & entropic
Below are 2 series both headings are date, distance of earth to sun km, watts per squared meter
1999-03-21 , 148990607 , 1372.16
2000-03-21 , 149026946 , 1371.49
2001-03-21 , 149020140 , 1371.61
2002-03-21 , 149008149 , 1371.83
2003-03-21 , 148993910 , 1372.10
2004-03-21 , 149025458 , 1371.51
2005-03-21 , 149018529 , 1371.64
2006-03-21 , 149004746 , 1371.90
2007-03-21 , 148992855 , 1372.11
2008-03-21 , 149026235 , 1371.50
2009-03-21 , 149014358 , 1371.72
2010-03-21 , 149000251 , 1371.98
2011-03-21 , 148987342 , 1372.22
2012-03-21 , 149022263 , 1371.57
2013-03-21 , 149017168 , 1371.67
2014-03-21 , 149002108 , 1371.94
2015-03-21 , 148989327 , 1372.18
2016-03-21 , 149023269 , 1371.55
2017-03-21 , 149013811 , 1371.73
2018-03-21 , 149002432 , 1371.94
2019-03-21 , 148988371 , 1372.20
2020-03-21 , 149019205 , 1371.63
2021-03-21 , 149009260 , 1371.81
2022-03-21 , 148991716 , 1372.14
2023-03-21 , 148981019 , 1372.33
2024-03-21 , 149018177 , 1371.65
2025-03-21 , 149010928 , 1371.78
1900-03-21 , 149067696 , 1370.74
1910-03-21 , 149042318 , 1371.20
1920-03-21 , 149060499 , 1370.87
1930-03-21 , 149037832 , 1371.29
1940-03-21 , 149045192 , 1371.15
1950-03-21 , 149023802 , 1371.54
1960-03-21 , 149045173 , 1371.15
1970-03-21 , 149021346 , 1371.59
1980-03-21 , 149035933 , 1371.32
1990-03-21 , 149010388 , 1371.79
2000-03-21 , 149026946 , 1371.49
2010-03-21 , 149000251 , 1371.98
2020-03-21 , 149019205 , 1371.63
2040-03-21 , 149013984 , 1371.73
2050-03-21 , 148988316 , 1372.20
2060-03-21 , 149005771 , 1371.88
2070-03-21 , 148973431 , 1372.47
2080-03-21 , 148996625 , 1372.05
2090-03-21 , 148974035 , 1372.46
Distance are from NASA, watts are calculated from 1au and the so called solar constant.
2 series. The yearly shows the flucation each year which is a lot of energy. Whereas the 10 year shows the longer term drift over past and future. Go back to the 1600s and the data is even more pronounced.
Different dates will have different results, obviously. Some dates have the opposite relationship over time.
Now as both of you have repeatedly stated that there is no change perhaps you want to argue with NASA. Remember, this NASA team’s data is used for satellite, voyager, and proves.
And to reiterate ad nausea I have never claimed that climate change is purely orbital drift. If anything it’s being ignored by the hissy fit brigade that only blame capitalism & CO2
Anyhow, enjoy plotting the data.
Anon for a reason
You can see the leap year changes in your data on Solar constant for the same days. It slowly creeps up after a leap year and is reset to a lower value after the leap year till the next one.
Norman,
Interesting point you made. That why I include all the information for people to be able to make their own minds up:
So just for the leap years.
Date,……..distance….watts sqm
2000-03-21 , 149026946 , 1371.49
2004-03-21 , 149025458 , 1371.51
2008-03-21 , 149026235 , 1371.50
2012-03-21 , 149022263 , 1371.57
2016-03-21 , 149023269 , 1371.55
2020-03-21 , 149019205 , 1371.63
2024-03-21 , 149018177 , 1371.65
There is still variability and a drift
Personally I think the range is too small for any sensible analysis.
Interesting. I did a quick back-of-the-envelope calculation and got the following.
For the recent data the mean is about 1371.91 with 2SD 0.42.
That would produce random changes in annual temperature up to 0.42/3.8 =0.26C either side of the mean.
Since the variation probably follows a normal distribution the standard eror, the average deviation from the mean would be about 0.13C.
I think you might have something here.
Look up any of the global average temperature graphs such as GISS or Berkeley Earth. You will see that the short term variation is about +/-0.1C either side of the mean,excluding extreme variations such as El Nino.
You’ve identified that orbital varition might be a contributor to the short term noisiness in the data.
The difference between the first and last decadal values is
1372.46 – 1370.74 = 1.72W/M^2.
That would produce a temperature change of 1.72/3.8 = 0.45C.
That is 1/3 of the 1.4C seen since 1880.
Entropic, the numbers being supplied are solar irradiance / flux at one particular date, March 21st, not annual changes.
As such, I don’t think you can take year to year to scatter in those March 21st values and predict year to year global temperature changes.
Earth’s orbit is continuously carrying it nearer to and farther from the Sun. As Anon said, different dates will have different results.
Entropic man
The radiant flux densities for the solar irradiance in the post above are all wrong: you can’t compute it simply on the basis of the distance between Sun and Earth, that’s sheer nonsense.
You have to take the TSI values measured at TOA, resp. those computed for the pre-sat period by people who know how to do the job.
Entropic Man,
Normal distribution is not applicable in the case. As it is not random sampling.
Like you said it does have an interesting aspect to it. So as the orbit does fluctuate and drift around, spring may appear to get early, as a biologist you may have heard news about that.
We also have other times of where autumn comes early. Possibly for the same reason.
One thing I didn’t include, and as a biologist you might want to ponder on, is the declination drifts around as well. So more sunlight hours will fluctuate as well. Would that have an affect on plant growth, or how good a season is for the farmers? Again not the whole causation but part.
Milankovitch had the right idea, just didn’t have NASA and their supercomputers to refine his idea. Might explain why both side can find evidence to support their own views.
Anyhow like I said before, never claimed it was the whole answer, just a part.
Bindy
Why are you do against the Inverse Square Law? That has been proven beyond doubt. The distances are from NASA and do get verified to an incredible level of accuracy and precision.
What is simpler??
distances measured & inverse square law
Vs
CO2 + proxy data + politics + clouds + computer models + heat island effects + albedo changes + water vapour + activism + global greening + snow + particulate pollution changing + number of elephants producing methane ( in quantity!) +
Ever heard of Occam, scruffy dude who struggled with shaving.
Good to see the debate.
.
I took Anon’s values at face value and calculated their effect.
If his data is.correct then the orbital effect on temperature is too small to account for the observed warming.
If his data is incorrect then the he’s no case at all.
Either way we can cross short term orbital variation off the list of causes for global warming.
Entropic,
I calculate a much smaller T increase. Maybe you missed a factor of 4. How did you do it?
1. ” Why are you [do] against the Inverse Square Law? ”
*
This is a blatant lie. I very probably used that law many many times more often than the poster Anon (I omit the Q for a while though it still has its Goebbelsian reasons) himself did.
*
He is so stubborn, so opinionated that he didn’t even read my reply containing the correct solar irradiance, clearly indicating that the distance modulated by the inverse square law alone are by no means can be enough to compute it:
” Irradiance in space is a function of distance from the Sun, the solar cycle, and cross-cycle changes. ”
*
To reduce the irradiance computation on the variations around the AU: that’s the same ‘Keep It Simple, Stupid!’ rule, invoked ad nauseam by those who deny the lunar spin just because ‘since the Moon always shows us the same face, it thus can’t rotate’ (and by the way deliberately ignore that their hero Isaac Newton wrote the contrary).
*
2. ” What is simpler??
distances measured & inverse square law
Vs
CO2 + proxy data + politics + clouds + computer models + heat island effects + albedo changes + water vapour + activism + global greening + snow + particulate pollution changing + number of elephants producing methane ( in quantity!) +
Ever heard of Occam, scruffy dude who struggled with shaving. ”
That is no longer stubbornness: it’s now a mix of polemic and paranoia.
How is it possible to be so stupid to link active cavity electrical substitution radiometers on satellites, rockets, and the space shuttle, recording total and spectral irradiance, to all what you sourself denigrate?
Sorry, that’s too much for me. It is a global insult to many people doing real work using real instruments, exactly as does the UAH team.
It’s the same kind of insult as when Clint R insults not only Cassini as an astrologer, but all astronomers since then.
*
And… yes: I heard of Occam.
Nate
Back of the same envelope.
Remember the IPCC estimate that it takes an extra 4W^m^2 to raise global temperature 1C. I used that.
In retrospect I neglected albedo(30%) and 4 :-).
That would make my estimates about six times too large.
That would make the contribution to short term variation +/- 0.04C and the long term contribution to warming 0.07C.
Entropic & child nate,
Amusing as ever. Some hard numbers that you brush off as too small. That’s after you round up and fudge your numbers on very subjective areas, like albedo and the gross over simplification of energy needed to raise the temperature.
In Nates case that’s because he is a child, in your case Entropic you turn your back on hard science and opt for the subjective. In Bindy Goebells case he is just foaming at the mouth with his TDS and anti-NASA stance. my guess he is still upset about Germany not winning ww1 and WW2.
So the biologist Entropic wants to ignore day light hours and orbital warming. Wonder how the Sun’s output has fluctuated at the same time. Probably less extreme that the IPCC scenarios.
Let’s finally look at a comparison of
– QAnon’s imaginary TSI computed out the Sun-Earth distance to which the Inverse Square Law was applied, and
– the real TSI obtained out of measurements made at TOA on satellite-borne devices (Fourier-transform spectrometers, pyrheliometers, pyranometers), which are transformed in radiative density fluxes – in the same way as are temperatures derived out of O2’s emissions in the 60 GHz range:
https://drive.google.com/file/d/1ei2_WMQUVjhn0K83TBIUHrkZgGfVu0QJ/view
To have a good comparison, the two series were displayed relative to their respective minima, and to account for TSI@TOA’s higher vertical extent it was scaled down.
No one can overlook that TSI is by no means a function of the Sun-Earth distance only, but of the current solar cycle as well: we can see the peaks of SC 23, 24 and 25, and the swiches 23/24 and 24/25.
*
Here are the monthly Sunspot Number (SSN) values from the Belgian SILSO for March from 1999 till 2025:
1999 103.5
2000 217.7
2001 165.8
2002 147.1
2003 100.7
2004 74.6
2005 43.5
2006 5.7
2007 18.4
2008 2.9
2009 0.6
2010 24.0
2011 78.6
2012 86.6
2013 78.3
2014 128.7
2015 54.5
2016 54.1
2017 17.7
2018 2.5
2019 9.4
2020 1.5
2021 17.2
2022 78.6
2023 123.3
2024 103.7
2025 134.2
Now we can compare TSI@TOA with the SSN:
https://drive.google.com/file/d/1dyifBV9Ix4GeSybYjANgTv36HmN1FuJT/view
Here, the series exhibit widely varying value ranges and were therefore represented by scaling them to their respective maxima, similar to:
https://drive.google.com/file/d/1YanVTQpbOvSxIBkP11-W212twIG_wzZY/view
” In Bindy Goebells case he is just foaming at the mouth with his TDS and anti-NASA stance. my guess he is still upset about Germany not winning ww1 and WW2. ”
*
What a brainless stuff…
1. I’m not a German, just living in Germany since decades with a German woman who like me hates not only Nazis but also all Neo-Nazis and in addition 100% despise all far-right wing people like e.g. QAnon who can’t stop filthily insulting persons disagreeing with their utter antiscience.
*
2. Anti-NASA? Just because I debunked QAnon’s absolutely stupid orbital warming blah blah?
Maybe the pathologically deranged QAnon confounds me with Robertson.
Here is something from NASA which he {sarc} 100% certainly will much appreciate {/sarc}:
https://science.nasa.gov/science-research/earth-science/why-milankovitch-orbital-cycles-cant-explain-earths-current-warming/
*
But like Clint R will never stop claiming that Cassini and all following astronomers are astrologers and that the Moon does not rotate about its polar axis, QAnon will continue to waste our time with his ridiculous idea of orbital warming – based on correct but insufficient orbital data from NASA.
BG,
The Nazis weren’t right wing. They were left.
“No, not in any meaningful way, and certainly not after 1934.”
https://www.britannica.com/story/were-the-nazis-socialists
Anon for a reason.
Nate and I both used your data to calculate very small temperature effects based on your data, which falsified your implication that short term orbital changes affect climate.
I note that you have not given any temperature calculations yourself. When can we expect your temperature figures?
Friedrich Hayek disagrees with Britanica. Read “The Road to Serfdom.” You might learn something.
https://tinyurl.com/2tadtz65
“Amusing as ever. Some hard numbers that you brush off as too small.”
Very funny. The calculation produces hard numbers from your numbers. They are quite small.
So it seems you brush them off. And toss insults at us.
Historians disagree with Hayek. Read just about any real history book, not the crap from D’Souza or worse.
Koch also disagrees with Hayek:
https://www.thenation.com/article/archive/charles-koch-friedrich-hayek-use-social-security/
Nate,
You have to admit, it cannot be easy watching the pet theory you have built your AGW skepticism around go down in flames right before your eyes, especially when it’s being dismantled by people you despise!
Sheeesh… that is rough.
Pretty funny from our perspective though.
Leftist historians disagree with Hayek.
Friedrich Hayek:
Friedrich Hayek argued in his 1944 book The Road to Serfdom that Nazism was not a capitalist backlash, but a form of collectivism rooted in state economic planning and socialism.
Core Arguments
Shared Roots: Hayek maintained that Nazism, fascism, and Soviet communism shared the same fundamental origins in collectivism and centralized government control.”Right Socialism”: He labeled the Nazi regime a form of “right socialism,” arguing it had more in common with left-wing socialism than with free-market capitalism.
The Danger of Planning: He warned that moving away from individualism and classical liberalism toward state-controlled economic planning inevitably destroys personal freedom and leads to totalitarianism.
Destruction of Truth: Hayek analyzed how totalitarian regimes use widespread propaganda, censorship, and the complete subordination of public thought to the collective to maintain absolute power.
WikipediaThe Road to Serfdom – WikipediaThe Road to Serfdom is a book by the Austrian-British economist and philosopher Friedrich Hayek. In the book, Hayek “[warns] of th…WordPress.comHayek on the Nazis | Gedanken zur Geschichte18 May 2014 — Hayek on the Nazis * The “moral” state, i.e. a state which uses institutions which imposes on its members a set of moral standards.
Step aside, Trogodyte discovered AI:
https://www.theholocaustexplained.org/the-nazi-rise-to-power/the-nazi-rise-to-power/the-role-of-the-conservative-elite/
Stephen,
Hayek worked for Pinochet, and defended his right wing dictatorship.
I have lots of other things to do, but if I don’t reply you sure will invent something.
*
Your radiant flux density calculation based on Earth’s distance to Sun doen’t make sense.
Here is the Solar irradiance (TSI) on March 21 for the years 1999-2025:
Year | TSI Value on March 21 (W/m²) | Cycle | Phase
1999 1361.38 23 (Rising Phase)
2000 1361.73 23 Peak (Maximum)
2001 1361.64 23 Peak (Maximum)
2002 1362.08 23 (Declining Phase)
2003 1361.34 23 (Declining Phase)
2004 1361.12 23 (Declining Phase)
2005 1360.91 23 (Declining Phase)
2006 1360.77 23 (Approaching Minimum)
2007 1360.54 23 (Minimum)
2008 1360.48 23/24 (Minimum)
2009 1360.42 24 (Deep Minimum)
2010 1360.61 24 (Rising Phase)
2011 1360.74 24 (Rising Phase)
2012 1361.21 24 (Rising Phase)
2013 1361.14 24 Peak (Maximum)
2014 1361.41 24 Peak (Maximum)
2015 1361.39 24 (Declining Phase)
2016 1361.02 24 (Declining Phase)
2017 1360.79 24 (Declining Phase)
2018 1360.58 24 (Approaching Minimum)
2019 1360.52 24 (Minimum)
2020 1360.55 24/25 (Minimum)
2021 1360.69 25 (Rising Phase)
2022 1361.18 25 (Rising Phase)
2023 1361.59 25 (Approaching Maximum)
2024 1362.15 25 Peak (Maximum)
2025 1362.33 25 Peak (Maximum)
2026 1361.94 25 (Post-Peak Status)
*
While the trend of the Sun-Earth distance you communicate for 1999-2025 is -318 km per year, the linear trend of the TSI during that period is 0.00144 W/m² per year.
In this chart, distance and TSI are shown relative to their mean (othwerwise you see 2 flat lines) and the departures are scaled by appropriate factors:
https://drive.google.com/file/d/1PiLxyIlWdsRw-WbM8P1bUyUBa5opkzNW/view
*
No idea what you exactly want to say.
August UAH results will be out in a few days. With the strong ENSO, I’m expecting much higher anomaly than July’s +0.48 ºC, possibly as high as +0.60.
This El Niño ain’t playing around!
Climate change does some crazy things. Now we have flash floods in the middle of a drought.
https://apnews.com/article/grand-canyon-flood-bright-angel-water-arizona-8e2211e04f30b637e35ab95ecb1a1626
Nah, flash floods happen every year in the Southwest during the monsoon season, July-August.
Article said nothing about Climate Change aa the cause.
Peu importe au reste du monde comment les Amerloques l’appellent depuis la décision du petit dictateur: pour nous tous, il est et restera toujours
Le Lac ONTARIO !!!
Eines von Trumps Talenten ist es, seine verweichlichten, inkompetenten Kritiker zum Jammern zu bringen.
Bindy Goebells
So can’t argue about the inverse square law and NASA so you fixate on Lake America. Btw that’s called cognitive dissonance.
USA side of the lake can be called whatever that want. It doesn’t break any international law. Btw it’s the English Channel not the channel,vthe french call it the sleeve, which is weird. But then again you don’t like the the English, with the valiant help of other nations, kicking the proverbial out of your Germany during WW2.
I anticipate that those who currently cannot get enough of their Trumping boy idol will later be among the very first turncoats to switch sides — should he fail to rig the midterm elections in his favor, such that the Republicans ultimately can’t “win” them.
The pathologically deranged, Nazi-Goebbels-fixated far-right wing UK boy doesn’t seem to have understood what I wrote in my native tongue.
I thus translate in English:
” It matters little to the rest of the world what name the Americans have given it since their little dictator’s decree: to all of us, it is — and always will be —
Lake ONTARIO !!!
*
” So can’t argue about the inverse square law… ”
Oh really? You are the one who didn’t understand what I wrote.
Look at August 31, 2026 at 11:15 AM.
*
I see also that it was a mistake to think you would manage to get rid of your Goebbelsing syndrome.
Poor guy…
” Do what I say
https://www.foxnews.com/politics/trump-on-super-pacs-i-think-theyre-the-dumbest-thing
and not what I do!
https://www.wsj.com/politics/elections/trump-aligned-group-opens-its-wallet-to-boost-darline-graham-in-south-carolina-f054410f?mod=WTRN_pos6
More hockey stick denial / conspiracy:
https://wattsupwiththat.com/2026/08/30/throwback-sunday-we-have-to-get-rid-of-the-medieval-warm-period/
Who else loves climate contrarians?
hanks, Willard!
WUWT is fun, isn’t it?
The thing about Michael Mann is that they absolutely DESPISE him, and those are the perfect threads.
Earth is warmer than the Moon because Earth rotates 29,5 times faster than the Moon, and also Earth is covered with water. Water has a very high specific heat capacity which is five (5) times higher than lunar regolith’s.
Atmosphere is thin and transparent, atmosphere doesn’t make Earth warmer than the Moon.
CO2 is a trace gas in the atmosphere. CO2 doesn’t warm anything.
–
https://www.cristos-vournas.com
According to the forecast for September 7, a hurricane bringing very heavy rainfall will reach Southern California as it moves across the western states.
Now for something completely different. Some news from the Southern Hemisphere (Australia):
“New South Wales, Victoria and Tasmania just experienced their warmest-ever winters.”
Ever is a long time Professor P.
Stephen, if I am correct, the BOM’s national temperature record for Australia goes back to 1910, so several states experiencing their warmest meteorological winter on record in more than a century is not exactly a trivial thing…
Eldrosian,
For our planet, a century is trivial. Besides, it’s nature.
I forgot to respond to this:
https://www.drroyspencer.com/2026/08/record-low-lake-mead-millennium-drought-or-inevitable-result-of-demand-exceeding-supply/#comment-1753030
Tim S has another ego trip:
“It turns out that I have competently and forcefully called out the various science deniers with comments that do not require sarcasm. I am also one of the only, if not the only person, on this site who has correctly described the greenhouse effect.”
So this is where his intellectual fulfillment comes from: understanding the greenhouse effect better than a lot of the people commenting on this blog.
So what.
The greenhouse effect is not some obscure piece of advanced climate science. It is foundational material.
Introductory science courses at community colleges across the country teach it very early in the course:
https://courses.vccs.edu/courses/GEO200-IntroductiontoPhysicalGeography/detail
“The Atmosphere
Describe the atmosphere in terms of composition, temperature and function.
Describe the significance of the ozone layer and the Montreal Protocol.
Employ Earth-Sun geometry to explain the changing seasons and day length at different latitudes.
Describe Earth’s energy balance.
Define the greenhouse effect and distinguish from the phenomenon of global climate change.”
You do not need an Ivy League education or exceptional scientific ability to learn the basic mechanism.
And that is the problem with his self awareness: Tim is measuring himself against a comment section where our friends here hold what are fringe views about climate science.
If you are surrounded by Sky Dragon slayers, then being the guy who can correctly explain the greenhouse effect is going to make you look pretty exceptional.
But that is a very strange pond in which to measure your intellectual stature.
Rather than recognizing that and using his gifted education and knowledge to be the humble, sensible skeptic this blog sorely needs, Tim S seems far more interested in establishing his intellectual status here.
I am sorry you feel that way. It is interesting how people reveal themselves when they go on a rant. Sometimes it is good to just let everything out. Meanwhile, you seem less interested in the important part:
“Intelligent people will understand the difference between science denial, skepticism based on sound science, and criticism of media and political hype. Are you intelligent, or just as dumb as someone else thinks you are?”
I have one final note, Let us know when you find some kind of error or misstatement I have made. If it is real, I will do my best to correct it.
Tim S asked:
[“Are you intelligent”]
That’s an interesting question.
I’m not sure why you’d expect an answer other than “yes.”
After all, someone answering “no” would rather awkwardly suggest that they’re admitting they’re dumb.
Thank you for playing along. This is why the drive-by quote is so dumb. Reading comprehension and context are important. The question about intelligence clearly pertains to the previous sentence. I have criticized the science deniers, and they don’t like it. I have made skeptical comments that are based on “sound science”, and I will continue to criticize the media and politicians who engage in climate hype.
That’s not what “drive-by” means, Timmy.
Here’s a drive by:
https://www.drroyspencer.com/2026/08/record-low-lake-mead-millennium-drought-or-inevitable-result-of-demand-exceeding-supply/#comment-1753184
You’re not playing home.
Welcome to the Internet.
How do you feel about LLMs taking your prospectus fluff piece job?
usually disapproving
done or said quickly, usually by someone who immediately goes somewhere else or does something else:
We want to keep the comments on our site free of trolls, cranks, and drive-by commenters.
https://dictionary.cambridge.org/dictionary/english/drive-by
This paper presents an overview of gridded surface solar radiation data sets currently provided by Deutscher Wetterdienst which are suitable for a wide range of specific applications.
Table 1, Table 2 show the details and the main properties of all data sets in a summarised form. Some quantitative comparisons are shown in Figs. 3, 4 and Table 3 for the five climate data records and for their common time period and region. Overall, the data records agree reasonably well concerning climatology, time series of monthly anomalies and their linear trends during 1995–2020. The mean SSR is ∼124W/m2 with lowest values in HYRAS and highest values in SARAH (Table 3). The slightly lower values in HYRAS are primarily driven by the reliance on SSR (pyranometer and SCAPP) and sunshine duration measurements. For the common period there is a significantly positive trend of about +4 W/m2/decade in all climate data records considered.
https://www.sciencedirect.com/science/article/pii/S2950630125000250#fig0004
Thanks for publishing this info.
Last week I finally obtained from DWD the new links to their complete radiation data measured by 58 of their over 600 stations.
The stations don’t measure only downwelling solar but also downwelling infrared; unfortunately, there is no upwelling data available.
But… shht! That smells all suspiciously like SURFRAD, it’s evil.
Unfortunately, the data is clear—there has been an increase in solar radiation at the Earth’s surface. Germany should prepare for a drought.
It’s not the first time that I see Anderson’s dumb manipulation posted above on September 1, 2026 at 12:32 PM:
” BG,
The Nazis weren’t right wing. They were left. ”
*
The courageous Anderson means with ‘BG’ of course ‘Bindi Goebbels’; like fis good friend QAnon, he loves to filthily insult others,by linking me to a top Nazi murderer.
*
Poor Anderson is such a historically uneducated, useful idiot.
During the Nazi dictatorship, approximately one million left-leaning individuals — including anarchists, communists, socialists, social democrats, left-wing activists, trade unionists, critical intellectuals, even Christians, who all refused to denounce Jews or other leftists (or – that was often enough – simply refused to give the Hitler salute) — were brutally tortured and murdered in GESTAPO dungeons, or lost their lives in major German industrial plants, gifted by the Nazis for free as slave labor and worked there till death.
*
Anderson is by the way the one who claimed some years ago on the blog:
” Pinochet was a leftist.”
For those who don’t know: during the Chilean military dictatorship under General Augusto Pinochet (1973–1990), about 3,000 people were officially murdered. The overwhelming majority of these victims were like in Nazi Germany in the vast majority left-leaning individuals.
Maybe Anderson thinks also that Pinochet’s Argentinian neighbour general Jorge Videla was also a leftist, doesn’t he?
Under Videla, the terror directed at leftists between 1976 and 1983 was far more intense than in Chile: between 20,000 and 30,000 people lost their lives, including at least 2,000 in the infamous “death flights” (*vuelos de la muerte*) — carried out by the Batallón de Aviación del Ejército 601 — during which political opponents of the dictatorship were thrown alive from aircraft into the Atlantic.
***
That is all so perfectly on par with what Alice Weidel, the harsh leader of the German far-right wing party AfD, told Elon Musk in an interview in January 2025:
” Hitler was an ‘antisemitic socialist’ and a ‘communist’. ”
*
This is the hallmark of the modern far-right, who ceaselessly attempt to distance themselves from a past they secretly admire and would love to reinstall, but are compelled to publicly despise.
Hitler was “socialist” enough to hire people at arms factories, which gave them jobs. However, they later had to go to the front, and they were replaced by slaves from occupied countries. This is so-called “National Socialism,” but it should be called “National Nationalism.”
Congratulations to the Pentagon on its stake in Venezuelan oil.
Sorry, Palmowski: you show here exactly the save naivety as do US people (small)talking about Hitler.
What Hitler did had nothing to do with socialism: he was the leader of one of the most bellicose and brutal dictatorships.
What you are writing sounds just like what certain Germans said twenty years after the war:
“Not everything Hitler did was wrong! After all, he had the autobahns built!”
OMG…
Everything I’ve written has been repeated throughout history. Putin is doing exactly the same thing. My grandfather, a soldier from 1939, worked on a farm after being taken prisoner. A great many prisoners of war worked in ammunition production. I want to emphasize that labeling certain parties often has nothing to do with their actual actions. Caring for people in difficult situations should be the responsibility of every political party and of society as a whole. Labeling them as “socialists” or “conservatives” is of entirely secondary importance.
Tropical Storm Marie is strengthening into a hurricane.
https://i.ibb.co/cKCd4qLD/pobrane.png
“Congratulations to the Pentagon on its stake in Venezuelan oil.”
Really?
You’re applauding our return to the ‘good old days’ of Colonialism, when the ‘great powers’ flexed their military muscle to bully the weaker countries into giving up their natural resources.
And all you free market folks are ok with our government getting into the oil business?
Nate, do you think I’m that much of a fool? Just across the Polish border, a bloody war is raging over territory, and in the Middle East, over the Strait of Hormuz.
Then why are you congratulating?
Trump is way too friendly with dictators like Putin, and Kim Jong Il.
He has destabilized the world economy with nothing gained from the Iran war.
And by bullying Venezuela yet not promoting democracy there, he is giving Russia and China good excuses to be agressive toward weaker neighboring democracies.
I think you misunderstood my intentions.
Thank you for your response.
If you poke a bear, sooner or later you will be bitten, the baiting of Russia has been a Western sport for decades, from nukes in Turkey , to NATO and EU expansion , Putin is a nasty piece of work ,yes,but Ukraine is not lilly white it never was.
Nate
The Krauts around me, seeing your reaction to Palmowski, would say:
” Mannomann, ist dieser Nate bierernst! ”
*
translate.google.com will help if necessary :–)
There is not any anthropogenic Global Warming.
–
https://www.cristos-vournas.com
Hmmm.
“He wanted it big. He wanted lots of gold, lots of marble. He wanted visitors awestruck by his architectural expansion of the country’s symbolic seat of power. ‘They should sense the strength and grandeur of the German Reich as they walk from the entrance to the reception hall’, Adolf Hitler told his chief architect, Albert Speer, outlining his plans for an extension to the old Reich chancellery, at Wilhelmstrasse 77 in Berlin.
The new annex, connected to the chancellery by a marble corridor hung with crystal chandeliers, was part of Hitler’s ambitious plans to align the Berlin cityscape with his vision for the future of the country. Hitler wanted a Triumphbogen, a triumphal arch, twice the size of the Arc de Triomphe in Paris. He wanted an ‘Avenue of Splendor’ for military parades. ‘The Champs-Alysees is a hundred meters wide’, Hitler told Speer. ‘We will make our avenue twenty meters wider.’ A planned Volkshalle was to accommodate 180,000. The Eiffel Tower could fit beneath its cupola. This ‘Hall of the People’ was to be topped by the largest swastika on Earth. Berlin itself was to be rechristened as Weltstadt Germania, ‘Capital of the World.'”
https://www.theatlantic.com/ideas/2026/04/hitlers-edifice-complex/686662/
Hmmmm.
“”After creating an economic mess with ill-advised tariffs, Hitler looked north in pursuit of resources and national security.
Greenland appears to have been a lifelong preoccupation of Adolf Hitler’s. According to stenographic notes from a lunchtime conversation dated May 21, 1942, Hitler recalled that hardly anyone interested him more in his youth than Fridtjof Nansen, the Norwegian explorer who in 1888 led the first team to cross Greenland’s interior. A surviving volume from Hitler’s private book collection contains firsthand accounts of the geologic and Arctic explorer Alfred Wegener’s Greenland Expedition, which left Wegener dead in 1930 and inspired the 1933 adventure film S.O.S. Eisberg, starring the actor and eventual filmmaker Leni Riefenstahl.”11
https://www.theatlantic.com/ideas/2026/02/hitler-greenland/685984/
NOAA’s August assessment has just been released.
And to present some figures relevant to this post’s topic:
The Southwest US just experienced its hottest summer on record:
https://www.ncei.noaa.gov/access/monitoring/climate-at-a-glance/regional/time-series/107/tavg/3/8/1895-2026
Meanwhile, NOAA’s Palmer Drought Severity Index (PDSI) reached its most negative (driest) value on record last month:
https://www.ncei.noaa.gov/access/monitoring/climate-at-a-glance/regional/time-series/107/pdsi/1/0/1895-2026
Really hard times might be coming if this trend doesn’t turn around…
Southwest summer TMIN (the daily minimum temperature, usually occurring overnight or around sunrise) was the warmest on record:
https://www.ncei.noaa.gov/access/monitoring/climate-at-a-glance/regional/time-series/107/tmin/3/8/1895-2026?filter=loess
Normally, WRT drought, cooler nighttime temperatures provide some relief to plants as relative humidity rises and evaporative demand falls.
Elevated nighttime temperatures, however, keep evaporative demand higher, extending the stress further into the night.