Yesterday, the American Meteorological Society (AMS) sent a letter to DOE Secretary Rick Perry, scolding him for the following opinion he uttered in a CNBC interview on June 19.
Quoting from a Washington Post article:
Asked in an interview on CNBCs “Squawk Box” whether he believed that carbon dioxide was “the primary control knob for the temperature of the Earth and for climate”, Perry said that “No, most likely the primary control knob is the ocean waters and this environment that we live in.” Perry added that “the fact is this shouldn’t be a debate about, ‘Is the climate changing, is man having an effect on it?’ Yeah, we are. The question should be just how much, and what are the policy changes that we need to make to effect that?”
(Most of the headlines I’ve seen on the CNBC interview, including the WaPo piece, refer to Perry with the usual “denier” terms.)
Basically, Perry is saying he believes that nature has a larger role than humans in recent warming. I, too, believe that the oceans might well be a primary driver of climate change, but whether the human/nature ratio is 50/50, or less, or more than that is up for debate. We simply don’t know.
So, while Sec. Perry goes against the supposed consensus of scientists, it was not outlandish, it wasn’t a denial of a known fact.
It was a valid opinion on an uncertain area of science.
AMS, me thinks thou doth protest too much
In response to Sec. Perry’s comments, the Executive Director of the AMS, Keith Seitter, said this in his letter to Perry (emphasis added):
While you acknowledged that the climate is changing and that humans are having an impact on it, it is critically important that you understand that emissions of carbon dioxide and other greenhouse gases are the primary cause. This is a conclusion based on the comprehensive assessment of scientific evidence. It is based on multiple independent lines of evidence that have been affirmed by thousands of independent scientists and numerous scientific institutions around the world. We are not familiar with any scientific institution with relevant subject matter expertise that has reached a different conclusion. These indisputable findings have shaped our current AMS Statement on Climate Change, which states: “It is clear from extensive scientific evidence that the dominant cause of the rapid change in climate of the past half century is human-induced increases in the amount of atmospheric greenhouse gases, including carbon dioxide (CO2), chlorofluorocarbons, methane, and nitrous oxide.”
Indisputable findings? Really? In my opinion, the AMS view (which draws upon the U.N. IPCC view) is much more definitively stated than the evidence warrants.
Sure, all of the scientific institutions are going to jump on the bandwagon, with politically savvy committees agreeing with each other; they are in effect being paid by the government to agree with the consensus through billions of dollars in grants and contracts.
If there is no global warming crisis, there would be little congressional funding to study it, and thousands of climate-dependent careers (including mine) simply wouldn’t exist.
That money also trickles down to the AMS, which is paid to hold scientific conferences, workshops, and publish the resulting research studies in scientific journals. They have a vested interest in the gravy train continuing.
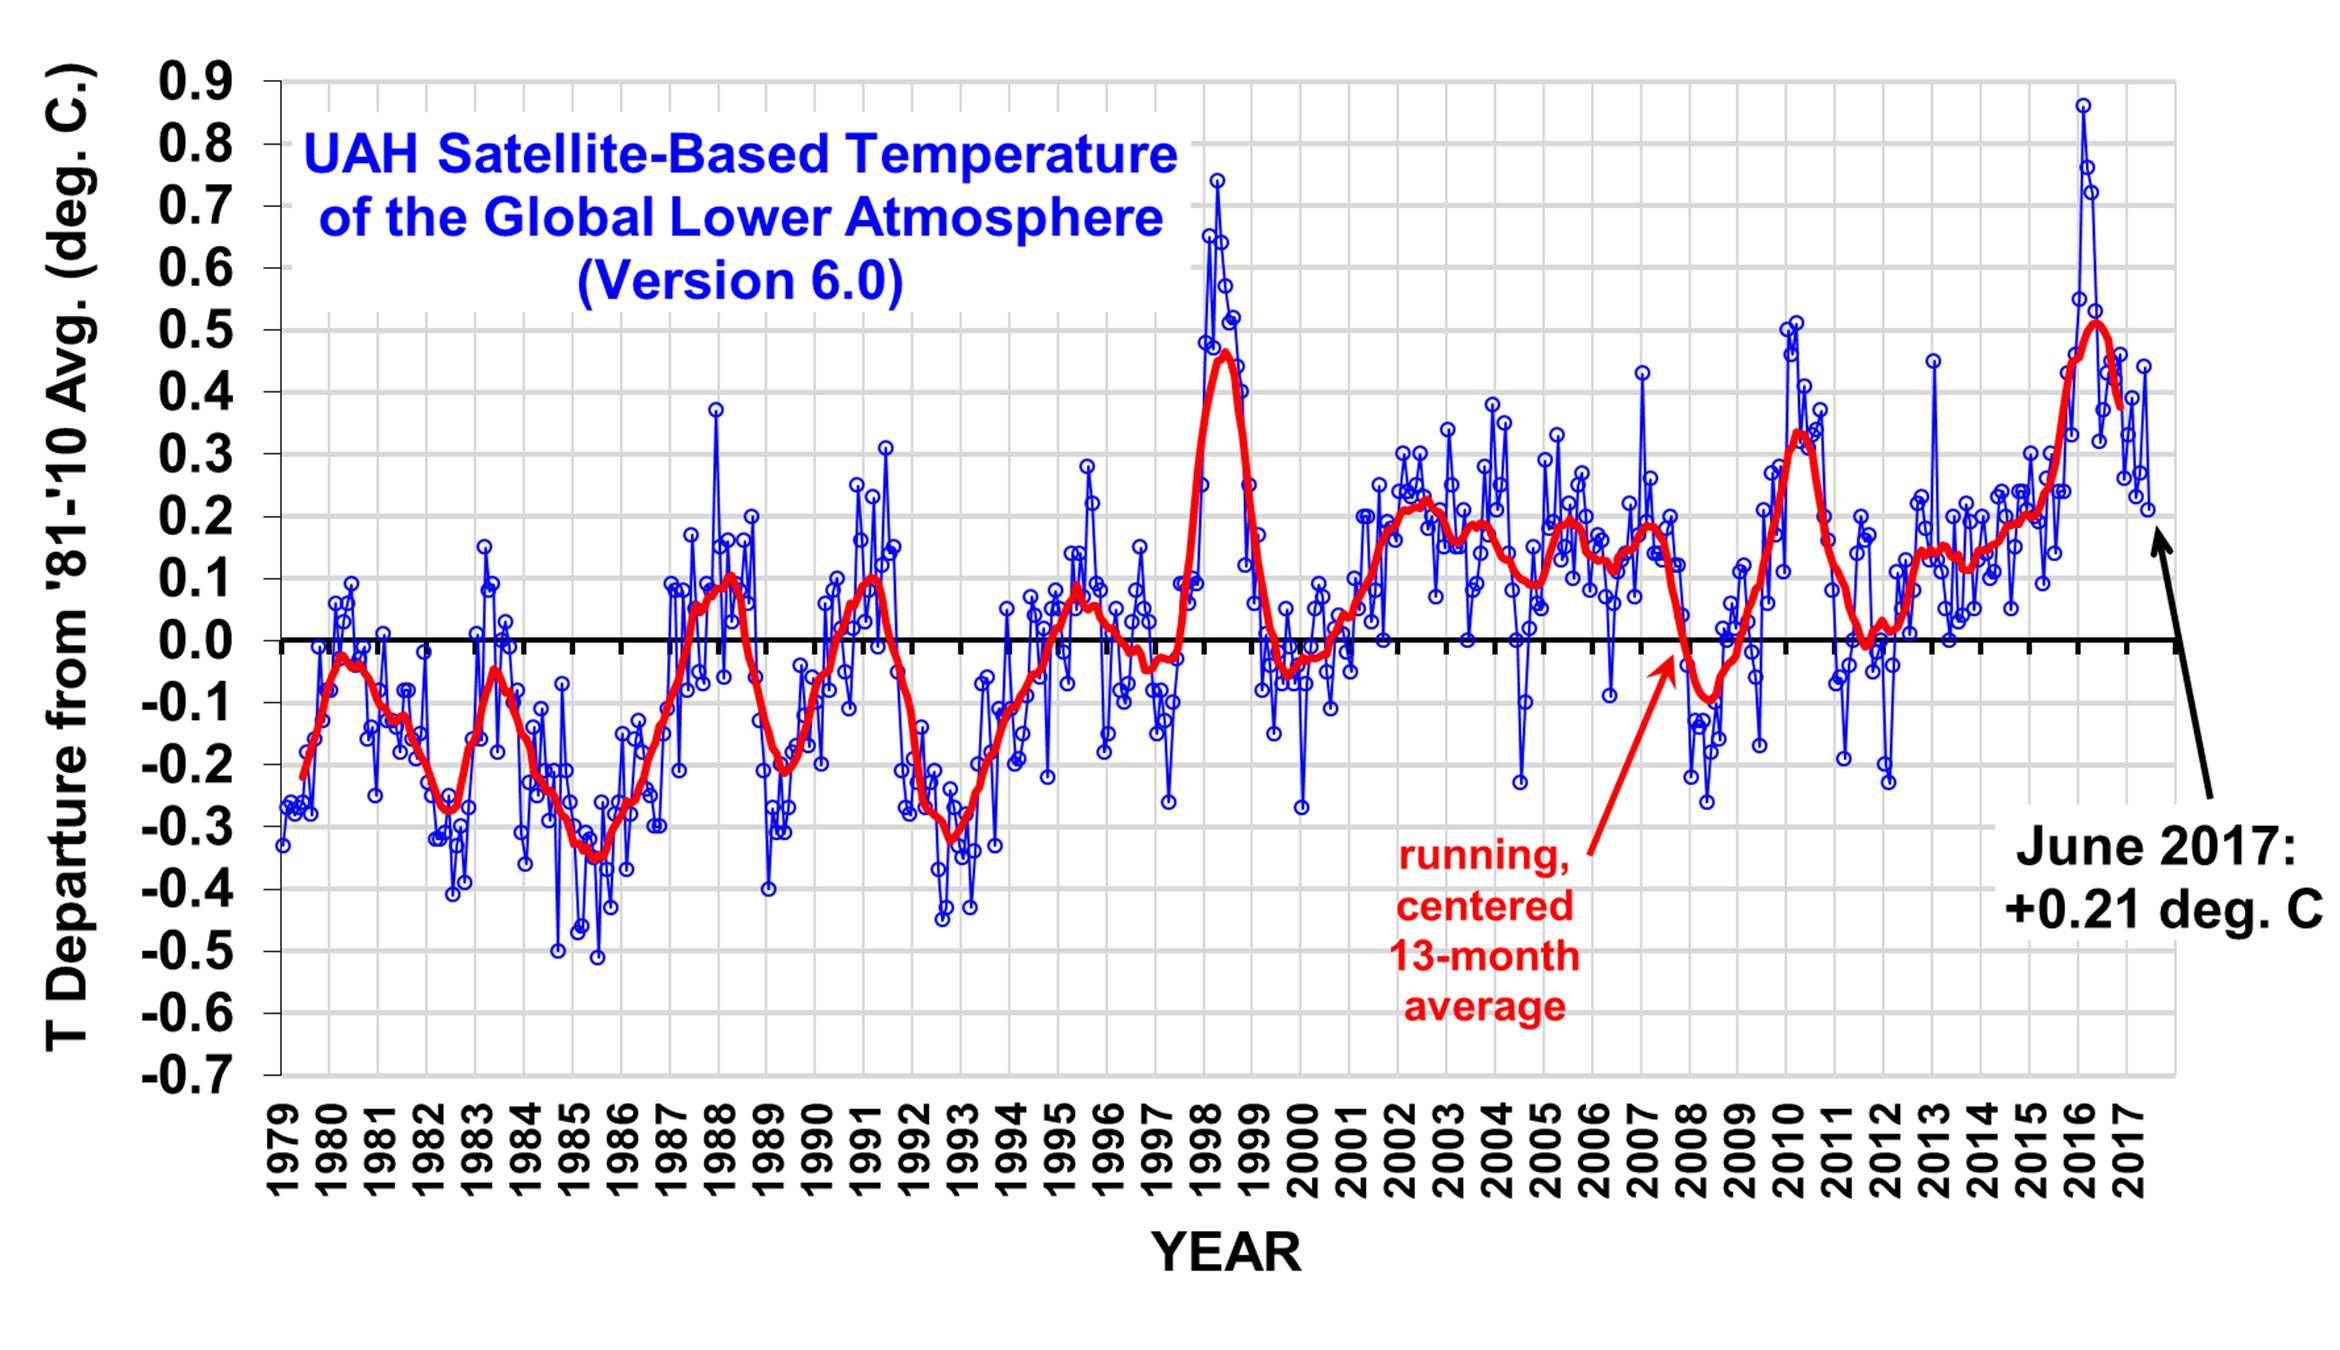
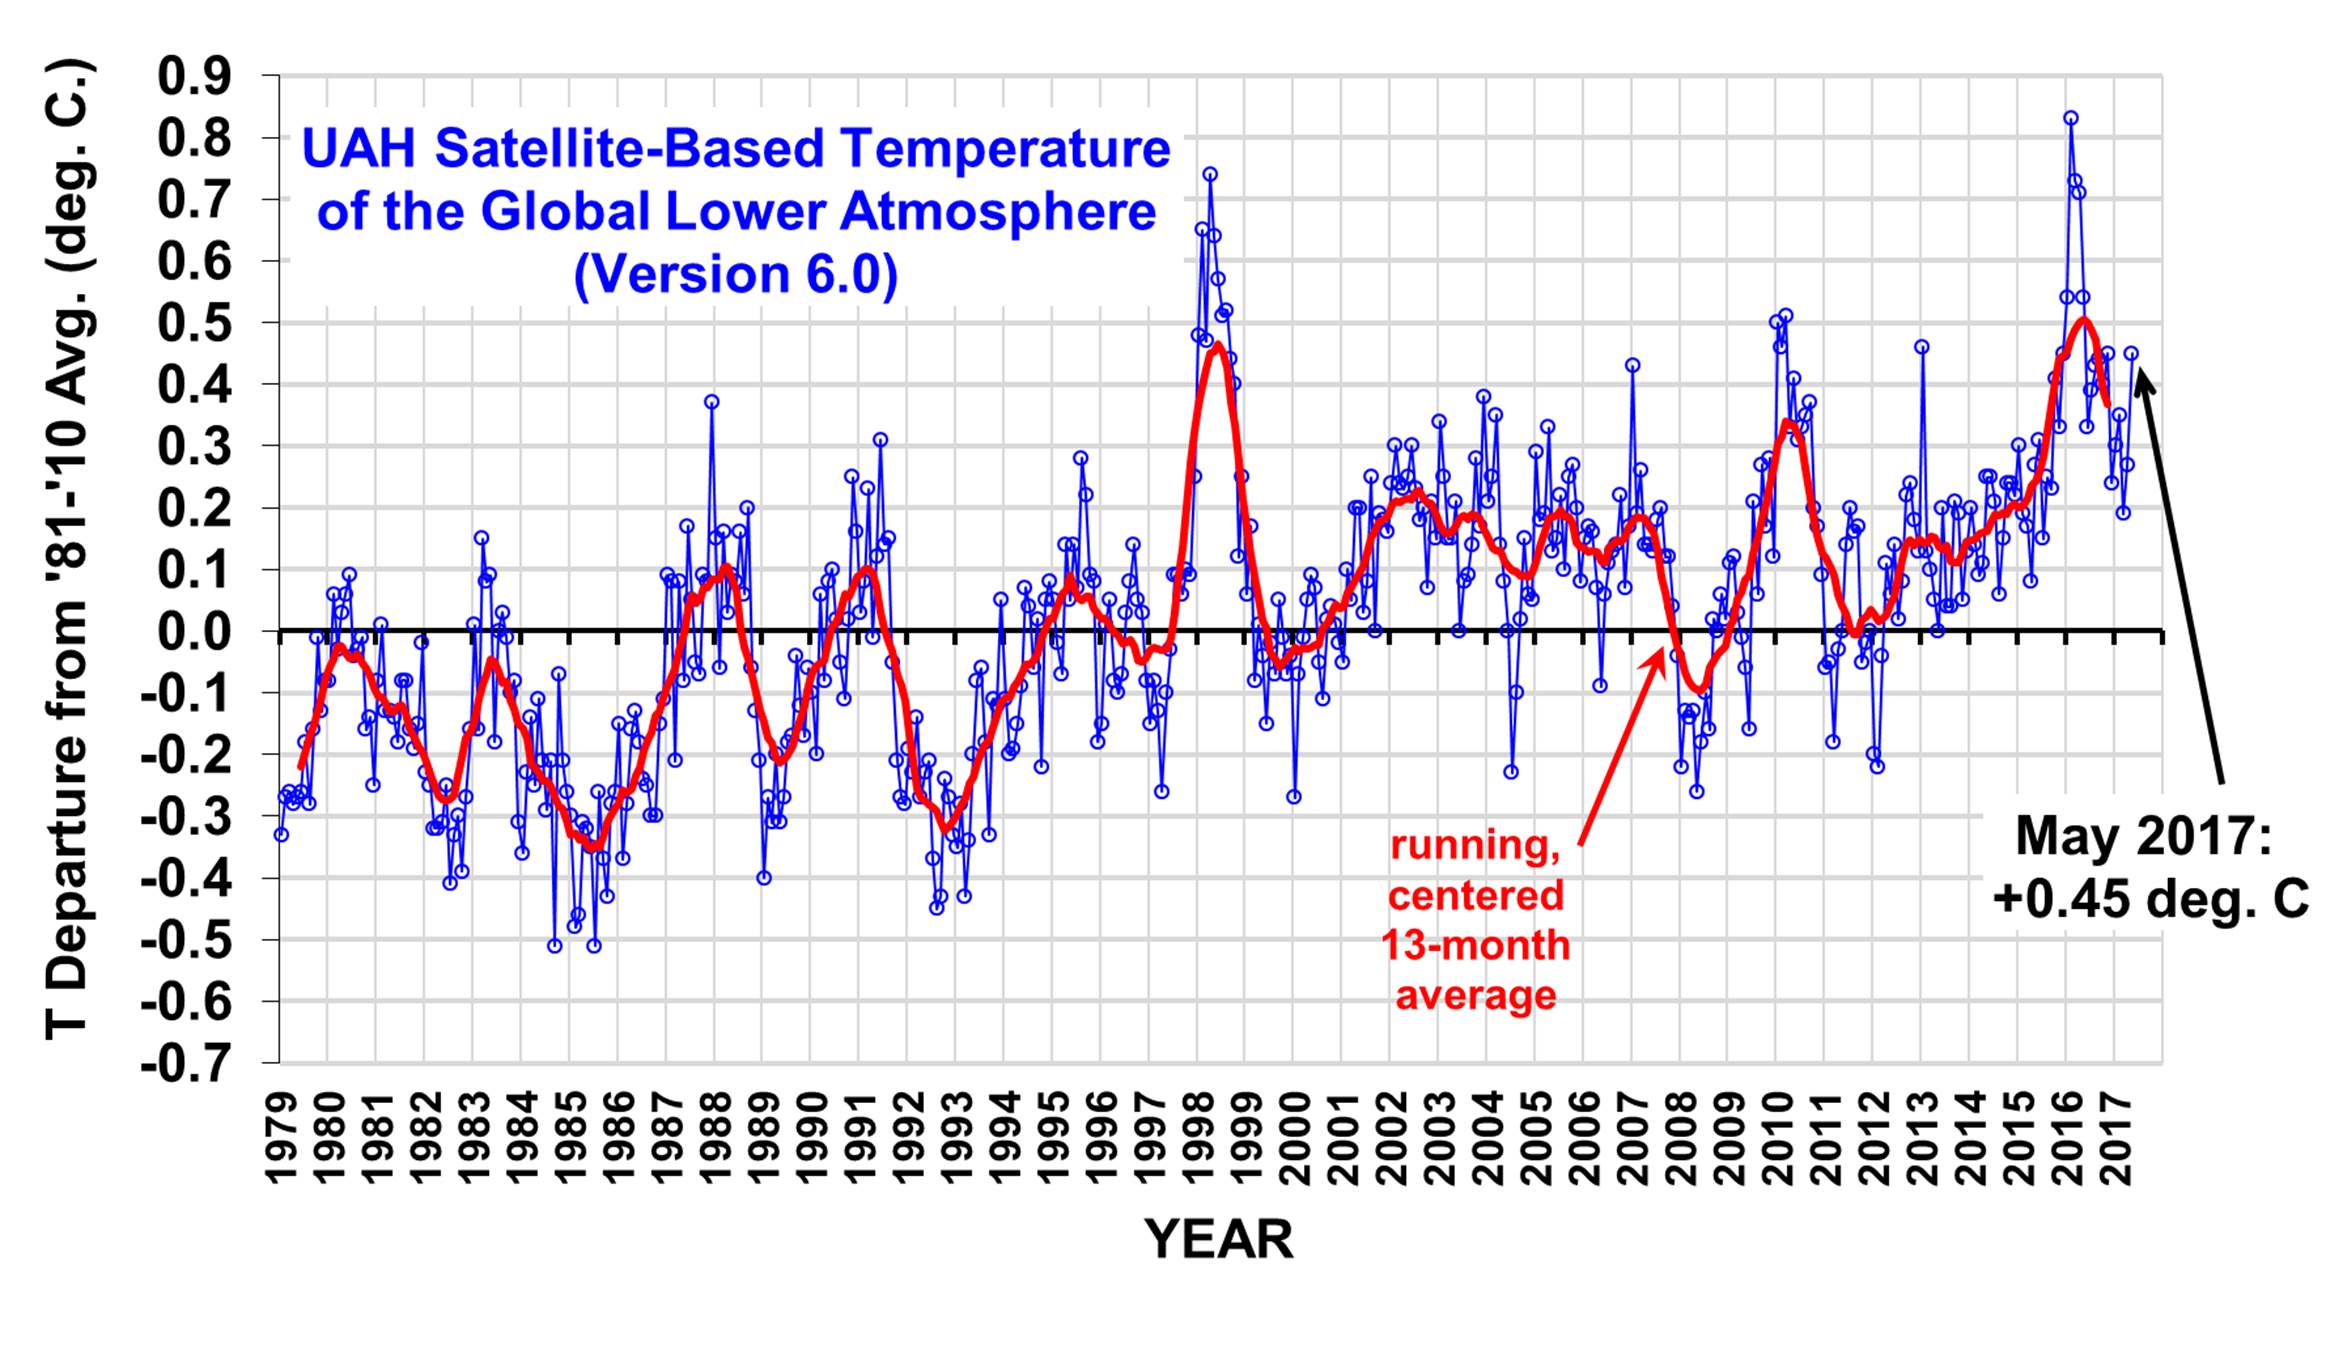
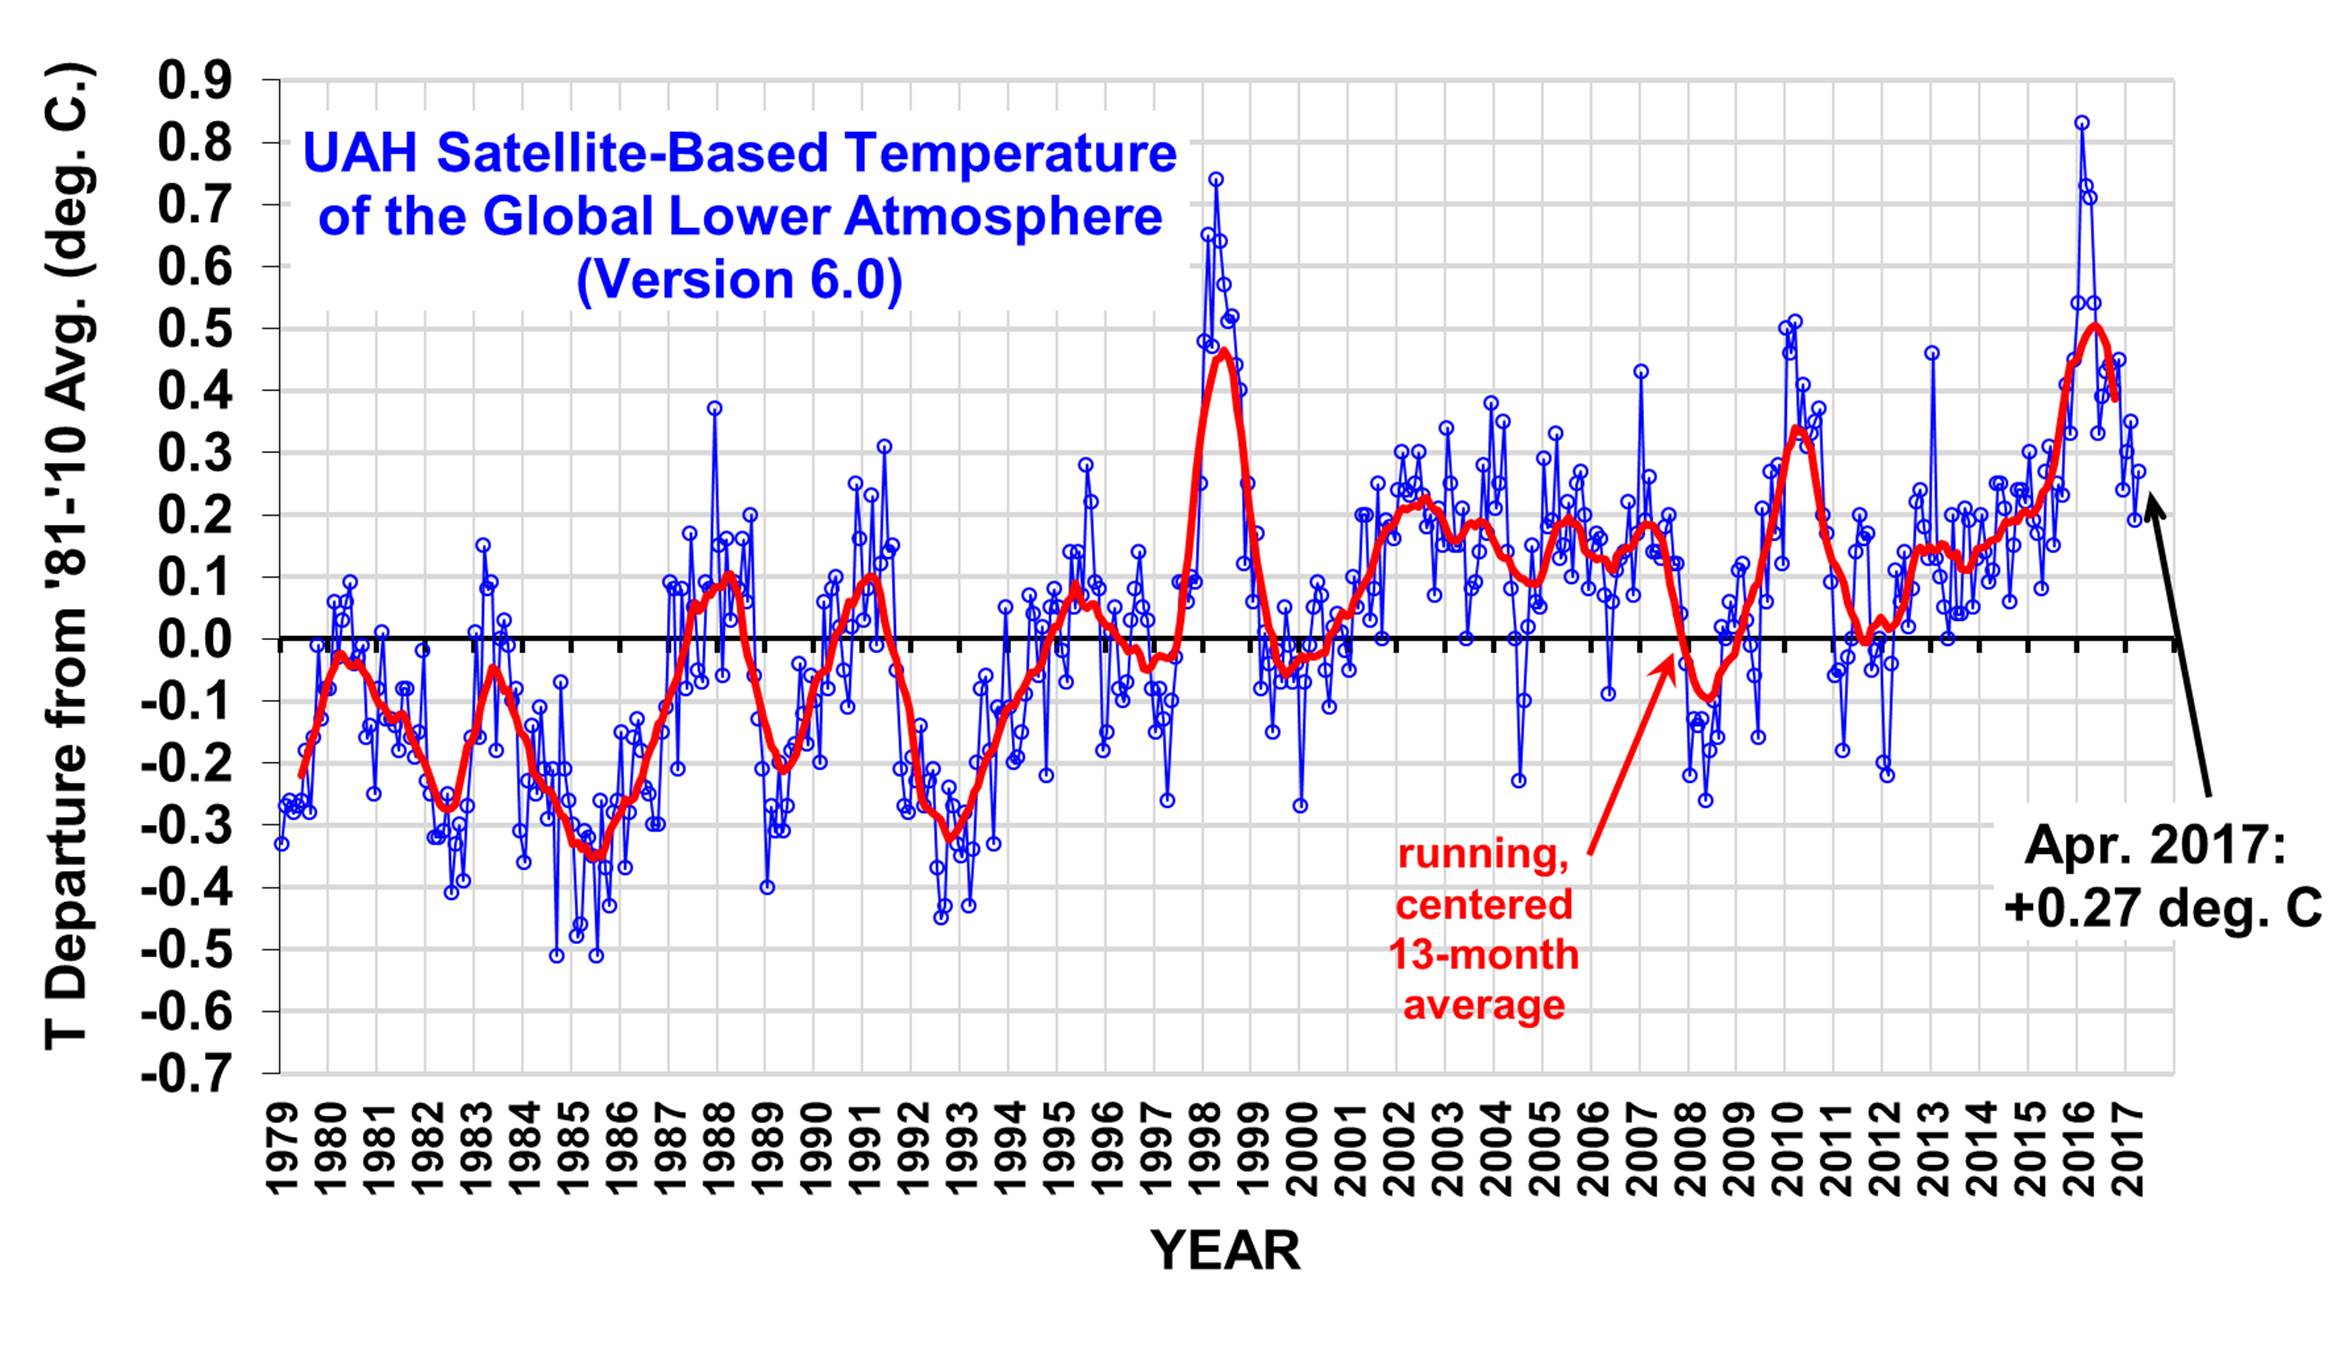
So, maybe I can ask the AMS: Just what percentage of recent warming was natural in origin? None? 10%? 40%? How do you know? Why was the pre-1940 warming rate — caused by Mother Nature — almost as strong as recent warming?
The truth is, no one knows just how much of recent warming was human-caused, including those thousands of “independent” scientists. They pin the blame on CO2 partly because that’s all they can think of, and we still don’t understand natural sources of climate change.
Besides, in the climate business, there are no thousands of independent scientists, anyway. They live and work in an echo chamber, and very few of them have the breadth and depth of knowledge to make an informed judgement on the issue. The vast majority are specialists in some narrow field of research. They go along to get along… and to continue to get funding.
Young climate researchers today cannot voice any doubts about anthropogenic global warming, or they might not have a career. They can’t go to Big Energy for research funding because, as far as I know, such funding does not exist. Big Energy knows they don’t have to pay people to prop up petroleum, natural gas, and coal, because the world runs on the stuff, and for the foreseeable future there are no large-scale, cost-effective, reliable, and readily dispatchable alternatives.
What we DO know with considerable confidence is that increasing CO2 should cause some warming. I’ll admit that my opinion here is mostly based upon a theoretical extrapolation from laboratory measurements of how CO2 absorbs and emits infrared energy. But we really don’t know how much warming. We certainly do not have enough confidence to claim it is indisputable that our greenhouse gas emissions are the dominant cause, as the AMS letter claims.
I am ashamed that the climate research community allows such pronouncements to be made. The AMS became a global warming advocacy group many years ago, and as a result it lost a lot of established members, including myself.

 Home/Blog