Energy Secretary Chris Wright and EPA Administrator Lee Zeldin will be in Indianapolis today (29 July 2025) to announce major climate regulation changes…so, stay tuned!
Here’s video of the announcement. I’m one of the 5 scientists chosen to write the DOE report for Sec. Wright which provided the scientific basis for EPA Administrator Zeldin’s decision.
None of us asked to write this report had any insider knowledge of what Zeldin would decide… we were simply asked to write a report of what we believed the threat of increasing CO2 posed to the U.S. That report will be posted very soon (if it hasn’t already). I will do a separate post on that.
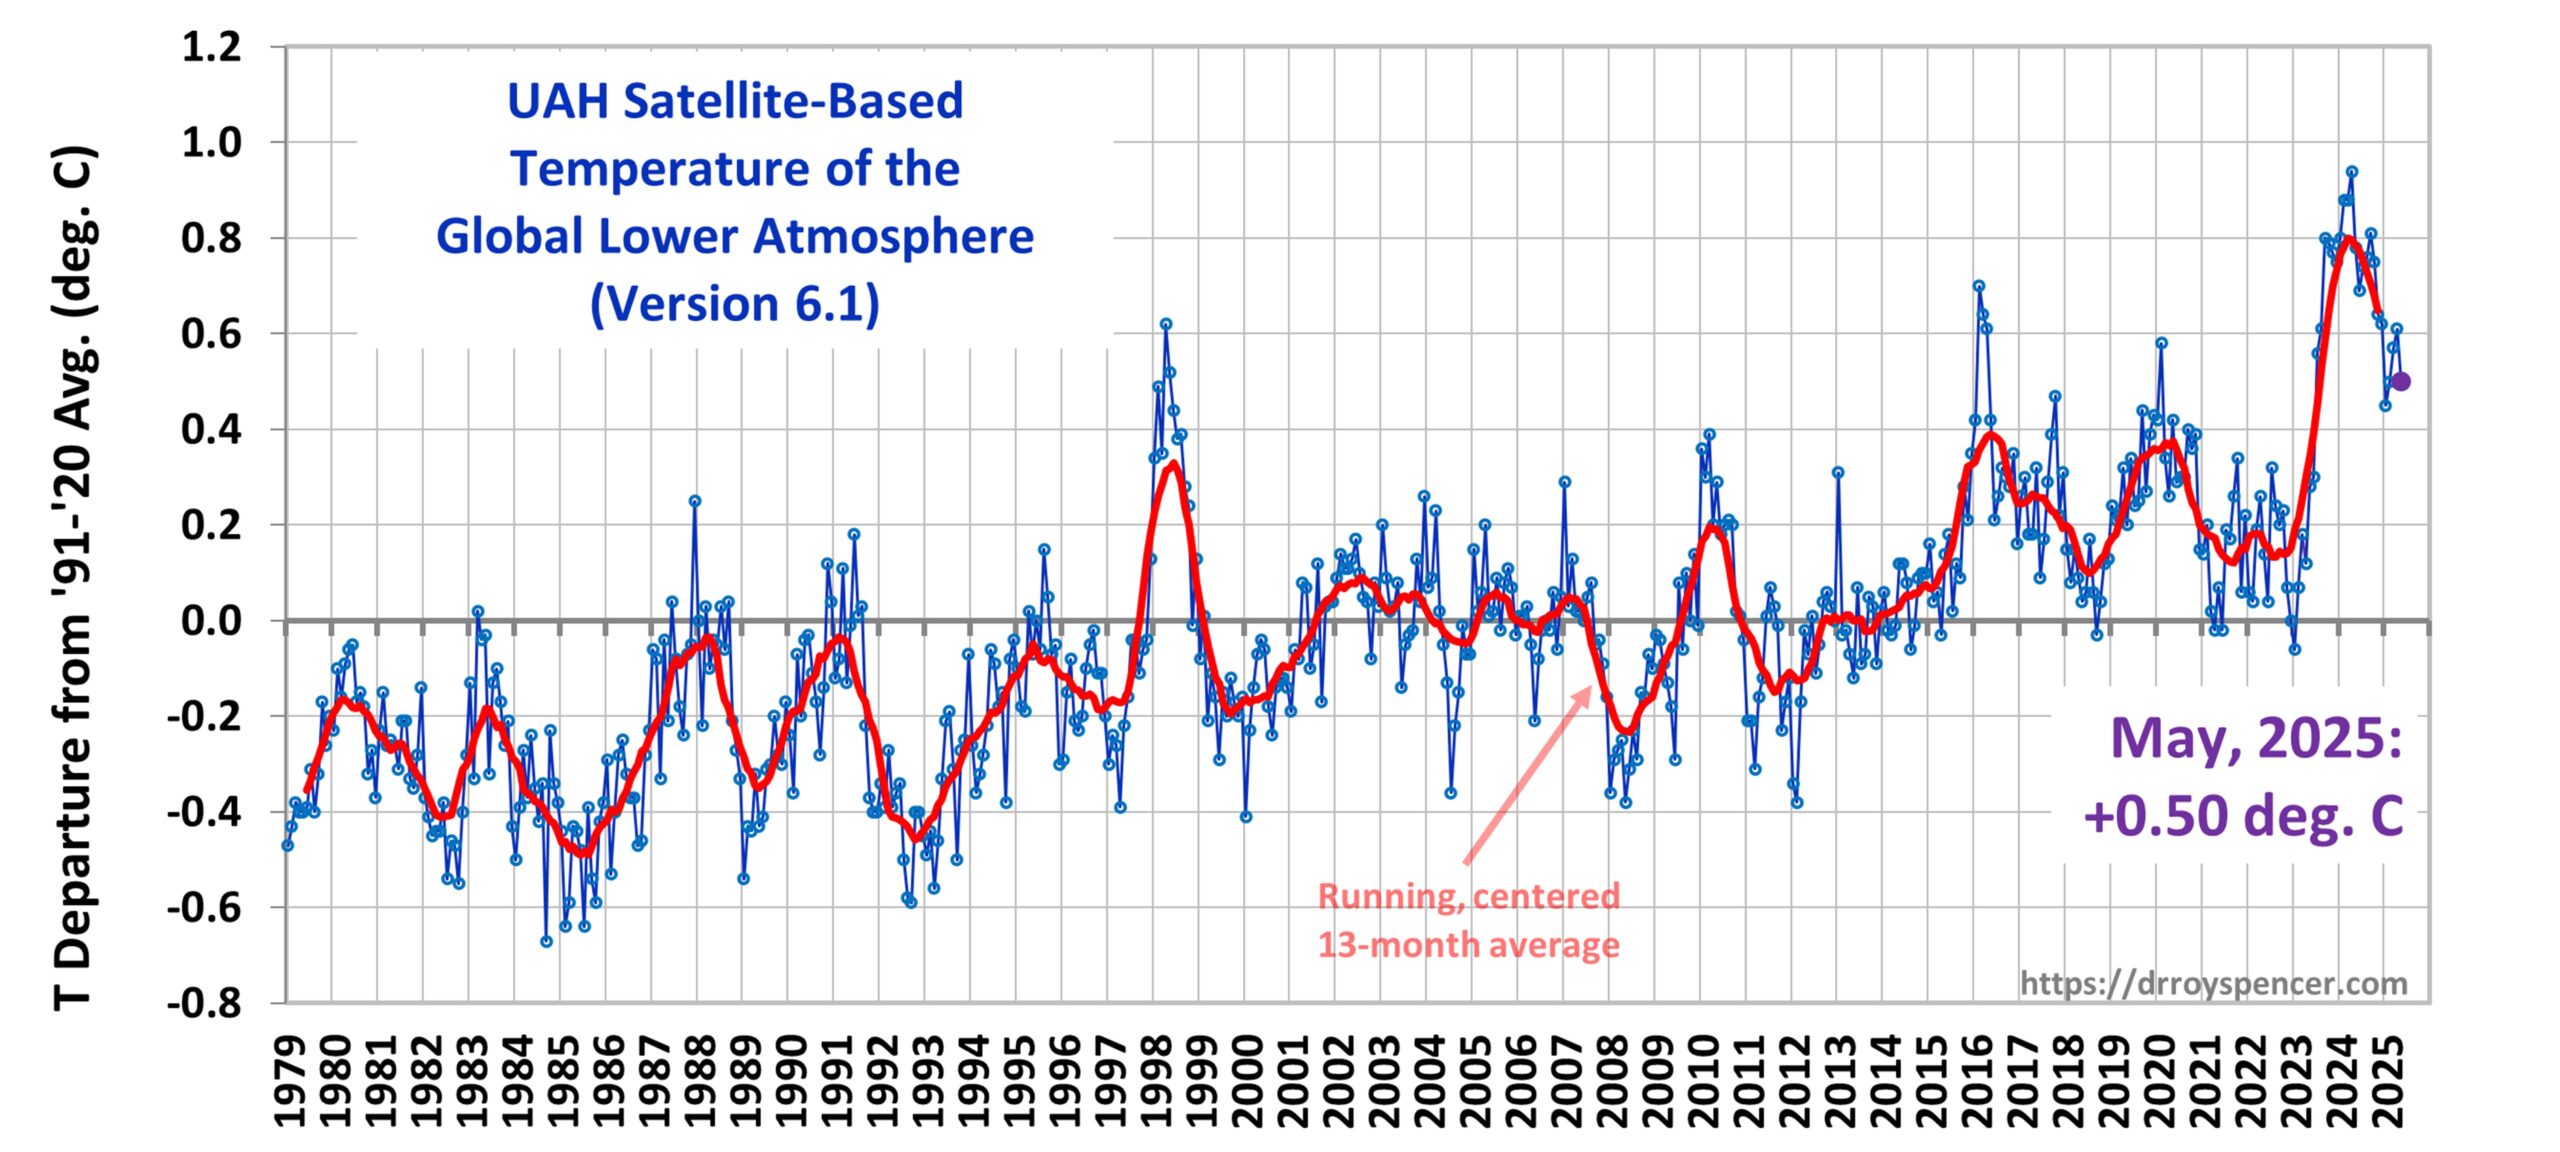
The Version 6.1 global average lower tropospheric temperature (LT) anomaly for June, 2025 was +0.48 deg. C departure from the 1991-2020 mean, down slightly from the May, 2025 anomaly of +0.50 deg. C.
The Version 6.1 global area-averaged linear temperature trend (January 1979 through June 2025) now stands at +0.16 deg/ C/decade (+0.22 C/decade over land, +0.13 C/decade over oceans).
The following table lists various regional Version 6.1 LT departures from the 30-year (1991-2020) average for the last 18 months (record highs are in red).
YEAR
MO
GLOBE
NHEM.
SHEM.
TROPIC
USA48
ARCTIC
AUST
2024
Jan
+0.80
+1.02
+0.58
+1.20
-0.19
+0.40
+1.12
2024
Feb
+0.88
+0.95
+0.81
+1.17
+1.31
+0.86
+1.16
2024
Mar
+0.88
+0.96
+0.80
+1.26
+0.22
+1.05
+1.34
2024
Apr
+0.94
+1.12
+0.76
+1.15
+0.86
+0.88
+0.54
2024
May
+0.78
+0.77
+0.78
+1.20
+0.05
+0.20
+0.53
2024
June
+0.69
+0.78
+0.60
+0.85
+1.37
+0.64
+0.91
2024
July
+0.74
+0.86
+0.61
+0.97
+0.44
+0.56
-0.07
2024
Aug
+0.76
+0.82
+0.69
+0.74
+0.40
+0.88
+1.75
2024
Sep
+0.81
+1.04
+0.58
+0.82
+1.31
+1.48
+0.98
2024
Oct
+0.75
+0.89
+0.60
+0.63
+1.90
+0.81
+1.09
2024
Nov
+0.64
+0.87
+0.41
+0.53
+1.12
+0.79
+1.00
2024
Dec
+0.62
+0.76
+0.48
+0.52
+1.42
+1.12
+1.54
2025
Jan
+0.45
+0.70
+0.21
+0.24
-1.06
+0.74
+0.48
2025
Feb
+0.50
+0.55
+0.45
+0.26
+1.04
+2.10
+0.87
2025
Mar
+0.57
+0.74
+0.41
+0.40
+1.24
+1.23
+1.20
2025
Apr
+0.61
+0.77
+0.46
+0.37
+0.82
+0.85
+1.21
2025
May
+0.50
+0.45
+0.55
+0.30
+0.15
+0.75
+0.99
2025
June
+0.48
+0.48
+0.47
+0.30
+0.81
+0.05
+0.39
The full UAH Global Temperature Report, along with the LT global gridpoint anomaly image for June, 2025, and a more detailed analysis by John Christy, should be available within the next several days here.
The monthly anomalies for various regions for the four deep layers we monitor from satellites will be available in the next several days at the following locations:
Most of you are probably not aware that my wife of 48 years, Doreen (“Reenie”) J. Spencer passed away two weeks ago today, on June 7. Reenie had suffered for many years from autoimmune and fatty liver disease, and her condition worsened in the last several months. By the time she agreed to go to the hospital, it was too late to do anything except keep her comfortable.
We married the year I changed my major from computer science to atmospheric science and moved from Michigan State University to the University of Michigan. Reenie was always my most loyal supporter and fiercest defender, exhibiting the ‘sisu’ of her Finnish heritage.
Her spirit is now relieved of her earthly sufferings.
The Version 6.1 global average lower tropospheric temperature (LT) anomaly for May, 2025 was +0.50 deg. C departure from the 1991-2020 mean, down from the April, 2025 anomaly of +0.61 deg. C.
The Version 6.1 global area-averaged linear temperature trend (January 1979 through May 2025) remains at +0.15 deg/ C/decade (+0.22 C/decade over land, +0.13 C/decade over oceans).
The following table lists various regional Version 6.1 LT departures from the 30-year (1991-2020) average for the last 17 months (record highs are in red).
YEAR
MO
GLOBE
NHEM.
SHEM.
TROPIC
USA48
ARCTIC
AUST
2024
Jan
+0.80
+1.02
+0.58
+1.20
-0.19
+0.40
+1.12
2024
Feb
+0.88
+0.95
+0.81
+1.17
+1.31
+0.86
+1.16
2024
Mar
+0.88
+0.96
+0.80
+1.26
+0.22
+1.05
+1.34
2024
Apr
+0.94
+1.12
+0.76
+1.15
+0.86
+0.88
+0.54
2024
May
+0.78
+0.77
+0.78
+1.20
+0.05
+0.20
+0.53
2024
June
+0.69
+0.78
+0.60
+0.85
+1.37
+0.64
+0.91
2024
July
+0.74
+0.86
+0.61
+0.97
+0.44
+0.56
-0.07
2024
Aug
+0.76
+0.82
+0.69
+0.74
+0.40
+0.88
+1.75
2024
Sep
+0.81
+1.04
+0.58
+0.82
+1.31
+1.48
+0.98
2024
Oct
+0.75
+0.89
+0.60
+0.63
+1.90
+0.81
+1.09
2024
Nov
+0.64
+0.87
+0.41
+0.53
+1.12
+0.79
+1.00
2024
Dec
+0.62
+0.76
+0.48
+0.52
+1.42
+1.12
+1.54
2025
Jan
+0.45
+0.70
+0.21
+0.24
-1.06
+0.74
+0.48
2025
Feb
+0.50
+0.55
+0.45
+0.26
+1.04
+2.10
+0.87
2025
Mar
+0.57
+0.74
+0.41
+0.40
+1.24
+1.23
+1.20
2025
Apr
+0.61
+0.77
+0.46
+0.37
+0.82
+0.85
+1.21
2025
May
+0.50
+0.45
+0.55
+0.30
+0.15
+0.75
+0.99
The full UAH Global Temperature Report, along with the LT global gridpoint anomaly image for May, 2025, and a more detailed analysis by John Christy, should be available within the next several days here.
The monthly anomalies for various regions for the four deep layers we monitor from satellites will be available in the next several days at the following locations:
To quickly summarize, we used the average temperature differences between nearby GHCN stations and related those to population density (PD) differences between stations. Why population density? Well, PD datasets are global, and one of the PD datasets goes back to the early 1800s, so we can compute how the UHI effect has changed over time. The effect of PD on UHI temperature is strongly nonlinear, so we had to account for that, too. (The strongest rate of warming occurs when population just starts to increase beyond wilderness conditions, and it mostly stabilizes at very high population densities; This has been known since Oke’s original 1973 study).
We then created a dataset of UHI warming versus time at the gridpoint level by calibrating population density increases in terms of temperature increase.
The bottom line was that 65% of the U.S. linear warming trend between 1895 and 2023 was due to increasing population density at the suburban and urban stations; 8% of the warming was due to urbanization at rural stations. Most of that UHI effect warming occurred before 1970.
But this does not necessarily translate into NOAA’s official temperature record being corrupted at these levels. Read on…
What Does This Mean for Urbanization Effects in the Official U.S. Temperature Record?
That’s a good question, and I don’t have a good answer.
One of the reviewers, who seemed to know a lot about the homogenization technique used by NOAA, said the homogenized data could not be used for our study because the UHI-trends are mostly removed from those data. (Homogenization looks at year-to-year [time domain] temperature changes at neighboring stations, not the spatial temperature differences [space domain] like we do). So, we were forced to use the raw (not homogenized) U.S. summertime GHCN daily average ([Tmax+Tmin]/2) data for the study. One of the surprising things that reviewer claimed was that homogenization warms the past at currently urbanized stations to make their less-urbanized early history just as warm as today.
So, I emphasize: In our study, it was the raw (unadjusted) data which had a substantial UHI warming influence. This isn’t surprising.
But that reviewer of the paper said most of the spurious UHI warming effect has been removed by the homogenization process, which constitutes the official temperature record as reported by NOAA. I am not convinced of this, and at least one recent paper claims that homogenization does not actually correct the urban trends to look like rural trends, but instead it does “urban blending” of the data. As a result, which trends are “preferred” by that statistical procedure are based upon a sort of “statistical voting” process (my terminology here, which might not be accurate).
So, it remains to be seen just how much spurious UHI effect there is in the official, homogenized land-based temperature trends. The jury is still out on that.
Of course, if sufficient rural stations can be found to do land-based temperature monitoring, I still like Anthony Watts’ approach of simply not using suburban and urban sites for long-term trends. Nevertheless, most people live in urbanized areas, so it’s still important to quantify just how much of those “record hot” temperatures we hear about in cities are simply due to urbanization effects. I think our approach gets us a step closer to answering that question.
Is Population Density the Best Way to Do This?
We used PD data because there are now global datasets, and at least one of them extends centuries into the past. But, since we use population density in our study, we cannot account for additional UHI effects due to increased prosperity even when population has stabilized.
For example, even if population density no longer increases over time in some urban areas, there have likely been increases in air conditioning use, with more stores and more parking lots, as wealth has increased since, say, the 1970s. We have started using a Landsat-based dataset of “impervious surfaces” to try to get at part of this issue, but those data only go back to the mid-1970s. But it will be a start.
I suppose I shouldn’t be surprised. For the uninitiated, while Politico is allegedly a news organization, it has a history of supporting Progressive and Leftist causes.
To be fair, the summary lead at the top of the article is pretty good: “A common refrain: Climate policy hurts the poor, and the continued use of fossil fuels is a boon for humanity.“ But, at best, today’s Politico article entitled, “Meet the 4 influencers shaping Chris Wright�s worldview” is a mix of truths, half-truths, and misleading innuendoes. The article is by Scott Waldman. The four alleged influencers of Energy Secretary Chris Wright’s views on climate science and energy policy are, in order, Bjorn Lomborg, me, Alex Epstein, and John Constable.
I will let the others speak for themselves. What follows is, verbatim, the article addressing my influence on Sec. Wright. I don’t need to comment on everything because some of it is true. I will only offer clarifications where appropriate. Why? Because there are a lot of untruths circulating about me and unless I address them from time to time, those things become part of a narrative that is difficult to dislodge.
Quotes from the article are in italics; my response & clarifications are in bold:
Spencer, whose work was cited as a resource in Wright�s report, is a research scientist at the University of Alabama in Huntsville and is listed as an adviser to the Heartland Institute, which promotes climate misinformation.I used to give talks at Heartland conferences, but haven’t in recent years. I don’t have a formal relationship with them. I don’t speak for Heartland Institute, but I thoroughly disagree with the claim that they promote “climate misinformation”. That shoe fits Politico much better.
While some of Spencer�s work on atmospheric temperatures and other areas of study has been funded by NASA and the Energy Department, he has attacked federal climate researchers as being biased because they receive taxpayer money, and he has claimed that people alive today won�t experience global warming.On the first point… true. On the second point, I believe what I have said is that most people today will never notice global warming in their lifetimes because it is too weak (about 0.02 deg. C per year) compared to natural climate, seasonal, and day-to-day weather variability.In my book, people who believe they have witnessed human-caused global warming are about as delusional as flat-Earthers.
Spencer also served as a visiting fellow for the Heritage Foundation, which produced the Project 2025 policy proposal that has guided the first months of President Donald Trump�s second term.
The groups Spencer has been affiliated with have received millions of dollars in donations from foundations that oppose regulations, but he claims the American public has �been misled by the vested interests who financially benefit from convincing the citizens we are in a climate crisis.� That includes environmental groups and journalists, in his telling. And I stand by that claim. Look at the artwork at the top of this article, and see if you can figure out what it implies.
�Climate change is big business for a lot of players,� he wrote in a Heritage Foundation publication. �That includes a marching army of climate scientists whose careers now depend on a steady stream of funding from governments.�True.And I have said my career also depends upon that funding.
For years, Spencer has worked with organizations that have received funding from an interlinked network of fossil fuel companies � a multitrillion-dollar global industry � as well as wealthy foundations with billions of dollars in holdings that support groups opposing climate and energy regulations.What are you implying, Scott? That I’ve been paid off by this multitrillion dollar global industry? I know that’s what you are doing. But they have never funded me. At most, I have giving an occasional invited talk, which I receive honoraria for when offered (standard practice, and the same has applied to environmental organizations I have spoken to).
He states on his website that he has not been paid by oil companies, but a court filing in 2016 revealed that he received funding from Peabody Energy, the coal giant that for years spent millions of dollars on funding climate denial groups.That was one of my invited talks: As I recall, it was a Peabody board of directors meeting, and they wanted someone to provide a counterpoint to a Natural Resources Defense Council (NRDC) talk given at the same meeting. Peabody never funded me to do work.
Spencer has appeared before Congress a number of times, typically as a Republican witness attacking climate policy and downplaying climate risks. He served as the climatologist for the late conservative commentator Rush Limbaugh, who regularly promoted climate denialism on his show.Again with the “climate denialism” mantra? You really don’t have a second gear, do you, Scott? I don’t deny “climate”. I don’t even deny recent warming. I don’t even deny that recent warming is probably mostly due to humans.
Like Lomborg, Spencer claims climate policy will hurt the poor even as science has overwhelmingly shown the effects of global warming would disproportionately affect the world�s most vulnerable populations. “Science” has shown no such thing. Opportunistic researchers have indeed made such claims, though. But Lomborg, Epstein, and Roger Pielke Jr. are better at refuting those claims than I am.
He authored a book entitled: �Climate Confusion: How Global Warming Hysteria Leads to Bad Science, Pandering Politicians and Misguided Policies That Hurt the Poor.�
Spencer did not respond to a request for comment.True. I long ago learned which media outlets cannot be trusted to represent what I say fairly.
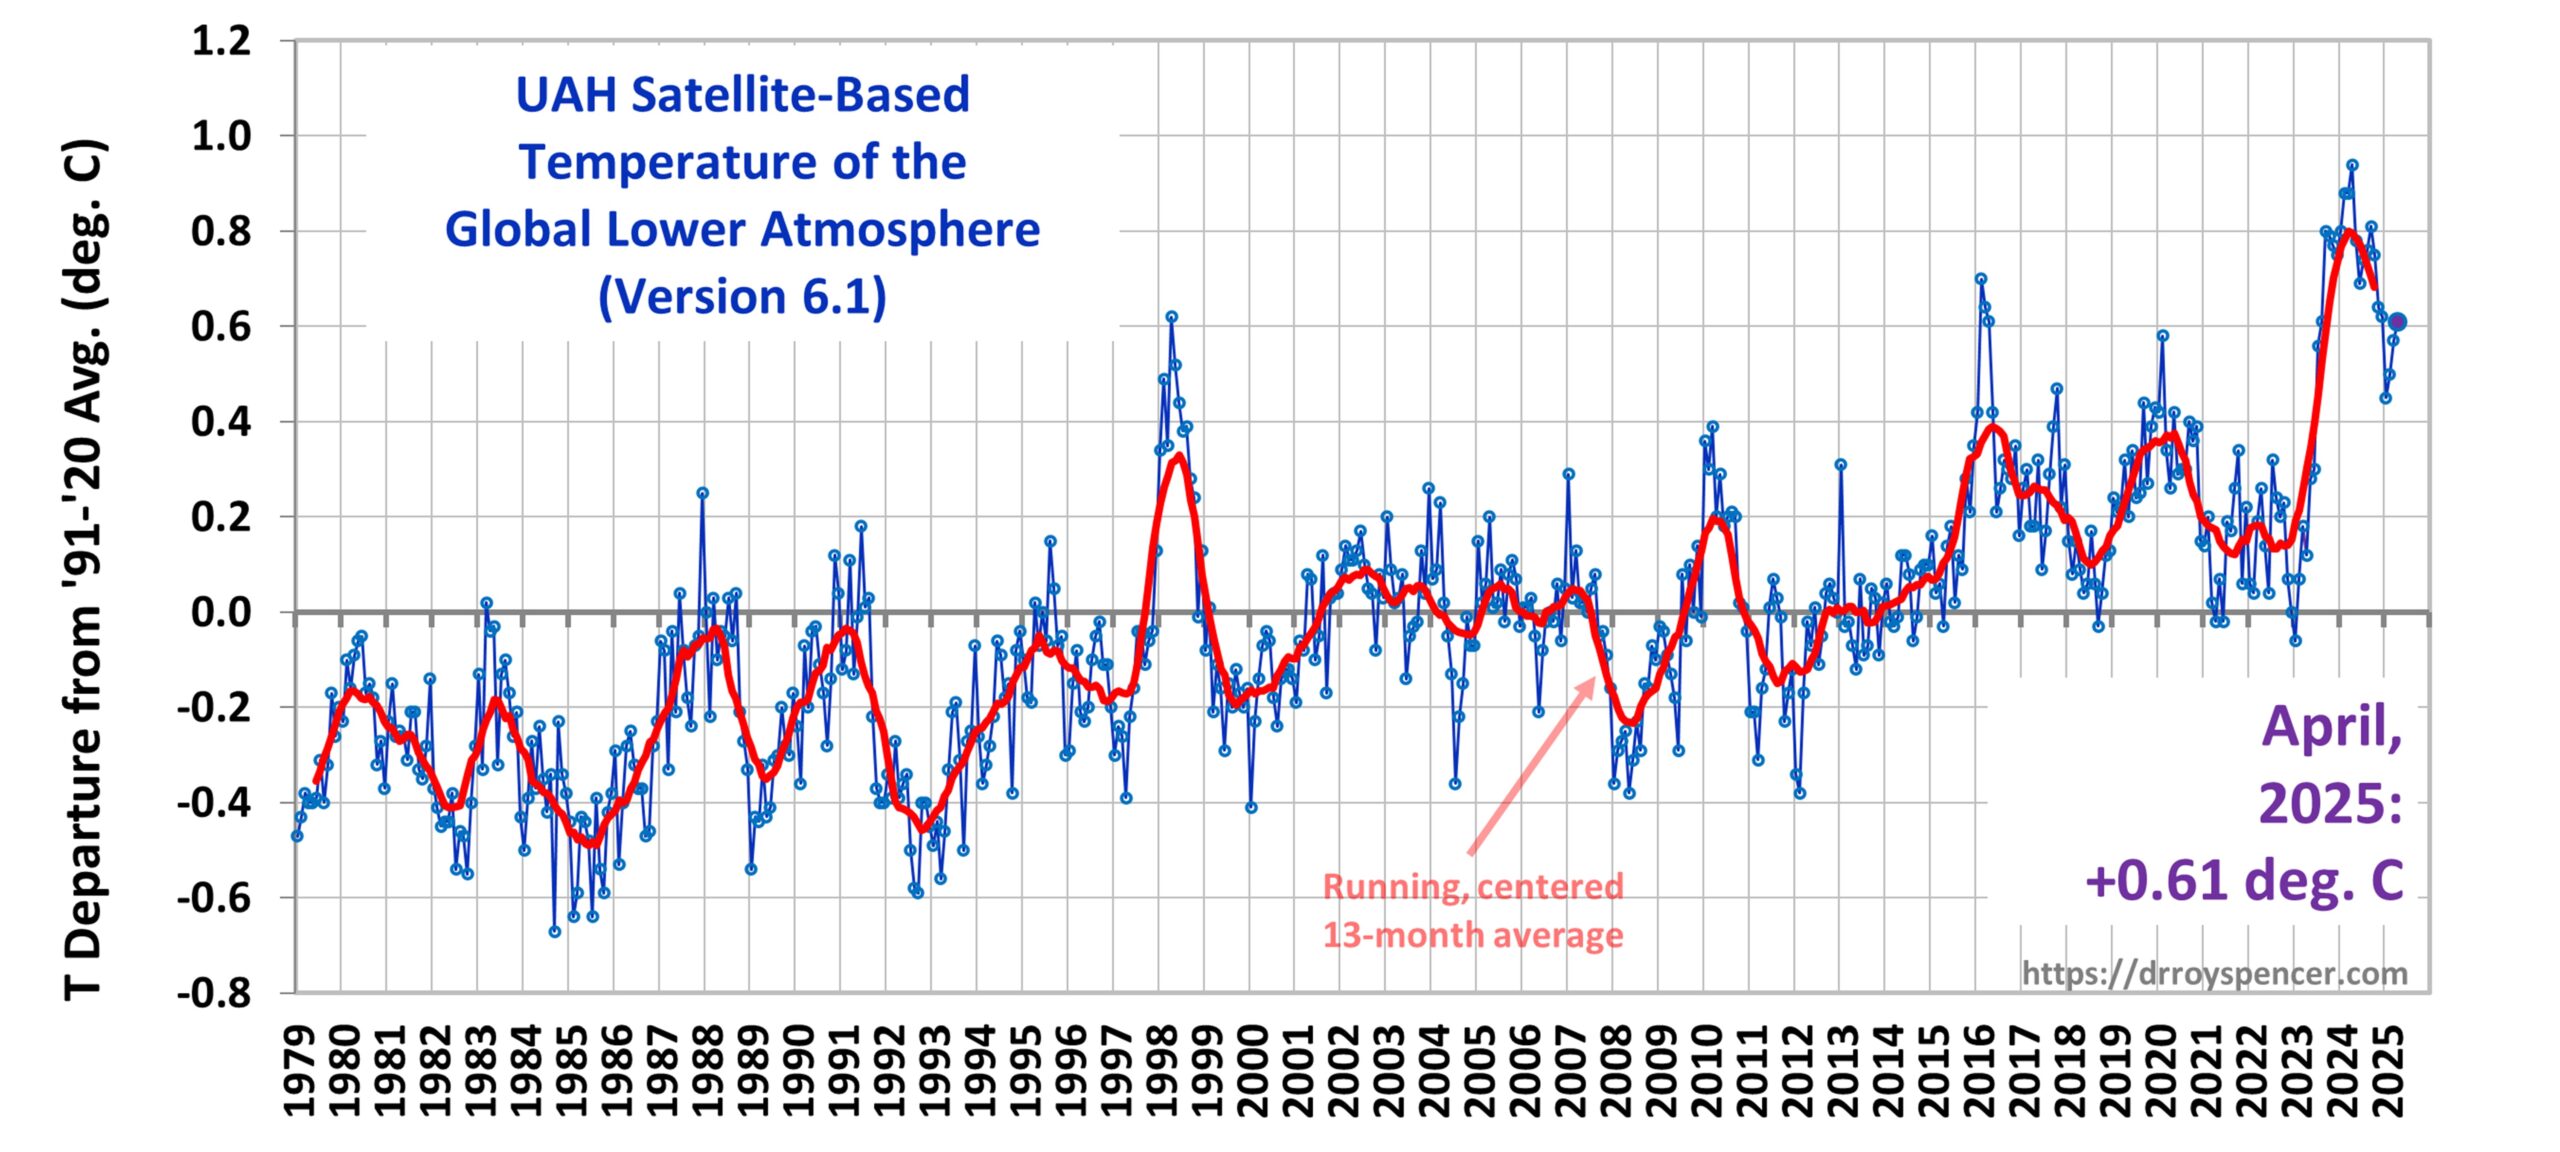
The Version 6.1 global average lower tropospheric temperature (LT) anomaly for April, 2025 was +0.61 deg. C departure from the 1991-2020 mean, up a little from the March, 2025 anomaly of +0.57 deg. C.
The Version 6.1 global area-averaged linear temperature trend (January 1979 through April 2025) remains at +0.15 deg/ C/decade (+0.22 C/decade over land, +0.13 C/decade over oceans).
The following table lists various regional Version 6.1 LT departures from the 30-year (1991-2020) average for the last 16 months (record highs are in red).
YEAR
MO
GLOBE
NHEM.
SHEM.
TROPIC
USA48
ARCTIC
AUST
2024
Jan
+0.80
+1.02
+0.58
+1.20
-0.19
+0.40
+1.12
2024
Feb
+0.88
+0.95
+0.81
+1.17
+1.31
+0.86
+1.16
2024
Mar
+0.88
+0.96
+0.80
+1.26
+0.22
+1.05
+1.34
2024
Apr
+0.94
+1.12
+0.76
+1.15
+0.86
+0.88
+0.54
2024
May
+0.78
+0.77
+0.78
+1.20
+0.05
+0.20
+0.53
2024
June
+0.69
+0.78
+0.60
+0.85
+1.37
+0.64
+0.91
2024
July
+0.74
+0.86
+0.61
+0.97
+0.44
+0.56
-0.07
2024
Aug
+0.76
+0.82
+0.69
+0.74
+0.40
+0.88
+1.75
2024
Sep
+0.81
+1.04
+0.58
+0.82
+1.31
+1.48
+0.98
2024
Oct
+0.75
+0.89
+0.60
+0.63
+1.90
+0.81
+1.09
2024
Nov
+0.64
+0.87
+0.41
+0.53
+1.12
+0.79
+1.00
2024
Dec
+0.62
+0.76
+0.48
+0.52
+1.42
+1.12
+1.54
2025
Jan
+0.45
+0.70
+0.21
+0.24
-1.06
+0.74
+0.48
2025
Feb
+0.50
+0.55
+0.45
+0.26
+1.04
+2.10
+0.87
2025
Mar
+0.57
+0.74
+0.41
+0.40
+1.24
+1.23
+1.20
2025
Apr
+0.61
+0.77
+0.46
+0.37
+0.82
+0.85
+1.21
The full UAH Global Temperature Report, along with the LT global gridpoint anomaly image for April, 2025, and a more detailed analysis by John Christy, should be available within the next several days here.
The monthly anomalies for various regions for the four deep layers we monitor from satellites will be available in the next several days at the following locations:
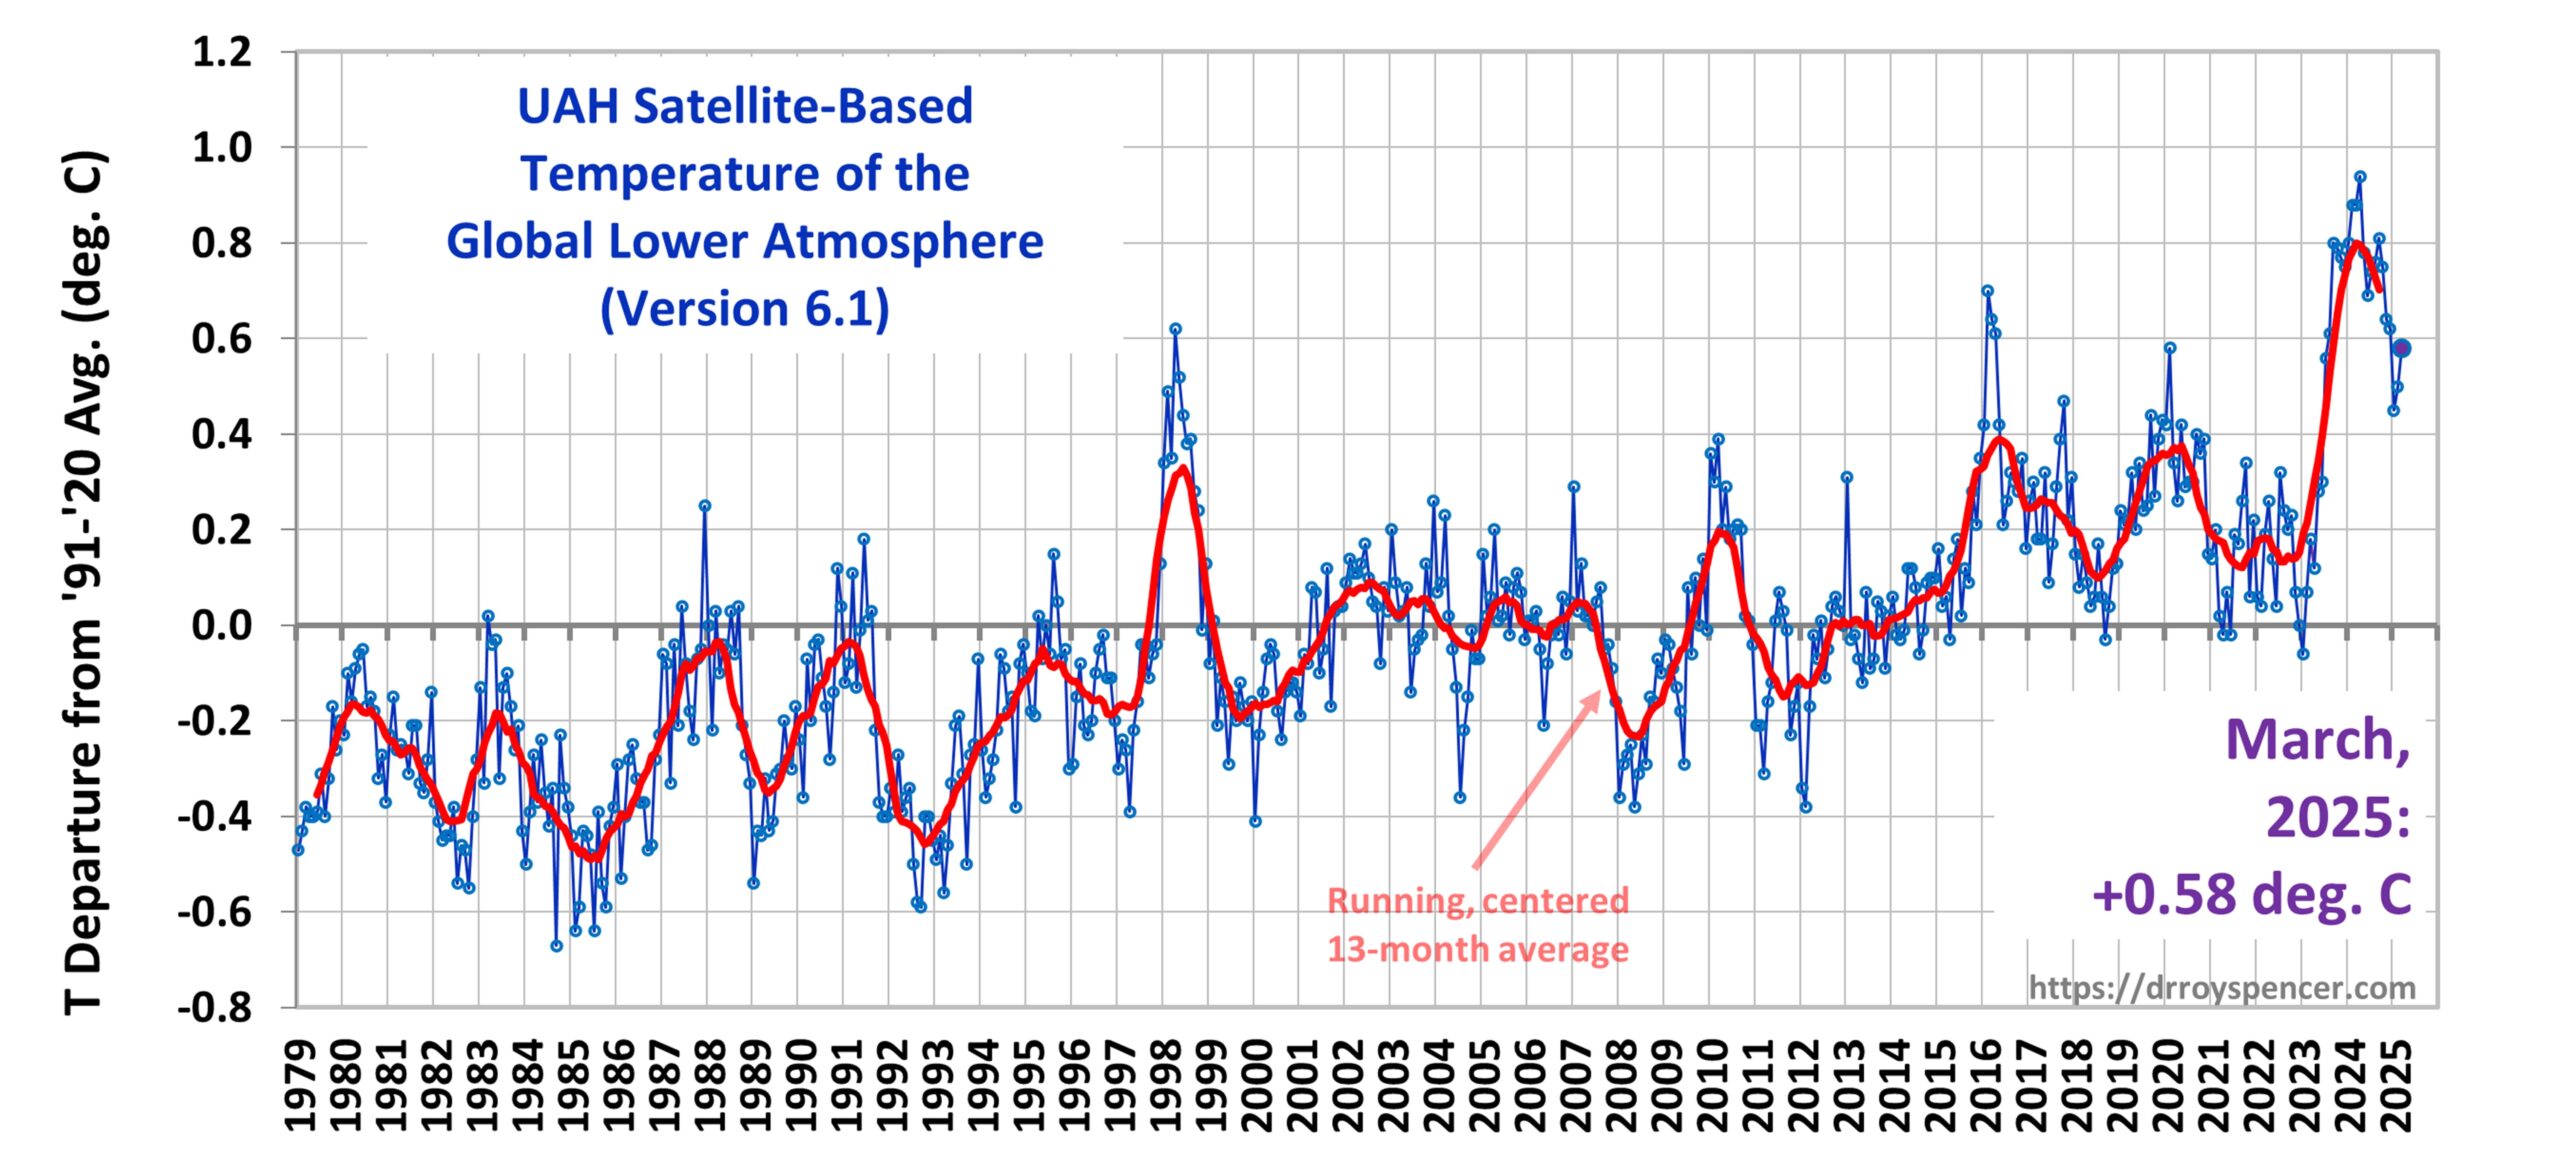
The Version 6.1 global average lower tropospheric temperature (LT) anomaly for March, 2025 was +0.58 deg. C departure from the 1991-2020 mean, up from the February, 2025 anomaly of +0.50 deg. C.
The Version 6.1 global area-averaged linear temperature trend (January 1979 through March 2025) remains at +0.15 deg/ C/decade (+0.22 C/decade over land, +0.13 C/decade over oceans).
The following table lists various regional Version 6.1 LT departures from the 30-year (1991-2020) average for the last 15 months (record highs are in red).
YEAR
MO
GLOBE
NHEM.
SHEM.
TROPIC
USA48
ARCTIC
AUST
2024
Jan
+0.80
+1.02
+0.58
+1.20
-0.19
+0.40
+1.12
2024
Feb
+0.88
+0.95
+0.81
+1.17
+1.31
+0.86
+1.16
2024
Mar
+0.88
+0.96
+0.80
+1.26
+0.22
+1.05
+1.34
2024
Apr
+0.94
+1.12
+0.76
+1.15
+0.86
+0.88
+0.54
2024
May
+0.78
+0.77
+0.78
+1.20
+0.05
+0.20
+0.53
2024
June
+0.69
+0.78
+0.60
+0.85
+1.37
+0.64
+0.91
2024
July
+0.74
+0.86
+0.61
+0.97
+0.44
+0.56
-0.07
2024
Aug
+0.76
+0.82
+0.69
+0.74
+0.40
+0.88
+1.75
2024
Sep
+0.81
+1.04
+0.58
+0.82
+1.31
+1.48
+0.98
2024
Oct
+0.75
+0.89
+0.60
+0.63
+1.90
+0.81
+1.09
2024
Nov
+0.64
+0.87
+0.41
+0.53
+1.12
+0.79
+1.00
2024
Dec
+0.62
+0.76
+0.48
+0.52
+1.42
+1.12
+1.54
2025
Jan
+0.45
+0.70
+0.21
+0.24
-1.06
+0.74
+0.48
2025
Feb
+0.50
+0.55
+0.45
+0.26
+1.04
+2.10
+0.87
2025
Mar
+0.58
+0.74
+0.41
+0.40
+1.25
+1.23
+1.20
The full UAH Global Temperature Report, along with the LT global gridpoint anomaly image for March, 2025, and a more detailed analysis by John Christy, should be available within the next several days here.
The monthly anomalies for various regions for the four deep layers we monitor from satellites will be available in the next several days at the following locations:
While some among us continue to be distracted by supposed “chemtrails” high in the atmosphere, lurking right under our noses has been the ultimate conspiracy: Cartrails.
Modern cars are programmed to emit cartrails, containing nefarious and noxious chemicals. As many people can attest, breathing problems become worse in cities where these vehicles-emitting-deadly-vapour-trails are most concentrated.
This never happened many years ago; I know because my grandfather (who was born in the late 1800s) once told me they NEVER had cartrails back when he was a kid.
So, what kinds of chemicals are they poisoning us with? Well, many years ago it was lead in gasoline. But we found out about that conspiracy, which was meant to destroy the nervous systems of our children. So, what was lead replaced with?
That’s an interesting story. My confidential whistleblower (who must remain nameless for fear of retribution) tells me that the government people got together with the car manufacturing people and the petroleum refining people, and they found a NEW way to poison us: platinum, palladium and rhodium microparticles inside super-heated boxes innocuously called “catalytic converters”.
Do you know what palladium microparticles do to the human nervous system??
Well, neither do I. But I’m sure it isn’t good.
The opportunity to poison us with our own cars is SO much more efficient than “chemtrails”. First, the poisoning occurs right here at ground-level, where we breathe the air into our fragile lungs.
Secondly, the amount of fuel used by cars and trucks is many times that used by jet aircraft, thus increasing the human exposure.
Finally, the emissions are nearly invisible on most days. How sinister is that?? Invisible pollution!
And this is why they make jet aircraft emit so much water vapor (which produces cirrus clouds). It’s to keep people distracted with chemtrail theories so that we don’t realize the real threat is right under our noses: Cartrails. You heard it here first. Spread the word. Start a cartrail blog. Vent your fears and frustrations on social media. Go for it.
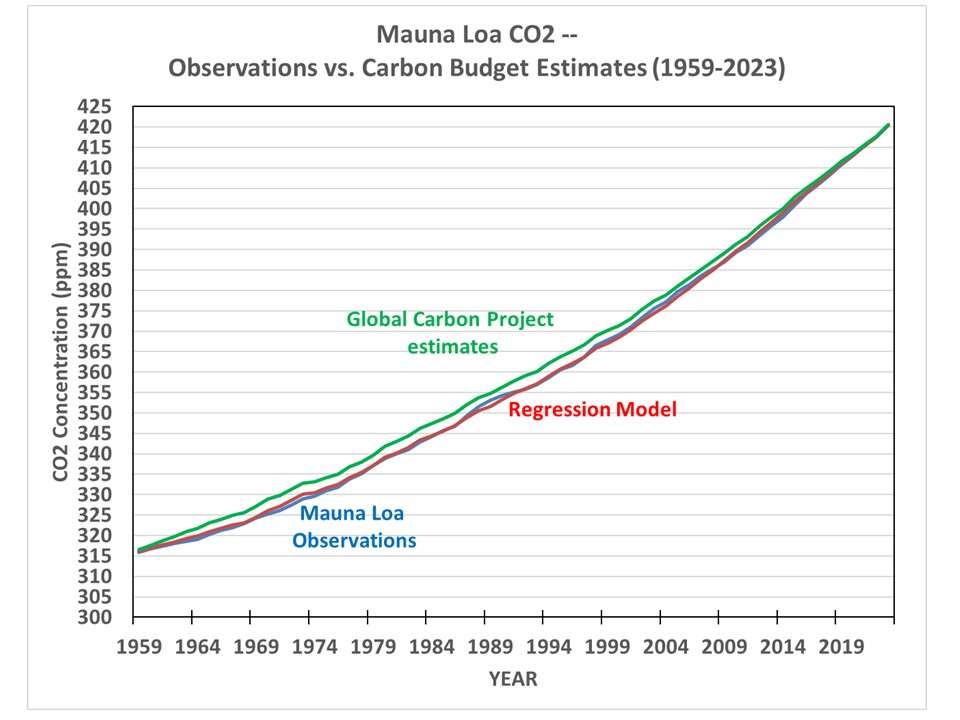
By choosing the “best” models and estimates of CO2 fluxes (those which best explain year-to-year changes in atmospheric CO2 content as measured at Mauna Loa, HI) for the period 1959-2023 as provided by the Global Carbon Project, a multiple linear regression of yearly Mauna Loa CO2 changes against those “best” estimates of sources and sinks leads to the following alterations to the “official ” Global Carbon Project estimates of the sources and sinks leading to the observed rise in atmospheric CO2. (NOTE: being a statistical exercise, this does not constitute “proof”… these are just some areas that carbon budget modelers might want to look into when tweaking their models):
Global anthropogenic CO2 emissions appear to be 30% larger than reported (I find this hard to believe… again, statistics are not necessarily proof).
The Land Sink of CO2 has been underestimated by an average of about 25%
The Ocean Sink of CO2 has been overestimated by about 20% (I don’t know whether they include CO2 outgassing).
The Land Use source of CO2 (primarily biomass burning) has been overestimated by about a factor of 2 (very uncertain)
The cement carbonation sink has been underestimated by about a factor of 7 (very uncertain)
There is a remaining unknown CO2 sink that has averaged 0.2 ppm/yr during 1959-2023 (this could just be a residual of other statistical errors).
Background
Many researchers have spent their careers trying to estimate the various global sources and sinks of atmospheric CO2. The main net sources are anthropogenic emissions (including cement production) and land use (mainly biomass burning). The main CO2 sinks are land (vegetation and soil storage), the ocean (mixing the “excess” atmospheric CO2 downward… biological uptake remains largely unknown), and cement carbonation (old cement absorbs atmospheric CO2).
The Global Carbon Project (GCP) periodically summarizes various estimates of these sources and sinks and produces easily-accessible spreadsheets of the data. I suppose for political expediency (don’t insult your peers), the GCP (like the IPCC does for climate models) just takes virtually all of the estimates of CO2 fluxes and averages them together to produce a single “best” estimate of specific fluxes on a yearly basis. For example, they average 20 (!) different land models results for yearly net CO2 fluxes into the land surface (I say “into” because the current atmospheric “excess” of CO2, around 50% above pre-Industrial levels, causes the land and ocean to be net sinks of CO2).
What I Did
But since I am not part of the global carbon budget research community, I can pick and choose which models and data-based estimates I use. Some of these models are better than others at explaining the yearly increase in atmospheric CO2 at Mauna Loa, Hawaii, and here I will provide an analysis using only the best estimates.
(Now, some researchers believe that an average of all estimates will be better than any individual estimates. I don’t believe that… and neither should you. As a simple example, you can’t make a better estimate of something by averaging a good estimate with a bad estimate.)
So, what I did was to examine how well each individual model estimate (or sometimes an observational estimate) helped to explain the yearly CO2 increases at Mauna Loa. I then chose the best ones, and averaged them together. Then I regresses the yearly CO2 changes at Mauna Loa against these averages. As Fig. 1 shows, this produces a much better estimate of the Mauna Loa CO2 record than the GCP estimates of CO2 fluxes based upon all available estimates from various sources.
Now, to be fair, part of this better agreement comes from the statistical regression. The GCP estimates (quite admirably) use all of the available estimates based upon physics and parameterizations, and then sees how well the results match the Mauna Loa record. And they even include the yearly “residual” in their spreadsheet to show how well (or how poorly) the models fit the data. Kudos.
But I used the best models and estimates, and then use multiple linear regression, to see how closely the data can be fit to the Mauna Loa observations. Again, the year-to-year changes in observed CO2 concentrations are statistically related to the sources and sinks of CO2 which come from (1) anthropogenic emissions, (2) land use emissions, (3) land vegetative and soil uptake, (4) ocean uptake, and (5) cement carbonation (old cement removes CO2 from the atmosphere).
The results give a total regression model explained variance of 81%. The regression coefficients tell us whether the individual CO2 budget terms (sources and sinks of CO2) have been underestimated or overestimated. If the terms equal +1 (for sources) or -1 (for sinks), then the model estimates of the yearly CO2 sources and sinks are (on average) unbiased in their explanation of yearly CO2 changes at Mauna Loa.
Again I emphasize that such statistical results can be misleading. Errors in one term’s regression coefficient can cause errors in other terms’ coefficients. But regression analysis can also sometimes can reveal insights into what physics might be missing. I have seen both in my 40 years of doing such calculations.
Here are the results:
Global Anthropogenic Emissions: Coefficient = 1.3 (+/-0.22) This suggests anthropogenic emissions have been underestimated by about 30%. I find this hard to believe. Energy use is pretty well known. Maybe the cement production source has been underestimated?
Global Land Use: Coefficient = 0.43 (+/-0.45) This suggests land use emissions have been overestimated (but the coefficient uncertainty is large). Also, if there is little skill in a term, a lower coefficient will result due to the “regression to the mean” effect. This result suggests to me that yearly land use as a source of CO2 remains very uncertain.
Global Land Sink: Coefficient = -1.26 (+/-0.16). This suggests the land (mainly vegetation) sink has been underestimated by maybe 25%. The error is the coefficient is pretty small, so I think this result is significant.
Global Ocean Sink: Coefficient = -0.80 (+/- 0.49) This suggests the ocean sink has been overestimated (but with rather large uncertainty) by about 20%. I haven’t looked at whether these ocean models include CO2 outgassing as the temperature rises (a small effect). I’m not convinced that this coefficient is significantly different than 1.0, which would be the case if the models are unbiased in their estimates of the ocean sink.
Cement Carbonation Sink: (-7.3 +/-4.9) This suggests the CO2 uptake by old cement has been greatly underestimated (but with large uncertainty). This is a surprisingly large number, and I don’t know what to make of it.
I’m not convinced of most of these conclusions, except maybe the vegetation sink of CO2 being underestimated by the models. There have been recent papers published finding some vegetation uptake processes have been underestimated by the models.
The global anthropogenic emissions source being underestimated is also intriguing. Being greater than 1, the 1.3 coefficient is the opposite of what we would get from regression if the yearly anthropogenic emissions estimates were poor. So, I’m inclined to believe this is real.
Anyway, this was an quick-and-dirty exercise. Maybe 4 hours of my time. You can access the GCP data spreadsheet here.
P.S. I’m sure someone will ask about adding various natural factors: for example, global surface temperature (land and/or ocean). Yes, that can be done.

 Home/Blog