SUMMARY: The Urban Heat Island (UHI) is shown to have affected U.S. temperature trends in the official NOAA 1,218-station USHCN dataset. I argue that, based upon the importance of quality temperature trend calculations to national energy policy, a new dataset not dependent upon the USHCN Tmax/Tmin observations is required. I find that regression analysis applied to the ISD hourly weather data (mostly from airports) between many stations’ temperature trends and local population density (as a UHI proxy) can be used to remove the average spurious warming trend component due to UHI. Use of the hourly station data provides a mostly USHCN-independent measure of the U.S. warming trend, without the need for uncertain time-of-observation adjustments. The resulting 311-station average U.S. trend (1973-2020), after removal of the UHI-related spurios trend component, is about +0.13 deg. C/decade, which is only 50% the USHCN trend of +0.26 C/decade. Regard station data quality, variability among the raw USHCN station trends is 60% greater than among the trends computed from the hourly data, suggesting the USHCN raw data are of a poorer quality. It is recommended that an de-urbanization of trends should be applied to the hourly data (mostly from airports) to achieve a more accurate record of temperature trends in land regions like the U.S. that have a sufficient number of temperature data to make the UHI-vs-trend correction.
The Urban Heat Island: Average vs. Trend Effects
In the last 50 years (1970-2020) the population of the U.S. has increased by a whopping 58%. More people means more infrastructure, more energy consumption (and waste heat production), and even if the population did not increase, our increasing standard of living leads to a variety of increases in manufacturing and consumption, with more businesses, parking lots, air conditioning, etc.
As T.R. Oke showed in 1973 (and many others since), the UHI has a substantial effect on the surface temperatures in populated regions, up to several degrees C. The extra warmth comes from both waste heat and replacements of cooler vegetated surfaces with impervious and easily heated hard surfaces. The effects can occur on many spatial scales: a heat pump placed too close to the thermometer (a microclimate effect) or a large city with outward-spreading suburbs (a mesoscale effect).
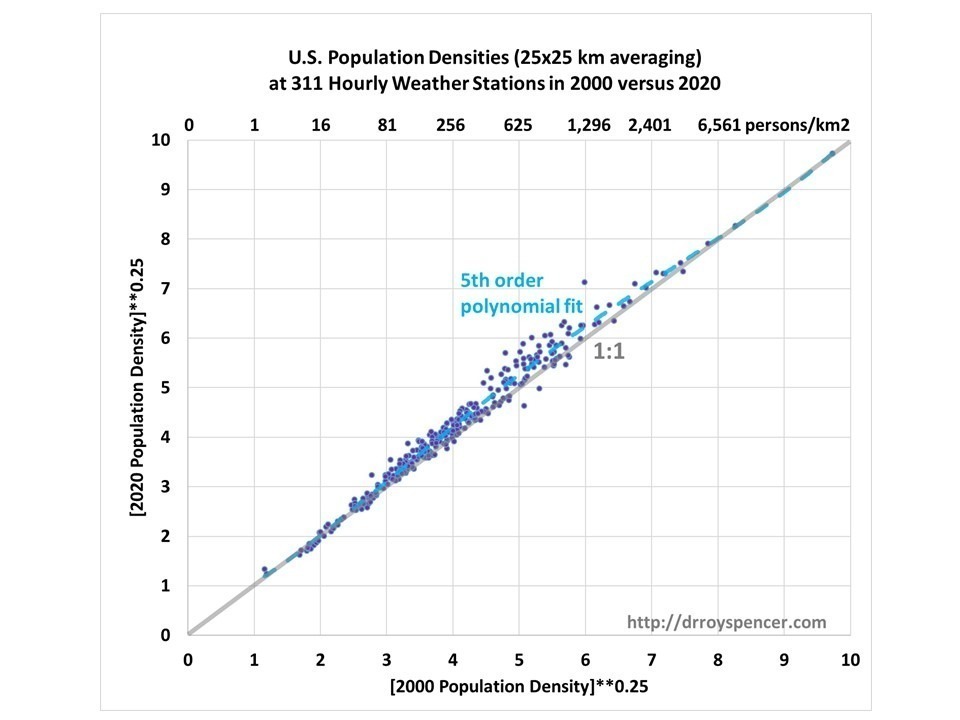
In the last 20 years (2000 to 2020) the increase in population has been largely in the urban areas, with no average increase in rural areas. Fig. 1 shows this for 311 hourly weather station locations that have relatively complete weather data since 1973.

Fig. 1. U.S. population increases around hourly weather stations have been in the more populated areas (except for mostly densely populated ones), with no increase in rural areas.
This might argue for only using rural data for temperature trend monitoring. The downside is that there are relatively few station locations which have population densities less than, say, 20 persons per sq. km., and so the coverage of the United States would be pretty sparse.
What would be nice is that if the UHI effect could be removed on a regional basis based upon how the average warming trends increase with population density. (Again, this is not removal of the average difference in temperature between rural and urban areas, but the removal of spurious temperature trends due to UHI effects).
But does such a relationship even exist?
UHI Effects on the USHCN Temperature Trends (1973-2020)
The most-cited surface temperature dataset for monitoring global warming trends in the U.S. is the U.S. Historical Climatology Network (USHCN). The dataset has a fixed set of 1,218 stations which have records extending back over 100 years. Because most of the stations’ data consist of daily maximum and minimum temperatures (Tmax and Tmin) measured at a single time daily, and that time of observation (TOBs) changed around 1960 from the late afternoon to the early morning (discussion here), there was a TOBs-related temperature bias that occurred, which is somewhat uncertain in magnitude but still must be adjusted for.
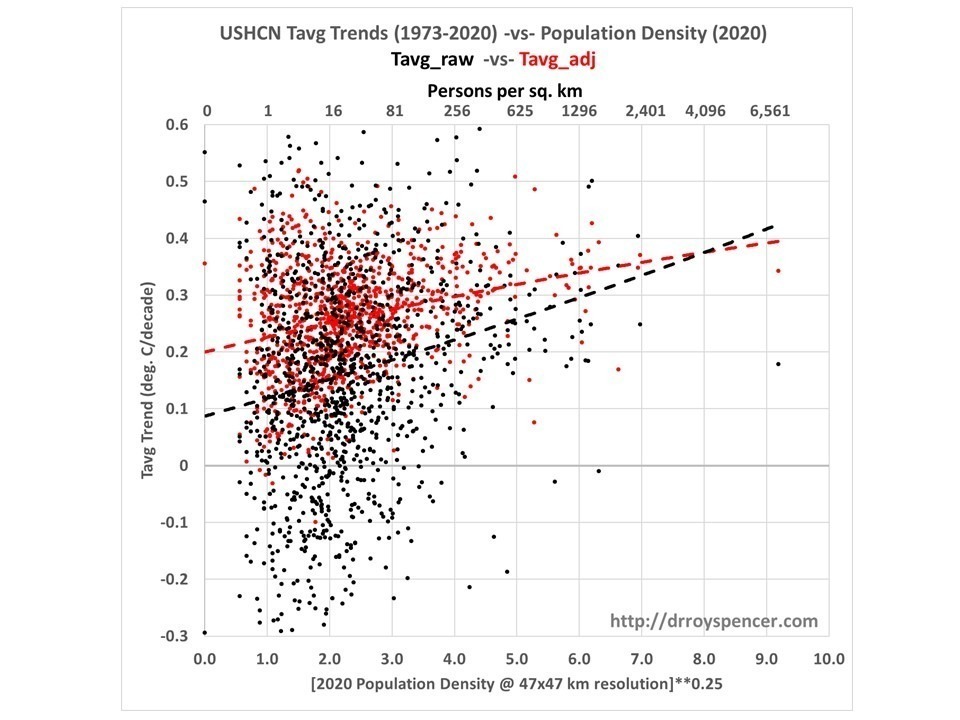
NOAA makes available both the raw unadjusted, and adjusted (TOBs & spatial ‘homogenization’) data. The following plot (Fig. 2) shows how both of the datasets’ station temperature trends are correlated with the population density, which should not be the case if UHI effects have been removed from the trends.

Fig.2. USHCN station temperature trends are correlated with population density, which should not be the case if the Urban Heat Island effect on trends has been removed.
Any UHI effect on temperature trends would be difficult to remove through NOAA’s homogenization procedure alone. This is because, if all stations in a small area, both urban and rural, are spuriously warming from UHI effects, then that signal would not be removed because it is also what is expected for global warming. ‘Homogenization’ adjustments can theoretically make the rural and urban trends look the same, but that does not mean the UHI effect has been removed.
Instead, one must examine the data in a manner like that in Fig. 2, which reveals that even the adjusted USHCN data (red dots) still have about a 30% overestimate of U.S. station-average trends (1973-2020) if we extrapolate a regression relationship (red dashed line, 2nd order polynomial fit) to zero population density. Such an analysis, however, requires many stations (thus large areas) to measure the average effect. It is not clear just how many stations are required to obtain a robust signal. The greater the number of stations needed, the larger the regional area required.
U.S. Hourly Temperature Data as an Alternative to USHCN
There are many weather stations in the U.S. which are (mostly) not included in the USHCN set of 1,218 stations. These are the operational hourly weather stations operated by NWS, FAA, and other agencies, and which provide most of the data the National Weather Service reports to you. The data are included in the multi-agency Integrated Surface Database (ISD) archive.
The data archive is quite large, since it has (up to) hourly resolution data (higher with ‘special’ observations during changing weather) and many weather variables (temperature, dewpoint, wind, air pressure, precipitation) for many thousands of stations around the world. Many of the stations (at least in the U.S.) are at airports.
In the U.S., most of these measurements and their reporting are automated now, with the AWOS and ASOS systems.
This map shows all of the stations in the archive, although many of these will not have full records for whatever decades of time are of interest.

Fig. 3. Locations of ISD surface weather data quality-controlled and stored at NOAA.
The advantage of these data, at least in the United States, is that the equipment is maintained on a regular basis. When I worked summers at a National Weather Service office in Michigan, there was a full-time ‘met-tech’ who maintained and adjusted all of the weather-measuring equipment.
Since the observations are taken (nominally) at the top of the hour, there is no uncertain TOBs adjustment necessary as with the USHCN daily Tmax/Tmin data.
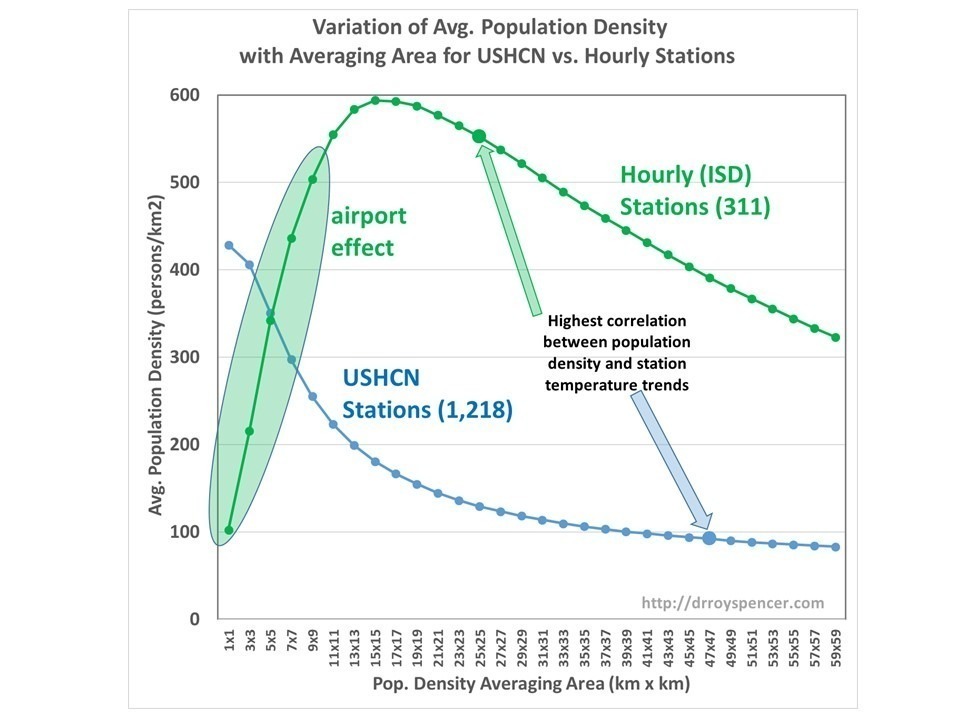
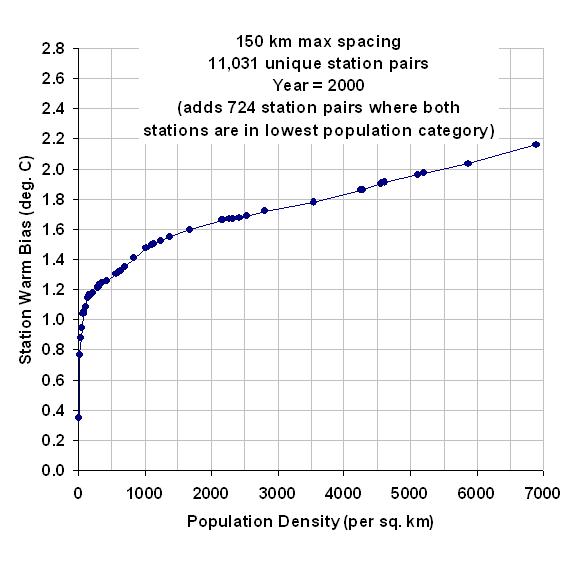
The average population density environment is markedly different between the ISD (‘hourly’) stations and the USHCN stations, as is shown in Fig. 4.
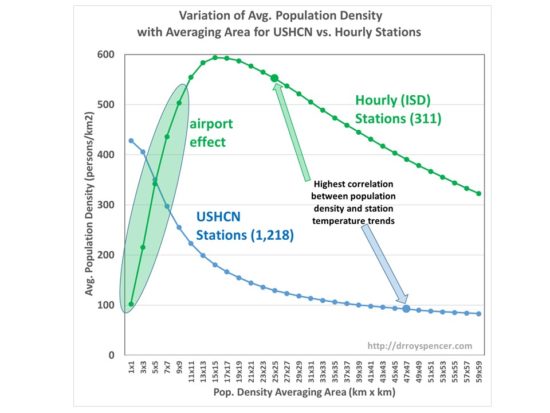
Fig. 4. The dependence of U.S. weather station population density on averaging area is markedly different between 1,218 USHCN and 311 high-quality ISD (‘hourly’) stations, mainly due to the measurement of the hourly data at “uninhabited” airports to support aviation safety.
In Fig. 4 we see that the population density in the immediate vicinity of the ISD stations averages only 100 people in the immediate 1 sq. km area since no one ‘lives’ at the airport, but then increases substantially with averaging area since airports exist to serve population centers.
In contrast, the USHCN stations have their highest population density right in the vicinity of the weather station (over 400 persons in the first sq. km), which then drops off with distance away from the station location.
How such differences affect the magnitude of UHI-dependent spurious warming trends is unknown at this point.
UHI Effects on the Hourly Temperature Data
I have analyzed the U.S. ISD data for the lower-48 states for the period 1973-2020. (Why 1973? Because many of the early records were on paper, and at hourly time resolution, that represents a lot of manual digitizing. Apparently, 1973 is as far back as many of those stations data were digitized and archived).
To begin with, I am averaging only the 00 UTC and 12 UTC temperatures (approximately the times of maximum and minimum temperatures in the United States). I required those twice-daily measurements to be reported on at least 20 days in order for a month to be considered for inclusion, and then at least 10 of 12 months from a station to have good data for a year of that station’s data to be stored.
Then, for temperature trend analysis, I required that 90% of the years 1973-2020 to have data, including the first 2 years (1973, 1974) and the last 2 years (2019-2020), since end years can have large effects on trend calculations.
The resulting 311 stations have an 8.7% commonality with the 1,218 USHCN stations. That is, only 8.7% of the (mostly-airport) stations are also included in the 1,218-station USHCN database, so the two datasets are mostly (but not entirely) independent.
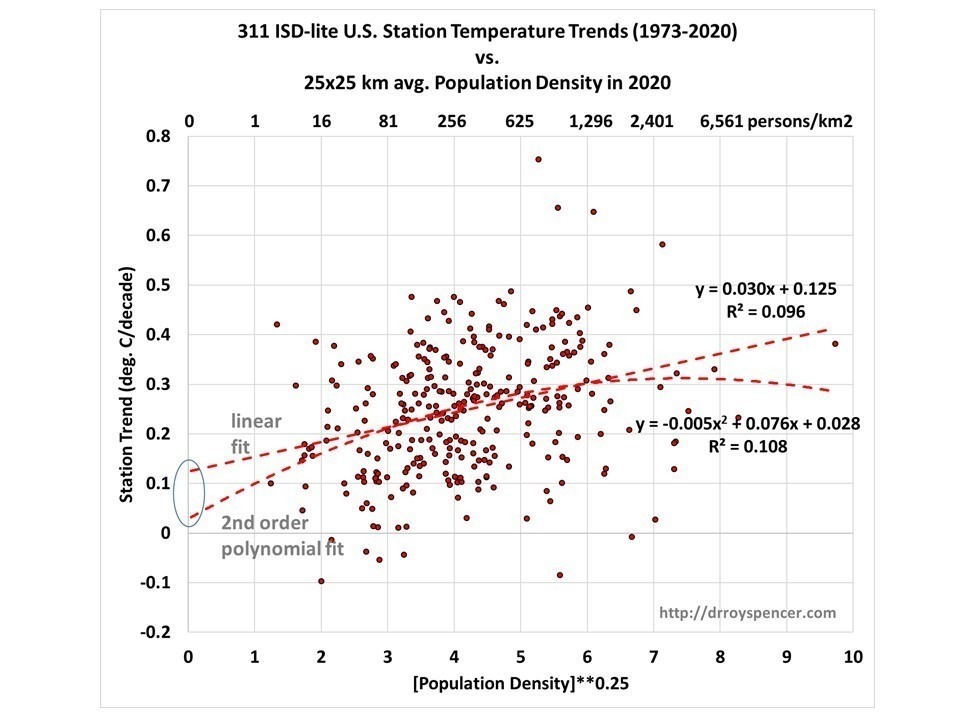
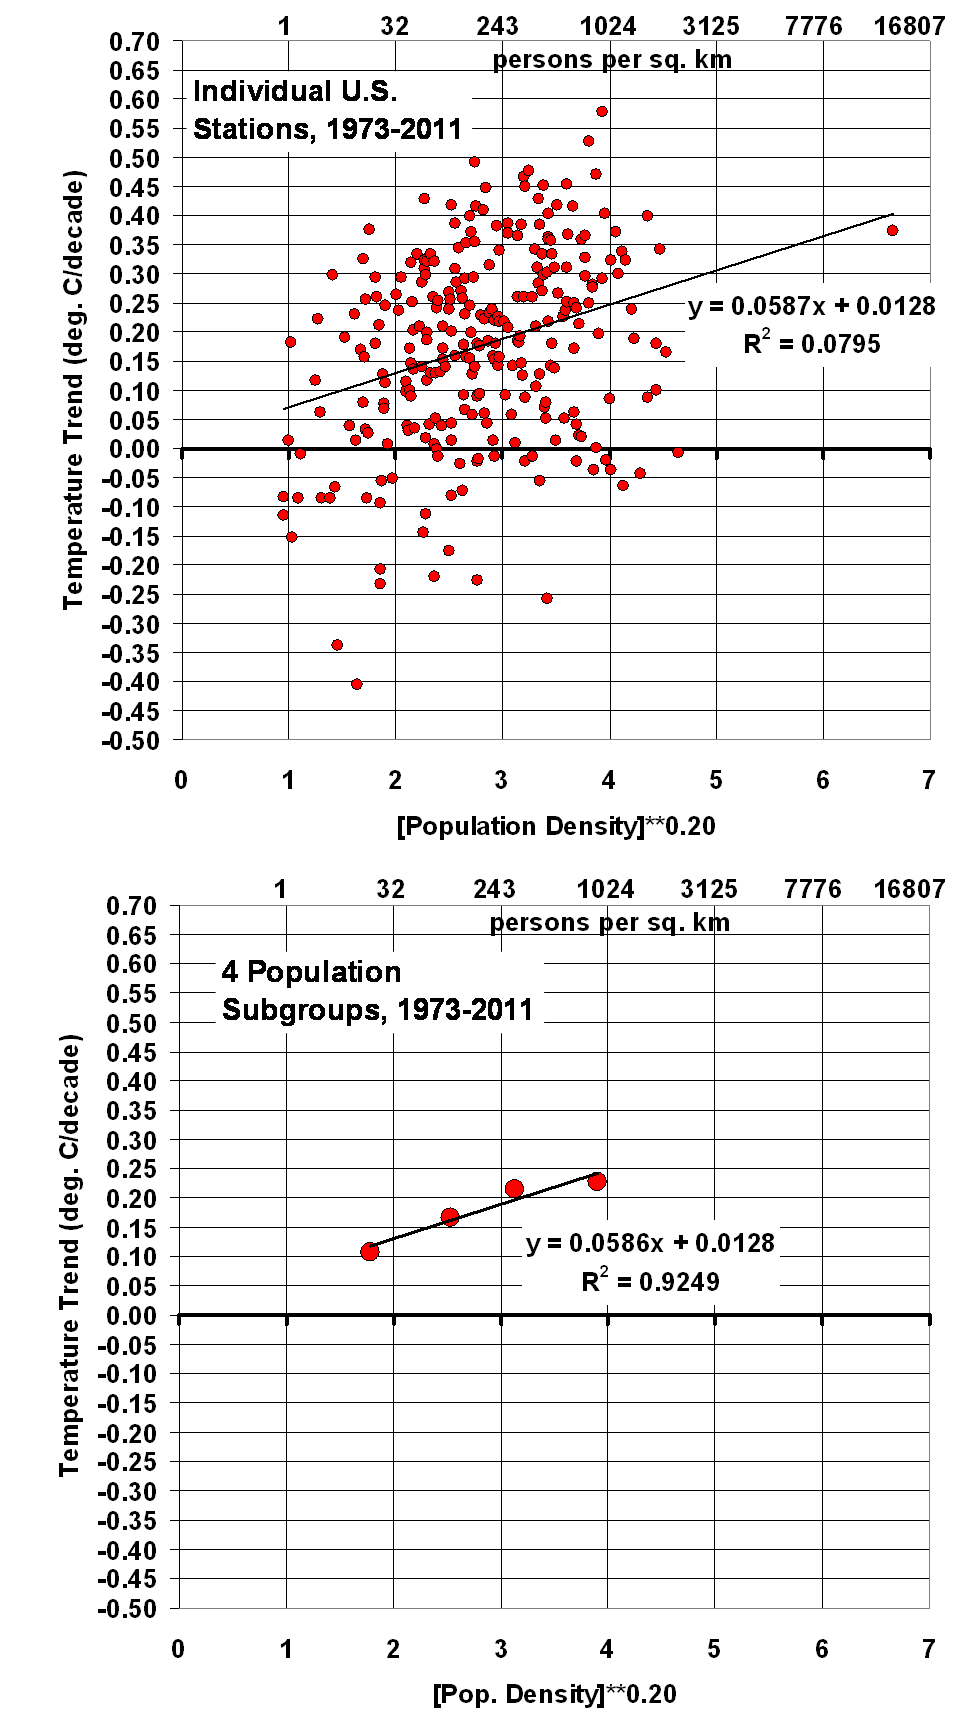
I then plotted the Fig. 2 equivalent for the ISD stations (Fig. 5).

Fig. 5. As in Fig. 2, but for the ISD (mostly airport) station trends for the average of daily 00 and 12 UTC temperatures. Where the regression lines intercept the zero population axis is an estimate of the U.S. temperature trend during 1973-2020 with spurious UHI trend effects removed.
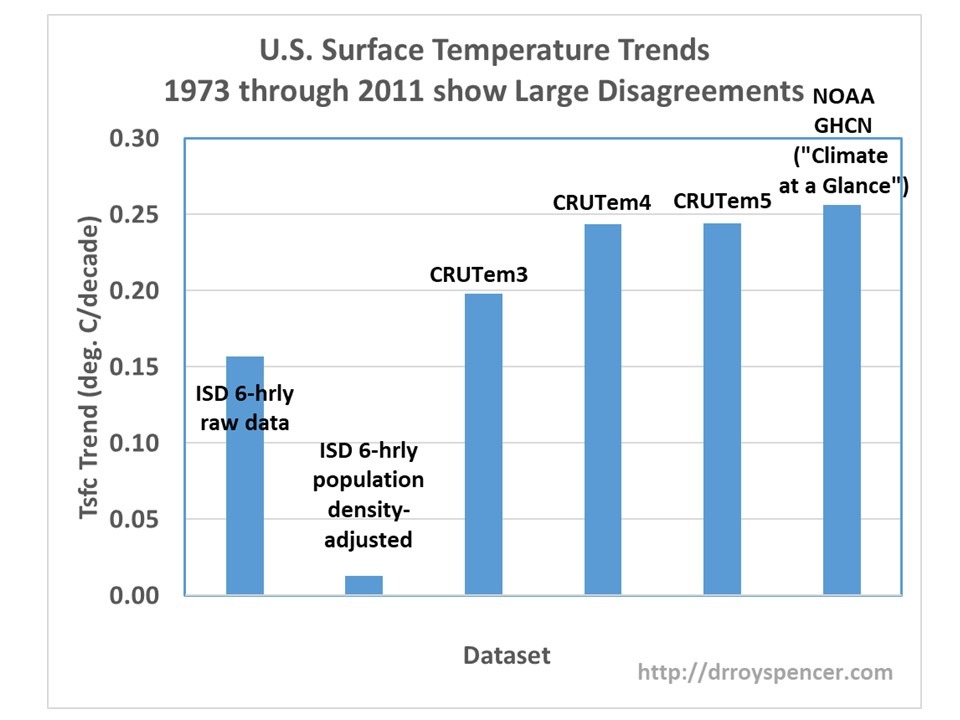
We can see for the linear fit to the data, extrapolation of the line to zero population density gives a 311-station average warming trend of +0.13 deg. C/decade.
Significantly, this is only 50% of the USHCN 1,218-station official TOBs-adjusted, homogenized average trend of +0.26 C/decade.
It is also significant that this 50% reduction in the official U.S temperature trend is very close to what Anthony Watts and co-workers obtained in their 2015 analysis using the very best-sited USHCN stations.
I also include the polynomial fit in Fig. 5, since my use of the fourth root of the population density is not meant to perfectly capture the nonlinearity of the UHI effect, and some nonlinearity can be expected to remain. In that case, the extrapolated warming trend at zero population density is close to zero. But for the purpose of the current discussion, I will conservatively use the linear fit in Fig. 5. (The logarithm of the population density is sometimes also used, but is not well behaved as the population approaches zero.)
Evidence that the raw ISD station trends are of higher quality than those from UHCN is in the standard deviation of those trends:
Std. Dev. of 1,218 USHCN (raw) trends = +0.205 deg. C/decade
Std. Dev. of 311 ISD (‘hourly’) trends = +0.128 deg. C/decade
Thus, the variation in the USHCN raw trends is 60% greater than the variation in the hourly station trends, suggesting the airport trends have fewer time-changing spurious temperature influences than do the USHCN station trends.
Conclusions
For the period 1973-2020:
- The USHCN homogenized data still have spurious warming influences related to urban heat island (UHI) effects. This has exaggerated the global warming trend for the U.S. as a whole. The magnitude of that spurious component is uncertain due to the black-box nature of the ‘homogenization’ procedure applied to the raw data.
- An alternative analysis of U.S. temperature trends from a mostly independent dataset from airports suggests that the U.S. UHI-adjusted average warming trend (+0.13 deg. C/decade) might be only 50% of the official USHCN station-average trend (+0.26 deg. C/decade).
- The raw USHCN trends have 60% more variability than the raw airport trends, suggesting higher quality of the routinely maintained airport weather data.
Future Work
This is an extension of work I started about 8 years ago, but never finished. John Christy and I are discussing using results based upon this methodology to make a new U.S. surface temperature dataset which would be updated monthly.
I have only outlined the very basics above. One can perform similar calculations in sub-regions (I find the western U.S. results to be similar to the eastern U.S. results). Also, the results would probably have a seasonal dependence in which case that should be calculated by calendar month.
Of course, the methodology could also be applied to other countries.

 Home/Blog