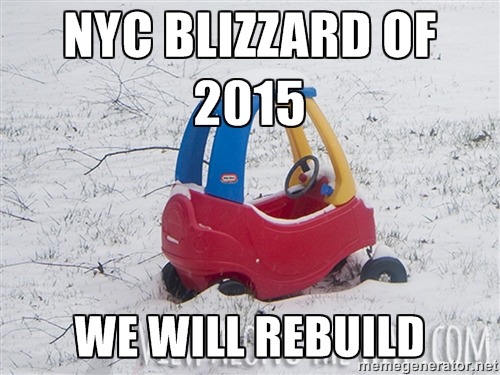
 It was going to be epic. The worst evah. Two feet of snow or more for New York City with blizzard conditions.
But as I blogged about yesterday, the forecast uncertainty with this particular storm was unusually large. As early as yesterday noon it was looking like NYC might only get 6-12 inches.
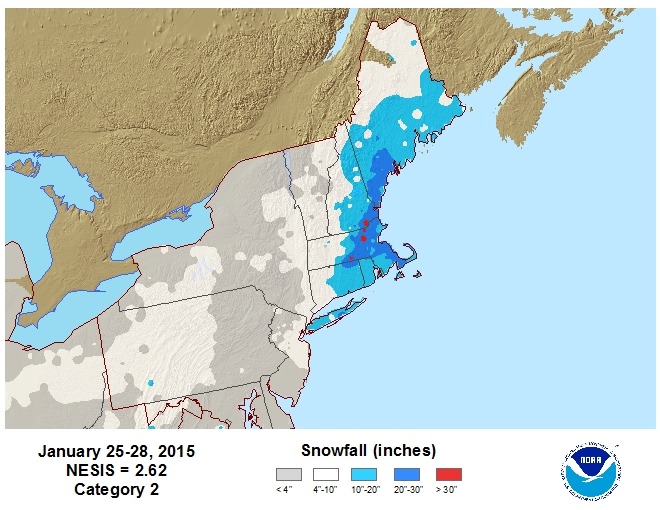
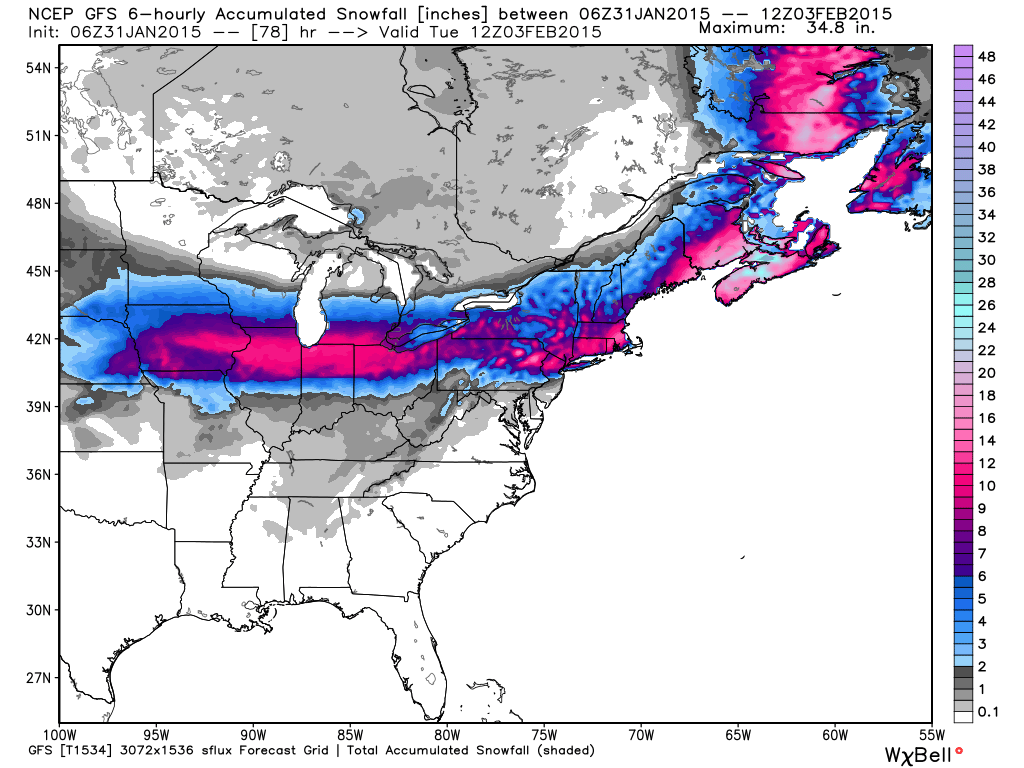
Yes, we probably will see some snowfall records for the date broken well east of NYC, which is not that hard to do. But it�s now looking like the 12+ inch snowfalls will be restricted to eastern Massachusetts, Rhode Island, Connecticut, portions of Long Island, Vermont, New Hampshire, and Maine. All-time record snowfalls look unlikely.
Nantucket had winds gusting to 70 mph overnight, but that�s normal weather for those hardy souls. Blizzard conditions are occurring over much of the area just listed above.
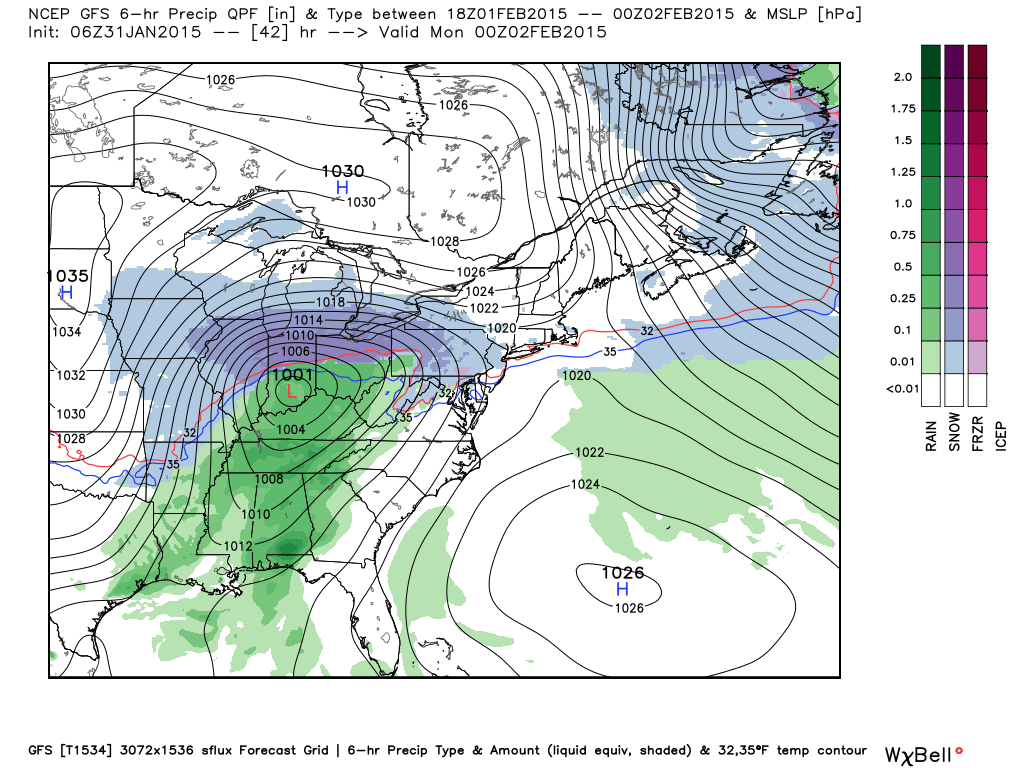
So, a winter nor�easter with snow. How unusual!
Global Warming Causes Whatever We Feel Like it Causes
Despite the official IPCC view that there is no obvious connection between winter storms and Climate Change(TM), several of the usual suspects couldn�t even wait for the storm to hit before they blamed the calamity on your SUV. Bill Nye the Bow Tied Wise Guy. Kevin Trenberth.
Bill Nye even used the opportunity to blame (relatively weak) Santa Ana winds in California on global warming. Really, Bill? He also made it sound like he was the first to dream up the “weather-is-now-climate-change” meme. I guess TV really is only for entertainment now. If Bill was a real scientist, he’d be sporting a pocket protector, not a bow tie.
This morning, after being buried by literally several inches of snow (now up to about 8 inches in in Central Park), the Big Apple is picking up the pieces. Stay off the roads! Stay off the sidewalks!
Earlier this morning, Weather.com was claiming Islip, NY got 18 inches, but I find that hard to believe. Maybe in a snowdrift somewhere.
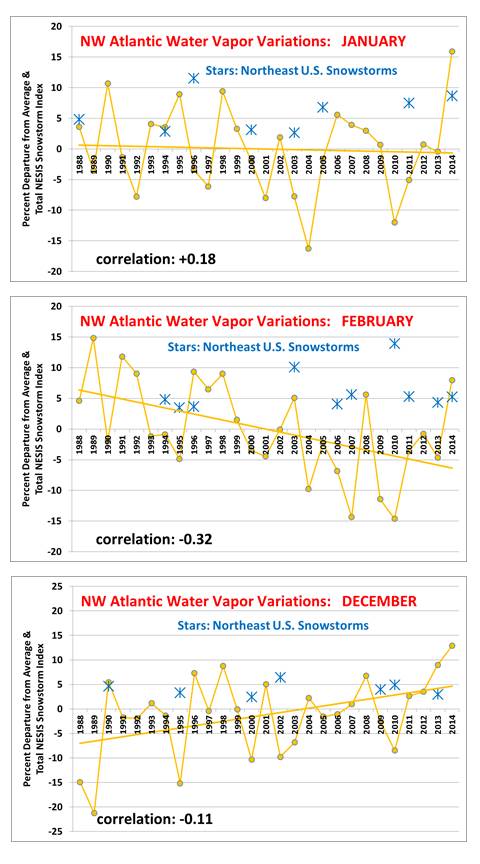
Yes, heavy precip events have become more frequent in the Northeast U.S. Yes, the North Atlantic is warm right now. But that’s mostly natural climate variability, folks. It’s probably related to some combination of the North Atlantic Oscillation (NAO) and Atlantic Multidecadal Oscillation (AMO).
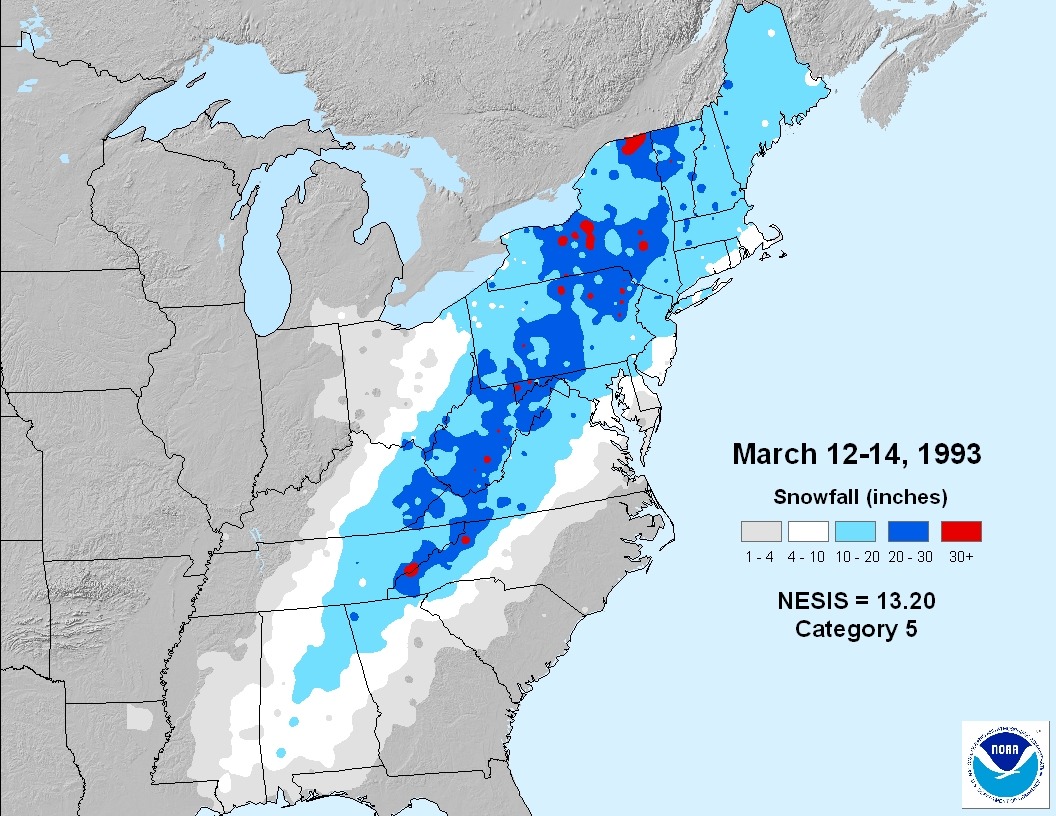
But extraordinary claims related to human causation and people driving their SUVs require extraordinary evidence. So far, what we’ve seen is still in the range of natural variability. Our weather records are relatively short (only 100 years or so, at best), and it is entirely expected that storms in some regions will result in “all-time” records.
But it looks like the 2015 Blizzard that Couldn’t won’t be one of them.
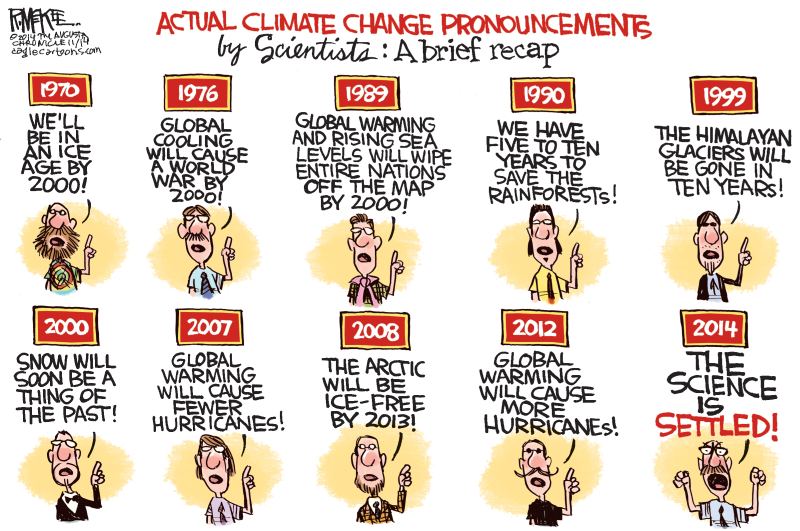
And until climate scientists decide whether global warming causes more snow or less snow, don’t trust them. They will probably decide on “both”, which then makes it an untestable hypothesis, which is what climate science (and the politicians) love.

 Home/Blog