Home/Blog
Pacific Typhoon Higos has formed in the tropical West Pacific. What makes this storm unusual is that it has formed at the least likely time of year, climatologically speaking.
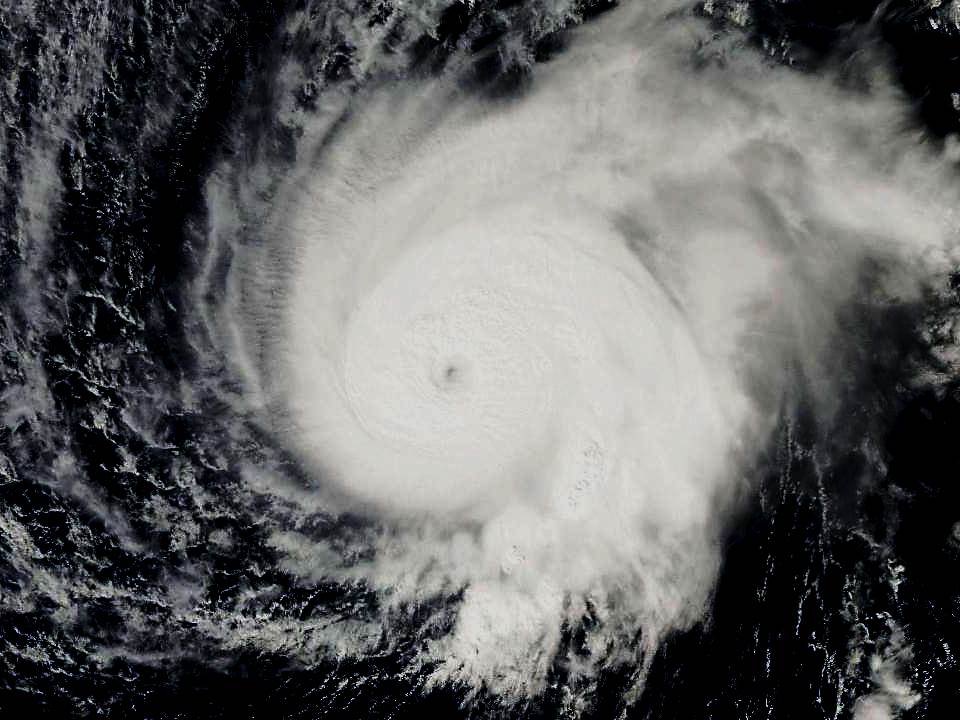
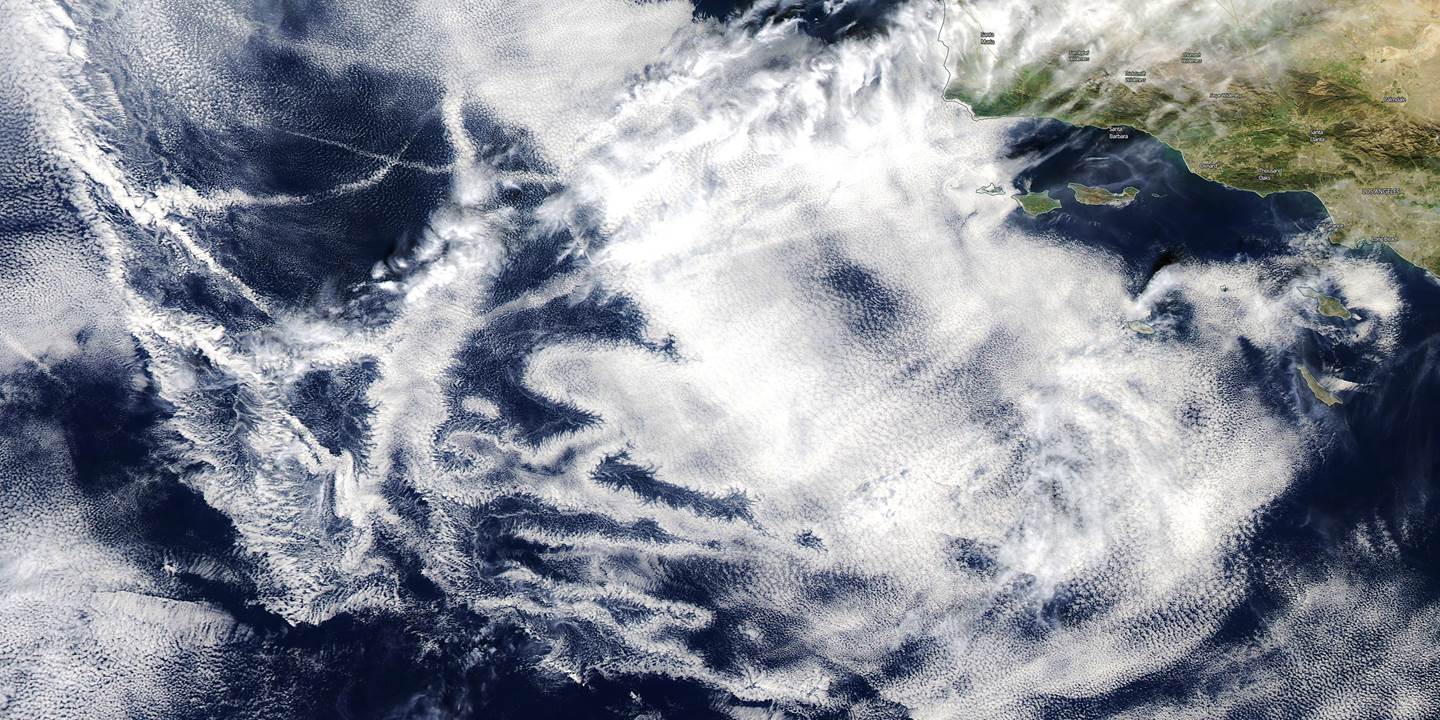
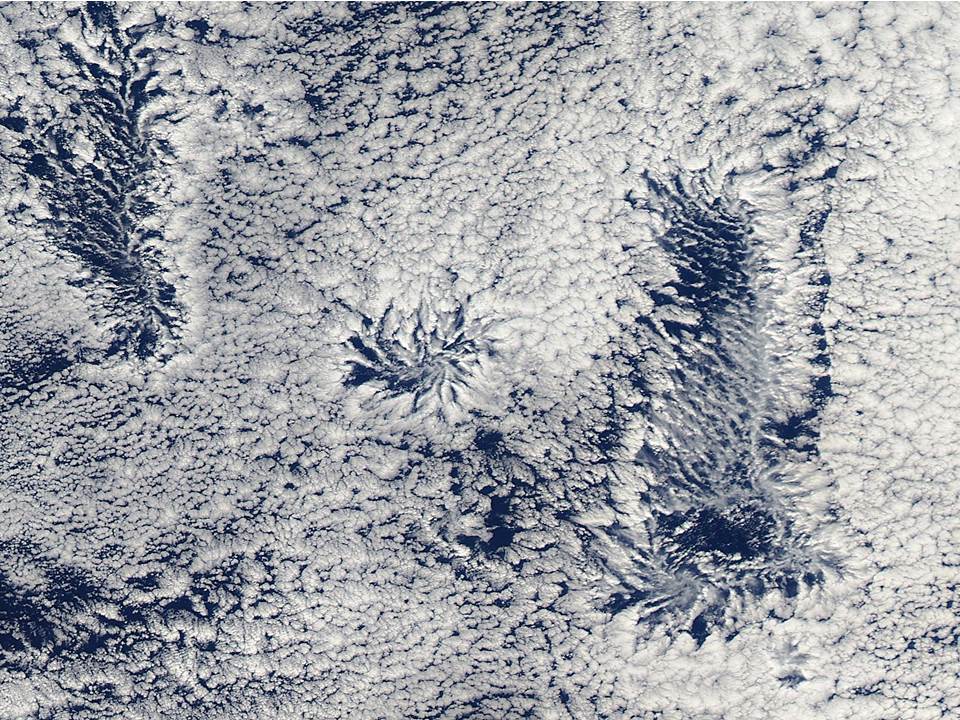
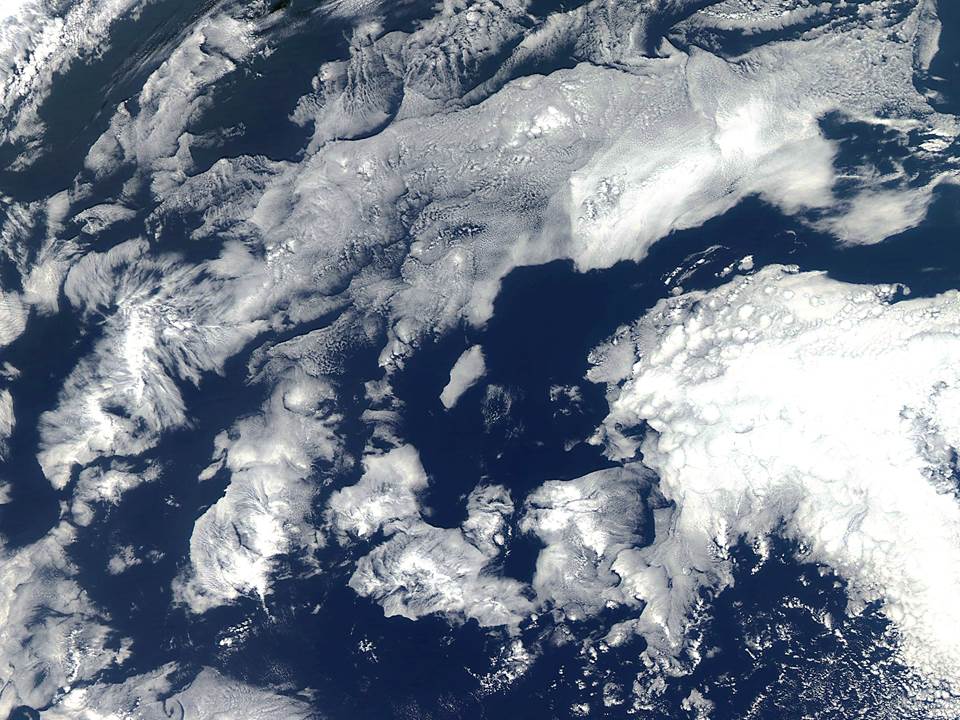
Rare Typhoon Higos viewed by the NASA MODIS imager on Feb. 10, 2015.
North Pacific typhoons have formed in all calendar months, but a Japanese analysis of the dates they form suggests that Feb. 11 is the least likely date. This date can be considered the beginning (or end) of the typhoon season.
So, Typhoon Higos might be considered the latest north Pacific typhoon on record. Or maybe it’s the earliest (there was a Feb. 15, 1965 typhoon that had been considered the earliest). It all depends upon when you decide the start/end date of typhoon season is.
One thing for sure is that a typhoon in mid-February is rare, indeed. According to this historical list going back 65 years, no typhoons have ever formed during the week of 8-14 February.