
 Home/Blog
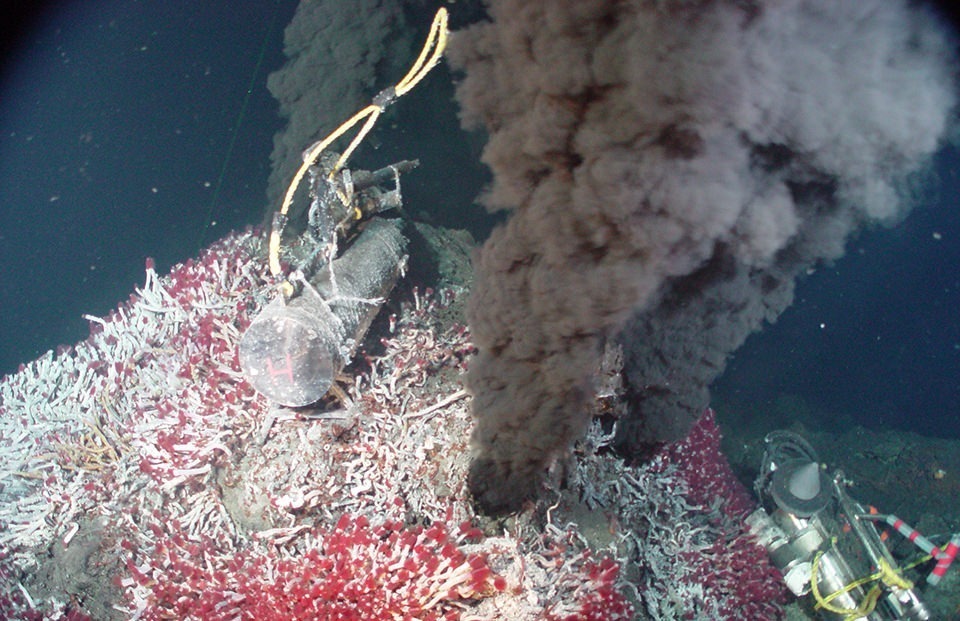
I sometimes see comments to the effect that recent ocean warming could be due to deep-sea hydrothermal vents. Of course, what they mean is an INCREASE in hydrothermal vent activity since these sources of heat are presumably operating continuously and are part of the average energy budget of the ocean, even without any long-term warming.
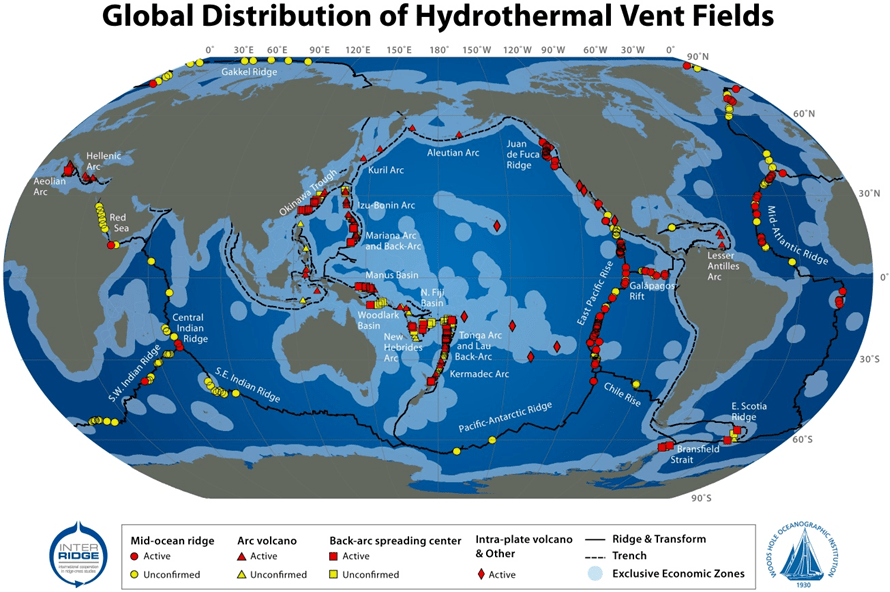
Fortunately, there are measurements of the heat output from these vents, and there are rough estimates of how many vents there are. Importantly, the vents (sometimes called “smokers”) are almost exclusively found along the mid-oceanic ridges, and those ridges have an estimated total length of 75,000 km (ref).
So, if we had (rough) estimates of the average heat output of a vent, and (roughly) know how many vents are scattered along the ridges, we can (roughly) estimate to total heat flux into the ocean per sq. meter of ocean surface.
Direct Temperature Measurements Near the Vents Offer a Clue
A more useful observation comes from deep-sea surveys using a towed sensor package which measures trace minerals produced by the vents, as well as temperature. A study published in 2016 described a total towed sensor distance of ~1,500 km just above where these smokers have been located. The purpose was to find out just how many sites there are scattered along the ridges.
Importantly, the study notes, “temperature anomalies from such sites are commonly too weak to be reliably detected during a tow“.
Let’s think about that: even when the sensor package is towed through water in which the mineral tracers from smokers exist, the temperature anomaly is “too weak to be reliably detected”.
Now think about that (already) extremely weak warmth being mixed laterally away from the (relatively isolated) ocean ridges, and vertically through 1,000s of meters of ocean depth.
Also, recall the deep ocean is, everywhere, exceedingly cold. It has been calculated that the global-average ocean temperature below 200m depth is 4 deg. C (39 deg. F). The cold water originates at the surface at high latitudes where it becomes extra-salty (and thus dense) and it slowly sinks, filling the global deep oceans over thousands of years with chilled water.
The fact that deep-sea towed probes over hydrothermal vent sites can’t even measure a temperature increase in the mineral-enriched water means there is no way for buoyant water parcels to reach up several kilometers to reach the thermocline.
Estimating The Heat Flux Into the Ocean from Hydrothermal Vents
We can get some idea of just how small the heat input is based upon various current estimates of a few parameters. The previously mentioned study comes up with a possible spacing of hydrothermal sites every ~10 km. So, that’s 7,500 sites around the world along the mid-oceanic ridges. From deep-sea probes carrying specialized sampling equipment, the average energy output looks to be about 1 MW per vent (see Table 1, here). But how many vents are there per site? I could not find a number. They sampled several vents at several sites. Let’s assume 100, and see where the numbers lead. The total heat flux into the ocean from hydrothermal vents in Watts per sq. meter (W m-2) would then be:
Heat Flux = (7,500 sites)x(100 vents per site)x(1 MW per vent)/(360,000,000,000,000 sq. m ocean sfc).
This comes out to 0.00029 W m-2.
That is an exceedingly small number, about 1/4,000th of the 1 W m-2 estimated energy imbalance from Argo float measurements of (very weak) ocean warming over the last 20 years or so. Even if the estimate is off by a factor of 100, the resulting heat flux is still 1/40th of global ocean heating rate. I assume that oceanographers have published some similar estimates, but I could not find them.
Now, what *is* somewhat larger is the average geothermal heat flux from the deep, hot Earth, which occurs everywhere. That has a global average value of 0.087 W m-2. This is approximately 1/10 of the estimate current ocean heating rate. But remember, it’s not the average geothermal heat flux that is of interest because that is always going on. Instead, that heat flux would have to increase by a factor of ten for decades to cause the observed heating rate of the global deep oceans.
Evidence Ocean Warming Has Been Top-Down, Not Bottom-Up
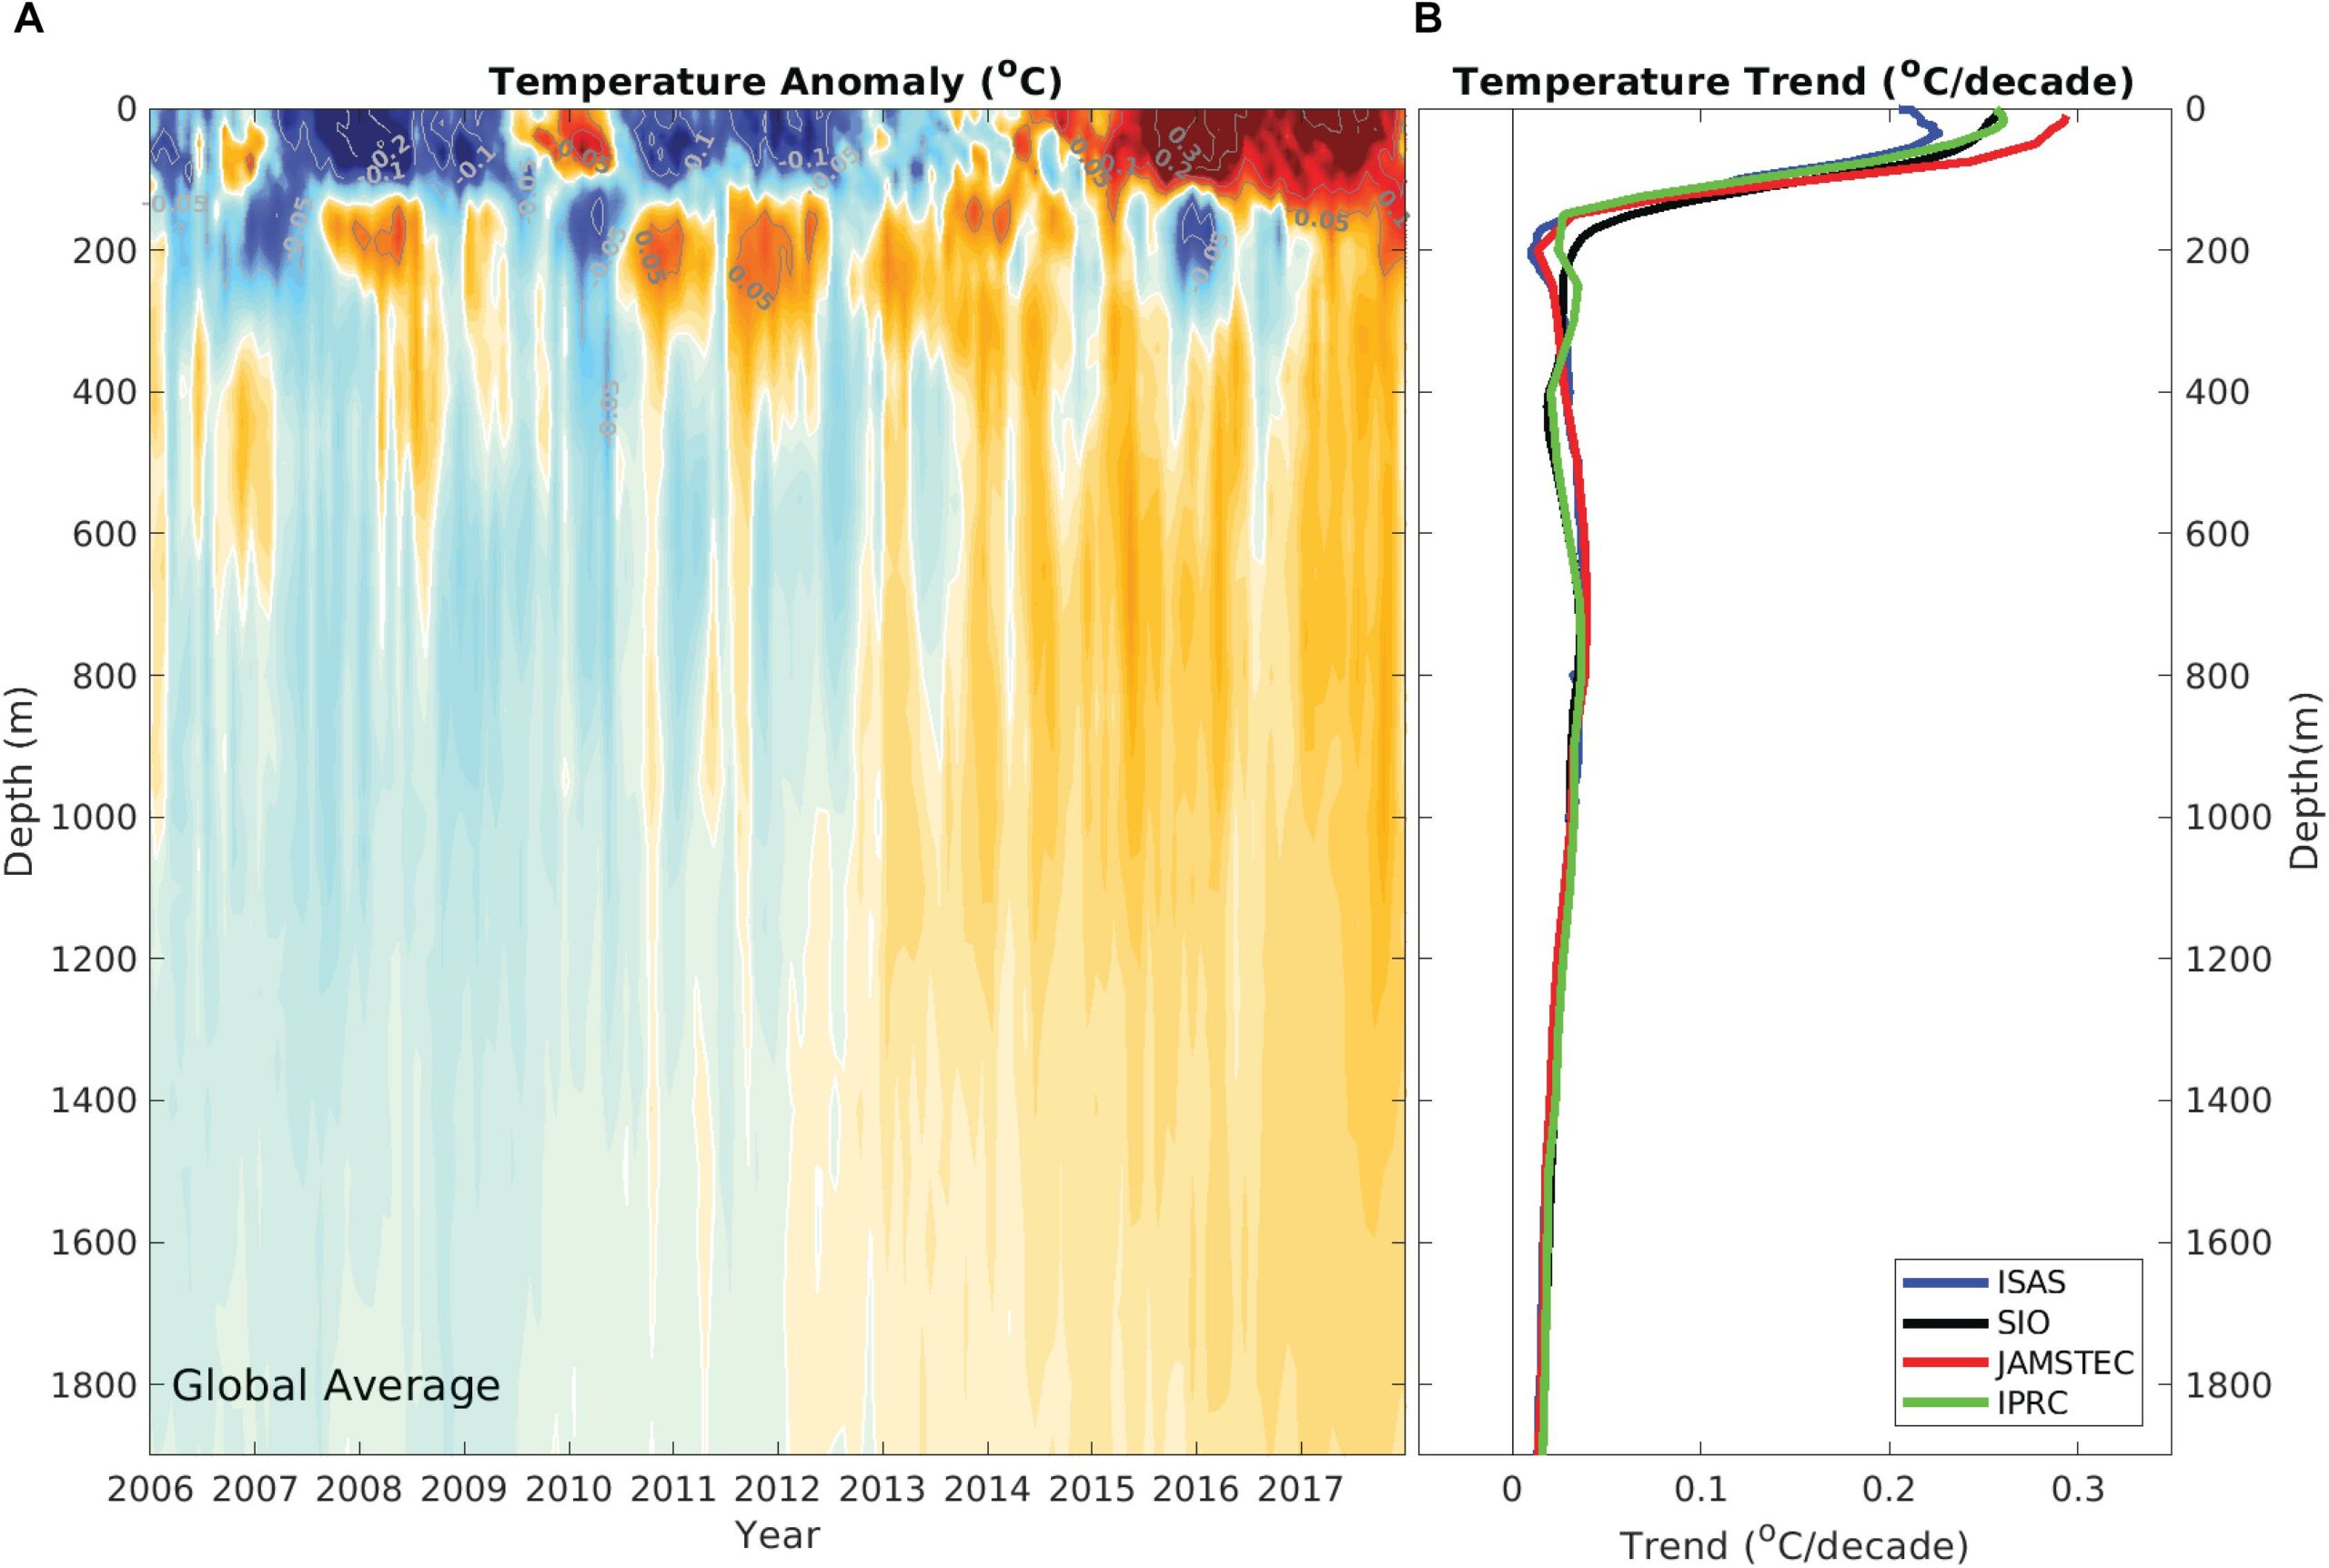
Finally, we can look at the Argo-estimate vertical profile of warming trends in the ocean. Even though the probes only reach a little more than half-way to the (average) ocean bottom, the warming profile supports heating from above, not from below (see panel B, right). Given these various pieces of evidence, it would difficult to believe that deep-sea hydrothermal vents — actually, an increase in their heat output — can be the reason for recent ocean warming.


Manual ping back:
https://www.drroyspencer.com/2024/01/new-article-on-climate-models-vs-observations/#comment-1606747
Thanks, I responded with a comment. It’s true, there is uncertainty regarding the warming of the lower-half of the ocean due to a lack of observations. Current estimate is maybe +0.01 deg. C over recent decades. “Deep Argo” development is certainly worthwhile, but the profile of warming trends from the surface to 2,000 m depth from Argo suggests not much is going on down there.
This may be true, but average depth of the ocean is “about 3,682 meters”.
And the temperature of whole ocean matters a lot, 1/2 the ocean’s temperature also matters.
And regard the surface temperature of Earth as including the entire ocean’s temperature.
How to explain the values in table 1, here?
https://www.climategate.nl/2022/08/mondiale-opwarming-hoe-en-waar/
(there is a translate button on the bottom)
Maybe it is a good idea for you to go back to Eddy?
https://breadonthewater.co.za/2024/02/03/global-warming-versus-global-cooling/
Deep Argo development is certainly worthwhile, but the profile of warming trends from the surface to 2,000 m depth from Argo suggests not much is going on down there.
————————–
Except there needs to be a mechanism that keeps the ocean below the thermocline about 14C colder than its surrounds.
Some suspect that mechanism is primarily the winter refreezing of ice that takes seawater that squeezes out super cold brines that sink to the bottom of the ocean to not be seen again for a long time.
Further when summer sea ice extent retreats the winter refreeze accelerates. Both summer ice and winter ice have retreated but summer ice has retreated far further.
So a little warming to the half way point in the ocean can be expected but also since cold water doesn’t rise there may even be more cooling in the bottom half than there is warming in the top half. . .partly explaining these multi-decadal ocean oscillations we see.
Good post.
There is a fact that the thermohaline flow rate is decreasing, equally at surface and ocean floor. This means that the earth’s internal heat at ocean floor is now removed by a steadily decreasing brine flow rate. The temperature of the deep ocean increases as a result with time. Theoretically speaking, warming of the deep ocean must be equal to that of surface. Otherwise, the thermohaline circulation would cease, which is not observed. The temperature data of the deep ocean is minimal at this time, but it shows equal warming.
Thanks for another concise, well reasoned discussion of climate topics.
Witness the solar cycle influence on the ocean in the ARGO data.
Top-down warming seen in ARGO data also seen in Rathore etal Figure 1.
And now, for where the upper ocean warming came from, drum roll please,
as shown here in an overlay of SORCE TSI and Rathore Fig. 1:
https://i.postimg.cc/1zHrhxKZ/Rathore-etal-Fig-1-Asymmetrical-OHC-vs-SORCE-TSI-overlay.jpg
The heat content increase at depth after 2011 came from absorbed solar radiation during solar cycle #24 while TSI was above 1361.25W/m^2, the decadal sun-ocean warming threshold I established in 2014.
Top-down warming all over again since 2022, 11 years later.
“The heat content increase at depth after 2011 came from absorbed solar radiation during solar cycle #24 ”
Physically impossible. Warmer water does not sink. It floats.
ARGO floats only send location information when on the surface. As they descend or ascend, they travel in the currents they are passing through, which vary in direction and speed. Any thermal profile generated by a float is about as much use as measuring tides against a line on a ship’s hull. Well, maybe not quite, but close.
From an ARGO site –
“The primary goal of the Argo program is to maintain a global array of autonomous profiling floats integrated with other elements of the climate observing system.”
More money floating away into the depths for no good reason at all.
Physically impossible. Warmer water does not sink. It floats.
Gaslight much? I said absorbed solar radiation at depth.
Swenson, don’t you know that sunshine warms the ocean?
What did you think, that the ocean surface is 100% reflective?
https://i.postimg.cc/HWQHn9bR/Spectral-Light-Penetration-Open-vs-Coastal-Ocean.jpg
The seasonal ocean solar warming effect is easily seen in coral reef watch alert area images six months apart, for any year, as corals are stressed under high ocean temperature:
https://coralreefwatch.noaa.gov/data/5km/v3.1_op/image/daily/baa-max-7d/png/2023/03/ct5km_baa-max-7d_v3.1_tropics_20230301.png
https://coralreefwatch.noaa.gov/data/5km/v3.1_op/image/daily/baa-max-7d/png/2023/09/ct5km_baa-max-7d_v3.1_tropics_20230901.png
Bob,
You wrote –
“Gaslight much? I said absorbed solar radiation at depth.”
Unless you want to deny reality, any sunlight absorbed “at depth” (unspecified, of course), makes the water warmer. Warm water floats, because it expands, becomes less dense, and is displaced by colder, denser, water.
At night, the surface water radiates to outer space (eventually), cools, and sinks, displacing less dense water below it.
You don’t have to believe that physical laws apply to water, but they do.
You may or may not accept that the Earth has cooled over the past four and a half billion years, but it certainly seems that way.
Try describing the GHE in any sensible way, and you will find you can’t. Boo hoo, bad luck, your “gaslight much” hasn’t changed a single fact. Try harder next time.
“You may or may not accept that the Earth has cooled over the past four and a half billion years”
Can anybody here explain why Swenson keeps pretending that the Earth has ONLY EVER cooled? When the reality is that it has WARMED significantly 20,000 years ago, and WARMED further over the last 100 y.
Why is he like a broken record playing a stoopid song?
“You dont have to believe that physical laws apply to water, but they do.”
Indeed they do. So why do you deny what Roy Spencer’s numbers clearly show, that geothermal heat is WAY WAY to small to account for the ocean warming observed?
He’s talking about optical wavelengths penetrating atleast to 200m – I’ve seen some discussions and graphs that show the blue wavelengths especially penetrating a km. down!
So, like he is saying “warming at depth”.
You may have been thinking about IR wavelengths, that only penetrates some small fraction of a millimetre.
Global climate is something which occurs over thousands of years and heat “trapped” in the ocean occurs over thousands of years.
And our ocean has been cooling for thousands of years.
In terms recent times, the little ice age has some cooling apparently, and since end of the little ice age the ocean has been measured to warming a bit.
I don’t think you say the geothermal heat of ocean has caused recent warming, other than it might be said is a part of natural variability.
One might ask with vast amount cold water from polar regions, how much colder would ocean be without the geothermal heat of the ocean.
And would say ocean geothermal heat is more related to glaciation periods.
It seems to me that during glaciation periods one has less cold water from the polar regions being dumped into the deep oceans.
Volcanic activity causes little deep ocean heating because it forms plumes which entrain surrounding water and carry it to the surface. Large volcanic events are sporadic and intermittent just as they are on land. HTVs are the ocean equivalent of hot springs. See https://blackjay.net.au/north-atlantic-heatwave/
I expect even a 1 W/m2 heat flux on the sea floor produces an unmeasurable temperature change near the sea surface. Heating a bath with a 1W/m2 heater isn’t going to lead to boiling any time soon! The enormous heat capacity of the oceans makes the heat flux analysis tricky. Adding ocean convection into the mix makes things even more complex.
–How Long Does it Take a Volcano to Grow?
Volcanoes are created over approximately 10,000-500,000 years by thousands of eruptions — each lava flow covering the one before it. In the case of oceanic island volcanoes, lava erupts first from fissures, or cracks, on the deep ocean floor. The flows continue to build up and finally an island emerges from the sea. It was only when scientists began sampling the deep ocean floor in the 1950s and 1960s that they realized that most of the ocean floor is composed of lava flows. In fact, more lava has erupted on the sea floor than anywhere on Earth, mostly from mid-ocean ridges — the longest chain of active volcanoes on our planet.–
https://www.whoi.edu/know-your-ocean/ocean-topics/how-the-ocean-works/seafloor-below/volcanoes/lava-flows/
I think nuclear warhead exploding on sea floor, wouldn’t produce measurable temperature change at the surface.
“The task force commander, Admiral John Sylvester, was embarked on the task force flagship USS Mount McKinley. Wigwam was the first atomic test in the deep ocean, and it remains the only test that has been conducted in water deeper than 1,000 ft (300 m). Wigwam test detonation.”
Though in shallow water it’s quite noticeable
It has to be solar insolation, then.
Dr Spencer,
You wrote –
“Evidence Ocean Warming Has Been Top-Down, Not Bottom-Up.”
Physically impossible. Heated water on the surface cannot descend. It is less dense, and floats. Any heat “conducted” or “mixed” into the depths, heats water – which then displaces colder water, and rises. Gravity rules!
The oceans are heated from the bottom, and Fouriers Law applies. Ocean currents (especially deep ones running opposite each other) are not due to wind, sunlight, or magical incantations!
Just chaos in action.
Just for interest, crustal hotspots are detected from satellites, and their extent and temperature are constantly changing.
One of the maps in “In Situ Heat Flow Measurements on the Earth, Moon, and Mars
M. Grott, Institute of Planetary Research, DLR, Berlin, Germany A. Hagermann, The Open University, Milton Keynes, UK”, based on over 38,000 crust temperature measurements shows the crustal temperature variations.
There is still no GHE, at least until someone can actually describe it, and obtain consensus on a written description, supported by observation, measurements, and documentation.
Mike Flynn,
You say –
“Heated water on the surface cannot descend”
Have you ever taken a bath?
Willard, please stop trolling.
Swenson,
What you say is true, except for the fact that the ocean temperature profile is inverted. Natural convection does not occur as a result. And ocean heating from bottom up is inhibited. Only the flowing brine adhering to ocean floor is heated by the earth’s internal heat. It is transported southward and lifted up in the southern most oceans. That is why these oceans are higher than average sea level. The heat expand them.
Ocean heating is from the top but dispersed downwards in the ocean mixed layer, may be up to 250 m, 400 m max. Below that, there is now way heat can be transported as you explained.
Nabil,
You wrote –
“It is transported southward and lifted up in the southern most oceans.”
I am not aware of any reason why a film of water on the surface of a sphere would move from one point to another on a large scale.
The South Pole is no “lower” than the North Pole. They are just opposite poles on a sphere! A spherical marble or a bowl at the North Pole will not magically travel south. It will stay where it is – attracted by the force of gravity towards the centre of the Earth.
Convection is due to heat from the bottom of a container of water (like an ocean) – heating from the top does almost nothing – hot water expands, and floats to the top. You can’t defeat the laws of physics.
Still no GHE, so it really doesn’t matter, does it?
“I am not aware of any reason”
No surprise.
But science is aware of the thermohaline circulation.
Are there also UAH data on absolute temperature?
For instance we have the lower- and mid troposphere data. We know there is a variation of about 4K with surface temperature over the year. That is because the amplitude is far larger in the NH than in the SH.
This variation in Ts is put into relation to OLR and since dOLR/dTs is well below 3.3W/m2 (about 2W/m2), climate scientists read a strong WV feedback into it.
I would assume the temperature variation in the mid troposphere, where most of the OLR originates, will be smaller than that of Ts. We know at altitude, like on mountain tops where there are some weather stations, the annual temperature range is much smaller than at ground level. Also inversions in high latitude winter tell the same story of sluggish (mid-)troposphere temperatures vs. more volatile Ts.
So when interpreting dOLR/dTs there will be two factors in play, while climate science only seems to consider one.
a) WV feedback
b) sluggish tropospheric temperature
By ingoring the latter you would conclude much higher WV feedback and climate sensitivity with it. To get a proper handle on this question, the actual temperature data, not just the anomaly, would be pivotal.
Ok, I just did a little analysis on the anomaly data sets, which is kind of off point. Naturally they are insensitive towards seasonal variations. But at least the should capture random variations, like El Ninos. Indeed ttp and tmp show somewhat less variation (-10% and -15% respectively) than tlt.
But then of course tlt itself is not surface temperature and should have less variation on its own.
Are there also UAH data on absolute temperature?
Yes. UAH measures the absolute temperature.
https://i.imgur.com/ws2cadX.png
Thx, interesting. I am just afraid I would need a little bit more. Which data set is this? Given the temperature it might be mid troposphere. Do you have a link to the actual data?
It is UAH TLT.
https://www.nsstc.uah.edu/data/msu/v6.0/tlt/
Is there any info on how to read these data ???
There probably is documentation but I don’t remember where it is. I can tell you that tltmonacg_6.0 contains the absolute values of the 1991-2020 baseline. The file has 12 sections; one for each month. Each section has all of the values for each lat/lon combination on a 2.5×2.5 degree grid. The file uses -9999 to indicate no information for that grid cell. The value for each grid cell is 5 digits in units of 1/100th degree K. For example, the first non -9999 value you see in the file is 24668. That is 246.68 K. The next 5 digits after that are the next grid cell over. You need to scan the sections from left to right and top to bottom. There are 144 cells along the longitudes and 72 cells along the latitudes for a total of 10368 cells of which only 9504 have values since the others have -9999 in them. Each row in the file has 16 values so it takes 144/16 = 9 rows represent one ring around the planet in the longitudinal direction. In other words every 9th row shifts down a latitude rung in the grid.
To compute the global average temperature of the baseline you need to do an area weighted average of the 9504 cells in the grid for each month. You can then add the monthly anomalies to each of the 12 absolute temperature baselines to get the absolute temperature for any month in the UAH dataset.
Here are the 1991-2020 baselines for each of the 12 months.
Jan: 263.18 K
Feb: 263.27 K
Mar: 263.43 K
Apr: 263.84 K
May: 264.45 K
Jun: 265.10 K
Jul: 265.42 K
Aug: 265.23 K
Sep: 264.64 K
Oct: 263.95 K
Nov: 263.41 K
Dec: 263.19 K
For example, the anomaly of 0.83 C for 2023/12 is 263.19 + 0.83 = 264.02 K in absolute terms.
Ok, thx a lot. I finally processed the data. There are a couple of things I noticed.
1. other than I expected the data go from south to north
2. the annual temperature range with tlt is only 2.24K, as compared to some 3.9K with “climatereanalyzer” (or 3.8K on a Jan/Jul basis):
https://climatereanalyzer.org/clim/t2_daily/?dm_id=world
3. with tmt the ATR is even just 1.62K
4. the shape of the ATR curve is somewhat odd. As above with “climatereanalyzer” it almost a perfect sinus curve. With tlt the bottom (from nov to mar) is pretty wide and flat, while the peak around July is pretty sharp. Any idea why that is?
5. tropical temperatures with tlt are just barely above 273K. but that is not really lower troposphere, rather that is over 4.000m altitude.
6. the tmt there is around 257K, or 6.000m altitude – not much higher up
7. if the tlt is not actually measured but computed from tmt and other data sets, it is really no surprise it will diverge from other data sets representing actual surface temperatures.
Anyway, the pretty small ATR underscores the point I was making in the OP. If tropospheric temperatures are indeed that sluggish, then the relation dOLR/dTs tells NOTHING about WV feedback and climate sensitivity. But I am afraid that is exactly the notion WV feedback is based on.
bdgwx is right: there is no directly accessible absolute data for the atmospheric layers observed by UAH.
You have to recombine it for each layer out of its 2.5 degree grid data, here for example the lower troposphere (lt):
– anomalies (the files tltmonamg.xxxx_6.0, where 1978 <= xxxx <= current)
– climatology (the file tltmonacg_6.0)
by adding, to each monthly anomaly cell containing valid data, the value of the cell with the same offset in the same month of the climatology.
Fur UAH 6.0 LT that gives, for the period Dec 1978 – Dec 2023, the following time series:
https://drive.google.com/file/d/1etyGt28q4TeUzIOPbJfWtkBJetFZPkoF/view
Note that the LT layer's data is since revision 6 no longer a result of remote microwave sensing. It is computed out of mt, tp and ls.
*
The same generation of absolute data and 12 month climatology can be done for the three other layers: all layers have the same structure.
Good point Bindidon. You can actually compute the TLT values from MT, TP, and LS grids.
The formula is TLT = 1.538*TMT – 0.548*TTP + 0.10*TLS
There is also a TTT (total tropospheric temperature) formula that can be used to do a real apples-to-apples comparison between UAH, RSS, and STAR. That formula is TTT = 1.15*TMT – 0.15*TLS.
bdgwx
” You can actually compute the TLT values from MT, TP, and LS grids.
The formula is TLT = 1.538*TMT 0.548*TTP + 0.10*TLS ”
*
Did I really read ‘can’ above, bdgwx?
You should actually write it the other way around:
The ONLY way to get the LT values is to calculate them from MT, TP and LS grids. ”
Because in contrast to all previous UAH revisions, there is NO way to get LT data in any other way.
Roy Spencer stated this clearly in his first thread about UAH 6.0beta in 2015.
*
By the way, for most cases you don’t need to use the grid: you can apply this formula in Excel or similar to the monthly zonal and regional data, e.g. the Globe:
https://drive.google.com/file/d/1tJDjs0VwqeusqbBtD3eO3eyxuepoPRR1/view
*
The grid is only necessary for very specific subsets, e.g. the Nino3+4 area:
https://drive.google.com/file/d/1c1tQQ-XuYa6ddJ705uOgg4K6-_f7qIg-/view
or the single grid cell over UAlabama
https://drive.google.com/file/d/18bSH3pQeQeOkIb09XzSLgDHWPIAn_NVJ/view
(The charts are a bit old, dated Nov 2022.)
I wonder how many cranks suggested that oceans were warmed by the heat underneath. There is Mike Flynn, of course:
https://www.drroyspencer.com/2017/05/uah-global-temperature-update-for-april-2017-0-27-deg-c/#comment-246692
Who else?
Just what I was asking for:
https://www.drroyspencer.com/2024/01/how-much-ocean-heating-is-due-to-deep-sea-hydrothermal-vents/#comment-1608039
Thanks, Life!
Me.
I think oceanic volcanic heat of the ocean is quite significant.
But I don’t think volcanic heat [and/or geothermal heat] is significant on land areas. Though it would be, if you wanted to live mile below the surface, but in terms of living on top of land surface, it’s an immeasurable warming effect.
I think the ocean warms and land cools and land can easily cools so much that the insignificant geothermal heat of the land can be disregarded.
Though land geothermal heat is far more heat than what humans generate and all of life generate. Or UHI effects do not cause an increase in global temperature, but they distort measurement of land temperature and can do this by a lot.
Cities do increase the local temperature. And human warming effect upon most humans is due the UHI effects. If you think it’s too warm, moving out an city could a way to to be less warm. But it’s a local effect, not a global warming effect.
Thanks.
Any other volunteer?
Everyone knows we in an Ice Age, and reason we in Ice Age, is due solely, to the coldness of our ocean.
How, the ocean cooled, is debatable.
And everyone knows if cold ocean of average of about 3.5 C were to somehow warm by 2 C. This doesn’t get us out the Ice Age, but it means a lot global warming and higher sea levels.
The last time ocean had average of 5 C, was millions of years ago, though millions of years ago, we were still in an Ice Age.
And everyone knows the warmest global climate state is a greenhouse global climate, which has entire oceans average temperature being 10 C or warmer.
And NOAA and NASA say, that more than 90% of global warming has been warming our cold, 3.5 C average temperature ocean.
So, I will offer NOAA, and NASA as, other volunteers
No need to peddle your usual crap here, gb.
You can repeat it elsewhere.
Willard, please stop trolling.
Hey, Mike Flynn –
Not in my thread.
Willard, please stop trolling.
https://www.drroyspencer.com/2024/01/how-much-ocean-heating-is-due-to-deep-sea-hydrothermal-vents/#comment-1608287
The cargo cult ideas about warming this Ice Age are only vaguely valid, it you consider human population as increasing a lot,
But everyone knows it’s going crash fairly soon.
And this crashing of human population is somewhat a valid concern- though hard to predict the future.
I think human population of 10 billion is a lack population when consider a number of factors, and main one being if we become a space faring civilization.
I don’t regard mining the Moon and/or settlements on Mars as a spacefaring civilization- though certainly a significant step in that direction.
Apollo program didn’t make us, a spacefaring civilization, perhaps a small step, it that direction. Whereas satellite market is greater step, and continue to be.
One could thank, war, for that, and war seems to be something we continue to have in our future- or no worries the satellite market continued exist as something very critical {and saving a lot money and etc].
So, we are on brink of global internet, which will result in huge amount of knowledge and access available to billions of people.
And one also say, this related to us becoming a spacefaring civilization more so, the NASA lunar and Mars exploration programs- or whatever Musk might continue to do.
One thing about Musk and his crazy idea of launch rate, it likely effect of this having ocean settlements.
And when consider potential of ocean settlements, Earth become vastly less crowded. But if we do become spacefaring, that even greater thing that indicates our desperately low global population. And the silliness of idea limited energy for the future.
No need to peddle your usual crap here, gb.
You did your bit. Thanks.
Willard, please stop trolling.
https://www.drroyspencer.com/2024/01/how-much-ocean-heating-is-due-to-deep-sea-hydrothermal-vents/#comment-1608287
Willard, please stop trolling.
Mike Flynn,
Flashback:
https://www.drroyspencer.com/2021/04/an-earth-day-reminder-global-warming-is-only-50-of-what-models-predict/#comment-671208
Looks like you haven’t taken a bath since 3 years at least.
“Mike Flynn,
Flashback:”
Willard, please stop trolling.
Mike Flynn:
https://www.drroyspencer.com/2017/09/uah-global-temperature-update-for-august-2017-0-41-deg-c/#comment-262117
Mike Flynn.
“Mike Flynn:”
Willard, please stop trolling.
–YOU KNEW THEY WERE GOING TO END UP HERE EVENTUALLY: How much does human breathing contribute to climate change? All those billions of bodies exhaling carbon dioxide with every breath really starts to add up
Posted at 12:04 pm by Glenn Reynolds–
https://instapundit.com/
The link says:
“In one day, the average person breathes out around 500 litres of the greenhouse gas CO2 which amounts to around 1kg in mass. This doesnt sound much until you take into account the fact that the worlds population is around 6.8 billion, collectively breathing out around 2500 million tonnes of the stuff each year which is around 7 per cent of the annual CO2 tonnage churned out by the burning of fossil fuel around the world.”
It’s said it’s 8.1 billion {and might get to 10 billion- due to the younger and faster growing nations {Or not China, Japan, or US, or Europe Or Russia.]
China might half it’s population by the time world gets it’s peak population number- and it will be probably only be seem as real problem of under population within decade of it’s peak- and therefore be far too late to change it from crashing- most of the 10 billion will be too old to have children, will want to retire soon, and etc, and China will have returned to being a vastly polluted 3rd world country.
Anyhow, if got these 10 billion people, government can solve this problem by doing what always do, does nothing, and says they changing the world, and just time it’s itself will reduce it to be lower than 5 billion people.
Maybe all these old people won’t want war- as they have more pressing needs.
But we also have all those pets which are breathing also. And all those older people might want a lot more pets.
Some think robots might make it better, but they have a carbon footprint, also.
Swifties would be great to counter contrarian spam:
https://www.cnbc.com/2024/01/30/trump-allies-target-taylor-swift-ahead-of-super-bowl.html
Willard, please stop trolling.
More of you, Mike Flynn:
https://www.drroyspencer.com/2023/09/our-new-climate-sensitivity-paper-has-been-published/#comment-1541126
“More of you, Mike Flynn:”
Willard, please stop trolling.
Every unrequited PST makes me go back in time, Mike:
https://www.drroyspencer.com/2017/09/uah-global-temperature-update-for-august-2017-0-41-deg-c/#comment-262904
From the very thread in which Roy asked you to start your own blog.
“Every unrequited PST makes me go back in time, Mike:”
Willard, please stop trolling.
Mike Flynn –
https://www.drroyspencer.com/2015/07/new-pause-busting-temperature-dataset-implies-only-1-5-c-climate-sensitivity/#comment-195000
Everyone who takes a hot bath requires a diving intervention.
“Everyone who takes a hot bath requires a diving intervention.”
Willard, please stop trolling.
I suppose one could argue that diving is divine, Mike.
Interesting. His calcs seem ok.
Per Capita, it is about 365 Kg or 0.37 tons/year/person.
But US emits 15 tons CO2/year per Capita. So the breathing part is only 2.4 %.
And the rest of the world wants to come up to our level prosperity.
And FYI, where did the co2 in our breath come from?
It came from food, which came from plants, and animals that obtained from plants.
The carbon in plants came from the atmosphere.
So our breath is not adding carbon to the atmosphere. It is simply borrowing and returning it.
Fossil fuels, OTOH, are adding carbon to the atmosphere.
Another crank chimes in:
https://www.drroyspencer.com/2024/01/how-much-ocean-heating-is-due-to-deep-sea-hydrothermal-vents/#comment-1608146
Willard, please stop trolling.
Mike Flynn,
You’re spamming.
Willard, please stop trolling.
Here’s you, Mike:
https://www.drroyspencer.com/2021/04/an-earth-day-reminder-global-warming-is-only-50-of-what-models-predict/#comment-672200
“Heres you, Mike:”
Willard, please stop trolling.
More of you, Mike Flynn:
https://www.drroyspencer.com/2019/04/uah-global-temperature-update-for-march-2019-0-34-deg-c/#comment-348182
“More of you, Mike Flynn:”
Willard, please stop trolling.
Willard, please stop trolling.
Over there, Mike Flynn –
https://www.drroyspencer.com/2024/01/how-much-ocean-heating-is-due-to-deep-sea-hydrothermal-vents/#comment-1608291
Willard, please stop trolling.
Not here, Mike.
“Not here, Mike.”
Willard, please stop trolling.
You’re in my thread, Mike.
So enjoy this other bit of you:
https://www.drroyspencer.com/2021/01/uah-global-temperature-update-for-december-2020-0-27-deg-c/#comment-583920
“Youre in my thread, Mike.”
Willard, please stop trolling.
This way, Mike Flynn –
https://www.drroyspencer.com/2024/01/how-much-ocean-heating-is-due-to-deep-sea-hydrothermal-vents/#comment-1608415
Willard, are you saying only a “crank” would think geothermal warms the oceans? Just what do you think happens to the water about underwater volcanoes? Do the laws of thermodynamics cease to exist in the oceans? People warm their homes with geothermal.
I’m pretty sure the only “cranks” out there are the ones who think Volcanoes won’t warm water. The Ring of Fire covers thousands of miles.
Life,
I’m saying that only a crank like Mike Flynn would suggest that the oceans warm because of the heat produced by the Earth core, therefore there is no need to posit a greenhouse effect.
It takes a special crank to play dumb about this.
Willard, please stop trolling.
And he clearly has no sensible answers.
If you can’t explain how CO2 backradiation can warm the oceans, you can’t blame CO2 for the climate change/global warming. Visible radiation, not LWIR, warms the oceans, as well as geothermal. The specific heat of water is known, the backradiation of 15 Micron LWIR from CO2 is known. The backradiation energy is no where near enough to warm the oceans. Those are all easy calculaiton to run.
CO2isLife, We already know how CO2 warms the ocean both from a macrophysics perspective (1LOT) and from a microphysics perspective (thermal skin layer). See [Wong & Minnett 2018 DOI 10.1002/2017JC013351] for details.
“We already know how CO2 warms the ocean . . .”
No, we don’t. Heat warms the oceans. They are a very thin film of water on a sphere which is more than 99% glowing hot.
CO2 is maintained in a gaseous state (even in the absence of sunlight) due to this internal heat.
CO2 warms nothing. Never has, never will.
Mike Flynn,
You say –
“No, we dont.”
Yes we do, at least those who know how language works.
Cheers.
Willard, please stop trolling.
Mike Flynn,
bdgwx is with me:
https://www.drroyspencer.com/2019/09/a-stove-top-analogy-to-climate-models/#comment-388226
Why are you still here?
“Mike Flynn,
bdgwx is with me”
Willard, please stop trolling.
Mike Flynn,
How is your “bit of humour” going?
“How is your bit of humour going?”
Willard, please stop trolling.
Not very good then, Mike Flynn.
“on a sphere which is more than 99% glowing hot.”
The key glowing hot sphere is the sun.
While the Earth’s glowing hot mantle is well insulated, and providing about 2500 times less heat to the Earth’s surface than the sun.
So it is not important.
Oh well!
bdgwx, LWIR between 13 and 18 microns does not penetrate or warm the oceans up to 200m down. If anything those wavelenghts will cause surface evaporation which will cool the water below. Show me one single experiment that isolates 13 to 18 micron and demonstrates that it will warm a bucket of water. Show me just one expample of that very simple experiment.
CO2isLife, that experiment is literally performed countless times every single day in the food service industry in which they use IR lamps to keep food at a higher temperature than it would otherwise be. Of course, you can do the experiment in your own home as well. Just get an IR lamp and direct it towards a vessel of water and observe that the temperature of the water increase.
Dr. Spencer does the experiment here using a shield to back radiate toward the vessel of water.
https://www.drroyspencer.com/2015/06/can-infrared-radiation-warm-a-water-body-part-ii/
This is just one more example of the cult’s ignorance of science.
bdgwx must believe that ALL infrared is the same. He has no clue. Infrared from a HOT lamp emitting even into the visible range can burn your skin. Infrared as low as CO2’s 15μ photon can not even melt ice.
I predict bdgwx will learn NOTHING from this.
Puffman tries to peddle his pet trick once more:
https://www.drroyspencer.com/2024/01/uah-global-temperature-update-for-december-2023-0-83-deg-c/#comment-1597193
…and silly willy offers another example of the cult’s ignorance of science.
All 15μ photons are the same, regardless of their origin.
bdgwx,
You wrote –
“Dr. Spencer does the experiment here using a shield to back radiate toward the vessel of water.”
Don’t be silly. The experiment shows that temperatures drop at night – no sunlight, you see.
Are you dreaming about something else?
Willard,
You wrote –
“A single 15 um photon could come from any of these.”
Are you claiming you could warm water with a single 15 um photon? How about a billion of them? A squillion? All the 15 um photons in the universe?
Only joking – you are just trolling, in your usual witless fashion.
Keep trying.
Mike Flynn,
You say –
“You wrote”
What are you braying about?
Willard,
You wrote
“A single 15 um photon could come from any of these.”
Are you claiming you could warm water with a single 15 um photon? How about a billion of them? A squillion? All the 15 um photons in the universe?
Only joking you are just trolling, in your usual witless fashion.
Keep trying.
Mike Flynn,
You said –
“You wrote”
False.
Willard, please stop trolling.
It was a quote, Mike.
“It was a quote, Mike.”
Willard, please stop trolling.
I assure you it was a quote, Mike.
“I assure you it was a quote, Mike.”
Willard, please stop trolling.
Ir food heat lamps use short wl Near IR.
But ceramic heat lamps for warming reptile pets emit longer wavelength thermal IR.
I have several times pointed out to CO2ISLIFE that an easy experiment confirmed that pointing such an IR source downward at a bowl of water HEATS it effectively.
He can try the experiment himself. But so far he has not.
Nate,
“I have several times pointed out to CO2ISLIFE that an easy experiment confirmed that pointing such an IR source downward at a bowl of water HEATS it effectively.”
You can “point out” what you like, and if anybody is silly enough to believe your fantasies, they deserve what they get.
Keep pointing – in several directions at once, while you flail about, refusing to accept reality.
The Earth has cooled over the last four and a half billion years, and you cannot even describe the GHE!
“believe your fantasies”
No need. You can replicate the experiment easily.
Here. Buy this cheap IR lamp.
https://www.chewy.com/flukers-ceramic-reptile-heat-emitter/dp/129151?utm_source=google-product&utm_medium=cpc&utm_content=Fluker%27s&utm_campaign=20822266073&utm_term=&gad_source=1&gclid=Cj0KCQiAn-2tBhDVARIsAGmStVkgG1mWu-iUw7DdgZDan_yxstfoorc0pd1wyYYGspIIGYBGVbjkNnIaAhvJEALw_wcB
Don’t want to? Then quit ur bitchin!
Nate, if it can warm reptiles, it can warm water.
You continue to demonstrate your ignorance of the science.
Try warming reptiles with the infrared from ice cubes. The 15μ photon from CO2 has less energy than the WDL photon from ice.
“Nate, if it can warm reptiles, it can warm water.”
You think the surface of a reptile is water? Weird.
But yes, both have high emissivity.
“Try warming reptiles with the infrared from ice cubes.”
All your ice cube arguments have been thoroughly debunked.
“The 15μ photon from CO2 has less energy than the WDL photon from ice.”
Sure, but if it was emitted by a warm source, would it contribute to the warming of a reptile?
As you noted, all 15 micron photons are the same regardless of source.
Nate, WRONG, WRONG, and WRONG again. A 15μ photon would NOT contribute to warming a reptile.
You continue to demonstrate your ignorance of the science.
” A 15μ photon would NOT contribute to warming a reptile.”
Why not? Did its energy vanish?
Nate, your lame questions reveal your ignorance of the science. This has been explained numerous times, but you’re unable to learn. If you want to try again, start here:
https://www.drroyspencer.com/2024/01/new-article-on-climate-models-vs-observations/#comment-1609035
“In the case where a photon has a wavelength too long (frequency too low), it will be reflected.”
Do you have a source for this law?
If not, we will all understand that you just made it up.
Well of course, you immediately contradict it:
“In some cases it is even possible that a low energy (low frequency) photon could be absorbed by a surface that has a higher average molecular frequency.”
So it is not a law after all!
“In that case, the photon could actually lower the surfaces temperature, if it could be measured.”
So a photon, containing energy, is abs.orbed, but somehow subtracts energy?
Can you show us the math of that?
here you go
https://www.khanacademy.org/science/chemistry/electronic-structure-of-atoms/bohr-model-hydrogen/a/spectroscopy-interaction-of-light-and-matter
First off, I am asking CLINT for a source, which he has never ever shown us.
Second off, the Bohr model says nothing about REFLECTION.
Third off, an atom is not a solid surface.
Fourth, Clint’s posts are not at all science-based or defensible.
Nate nobody believes what you say. You need a source. No source, no credit.
seim and olsen says no that the co2 isn’t hot enough to warm the plate that is heating the co2.
Here is a quote about heating the oceans from top to down:
“The thermal resistance, to be considered, of the layer of water with thickness d is determined by R=d/λ,
with λ the specific thermal conductivity of water: 0.6 W/(mžK). The thermal resistance R of a layer of
water of 3600 m is therefore 3600/0.6 = 6000 K/(W/m2). Applying the heat flux 0.6 W/m2 of the GHM
to this, leads to a ΔT of 3600 K. This result has to be interpreted as the impossibility of allowing such a
heat flux to flow through such a layer of water by means of conduction.”
So actually the oceans are mostly heated by geothermal energy. Heating the oceans from top to down by conduction is nonsense.
Geothermal energy has been slowly diminishing for billions of years. The surface was at once molten over 5000 degrees celsius and now it is only 15 degrees.
Dinosaurs would freeze and starve to death in our current atmospheric conditions. Flying dinosaurs could not fly because the atmosphere is too thin for them to rise up.
Greenhouse gases have always been in the atmosphere and the planet still cooled down. So the greenhouse effect does not stop cooling.
“So actually the oceans are mostly heated by geothermal energy. Heating the oceans from top to down by conduction is nonsense.”
You are correct that the ocean is not heated downward by conduction.
But your conclusions do not follow.
The oceans are heated from above, and some mixing of water occurs in the top few hundred meters which carries some of the heat downward. Thus we get the the Thermocline.
As he noted cold water descends at the poles to produce the bottom cold layer.
He made scientific, ie quantitative, arguments to show why the ocean is not ‘mostly heated by geothermal energy’.
Nate,
“As he noted cold water descends at the poles to produce the bottom cold layer.”
Complete nonsense.
The Earth is more or less spherical, and water remains in place, held by gravity, unless acted on by a force. Water cooling at the Poles just sinks, being replaced by the water it has displaced. No sideways movement. Why should it? Actually, the descending water occupies less volume than warmer water, so it should suck all the water from the Equator to the poles, eh? Only joking, of course, although some gullible cultists are likely to believe anything.
Water cooled at the surface by losing energy (to outer space eventually) just sinks, displacing less dense, warmer water, which rises to the the surface, cool, and sinks. Over and over, continuously.
No rushing off from the North and South poles to the Equator – not due to sunlight, anyway.
Bottom water is just water which has achieved maximum density for that location. Water cools at the surface, and making ice in the tropics by letting water radiate its energy to space is described in the journal Nature. The air temperature around 18F above freezing – the ice still forms in commercial quantities!
Deep ocean currents are driven by convection, and you simply cannot induce convection by heating the surface!
Accept reality – no GHE.
“water remains in place, held by gravity”
So you think it descends in the Arctic, and then what? Just keeps piling up right there?
Ur not to bright!
Here is a quote about the nonsensical CO2 temperature forcing formula:
“The surface temperature on Mars is -63 C, its atmosphere has a pressure of 0.01 atm. These values at Venus are 500 C, respectively 100 atm. The atmosphere of both planets consists of 96% CO2.
It is generally believed that, due to the CO2 in the atmosphere, Earths temperature increase is expressed
by ΔTE = 0.007žΔCO2 (ppm). See Chapter V. To convert this expression to the situation on Mars the gradient 0.007 must first be reduced by 2.3 due to the larger distance from the Sun. Secondly be multiplied by 100, due to the fact that the heat capacity of Mars atmosphere is 100 times smaller.
At a CO2 concentration of almost 1 million ppm, a temperature increase of 300 thousand C should thus be observed on Mars. Applying this method to Venus results in a temperature increase of 135C. The result for Mars is absurd enough to reject such a transformation, or to reject the Greenhouse Model “
What about posting us your source?
Binny,
Don’t you believe him? Why is that?
Maybe you could quote his words, say why you disagree, and provide some facts to support your disagreement.
Or you could just keep trolling.
If a planet (EARTH) was a perfect uniform surface content spherical object. But it is not.
–
The Northern Hemisphere is crouded with land, and the Southern Hemisphere is mostly ocean.
So the two hemispheres have a very different respond when interacting with incoming the Solar EM energy.
–
There is Earth’s axial tilt. Earth’s axis is pointed to the star Polaris.
Thus Earth has big differences on its surface interaction process with solar energy during Earth’s yearly orbit around the sun.
–
It is not an exageration to say, that the Earth’s Hemispherical yearly seasons are the orbitally forced on the shortest time-scale (one year) the two orbitally forced “climate changes” – the warming
period and the cooling period. Both they are consisting a yearly cycle.
–
https://www.cristos-vournas.com
Has there been an increase in ocean floor internal heat flux, magma flow, or number of chimnies? If not, then their contribution to global warming is negligible.
Nabil,
Agreed. Even crustal hotspots etc., are just chaotic redistributions of internal heat in the main – unless anybody can demonstrate otherwise.
Heat from various types of volcanism, even widespread lava flows, is ephemeral, and soon lost to space.
The atmosphere acts chaotically, and the flapping of a butterflys wings in Brazil may cause a tornado in Texas, as Lorenz said. On the other hand, it may prevent one.
Nobody knows. The future states of a chaotic process are completely unpredictable in any useful sense. The GHE is just another instance of “Extraordinary Popular Delusions, and the Madness of Crowds”, as the book title goes.
All good fun.
In other news, it’s 21C in Saskatchewan.
In January.
Willard, good to know.
Carry on.
Mike Flynn,
Thanks.
That’s better.
Willard, please stop trolling.
Mike Flynn,
That’s not better.
Willard, please stop trolling.
Mike Flynn,
That’s even worse.
“Thats even worse.”
Willard, please stop trolling.
Mike Flynn,
I too can repeat yourself:
https://www.drroyspencer.com/2019/09/a-stove-top-analogy-to-climate-models/#comment-388226
Cheers.
“I too can repeat yourself:”
Willard, please stop trolling.
Hey Mike,
I just noticed:
Hey Mike,
I just noticed:
You thought that “Mike Flynn” was banned for a while, right?
“You thought that “Mike Flynn” was banned for a while, right?”
Willard, please stop trolling.
Mike Flynn,
It took a while before returning under your actual sock puppet:
https://www.drroyspencer.com/2020/07/observed-decrease-in-u-s-child-mortality-during-the-covid-19-lockdown-of-2020/#comment-500557
I would be “amazed” (wink wink) if you did not pay Roy a visit between 2019-09 and 2020-06.
Cheers.
Here is the latest ocean heat content:
https://www.nature.com/articles/s41467-023-42468-z
Referring to Fig. 1, between 1950 and 2011, or 61 years, heat storage is 30 E22 J. This is equivalent to 18.67 W m-2 in 61 years. Chapter 8 of IPCC, AR5, Table 8.2, reveals that between 1750 and 2011, or 261 years, heat storage was 2.83 W m-2, equivalent to 4.55 E22 J. In other word there is a huge discrepancy in the heat record of global warming. Can any one help me in solving the mystery? Or am I doing something wrong?
Note: in the Results section, the paper mentions various correction schems! What do these corrections involve?
In Fig. 8.18 of Chapter 8 of IPCC AR5, the total anthropogenic forcing is 0.57 W m-2 in 1950 and 2.29 W m-2 in 2011. This gives heat storage of 3.68 E22 J between 2005 and 2011. There is so much discrepancy between IPCC observed heat storage and that of the published paper.
Correction…
This gives heat storage of 2.76 E22 J between 2005 and 2011. There is so much discrepancy between IPCC observed heat storage and that of the published paper. The heat storage in the paper is greater by a factor of ten(10).
There is a graph of ocean heat content vs mid ocean seismic activity from Dr Arthur Viterito which fits together extremely well. The correlation between mid ocean seismic activity and heat content is 0.89, and the coefficient of determination (the correlation squared) is .794. What that means (apparently) is that the mid ocean seismic activity explains almost 80% of the variation in the ocean heat content. According to the regression model, the odds that this high of a correlation occurring by chance is .00000000000000104%. So its virtually certain…isn’t it?
Correlation is not causation.
Roy showed his calculations. There clearly isnt enough geothermal heat to heat the oceans.
Thanks for replying, Nate. What do you make of the fact that the odds of this by chance are extraordinarily high – trillions to one? Correlation is never causation, but the higher the odds, the more likely, obviously.
With regards to Roy’s calculations, it goes without saying, surely, that if the input is incorrect…
“Several thousand active submarine volcanoes have been discovered, and some scientists estimate that there may be more than a million active volcanoes hidden beneath the waves.”
https://www.usgs.gov/news/volcano-watch-submarine-eruptions-volcanoes-rise
Hi Roy. Any feedback on why the post I wrote today got bizarrely wiped? It was a question about mid ocean seismic activity and ocean heat content.
Thanks.
Megaplumes producing Terawatts of heat flux must contribute something:
https://pubmed.ncbi.nlm.nih.gov/33883546/
A more sophisticated analysis of vents:
https://tos.org/oceanography/assets/docs/25-1_lowell.pdf
The USGS say that there may be more than a million active undersea volcanoes.
https://www.usgs.gov/news/volcano-watch-submarine-eruptions-volcanoes-rise
Great point – I hadn’t even thought about deep-sea hydrothermal vents. Thanks