
 Home/Blog
What follows is a response to Gavin Schmidt’s blog post at RealClimate.org entitled Spencer’s Shenanigans in which he takes issue with my claims in Global Warming: Observations vs. Climate Models. As I read through his criticism, he seems to be trying too hard to refute my claims while using weak (and even non-existent) evidence.
To summarize my claims regarding the science of global warming:
- Climate models relied upon to guide public policy have produced average surface global warming rates about 40% greater than observed over the last half-century (the period of most rapid warming)
- The discrepancy is much larger in the U.S. Corn Belt, the world-leader in corn production, and widely believed to be suffering the effects of climate change (despite virtually no observed warming there).
- In the deep-troposphere (where our weather occurs, and where global warming rates are predicted to be the largest), the discrepancy between models and observations is also large based upon multiple satellite, weather balloon, and multi-data source reanalysis datasets.
- The global energy imbalance involved in recent warming of the global deep oceans, whatever its cause, is smaller than the uncertainty in any of the natural energy flows in the climate system. This means a portion of recent warming could be natural and we would never know it.
- The observed warming of the deep ocean and land has led to observational estimates of climate sensitivity considerably lower (1.5 to 1.8 deg. C here, 1.5 to 2.2 deg. C, here) compared to the IPCC claims of a “high confidence” range of 2.5 to 4.0 deg. C.
- Climate models used to project future climate change appear to not even conserve energy despite the fact that global warming is, fundamentally, a conservation of energy issue.
In Gavin’s post, he makes the following criticisms, which I summarize below and which are followed by my responses. Note the numbered list follows my numbered claims, above.
1.1 Criticism: The climate model (and observation) base period (1991-2020) is incorrect for the graph shown (1st chart of 3 in my article). RESPONSE: this appears to be a typo, but the base period is irrelevant to the temperature trends, which is what the article is about.
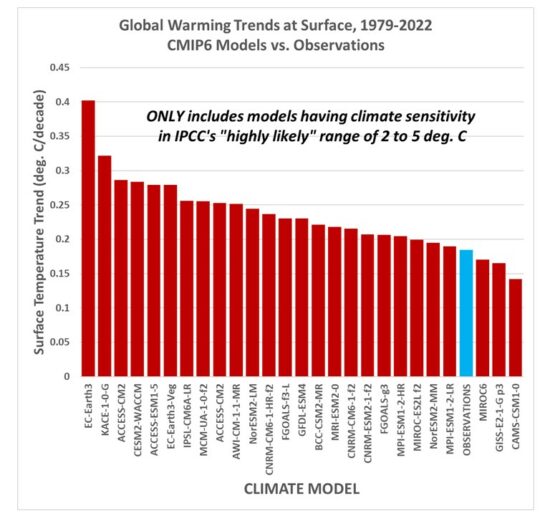
1.2 Criticism: Gavin says the individual models, not the model-average should be shown. Also, not all the models are included in the IPCC estimate of how much future warming we will experience, the warmest models are excluded, which will reduce the discrepancy. RESPONSE: OK, so if I look at just those models which have diagnosed equilibrium climate sensitivities (ECS) in the IPCC’s “highly likely” range of 2 to 5 deg. C for a doubling of atmospheric CO2, the following chart shows that the observed warming trends are still near the bottom end of the model range:
And since a few people asked how the results change with the inclusion of the record-warm year in 2023, the following chart shows the results don’t change very much.
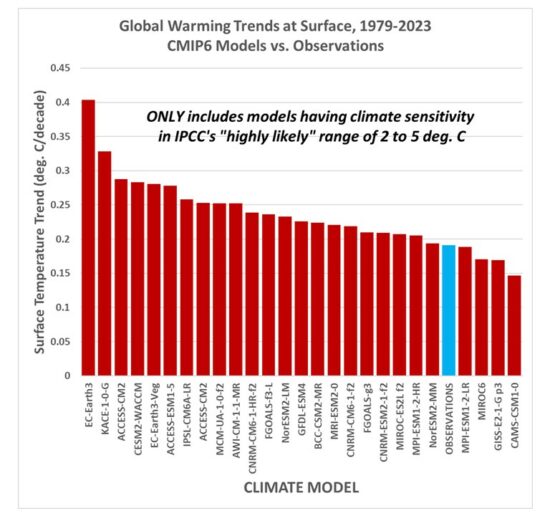
Now, it is true that leaving out the warmest models (AND the IPCC leaves out the coolest models) leads to a model average excess warming of 28% for the 1979-2022 trends (24% for the 1979-2023 trends), which is lower than the ~40% claimed in my article. But many people still use these most sensitive models to support fears of what “could” happen, despite the fact the observations support only those models near the lower end of the warming spectrum.
1.3 Criticism: Gavin shows his own comparison of models to observations (only GISS, but it’s very close to my 5-dataset average), and demonstrates that the observations are within the envelope of all models. RESPONSE: I never said the observations were “outside the envelope” of all the models (at least for global average temperatures, they are for the Corn Belt, below). My point is, they are near the lower end of the model spread of warming estimates.
1.4 Criticism: Gavin says that in his chart “there isn’t an extra adjustment to exaggerate the difference in trends” as there supposedly is in my chart. RESPONSE: I have no idea why Gavin thinks that trends are affected by how one vertically align two time series on a graph. They ARE NOT. For comparing trends, John Christy and I align different time series so that their linear trends intersect at the beginning of the graph. If one thinks about it, this is the most logical way to show the difference in trends in a graph, and I don’t know why everyone else doesn’t do this, too. Every “race” starts at the beginning. It seems Gavin doesn’t like it because it makes the models look bad, which is probably why the climate modelers don’t do it this way. They want to hide discrepancies, so the models look better.
2.1 Criticism: Gavin doesn’t like me “cherry picking” the U.S. Corn Belt (2nd chart of 3 in my article) where the warming over the last 50 years has been less than that produced by ALL climate models. RESPONSE: The U.S. Corn Belt is the largest corn-producing area in the world. (Soybean production is also very large). There has been long-standing concern that agriculture there will be harmed by increasing temperatures and decreased rainfall. For example, this publication claimed it’s already happening. But it’s not. Instead, since 1960 (when crop production numbers have been well documented), (or since 1973, or 1979…it doesn’t matter, Gavin), the warming has been almost non-existent, and rainfall has had a slight upward trend. So, why did I “cherry pick” the Corn Belt? Because it’s depended upon, globally, for grain production, and because there are claims it has suffered from “climate change”. It hasn’t.
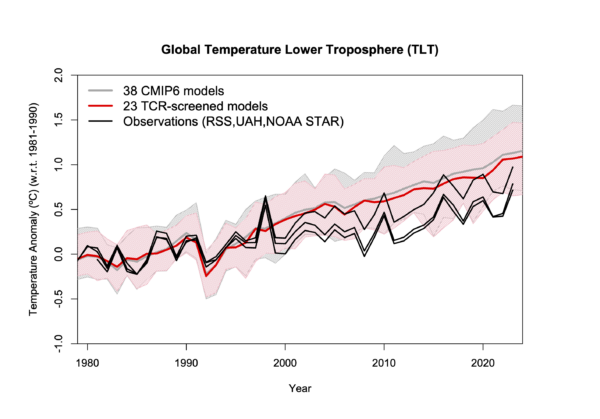
3.1 Criticism: Gavin, again, objects to the comparison of global tropospheric temperature datasets to just the multi-model average (3rd of three charts in my article), rather than to the individual models. He then shows a similar chart, but with the model spread shown. RESPONSE: Take a look at his chart… the observations (satellites, radiosondes, and reanalysis datasets) are ALL near the bottom of the model spread. Gavin makes my point for me. AND… I would not trust his chart anyway, because the trend lines should be shown and the data plots vertically aligned so the trends intersect at the beginning. This is the most logical way to illustrate the trend differences between different time series.
4. Regarding my point that the global energy imbalance causing recent warming of the deep oceans could be partly (or even mostly) natural, Gavin has no response.
5. Regarding observational-based estimates of climate sensitivity being much lower than what the IPCC claims (based mostly on theory-based models), Gavin has no response.
6. Regarding my point that recent published evidence shows climate models don’t even conserve energy (which seems a necessity, since global warming is, fundamentally, an energy conservation issue), Gavin has no response.
Gavin concludes with this: “Spencer’s shenanigans are designed to mislead readers about the likely sources of any discrepancies and to imply that climate modelers are uninterested in such comparisons — and he is wrong on both counts.”
I will leave it to you to decide whether my article was trying to “mislead readers”. In fact, I believe that accusation would be better directed at Gavin’s criticisms and claims.
P.S. For those who haven’t seen it, Gavin and I were interviewed on John Stossel’s TV show, where he refused to debate me, and would not sit at the table with me. It’s pretty revealing.


Schmidt is a lot like Hansen, they are both very bad at making predictions.
On the bright side, only four more years until the W. Side Highway is under water, and the species of birds have all changed to ostriches and toucans and the trees in the median will all be eucalyptus, trees, and palm trees.
https://wattsupwiththat.com/2009/10/22/a-little-known-but-failed-20-year-old-climate-change-prediction-by-dr-james-hansen/
Dr. Spencer,
I hope youll publish as well Gavin Schmidts admission of his errors in his article. I know its unlikely (highly) but I can hope that Schmidt will finally understand what a shenanigan is. In his writing its simply a personal attack in lieu of a data driven response. We await the fate of a similar debate in the Steyn v Mann trial. It appears that as with Dr Tim Ball of Canada, Mann will again be self hoisted on his always faithful petard.
// so if I look at just those models which have diagnosed equilibrium climate sensitivities (ECS) in the IPCCs highly likely range of 2 to 5 deg. C for a doubling of atmospheric CO2,//
Is there any experimental evidence that doubling CO2 causes this 2 to 5 C temp rise or is this only an artifact of model requirements and guesses to support them?
******
The model estimates are based upon theory. The observational evidence based upon warming of land and deep-ocean (which I just added as point #5) leads to numbers mostly below that range (1.5 to 1.8 deg. C [Lewis & Curry]; 1.5 to 2.2 deg. C [Spencer & Christy,2023]). -Roy
“The model estimates are based upon theory.” Or upon an unquantified feeling what makes a “pretty good assumption”, see https://judithcurry.com/2012/08/30/activate-your-science/#comment-234131.
This comment by ‘Gavin’ declares “If the specific heats of condensate and vapour is assumed to be zero (which is a pretty good assumption given the small ratio of water to air, and one often made in atmospheric models)”. Examining this assumption in detail I found that it overstates the transfer of energy by water evaporation from tropical seas by 3%.
I am not saying that this 3% error would lead to a 3% error in absolute temperature, but a 3% error in temperature of tropical seas is a whopping 9 degrees K, or 16 degrees F. Too big to dismiss by a hand waving.
Roy
Not sure what Gavin has been smokin – correct me if Im wrong, but hasnt IPCC repeatedly revised Equilibroum Climate Sensitivity numbers downward in the last several reports.
Ive read numerous studies on the topic, including one from a cabal of the top warmists that the climate models are broken.
The point about the Russian INCM4 and 5 models is an important one – they are the only models that got it close.
At one point I reviewed them for where they are different and it was fairly illuminating – perhaps an article reviewing their differences would be illustrative and useful?
> Climate models used to project future climate change appear to not even conserve energy despite the fact that global warming is, fundamentally, a conservation of energy issue.
That looks stronger than the original claim: Climate Models Assume Energy Balance, but Have Difficulty Achieving It
And since we’re into “revealing” things, it is revealing that this report is published by the Heritage Foundation.
Nice to see both sides of the argument discussed this way.
Good points made by both.
I don’t think it is correct to claim that climate models are relied upon by the public or congress to determine policy.
I think the observations of AGW and the consequences that can be observed directly by the public are more important than models, which have technical caveats and are admittedly still imperfect.
Nate, I respectfully disagree. Public perception is part of the problem with claims of a climate crisis. Young people are not in a position to make observations about “the worst weather I have ever seen”. There is a widely held belief that seasons should always be nearly the same. Winter should have the same pattern each year and so should summer. The fact is that weather variability is not evidence of climate change. It is the opposite. It is completely natural to have year-to-year, and decade-to-decade variability.
The news media who know very little science are another part of the problem. They often state that “the latest study says that with climate change we can expect…” Knowledgeable people understand that studies are often very speculative, but the public does not. I recently heard a news anchor state “now with all of these greenhouse gases accumulating world wide.” They used the word “now” as if there never was any kind of greenhouse effect, or maybe water vapor has no effect. Then there is the tired old line that we have to listen to “the science” because 98% of scientist agree.
Public perception should never replace science skepticism in policy decisions. Science used to work that way. In the past, they had to prove their case with something more than a claim of consensus.
Sorry, but it is simply the reality that public perception moves the needle on policy.
The public can perfectly well understand that 2023 was the warmest on record.
They can perfectly understand that July 2023 was the hottest on record.
They can perfectly well see that this is the latest in 40 years of breaking such records.
They can perfectly well see that Western and Canadian fires keep breaking size records.
They can perfectly well see the western reservoirs reaching record minima.
They can perfectly well see that there have been more cat 4 and 5 hurricanes.
They can perfectly well see heat waves and droughts in Europe and elsewhere.
They can perfectly well see the extreme rainfall and flooding that keeps happening.
They can perfectly well see the weirdness of having repeated deep freezes in Texas, and winter-time tornadoes in the South.
And while not all of this can be 100% attributed to AGW, a lot of it certainly can, and they can understand that the science predictions of more warming and more extreme weather have not been wrong.
Nate, thank you for proving my point that anecdotal belief by the public currently defies scientific analysis.
False, Tim.
Unfortunately you do this all the time. You belittle your opponents posts without offering a rationale or specifics.
We are supposed to get in your head to know what your problems are.
It aint convincing.
Nate, I try to work with you when you are being reasonable. I will not play your strawman. Sorry! You listed a bunch of things that are not, and cannot be directly linked to CO2. That is just about the exact definition of an anecdote, so yes, you simply proved my point about the public being mislead and confused with anecdotes. If your want back and forth with insults and the strawman, then work with the rest of the crew here who like that. I will be respectful with anyone who wants to behave that way.
Nate, you heard it here first. The news media are going crazy about an upcoming major storm in California. It will be blamed on “the climate crisis”. People in their 20s will state with certainty that nothing like this has ever happened. But wait a minute. What does Wikipedia have to say. I knew about 1938, but this one is more recent:
“During the events of January and March 1995, over 100 stations recorded their greatest 1-day rainfalls in that station’s history. The major brunt of the January storms hit the Sacramento River Basin and resulted in small stream flooding primarily due to storm drainage system failures, though flooding affected nearly every part of the state. The Salinas River exceeded its previous measured record crest by more than four feet, which was within a foot or two of the reputed crest of the legendary 1862 flood. The Napa River set a new peak record, and the Russian and Pajaro rivers approached their record peaks. 28 people were killed and the flood cost $1.8 billion.”
https://en.wikipedia.org/wiki/Floods_in_California
Sorry, I just caught this. Nate says this:
“Unfortunately you do this all the time. You belittle your opponents posts without offering a rationale or specifics.”
You just revealed your true intent. I do not have any “opponents” except anyone on either “side” that is spewing nonsense.
right Tim. BS isn’t an opponent. It always loses. Just needs a steady finger to push it over.
Here is TS’ Very Serious stance in a nutshell:
https://climateball.net/but-the-press/
TS is not that serious.
Willard, I do not usually respond to your nonsense, but this one is just too humorous. How do you expect people to take you seriously with a childish web page full of stereotypes? Have you changed it? I looked once, and it seemed like a joke. Is it a joke?
Nate
Where I would agree with your posts when they deal with established science I might have to say, at least on one of your points…may investigate the others later.
YOU: “They can perfectly well see the weirdness of having repeated deep freezes in Texas, and winter-time tornadoes in the South.”
Looks to me they get cold in Texas (Dallas) at least some time every year. This one does not give the duration of the cold days but it shows it does get cold in Texas (at least Northern Texas).
https://www.currentresults.com/Yearly-Weather/USA/TX/Dallas/extreme-annual-dallas-low-temperature.php
Here is the artic blast that left Texas in the cold in 2021 (if the link works)
http://tinyurl.com/33rm5r5r
How does it compare to December 1983?
http://tinyurl.com/2p9sk9yf
Yep I first heard this in the 1960’s.
1 January 1922. Dallas Morning News, magazine section, pg. 1:
Amarillo climate has been much maligned, residents say. An old gag that theres nothing between Amarillo and the North Pole but a barbed wire fence is no longer funny to people who live here, even when they are not at all interested in the real estate business. As a matter of fact, the average mean winter temperature is 43 degrees and the average mean summer temperature is 69 degrees.
23 June 1924, Dallas Morning News, part 2, pg. 10:
Indeed, some of them did not deny having favored the two days of quite warm weather in order that the old calumny might be disprovedthe calumny that represented Amarillo as being the last station between the temperate zone and the North Pole, with only a dejected barb wire fence for a windbreak.
Yep, I first heard this in the 2000s:
https://www.barrypopik.com/new_york_city/entry/theres_nothing_between_amarillo_and_the_north_pole_except_a_barbed_wire_fen/
I prefer Karl Rove’s hunting stories tho:
https://millercenter.org/the-presidency/presidential-oral-histories/karl-rove-oral-history-part-ii
Boone Pickens needs no introduction.
“I dont think it is correct to claim that climate models are relied upon by the public or congress to determine policy.”
You would be wrong.
And you know that how?
they are spending lots of money and the models are their only cover.
Richard says stuff, and Gill piles on.
Tom Martin
Observations do not show low ECS
A very basic back of the envelope calculation notes that CO2 concentration has increased by 50% from 280ppm to 420ppm.
Meanwhile temperatures have risen by 1.37C.
That gives a TCR of 2.74C per doubling and a minimum bound for ECS of 2.74.
At the start of the Holocene a warming of 5C occurs and CO2 increases by 40% from 200 to 280 ppm.Assuming that 1.2C of the warming is due to orbital cycles, the remaining warming due to CO2 gives an ECS of 5.42.
Correlation does not imply causation.
But in science that’s usually the way to bet, especially when you know the mechanism causing the correalation.
E,
Your mechanism for some sort of unstated correlation is “The greenhouse effect is a stack of blankets.”
Tell me again, why is a stack of blankets referred to a a greenhouse effect, or a greenhouse, or something equally silly?
CO2 heats nothing. Thermometers respond to heat, not CO2 or a pile of blankets. A warehouse full of blankets is the same temperature as a warehouse full of anything else.
The Earth has cooled over the past four and a half billion years.
EM,
Do not assume that past and present climates have the same physics. They are different, and this is one of the reasons of climate model problems. They used past climates to project the future one. WRONG!!
Please sea a prepringnt on the subject entitled on the physics of glaciations, https://orcid.org/0000-0003-1976-5516
I hope you are not suggesting that the laws of physics are changing over time.
Why should the Navier-Stokes equations not describe past climate as they describe present climate?I
EM,
I can’t respond to your gotcha on Nabil’s behalf, but I will on mine.
The laws of physics don’t change.
The Earth has cooled for four and a half billion years, and the same physical laws exist now, as they did then.
You aren’t seriously proposing some previously unknown law has just started to ring into existence, are you? Or are you just believing that you can predict future states of a chaotic system?
I don’t believe you can.
Entropic man, the laws of physics haven’t changed, but why the massive discrepancy between the models?
EM,
Suppose I have never researched what I would like to whine about.
Should I ask you a leading and loaded question instead of scratching my own itch?
So the question remains to answered. Who is the real shenanigator and which website engages in the most shenanigation?
The alarmists, simply by the way they argue and gaslight others.
Two Very Serious Contrarians Are Asking Tough Questions
In my opinion Dr. Schmidts claim of cherry picking of data based on geographic location and season is not scientific. More important is how representative is the data for evaluating climate models. Lets face it, good earth related data are hard to come by. And if we reject data based on geographic location or season, we would have no data at all. We may as well reject tree rings, pollen core samples, deep ocean core samples, ice core samples, and others.
The corn belt surface air temperature data are reasonably representative for comparison with climate models: Table 2.7 of Chapter 2, IPCC AR5, shows that the increases in the global mean surface temperature between 1979 and 2012 is 0.16 C per decade. This is slightly higher than the summer temperature trend of the corn belt used in Dr. Spencers analysis, about 0.13 C per decade. The procedure is thus acceptable. The agreement between the trend of surface air temperature of the corn belt and global mean surface temperature may be explained as follows: 1) The corn belt, between 35 N and 47 N, encompasses the global average of 40 N and the geographic location is acceptable. 2) Surface air temperature rise is greater than the global mean surface temperature rise and the corn belt air temperature data have thus a conservative climate component. 3) The corn belt is in the northern hemisphere which warms faster than average, and the corn belt is in the northern hemisphere. The data have thus another conservative component. 3) The temperature rise during the summer is less than that during the winter colder season, and the data does not a conservative component. However, when all of these climatic factors are considered simultaneously, they appear to cancel out reasonably, and using summer air temperature data of the corn belt is representative for comparison with climate models. On the other hand, long term temperature trend cancels out weather variability. I give Dr. Spencer 1 and Dr. Schmidt 0.
For Dr. Schmidt:
The full multi-model mean and spread is 0.26C/dec [0.16,0.46]. This is much higher than what is observed. If you are relying on the latest ocean heat storage, then please do not. They are showing much more heat than actual, presumably as a result of various correction schemes ! Here is the latest ocean heat content:
https://www.nature.com/articles/s41467-023-42468-z
As you can see from Fig. 1 of this paper, it is inconceivable that the heat storage between 2005 and 2011 to be 10 times greater than that between 1750 and 2011 as IPCC AR5 shows in terms of forcing. Please compare Fig. 1 of the paper with Fig. 8.18 of Chapter 8 of IPCC AR5.
Nabil Swedan, https://orcid.org/0000-0003-1976-5516
Correction for the last paragraph
As you can see from Fig. 1 of this paper, it is inconceivable that the heat storage between 1950 and 2011 to be 10 times greater than that between 1750 and 2011 as IPCC AR5 shows in terms of forcing. Please compare Fig. 1 of the paper with Fig. 8.18 of Chapter 8 of IPCC AR5.
More discussion of the hot model problem.
https://www.theclimatebrink.com/p/revisiting-the-hot-model-problem
Thanks, EM.
After reading the article in full, I can state that it is well written, informative, and based on sound scientific analysis. It answers TS’ question as to whom is into shenanigans, and who’s not.
Well done, Zeke!
… and Andrew too!
I also forgot to add that I rather liked these bits:
Wilard, science is open to discussion which is why scientists have become sceptical of the IPCC singular point of view. Its why people see the flaccid Micheal Mann, & those of his ilk, as fakes.
> science is open to discussion
Is this why you never discuss anything, Dear Anon?
Your trick is very tired.
Indeed!!!
That is a very interesting “study” that comes to a very predictable conclusion. They could have stated something to the effect that the science is open to discussion, and reasonable scientists can disagree. Instead we have this:
“Ongoing research will continue to sharpen our understanding of ECS, but it won’t change the immediate task before us: the rapid decarbonization of our society. This remains our paramount challenge, regardless of the precise severity of the climate threat.”
No bias there! It is a clear message that people should not ask questions, research the issue, or seek further clarification, just shut up and do what you are told!
CO2 is a simple molecule with a carbon atom inline between a pair of oxygen atoms. It does not generate heat in any way whatsoever so it cannot increase the temperature of anything in the environment. As with everything else it passes on heat energy from heat sources to heat sinks via conduction, convection or radiation in a natural effort to achieve thermal equilibrium.
The climate sensitivity to CO2 is zero, however there is a high probability that temperature determines the rate of generation of CO2.
The purpose in setting up the UN IPCC was purely political, namely, to cripple capitalism because fossil fuels provided cheap, reliable energy a major factor in the success of the capitalist system much to the chagrin of those who wish to rule the World.
Well said, Bevan.
” CO2 is a simple molecule with a carbon atom inline between a pair of oxygen atoms. It does not generate heat in any way whatsoever so it cannot increase the temperature of anything in the environment. ”
You could have written exactly the same stuff about H2O in its water vapor form.
Neither H2O let alone CO2 do ‘increase the temperature of anything in the environment’.
Their presence in the atmosphere reduce the amount of IR (generated by our Earth in reply to the solar radiation) directly escaping to space.
*
I’m over 70, dont’ expect to live further more than 10 years, and thus would have no problem if suddenly the three greatest supervolcanos on Earth (Lake Toba, Yellowstone and the Campi Phlegrei) would simultaneously explode around 2035.
The effect would be such an incredible reduction in solar radiation that the Globe would cool within years to such an extent that subsequently, all water vapor in the troposphere would precipitate.
People like you and the GHE denŷer maffia on this blog then would learn what the GHE really is – if they were young enough…
Binny,
You wrote –
“People like you and the GHE denŷer maffia on this blog then would learn what the GHE really is if they were young enough”
If you could describe the GHE, that would be a great help.
You said several times “Increasing the amount of CO2 between the Sun and a thermometer makes the thermometer hotter.”, then you said what you said was nonsense.
Maybe you can’t quite make up your mind about the role of CO2 in four and a half billion years of planetary cooling. It should take less than ten years, surely? How hard can it be?
Suppose that, for example, 350 w/m**2 of the LWR radiation manufactured by infrared-active molecules in the troposphere leaks out of the bottom of the troposphere and penetrates the surface, and suppose, for example, 230 w/m**2 of the LWR manufactured by infrared-active molecules in the troposphere leaks out of the top of the troposphere. If a certain increase is made in the quantity of the infrared-active molecules in the troposphere then the energy that leaks out of the bottom increases to a power flux (energy rate per area) of 351 w/m**2, and the energy that leaks out of the top of the troposphere decreases to a power flux (energy rate per area) of 229 w/m**2 (so energy goes to space more slowly so sheds earth’s heat more slowly). The reason is simply that the top of the troposphere is cooler than the bottom of the troposphere and cooler parcels of molecules emit less radiation than warmer parcels of molecules, and it’s all definite, non-controversial, simple physics with the effect measured from space over the spectral range continuously since 1964 (IRIS-A on Nimbus 1).
Roy, I was late to the party and did not comment on your latest article for the Heritage Foundation.
One problem which has always concerned me about your work is the method used to compare the various data sets. As we know, the satellite data records a weighted average of emissions over a range or altitude, as seen in the MT data. The LT v6 data combines data from 3 channels with the initial intent of counteracting the influence of the cooling Stratosphere on the MT channels.
The model results and sonde data are presumably available at discrete pressure altitudes. To properly compare these data with the satellite, one would think that you would first convert them using satellite weighting to create synthetic time series. You guys don’t mention anything about that in your paper.
Also, the sonde data is usually collected twice a day at midnight and noon GMT. For the Corn Belt, the sample time is about 6 or 7 AM or PM. As a result, these data may be capturing the daily morning low temperature, but not the daily high temperature. Then, of course, you still would need to apply the above mentioned conversion calculation.
In short, lacking a more through description of your method, I submit that your Heritage paper is useless.
After watching the video TV “debate” between Drs Spencer and Schmidt it is clear who the professional is. Dr Spencer presented himself both in appearance and conduct as professional and dignified. Schmidt clearly has a sloppy image from the way he dresses and his rant came over as deranged, irrational and argumentative. How he won an award for communication baffles. Being British I am slightly embarrassed and feel compeld to extend apology to Dr Spencer, that said Schmidt is not an old British name….. Carry on doing the good work Dr Spencer, Schmidt will get bored when he has no more toys left in his pram.
The model results and sonde data are presumably available at discrete pressure altitudes. To properly compare these data with the satellite, one would think that you would first convert them using satellite weighting to create synthetic time series. You guys dont mention anything about that in your paper.