
 Home/Blog
This month I’m adding plots for USA48 and Canada, too.
The Version 6.1 global average lower tropospheric temperature (LT) anomaly for April, 2026 was +0.39 deg. C departure from the 1991-2020 mean, which remains statistically unchanged for 4 months now.
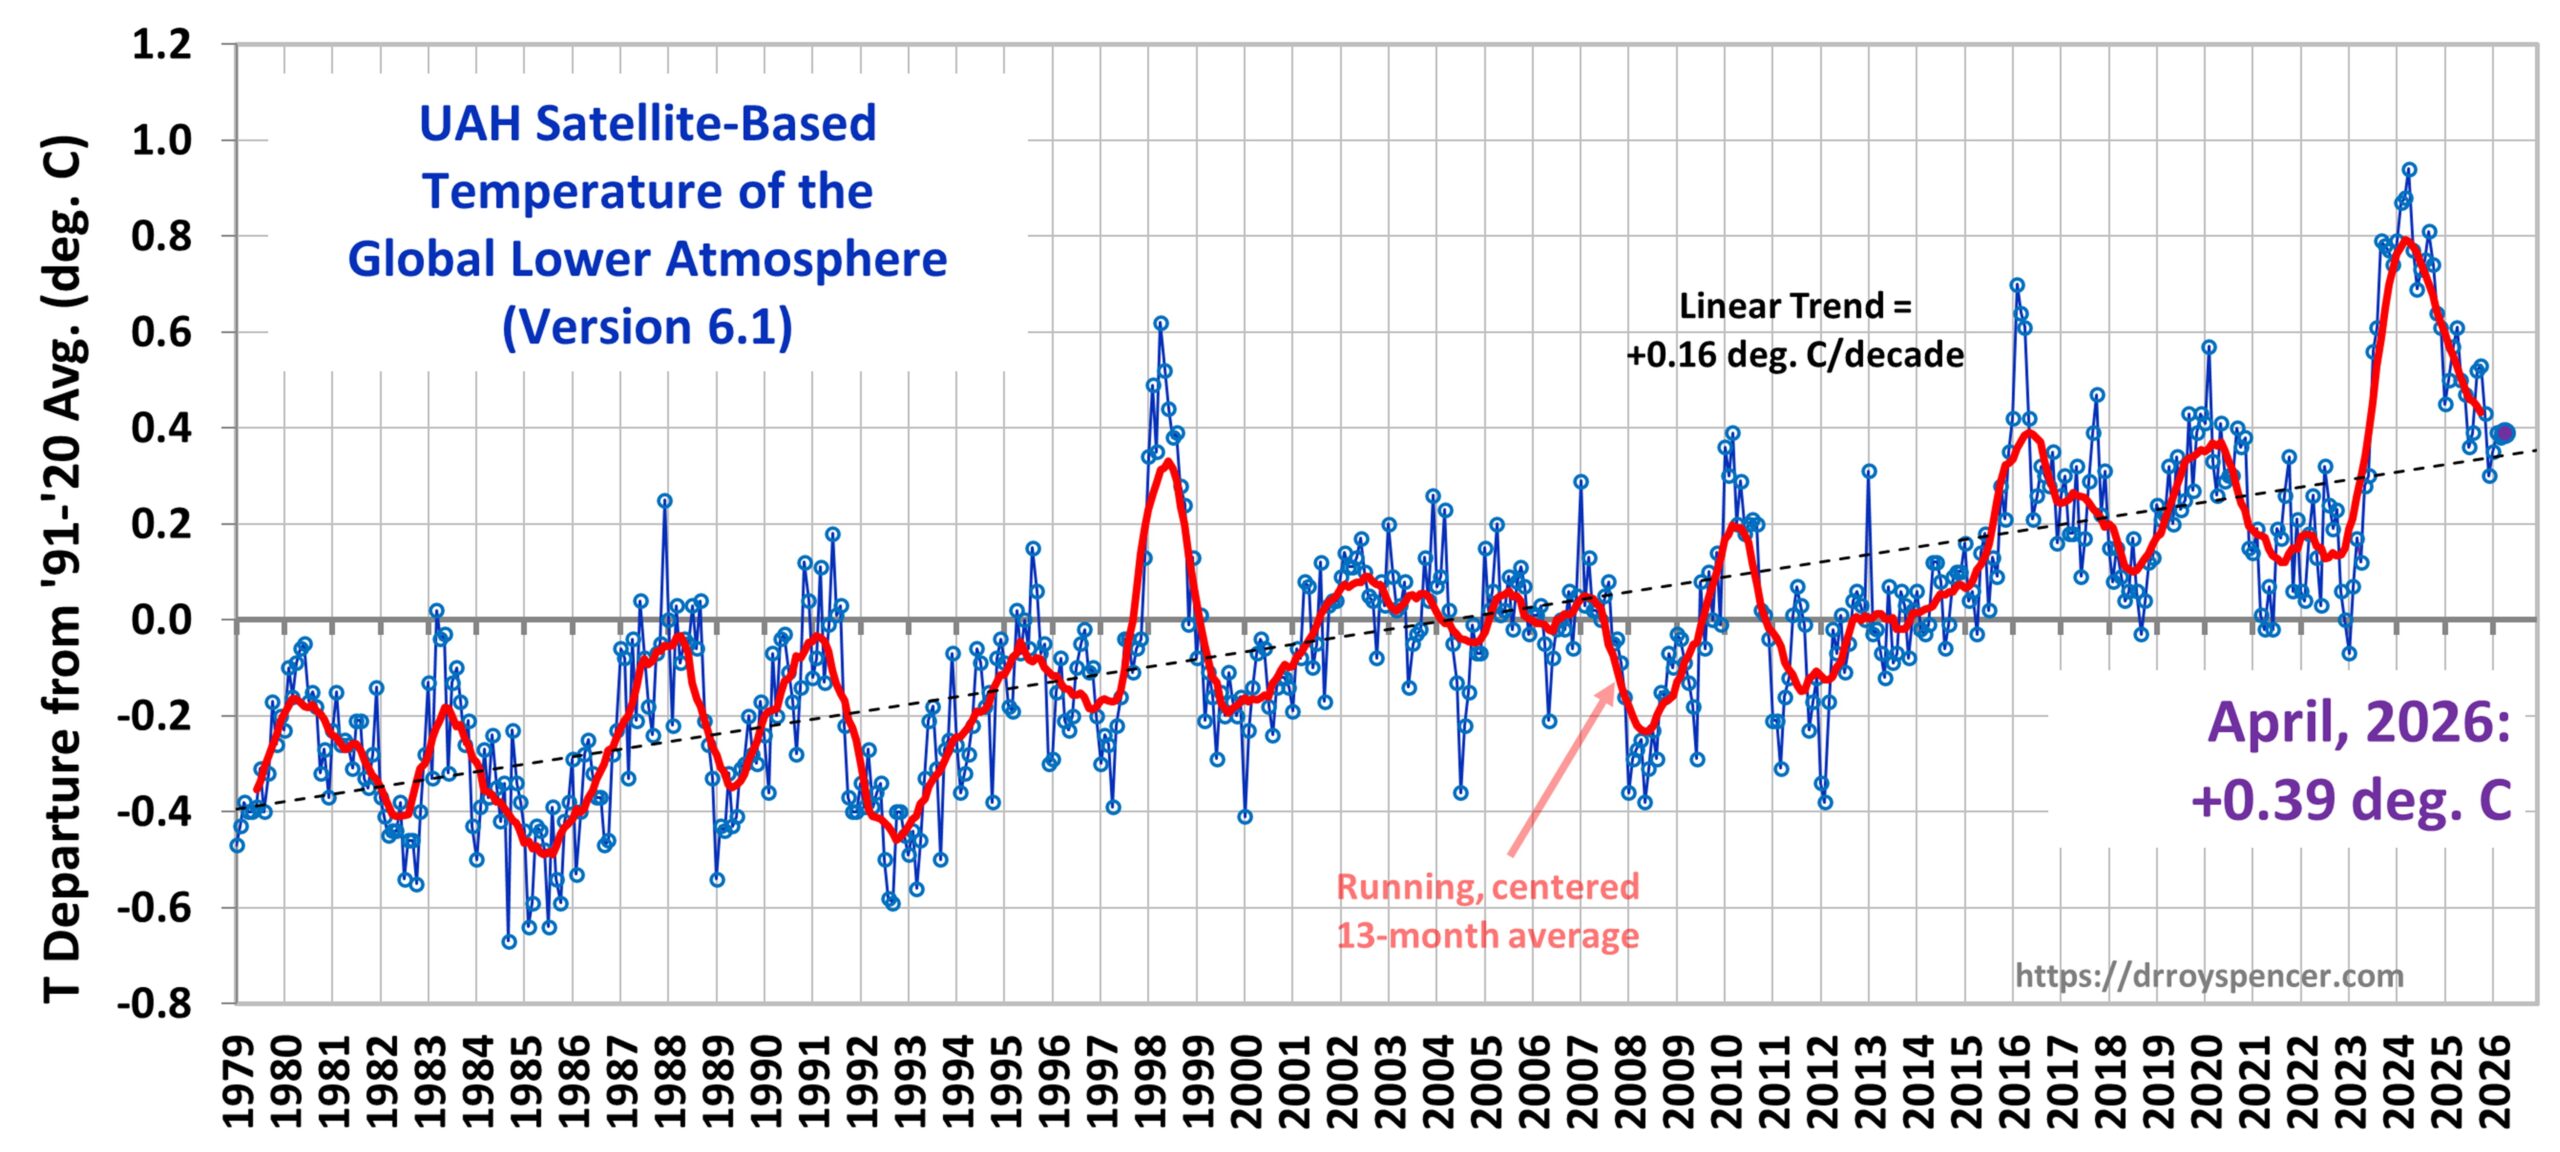
The Version 6.1 global area-averaged linear temperature trend (January 1979 through April 2026) remains at +0.16 deg/ C/decade (+0.22 C/decade over land, +0.13 C/decade over oceans).
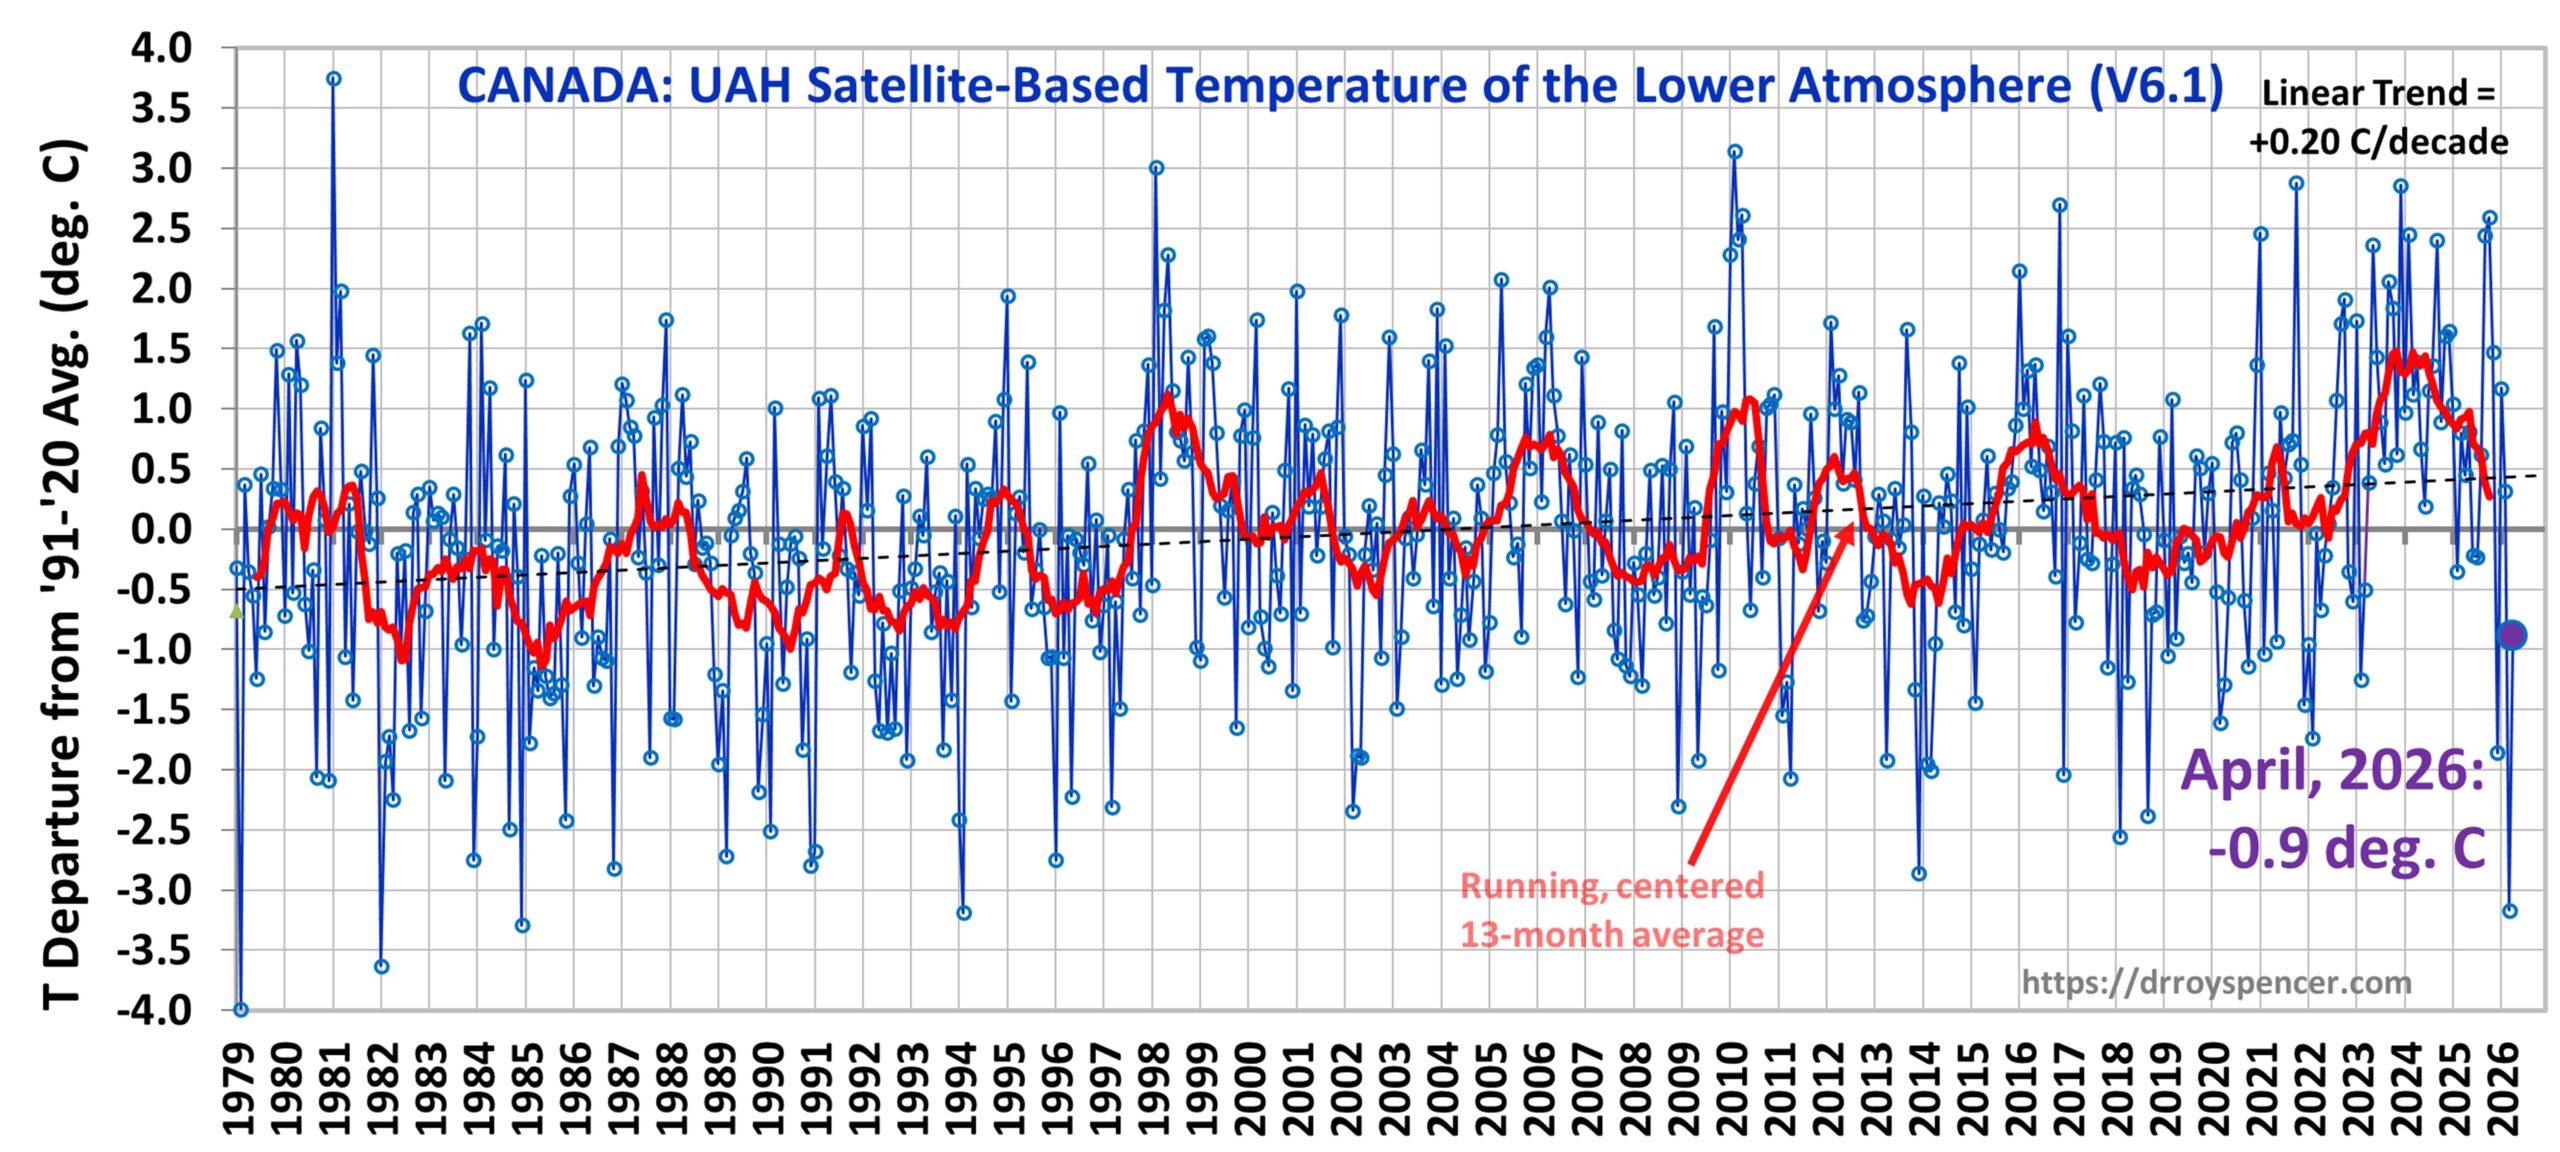
The following table lists various regional Version 6.1 LT departures from the 30-year (1991-2020) average for the last 28 months (record highs are in red). Note I’ve added Canada to the table this month, by request (although WordPress won’t allow me to add September 2024 for some reason). The warmest April in Canada was in 2010 (+2.61 deg. C), while the warmest anomaly out of all months was in January 1981 (+3.75 deg. C).
| Year | Mon | Globe | NHem | SHem | Tropic | US48 | Arctic | Aust. | Can. |
| 2024 | Jan | +0.80 | +1.02 | +0.57 | +1.20 | -0.19 | +0.40 | +1.12 | +0.97 |
| 2024 | Feb | +0.88 | +0.94 | +0.81 | +1.16 | +1.31 | +0.85 | +1.16 | +2.45 |
| 2024 | Mar | +0.88 | +0.96 | +0.80 | +1.25 | +0.22 | +1.05 | +1.34 | +1.12 |
| 2024 | Apr | +0.94 | +1.12 | +0.76 | +1.15 | +0.86 | +0.88 | +0.54 | +1.39 |
| 2024 | May | +0.77 | +0.77 | +0.78 | +1.20 | +0.04 | +0.20 | +0.52 | +0.67 |
| 2024 | June | +0.69 | +0.78 | +0.60 | +0.85 | +1.36 | +0.63 | +0.91 | +0.19 |
| 2024 | July | +0.73 | +0.86 | +0.61 | +0.96 | +0.44 | +0.56 | -0.07 | +1.15 |
| 2024 | Aug | +0.75 | +0.81 | +0.69 | +0.74 | +0.40 | +0.88 | +1.75 | +1.36 |
| 2024 | Sep | +0.81 | +1.04 | +0.58 | +0.82 | +1.31 | +1.48 | +0.98 | |
| 2024 | Oct | +0.75 | +0.89 | +0.60 | +0.63 | +1.89 | +0.81 | +1.09 | +0.89 |
| 2024 | Nov | +0.64 | +0.87 | +0.40 | +0.53 | +1.11 | +0.79 | +1.00 | +1.61 |
| 2024 | Dec | +0.61 | +0.75 | +0.47 | +0.52 | +1.41 | +1.12 | +1.54 | +1.65 |
| 2025 | Jan | +0.45 | +0.70 | +0.21 | +0.24 | -1.07 | +0.74 | +0.48 | +1.04 |
| 2025 | Feb | +0.50 | +0.55 | +0.45 | +0.26 | +1.03 | +2.10 | +0.87 | -0.35 |
| 2025 | Mar | +0.57 | +0.73 | +0.41 | +0.40 | +1.24 | +1.23 | +1.20 | +0.80 |
| 2025 | Apr | +0.61 | +0.76 | +0.46 | +0.36 | +0.81 | +0.85 | +1.21 | +0.45 |
| 2025 | May | +0.50 | +0.45 | +0.55 | +0.30 | +0.15 | +0.75 | +0.98 | +0.81 |
| 2025 | June | +0.48 | +0.48 | +0.47 | +0.30 | +0.80 | +0.05 | +0.39 | -0.22 |
| 2025 | July | +0.36 | +0.49 | +0.23 | +0.45 | +0.32 | +0.40 | +0.53 | -0.23 |
| 2025 | Aug | +0.39 | +0.39 | +0.39 | +0.16 | -0.06 | +0.82 | +0.11 | +0.62 |
| 2025 | Sep | +0.53 | +0.56 | +0.49 | +0.35 | +0.38 | +0.77 | +0.30 | +2.44 |
| 2025 | Oct | +0.53 | +0.52 | +0.55 | +0.24 | +1.12 | +1.42 | +1.67 | +2.59 |
| 2025 | Nov | +0.43 | +0.59 | +0.27 | +0.24 | +1.32 | +0.78 | +0.36 | +1.47 |
| 2025 | Dec | +0.30 | +0.45 | +0.15 | +0.19 | +2.10 | +0.32 | +0.37 | -1.86 |
| 2026 | Jan | +0.35 | +0.51 | +0.19 | +0.09 | +0.30 | +1.40 | +0.95 | +1.17 |
| 2026 | Feb | +0.39 | +0.54 | +0.23 | +0.03 | +1.91 | -0.48 | +0.73 | +0.32 |
| 2026 | Mar | +0.38 | +0.33 | +0.42 | +0.07 | +3.74 | -0.48 | +1.14 | -3.17 |
| 2026 | Apr | +0.39 | +0.43 | +0.34 | +0.23 | +1.20 | +0.30 | +0.70 | -0.89 |
| Year | Mon | Globe | NHem | SHem | Tropic | US48 | Arctic | Aust. | Can. |
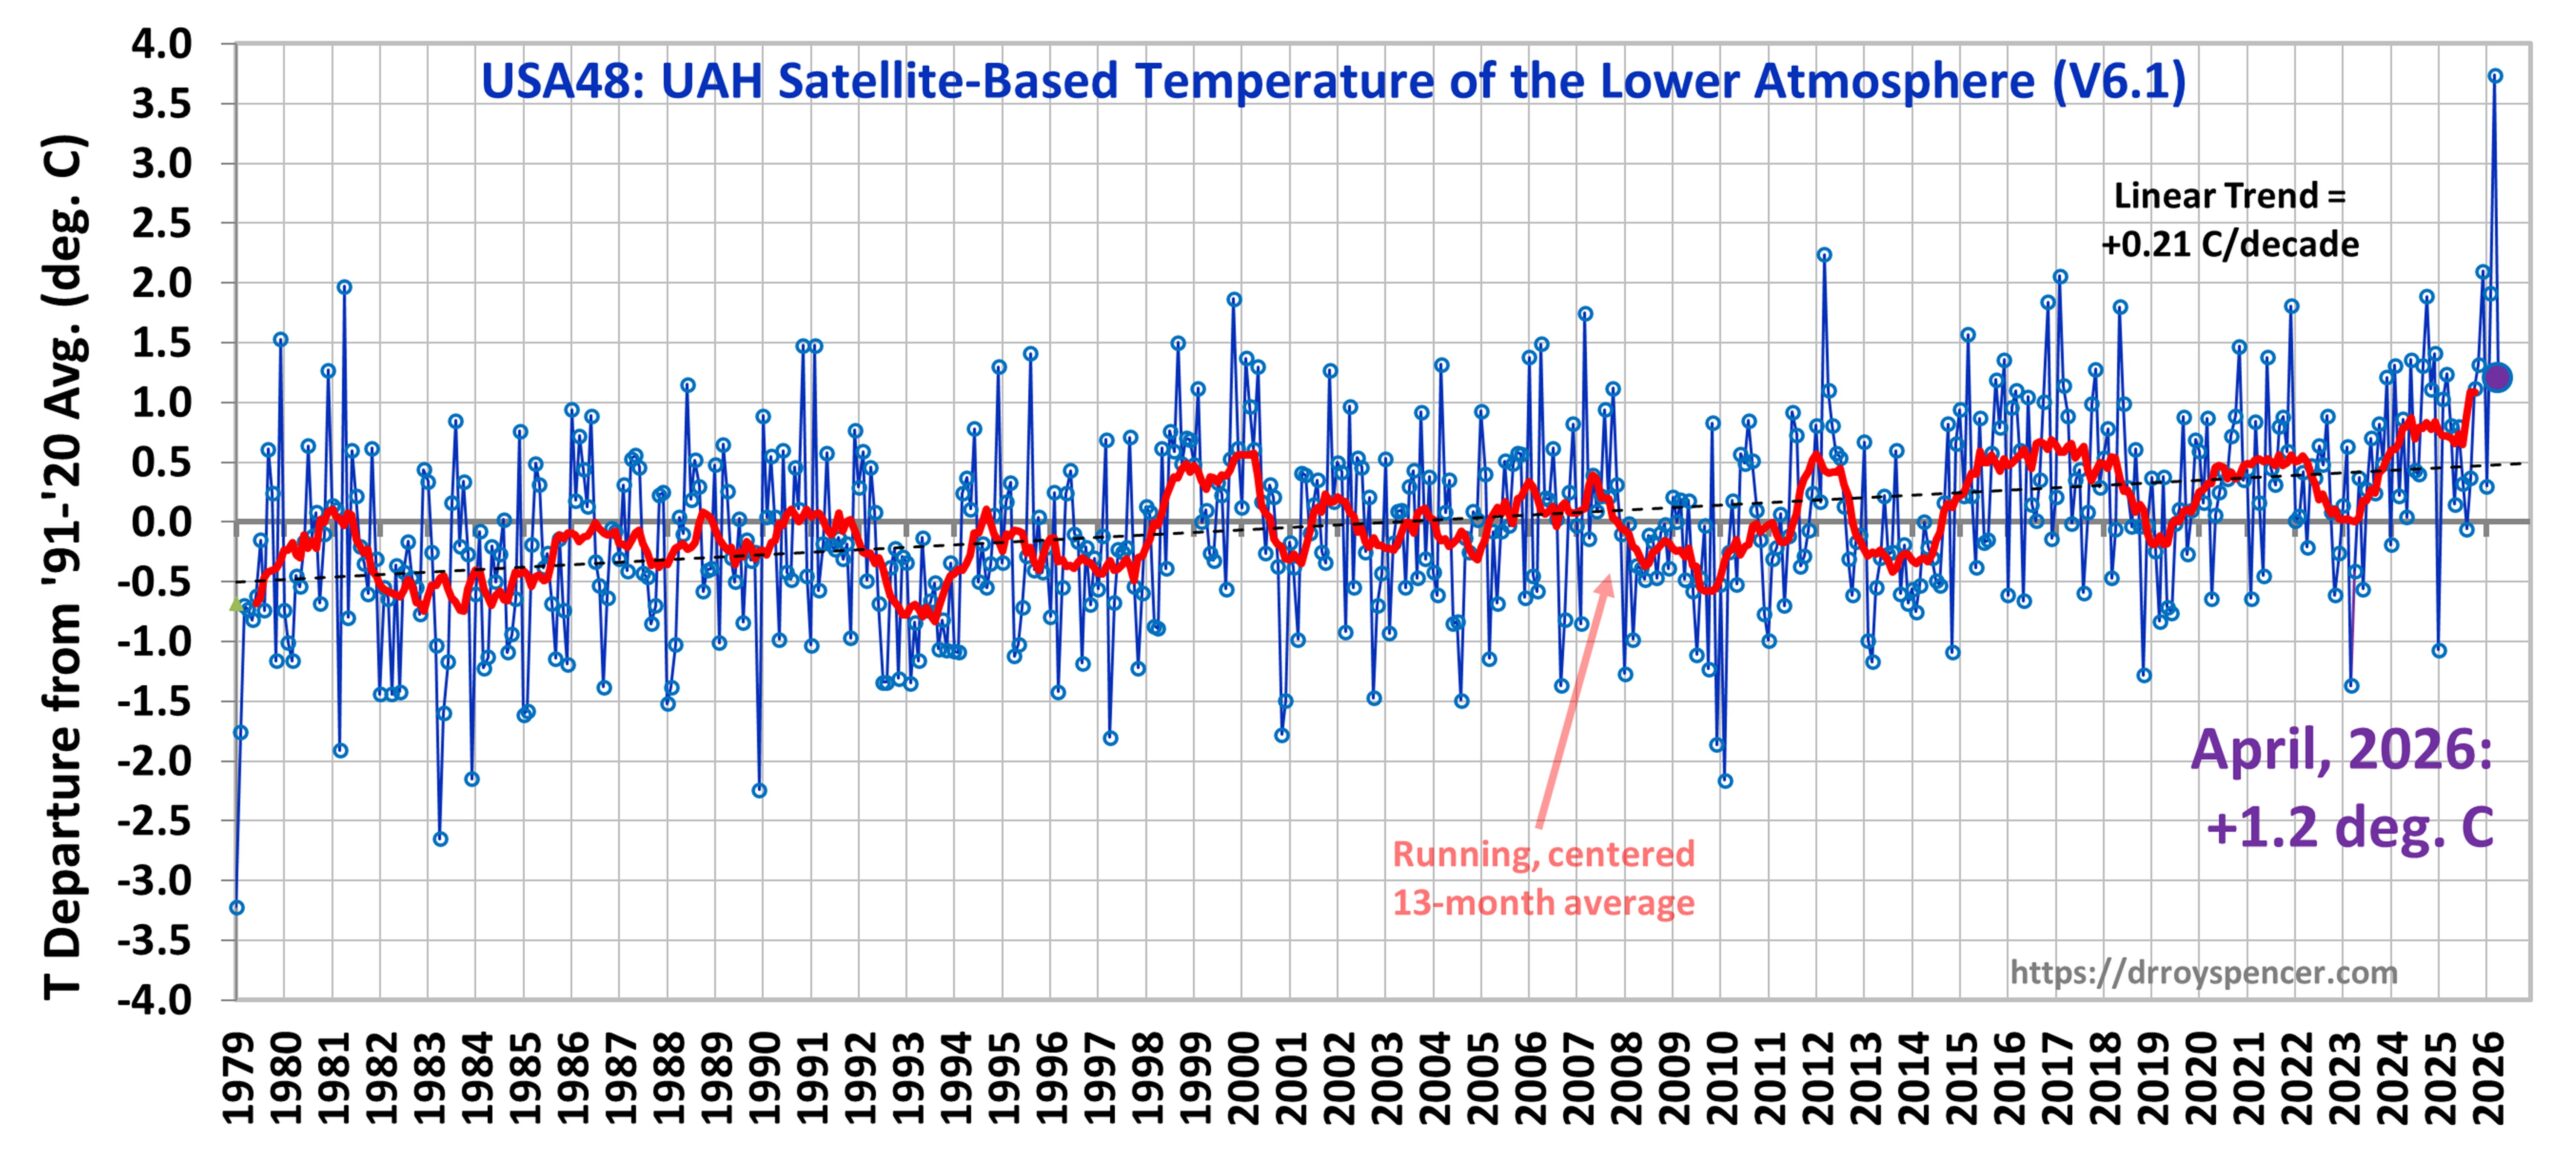
Time Series Plots for USA48 and Canada
Starting this month I will include time series graphs for USA48 and Canada, in addition to the usual global plot. Note that for the previous month (March) the record warmth in USA48 (+3.74 deg. C) was in stark contrast to the coldest March in Canada in the 48-year satellite record (-3.17 deg. C).
The full UAH Global Temperature Report, along with the LT global gridpoint anomaly map for April, 2026 and a more detailed analysis by John Christy, should be available within the next several days here.
The monthly anomalies for various regions for the four deep layers we monitor from satellites will be available in the next several days at the following locations:


My guess for the September 2024 problem is non-numeric data lurking in there.
The global anomalies for 2026 have started off remarkably consistent. Only 0.04C seperating all four months. Each month has been either 6th or 5th warmest.
Ten warmest Aprils since 1978:
Year Anomaly
2024 0.94
1998 0.62
2016 0.61
2025 0.61
2026 0.39
2019 0.32
2020 0.26
2022 0.26
2005 0.20
2010 0.20
Good to see Canada being added.
I’ve been experimenting with my own country estimates. This month fir instance the warmest anomalues by country were
Kyrgyzstan 2.41
Japan 2.34
Switzerland 2.26
Kazakhstan 2.24
Norway 2.11
France 2.09
Tajikistan 2.04
Luxembourg 1.98
Spain 1.95
Portugal 1.80
and the coldest anomalies were
Belarus -1.80
Ukraine -1.72
Moldova -1.27
Lithuania -1.26
Latvia -1.19
Libya -0.94
Canada -0.89
Syria -0.89
Georgia -0.88
N. Cyprus -0.79
Of course. smaller countries are more likely to have more extreme anomalies. so this ranking doesn’t mean much.
Given the established ~5-month lag between Niño 3.4 anomalies and global lower-tropospheric temperatures, should we expect mild cooling in the UAH data over the next three months as the lingering La Niña (negative Niño 3.4) signal finally works its way through the system?
It seems odd that the media is already pushing a “Super El Niño” narrative based on model forecasts, right in the middle of this lagged cooling phase—when we might instead see global temperature anomalies dip below the long-term warming trend for a while.
A Quick observation on UHI and elevation effects on temperature:
Yes, this is current weather and not climate, but it does make me wonder…
A classic cold front just went thru and we are under a pretty strong high. 5 minutes ago, Lunken airport in Cincinnati, Ohio reported current temperature 10 degrees lower than a station about 4 miles or so away. Lunken lies in a broad river valley, 300 to 400 feet below the other station which lies on the higher plain/hilltop topography and is closer to and almost part of the urban landscape (many paved surfaces, buildings, etc). The colder air has settled into the valleys overnight, creating some fog, just in the valleys.
10 degrees…in 4 miles.
We’re another month closer to the next official Monckton Pause.
My prediction is that next month’s anomaly will be lower than this month.