
 Home/Blog
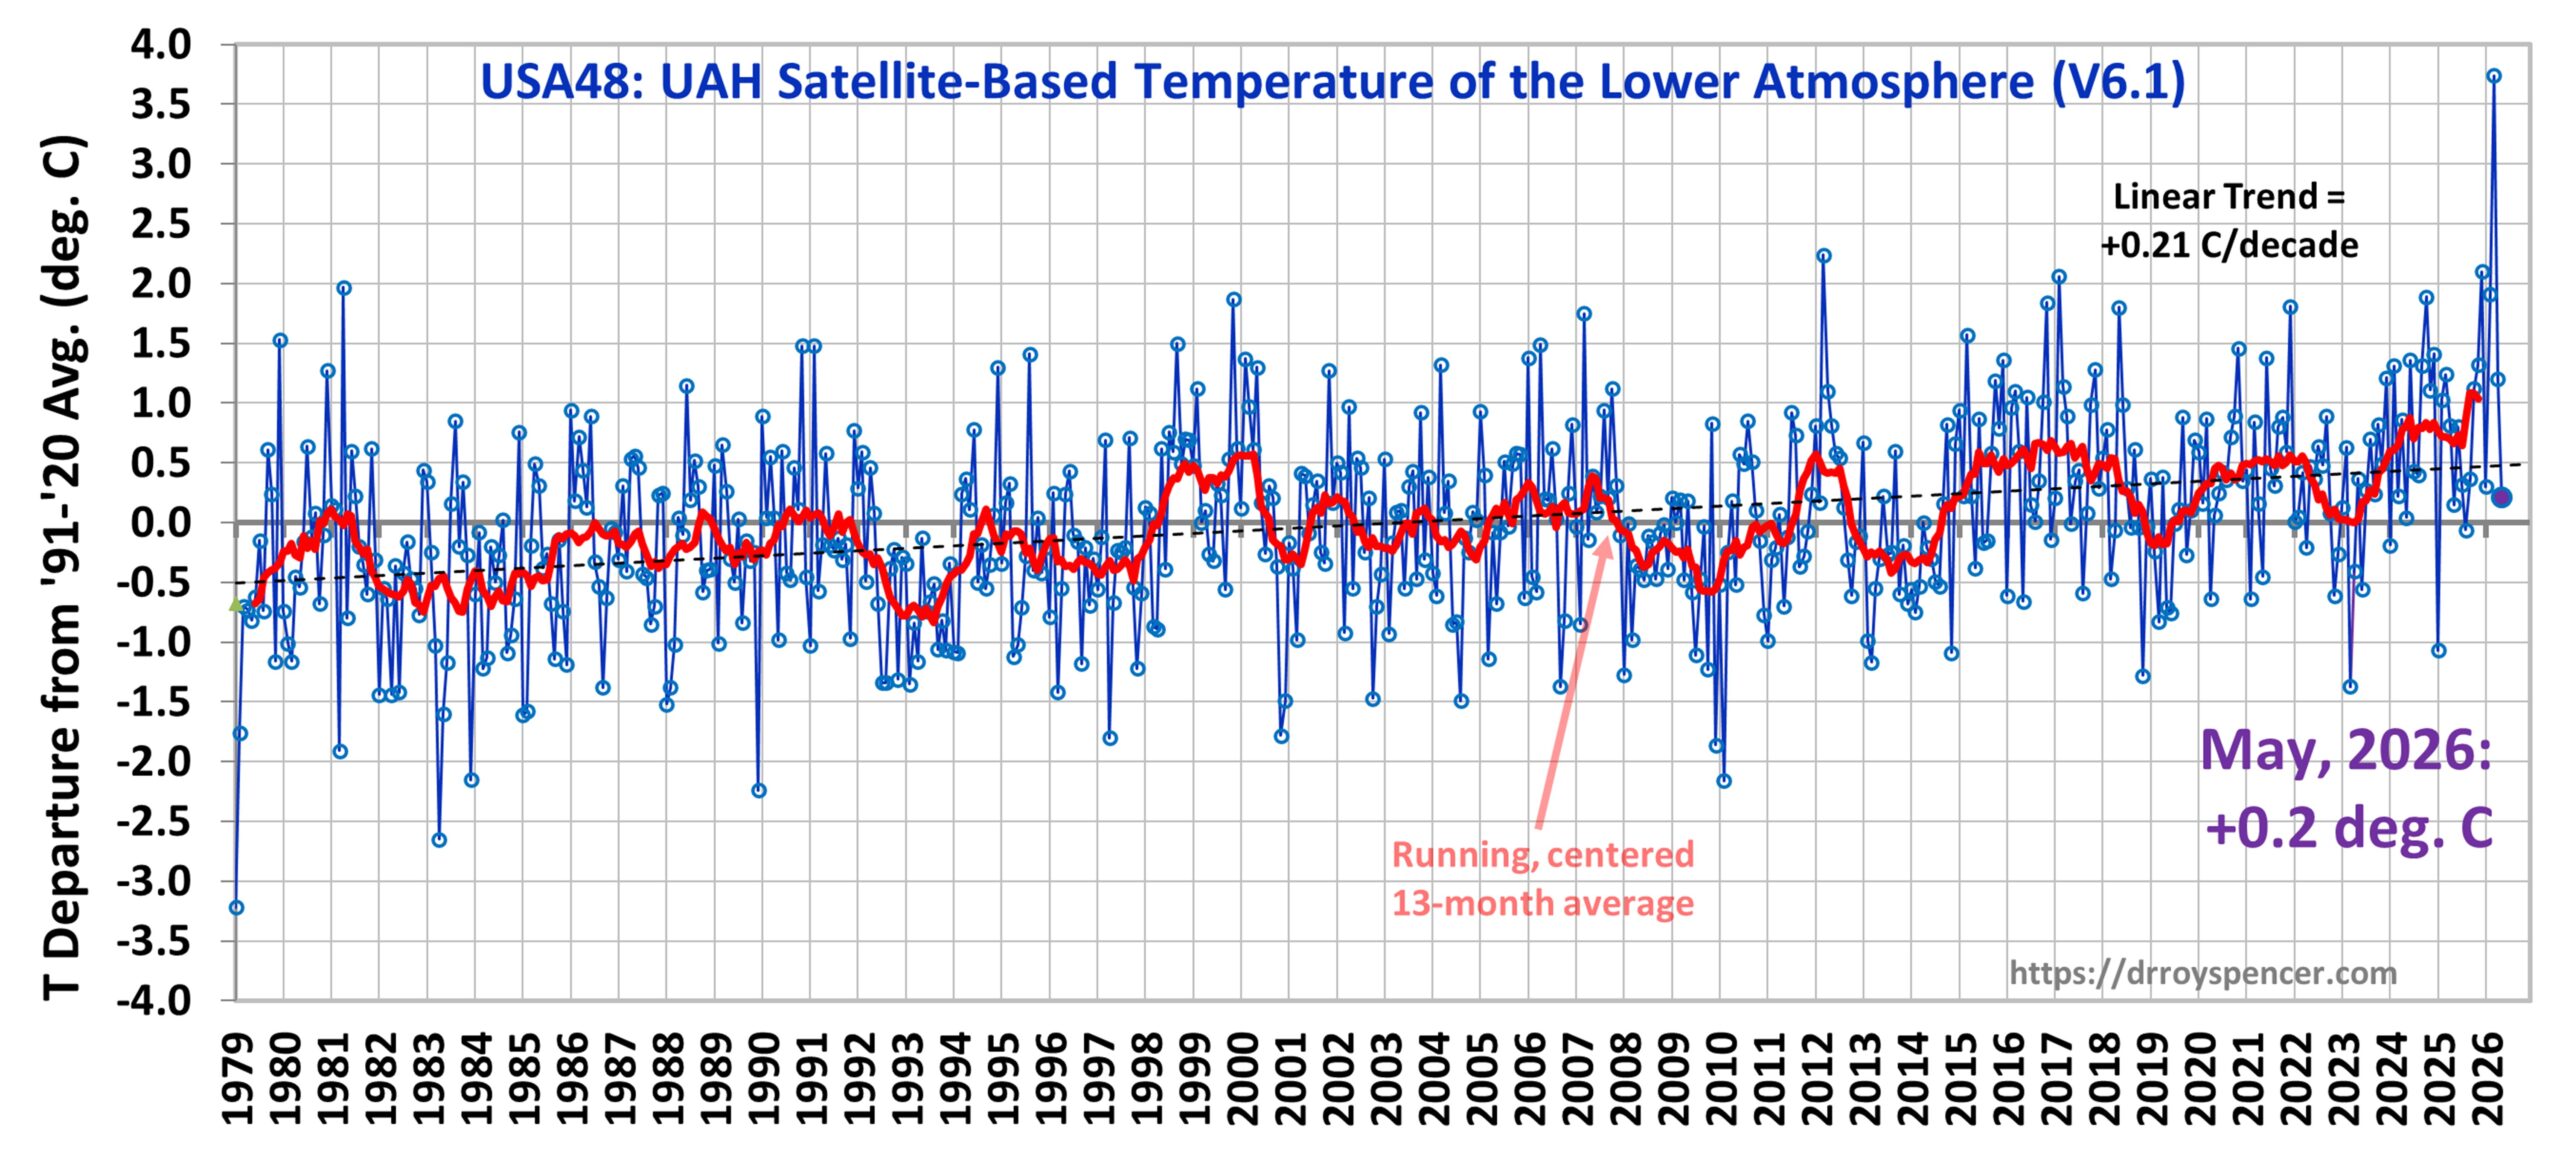
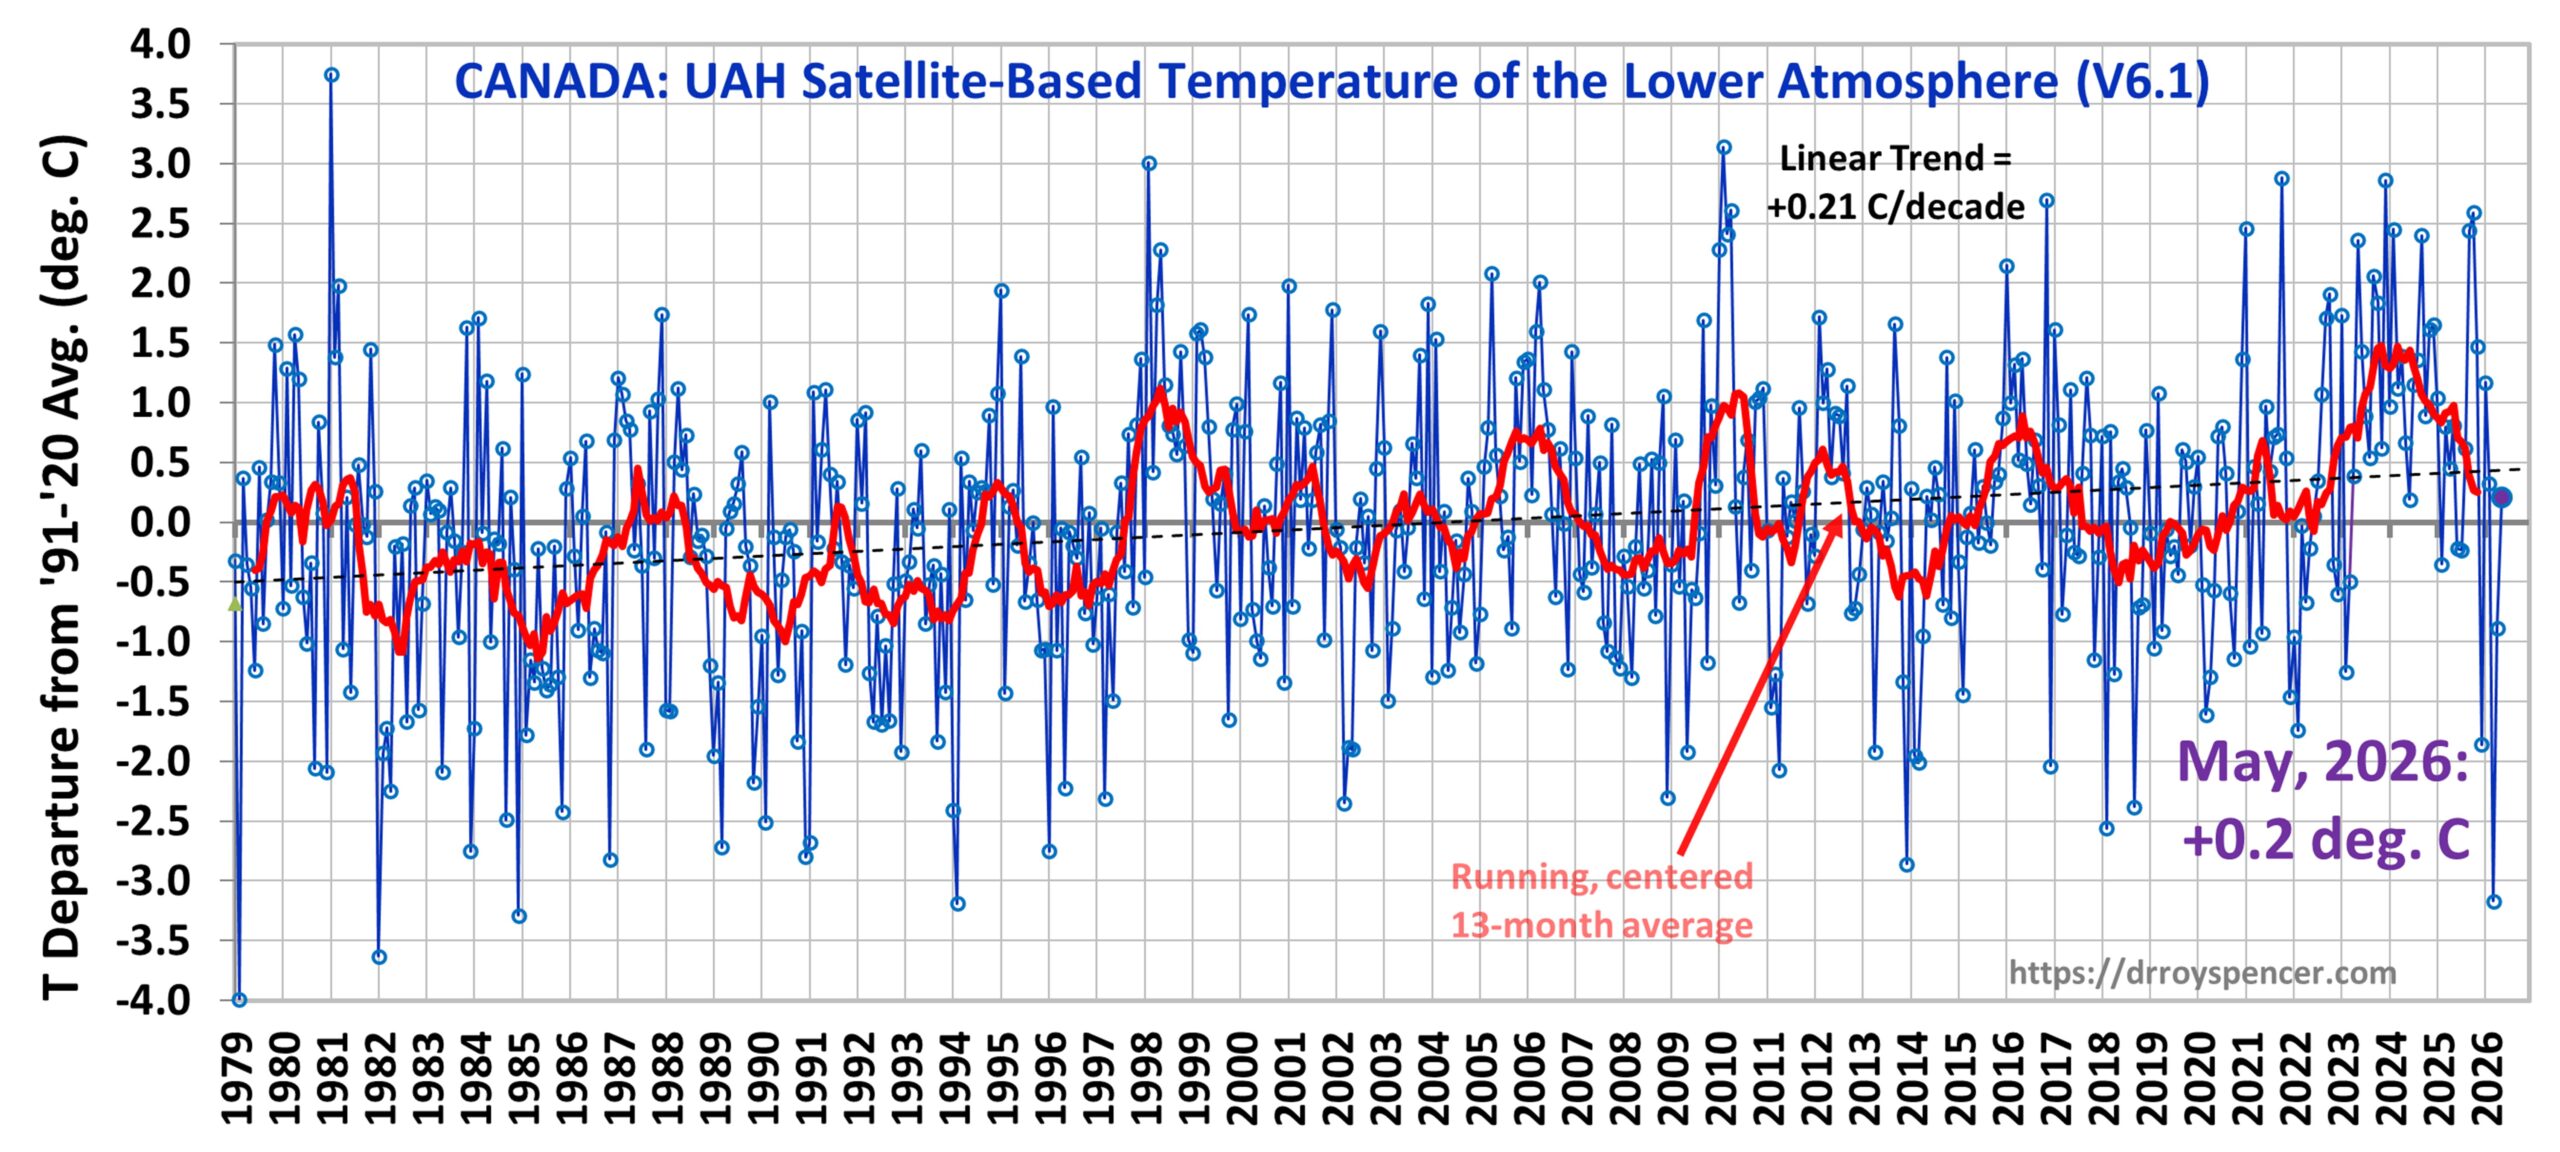
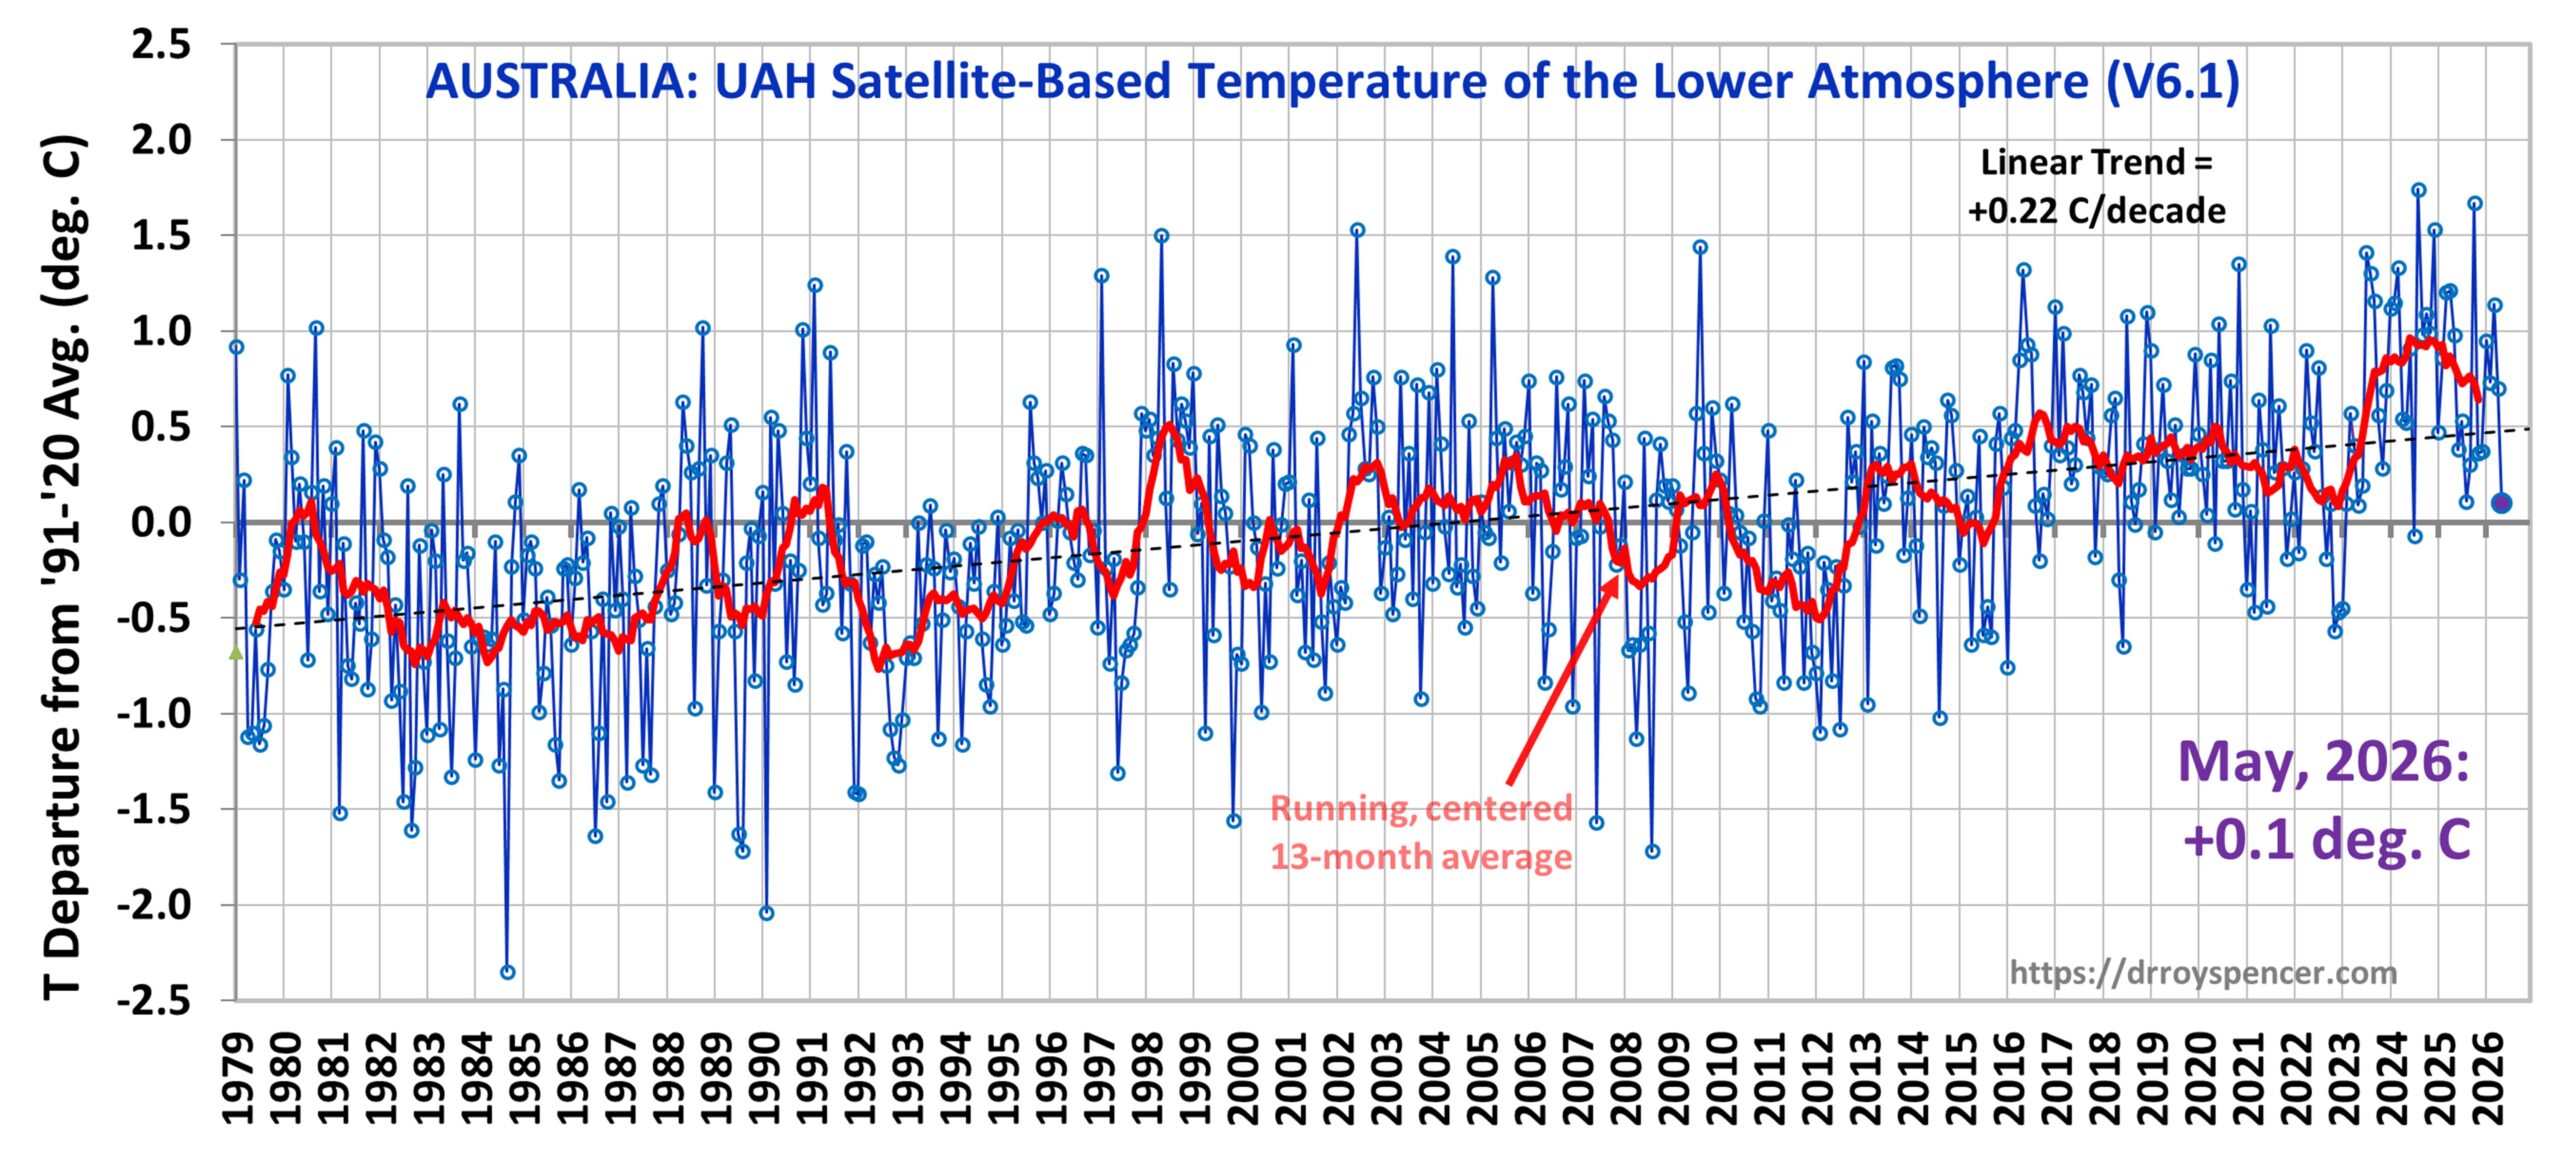
This month I’m adding Australia to the Global, USA48, and Canada time series plots.
The Version 6.1 global average lower tropospheric temperature (LT) anomaly for May, 2026 was +0.53 deg. C departure from the 1991-2020 mean, which is up from the April, 2026 value of +0.39 deg. C..
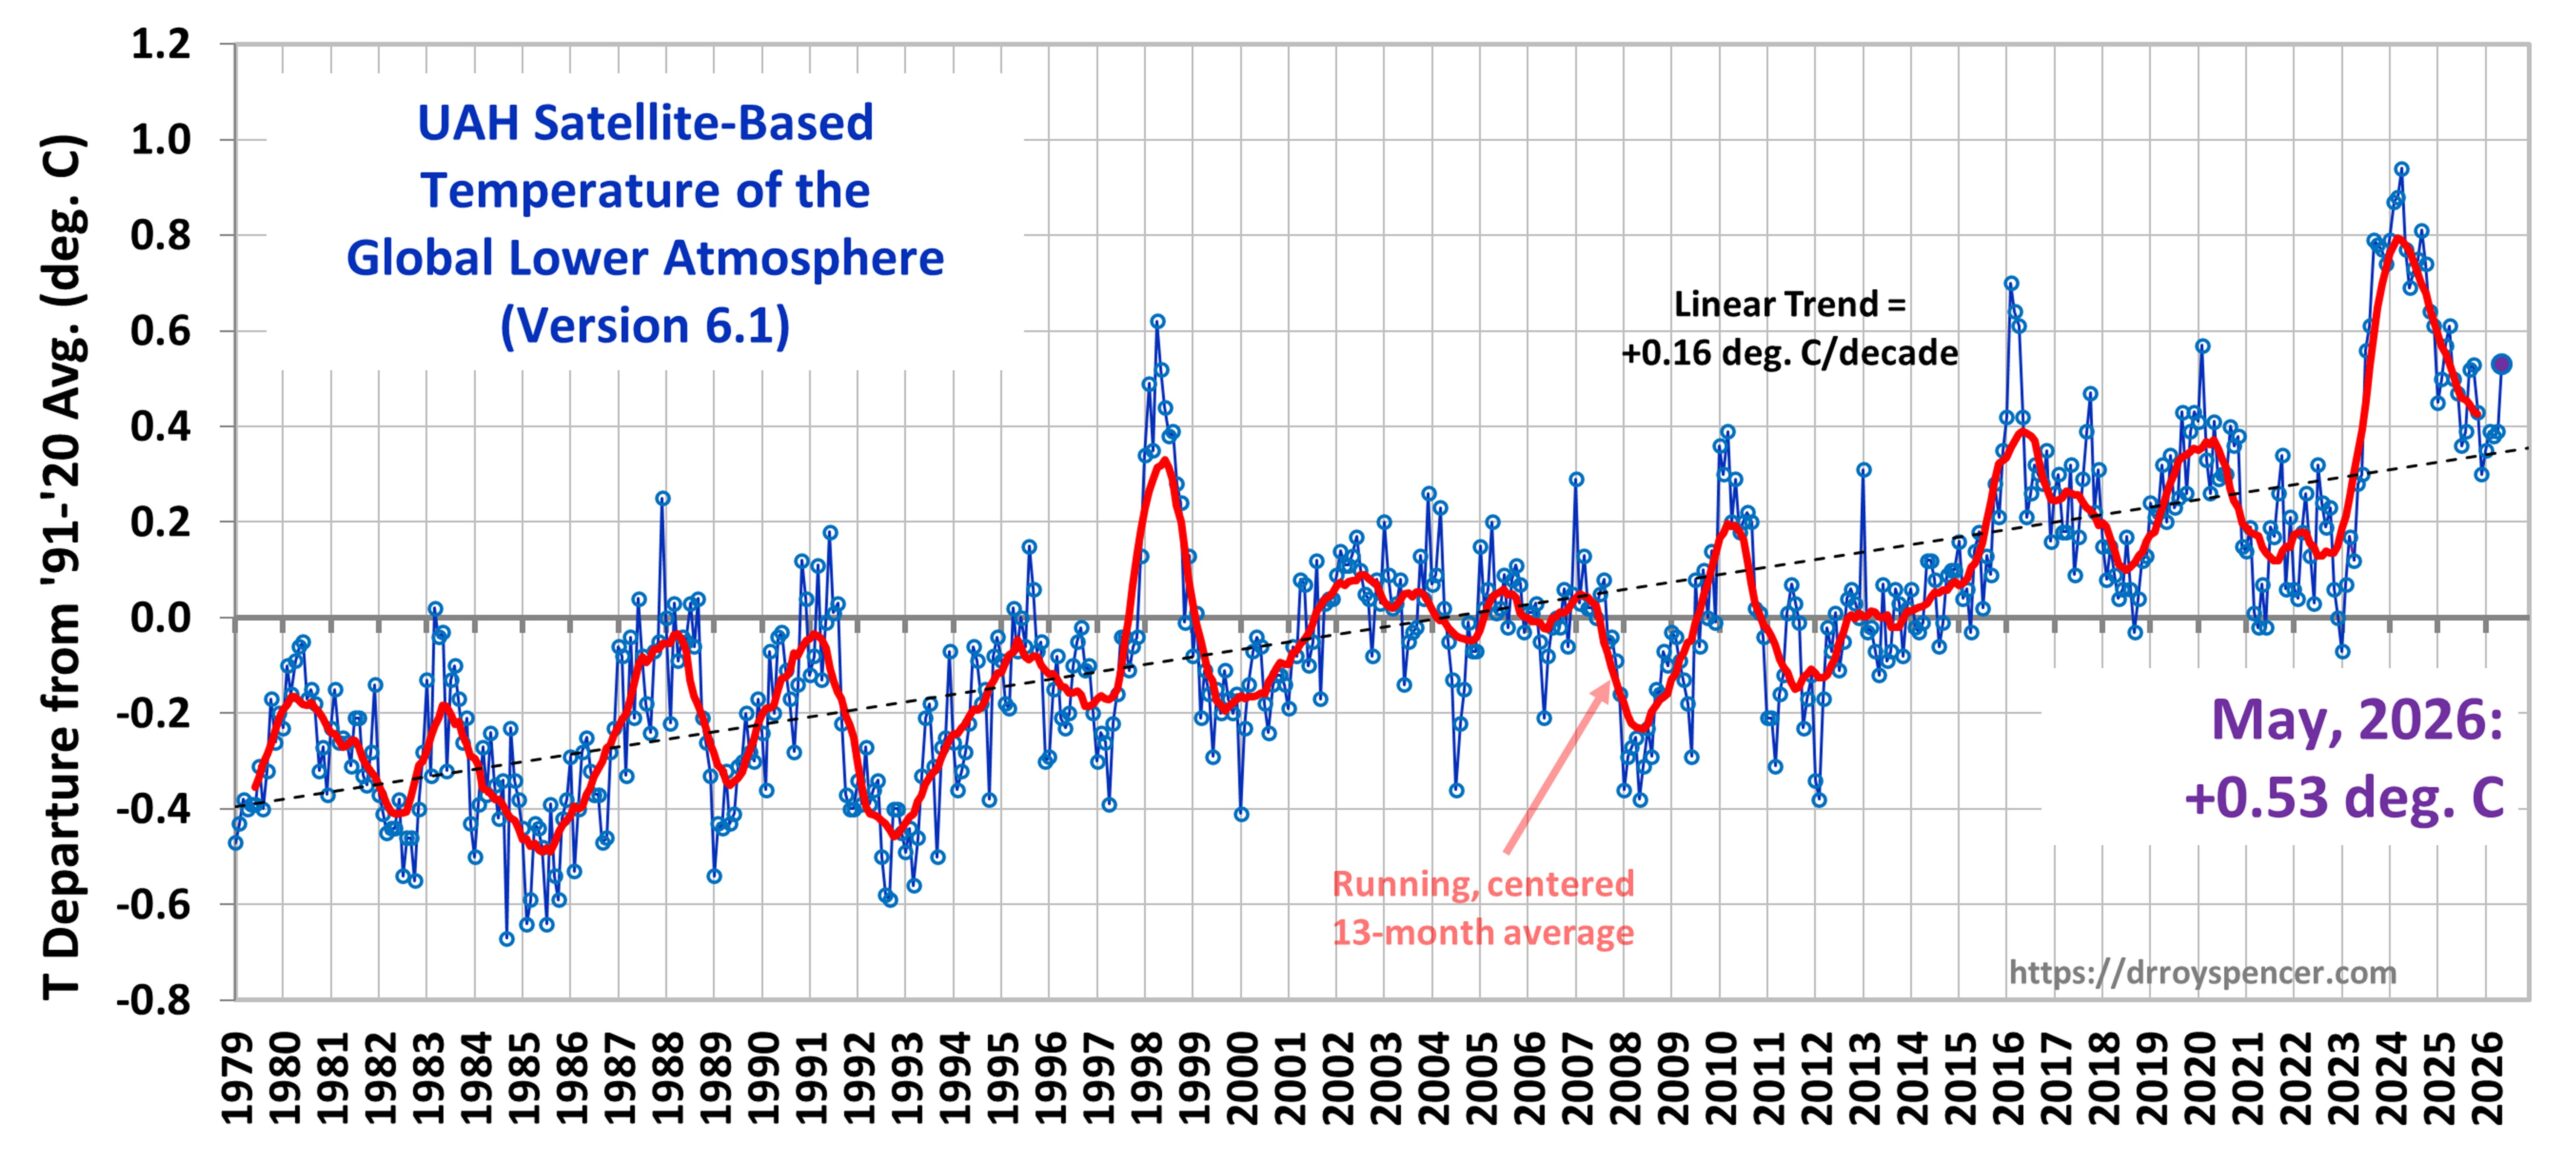
The Version 6.1 global area-averaged linear temperature trend (January 1979 through May 2026) remains at +0.16 deg/ C/decade (+0.22 C/decade over land, +0.13 C/decade over oceans).
A Note on These Tropospheric Temperature Anomalies vs. Surface Temperature Anomalies
It has been a while since I have discussed the main reason why our global monthly satellite-based tropospheric temperature anomalies can sometimes differ by quite a lot from the global monthly surface temperature anomalies. A good example is the last 2 months. In April, our +0.39 deg. C anomaly was statistically identical to the +0.38 deg. C surface temperature anomaly from the NOAA Climate Data Assimilation System (CDAS, which I take from WeatherBell.com maps). But then last month (May) the CDAS anomaly went down slightly (+ 0.34 deg. C), while our UAH anomaly went up considerably (+0.53 deg. C). These month-to-month fluctuations in the relationship between surface and tropospheric temperature changes are almost certainly dominated by fluctuations in moist convective heat transfer from the surface to the free troposphere. When there is a burst of extra convection (usually in the tropics), it cools the surface and warms the free troposphere more than normal, which is probably what happened last month (May).
The following table lists various regional Version 6.1 LT departures from the 30-year (1991-2020) average for the last 29 months (record highs are in red).
| Year | Mon | Globe | NHem | SHem | Tropic | US48 | Arctic | Aust. | Can. |
| 2024 | Jan | +0.80 | +1.02 | +0.57 | +1.20 | -0.19 | +0.40 | +1.12 | +0.97 |
| 2024 | Feb | +0.88 | +0.94 | +0.81 | +1.16 | +1.31 | +0.85 | +1.16 | +2.45 |
| 2024 | Mar | +0.88 | +0.96 | +0.80 | +1.25 | +0.22 | +1.05 | +1.34 | +1.12 |
| 2024 | Apr | +0.94 | +1.12 | +0.76 | +1.15 | +0.86 | +0.88 | +0.54 | +1.39 |
| 2024 | May | +0.77 | +0.77 | +0.78 | +1.20 | +0.04 | +0.20 | +0.52 | +0.67 |
| 2024 | June | +0.69 | +0.78 | +0.60 | +0.85 | +1.36 | +0.63 | +0.91 | +0.19 |
| 2024 | July | +0.73 | +0.86 | +0.61 | +0.96 | +0.44 | +0.56 | -0.07 | +1.15 |
| 2024 | Aug | +0.75 | +0.81 | +0.69 | +0.74 | +0.40 | +0.88 | +1.75 | +1.36 |
| 2024 | Sep | +0.81 | +1.04 | +0.58 | +0.82 | +1.31 | +1.48 | +0.98 | |
| 2024 | Oct | +0.75 | +0.89 | +0.60 | +0.63 | +1.89 | +0.81 | +1.09 | +0.89 |
| 2024 | Nov | +0.64 | +0.87 | +0.40 | +0.53 | +1.11 | +0.79 | +1.00 | +1.61 |
| 2024 | Dec | +0.61 | +0.75 | +0.47 | +0.52 | +1.41 | +1.12 | +1.54 | +1.65 |
| 2025 | Jan | +0.45 | +0.70 | +0.21 | +0.24 | -1.07 | +0.74 | +0.48 | +1.04 |
| 2025 | Feb | +0.50 | +0.55 | +0.45 | +0.26 | +1.03 | +2.10 | +0.87 | -0.35 |
| 2025 | Mar | +0.57 | +0.73 | +0.41 | +0.40 | +1.24 | +1.23 | +1.20 | +0.80 |
| 2025 | Apr | +0.61 | +0.76 | +0.46 | +0.36 | +0.81 | +0.85 | +1.21 | +0.45 |
| 2025 | May | +0.50 | +0.45 | +0.55 | +0.30 | +0.15 | +0.75 | +0.98 | +0.81 |
| 2025 | June | +0.48 | +0.48 | +0.47 | +0.30 | +0.80 | +0.05 | +0.39 | -0.22 |
| 2025 | July | +0.36 | +0.49 | +0.23 | +0.45 | +0.32 | +0.40 | +0.53 | -0.23 |
| 2025 | Aug | +0.39 | +0.39 | +0.39 | +0.16 | -0.06 | +0.82 | +0.11 | +0.62 |
| 2025 | Sep | +0.53 | +0.56 | +0.49 | +0.35 | +0.38 | +0.77 | +0.30 | +2.44 |
| 2025 | Oct | +0.53 | +0.52 | +0.55 | +0.24 | +1.12 | +1.42 | +1.67 | +2.59 |
| 2025 | Nov | +0.43 | +0.59 | +0.27 | +0.24 | +1.32 | +0.78 | +0.36 | +1.47 |
| 2025 | Dec | +0.30 | +0.45 | +0.15 | +0.19 | +2.10 | +0.32 | +0.37 | -1.86 |
| 2026 | Jan | +0.35 | +0.51 | +0.19 | +0.09 | +0.30 | +1.40 | +0.95 | +1.17 |
| 2026 | Feb | +0.39 | +0.54 | +0.23 | +0.03 | +1.91 | -0.48 | +0.73 | +0.32 |
| 2026 | Mar | +0.38 | +0.33 | +0.42 | +0.07 | +3.74 | -0.48 | +1.14 | -3.17 |
| 2026 | Apr | +0.39 | +0.43 | +0.34 | +0.23 | +1.20 | +0.30 | +0.70 | -0.89 |
| 2026 | May | +0.53 | +0.53 | +0.53 | +0.58 | +0.21 | +0.33 | +0.10 | +0.21 |
| Year | Mon | Globe | NHem | SHem | Tropic | US48 | Arctic | Aust. | Can. |
Time Series Plots for USA48, Canada, and Australia
The full UAH Global Temperature Report, along with the LT global gridpoint anomaly map for May, 2026 and a more detailed analysis by John Christy, should be available within the next several days here.
The monthly anomalies for various regions for the four deep layers we monitor from satellites will be available in the next several days at the following locations:


Thank you for this update highlighting the rise in temperatures. This is just the beginning:
https://www.cpc.ncep.noaa.gov/products/analysis_monitoring/lanina/enso_evolution-status-fcsts-web.pdf
Is the Global value of 0.53 correct? I’m not entirely sure how you determine this value… but NH is 0.53 and SH is 0.60, so I would have expected a Global value of around 0.57.
I believe NH means 30N – 90N (maybe 23N – 90N). The global value then comes from NH & SH & Tropics.
The file Lower Troposphere file says the are 0-90. There does seem to be a typo with one of those values.
As Bellmann says, could be a typo. Maybe global value is 0.56 (?)
my mistake… both hemispheres are +0.53.
Bellman June 2, 2026 at 7:53 AM
” The file Lower Troposphere file says the are 0-90. ”
You certainly mean
” GL 90S-90N, NH 0-90N, SH 90S-0, TRPCS 20S-20N
NoExt 20N-90N, SoExt 90S-20S, NoPol 60N-90N, SoPol 90S-60S ”
*
This can’t be correct because in all 2.5. degree grids of all four 6.1 layers (LT, MT, TP, LS) all three bottommost and topmost latitude bands are filled with the undefined data (-9999).
Thus, 82.5S-82.5N IMHO would be more correct.
In Rev 5.6, there was data for 90S-90N.
Yep. All other months Globe is average of NH + SH.
My mistake… the table should have 0.53 for both NH and SH.
I stand corrected!
Significantly, the 3, 4, and 5 year running means just keep on breaking records.
The 3 year running mean is now 0.60, which is 0.33 larger than the previous, non-overlapping record from 2018.
Phew. It’s a good thing no-one’s expecting a “super” el Niño by September on top of the persistent high anomaly.
Elliott Bignell June 2, 2026 at 6:46 AM
” It’s a good thing no-one’s expecting a “super” el Niño by September… ”
*
Sure sure?
https://www.cpc.ncep.noaa.gov/products/CFSv2/imagesInd3/nino34Mon.gif
Comparing today’s graph to what I saved on April 6 sounds amazing:
https://i.postimg.cc/sXVbBdVp/nino34Mon-060426.png
Well, slightly sure…
“These month-to-month fluctuations in the relationship between surface and tropospheric temperature changes are almost certainly dominated by fluctuations in moist convective heat transfer from the surface to the free troposphere.”
ENSO happily supports that evaluation:
https://postimg.cc/6TpntS9D
I’m away from my laptop this week, but from a quick look through the data file this seems to be the second warmest May, though statistically tied with 1998.
Recent researches show that the average global temperature rise is not a good indicator of climate change. It is the uneven distribution of temperature on the surface that is more critical.
Beyond global mean temperature: increasing asymmetry of global warming in past and future climate change | npj Climate and Atmospheric Science https://share.google/HtF4jkH93SV5qIOB0
https://link.springer.com/article/10.1007/s44292-026-00077-7
Clarification: climate change severity may be better defined by considering uneven temperature rise on the surface. The global temperature rise is slow and gives us opportunities to adapt. Uneven warming of the surface produces climatic extremes, which are deadly and catastrophic.
So what’s the weather like on your planet? The current rate of warming is geologically sudden. Native Australian oral history records a rate of sea-level rise at the end of the last glaciation that amounted to the high-tide line moving inland by tens of metres per year. The current rate of warming is far faster than that. How do you plan to move cities by tens of metres per year, pray?
“The current rate of warming is geologically sudden.”
How many warming trends have there been in Earth’s geological history? What were the rates of each? What was the rate of the one that produced seas over western Nebraska, where oyster shells and shark fossils have been found at 3000 ft elevation?
Clint R: “How many warming trends have there been in Earth’s geological history?”
Lots.
Clint R: “What were the rates of each?”
Nowhere near today’s rate, except possibly the aftermath of the Chicxulub asteroid (after a few years of cooling due to atmospheric dust from the impsct). Not even the PETM or the deglacializations can touch the present wsrming rate.
Clint R: “What was the rate of the one that produced seas over western Nebraska, where oyster shells and shark fossils have been found at 3000 ft elevation?”
Who knows? But you’re clearly confusing warming RATE with warm temperature. And obviously oceans were not 3000 ft higher then, instead that land was much lower than today. Earth looked nothing like today. https://news.unl.edu/article/sharks-once-roamed-nebraskas-ancient-seas
Gadden, you realize that all of your answers are based on your beliefs, right?
They don’t even qualify for “Soft Science”!
Nabil, “The global temperature rise is slow and gives us opportunities to adapt”.
Huh? Which planet are you on? This global warming is twenty times faster than the most rapid global warming we’re aware of in Earth’s past, with the possible exception of the aftermath of the Chicxulub asteroid impact 66 million years ago (after a few years of cooling).
The effects on ecological systems are difficult to predict but I’m happy I will not be alive in the 2070s or later.
GADDEN
PERSONNE N EST CAPABLE DE DIRE A QUELLE VITESSE CELA SE RECHAUFFAIT OU REFROIDISSAIT IL Y A SEULEMENT 2000 ANS.
SURTOUT SUR UN PSEUDO ACCELERATION D IL Y A30 ANS.
Gadden, I believe that we and living things around us have already adapted to the observed temperature rise we have had, nearly 1.5 degrees. There is no reason why we cannot adapt to another 1.5 degrees. Climatic extremes, however, are not easy to adapt to. Presently, insurance companies do not cover residential, commercial, and industrial in US states prone to climatic extremes. This mean catastrophy to those who live there, no adaptation is possible.
Yeah, this data point is unexpected and my model was wrong. I was anticipating a trough below the mean (taking everything into account). According to my model, we should currently be at peak La Niña impact in UAH Lower Troposphere temperatures, based on the typical 5-month lag from Niño 3.4.
Looking ahead, this suggests that the upcoming ENSO-neutral period could run above the long-term trend, and a shift to El Niño (ENSO Positive) might produce new record highs. I had been expecting that trough below the mean and its unlikely from here.
[“Looking ahead, this suggests that the upcoming ENSO-neutral period could run above the long-term trend, and a shift to El Niño (ENSO Positive) might produce new record highs.”]
Yes, and what’s more: the intervals between successive record highs appear to be decreasing: roughly 18 years from 1998 to 2016, 7 years from 2016 to 2023, and only 4 years from 2023 to 2027.
The 2022 Hunga Tonga eruption injected about 150 teragrams of water vapor into the stratosphere — roughly 10% extra on top of what’s usually there. As of early 2025, about half had been removed, with a big drop in 2024, but there’s still excess up there. Its tracked with NASA’s MLS satellite and decaying with an e-folding time of about three years now, and expect it to fully return to pre-eruption background levels around 2030. So in 2026, we’re past the peak impact but still not quite back to normal. The initial spread was mostly around the equator before it mixed more widely.
I dont know the connection, but I suspect there is new atmospheric physics in this data given the asymmetrical Llower troposphere response to Nino 3.4 in this el Nino, but its a hypothesis and highly uncertain. Its a fun conversation, but its apparently a trigger word and I dont want to harm in the safe space, so cautious wording.
[“Its tracked with NASA’s MLS satellite and decaying with an e-folding time of about three years now, and expect it to fully return to pre-eruption background levels around 2030.”]
So, what do you expect the global average temperature to do from now until 2030? Do you have a prediction we can test?
Mainstream science projects continued warming driven by rising CO2 concentrations, which seems plausible.
I have also considered the possibility of the Sun becoming more active in the future, contributing to the trend.
Global temperature will continue to rise with CO2 and composite El Nino warming short term. By 2030 it will eventually return to baseline warming from CO2 as the extra water vapor declines, if hypothesis is correct. But the reality is the current El Nino in equatorial pacific, nino3.4, may be enhanced in L Trop. But unlikely like last El Nino.
Its fun to have hypotheses and test them.
If this increased rate is from aerosols then it will continue indefinitely as the atmosphere is now cleaner from regulations
“the intervals between successive record highs appear to be decreasing: roughly 18 years from 1998 to 2016, 7 years from 2016 to 2023, and only 4 years from 2023 to 2027.”
‘Appears’ is right. I can’t do the math, but I would bet someone who could work out the probability would say that the apparent ‘acceleration’ in record highs is highly uncertain.
Clarification: climate change severity may be better defined by considering uneven temperature rise on the surface. The global temperature rise is slow and gives us opportunities to adapt. Uneven warming of the surface produces climatic extremes, which are deadly and catastrophic.
[“Uneven warming of the surface produces climatic extremes, which are deadly and catastrophic.”]
Yes, surface warming is occurring unevenly.
The Arctic is warming substantially faster than the tropics and mid latitudes. This reduces the temperature gradient between the poles and lower latitudes.
This, in turn, is expected to influence the behavior of the polar jet stream.
I stand corrected!
Reversion to the Mean [Trend], R.I.P.
Dam* if the Tropics didn’t overshoot the Global!
2026-May +0.53 [Global] +0.53 [SH] +0.53 [NH] +0.58 [Tropics]
Also, uneven warming is occuring between the Hemispheres, which is believed to contribute to El Nino Southern Oscillation and climatic extremes.
It is interesting to note that the main expected consequence of a strengthening of the greenhouse effect is a reduction in temperature differentials.
Land heats up faster than oceans, and there is a lot more land in the Northern Hemisphere.
phi: “the main expected consequence of a strengthening of the greenhouse effect is a reduction in temperature differentials”
Source?
Also, because 87 percent of the world population have lived in the northern Hemisphere, more anthropgenic waste heat has been rejected in the northern hydrosphere. This has contributed to the warming assymetry between the Hemispheres.
You only have to look at the “Earth Energy Budget” diagrams to see the obvious flaw that implies radiation from greenhouse gases (about 0.3% of the troposphere on average) causes about twice as much heat transfer into the warmer surface than does solar radiation.
This is just so obviously impossible.
Hence all climatology claims about GH warming are false.
A question about the +0.16 deg/ C/decade linear average increase since 1979 – It seems that it has been stuck there for awhile. Someone or some official body must have decided 30 year periods were required to smooth out temperatures for the calculation of normals. So, what was the value of the linear average increase in 2009 and how has it changed since then? Perhaps a 30 yr trailing average would be better from that point on? Maybe, Dr Roy or someone better at math and not as lazy as me can calculate that. Those commentators on here who are more alarmed about global warming than me might be interested in this as well. Has the 30 yr average accelerated?
it depends on what it does next!
Thomas Hagedorn, if you’re interested in 30-year averages of the UAH data, see the third graph at https://datagraver.com/climate-data-set-uah/
Gadden – that was helpful, but not exactly what I was looking for. I hope you will check back to this part of the string in a few days when I have more time to look at this. Various ocean oscillations seem quite powerful in determining temp changes. I like 30 moving averages to try to smooth them out. I may not be asking the right question. I am looking at the UH data to try to see if there has been ant acceleration of the temp Increase, even though it is slight.
Thomas Hagedorn, check the 30-year average temperature graph I linked to. It’s clearly a convex function, indicating an acceleration of the global warming.
I computed UAH 6.1 LT’s running trend with fixed start in Dec 1978.
The trend starts from a 30-year period Dec 1978 – Nov 2008 at 0.127 °C / decade, and ends from Dec 1978 – May 2026 at 0.157 °C / decade:
https://drive.google.com/file/d/1rvZPB8OnMU-lQU_E2e6YSBJNA04YRqQq/view
There is an acceleration (the trend has itself an increasing trend) of 0.019 +- 0.001 °C / decade². That’s a lot, to say the least.
Bindi – thank you for your reply. I was busy Sunday, missed your reply, and then jumped right into a new post. That was very helpful.
So, can you help me with projecting this acceleration out? I get involved with trying to explain these things to other non-scientists. You re much less likely to screw that up than me, although it lookspretty simple.
Copernicus and Berkeley Earth report average global temperatures for 2025 at 15C and 59F. My granddaughter is 10. Can you (or someone else) use the trend and its acceleration to project C and F global temps out to when she will be 30 (2045), 50 (2065), and 70 (2085)?
If someone else calculates this, please use bindi’s acceleration or explain why you are using something different. And don’t give me something from the models. They seem to have some flaws.
Thanks to anyone who will respond.
Thomas Hagedorn
I’m quite busy with solar data processing, and will reply as soon as I have some time to do.
Thx.
AI chatbot responses are a mixed bag, but they are currently pretty good at synthesizing answers to well formed questions concerning publicly available data, like “what was the trend of the UAH TLT data over a specific time period?”
https://gemini.google.com/share/c538b9beeca7
I point this out because it both addresses the question if it is asked in good faith and mitigates the possibility that one is perceived as asking questions in bad faith. To the latter, passing out work assignments (aka “sammich request”) is a common tactic used by persons more interested in manipulating other posters than in good faith discussion.
Thomas
” Thank you for your helpful post about temperature acceleration. ”
Thank you in turn for your comment, much appreciated.
*
” Can you (or someone else) use the trend and its acceleration to project C and F global temps out to when she will be 30 (2045), 50 (2065), and 70 (2085)? ”
*
Above all, please do not forget that any projection over such a long period, based on linear trend or polynomial propagation is 100% speculative.
You only need to enter a long series of volcanic eruptions with explosivity index 5,6,7 and encompassing 50 years (as happened in front of the Little Ice Age) and your prediction fails.
Thus, this is just for fun.
*
Here is an Excel graph for UAH data with a linear estimate and a 2nd order (i.e. quadratic) polynomial, both with a function showing how they are computed and thus how the figures can be propagated:
https://drive.google.com/file/d/1-2e7M-GXWubbPT_PBXNaA3ihPQ3agdpM/view
The right ends show the temperature anomaly values for now – May 2026: 0.35 °C for linear, 0.44 °C for quadratic, all wrt the mean of 1991-2020.
*
When entering the number of months till 2045, 2065 and 2085 respectively in the green resp. red equations, you obtain the following propagations:
– linear:
2045: 0.66 °C
2065: 1.24
2085: 1.55
– quadratic:
2045: 1.10 °C
2065: 2.85
2085: 4.09
All values again above the mean of 1991-2020.
*
As I said: this is just a little game, nothing to be taken seriously.
*
And don’t forget: basing the propagation on an anomaly sytem whose reference period is moved forward every 10 years is bare nonsense, especially when you consider the fact that the temperature increase leads to an increase of the 12-month baselines at reference period change, and hence a corresponding decrease of the anomaly values.
Better would therefore be to rely on absolute temperatures.
Possibly missing explanations…
1. In the equations
y = ax + b (linear)
resp.
y = ax² + bx + c
the variable ‘x’ is the number of months since beginning.
In May 2026, there were 570 months since beginning.
For x = 0 one obtains the intersection of the trend lines with the y axis.
*
2. ” When entering the number of months till 2045, 2065 and 2085… ”
I just see that this might be misunderstood.
Should read:
” ” When entering the number of months since beginning/b> till 2045, 2065 and 2085… “.
Thus one adds to 570 respectively one, two, three times 240.
Bindidon – Thanks for the analysis. Yes, recognize the speculative, “fun” nature of this exercise. And, if you go back to my question, my primary interest was in future absolute temps, not anomalies. Very few people outside of scientists really understand or are interested in anomalies, although I appreciate their usefulness in science. I may present this data to a chatbot and see what absolute temps it cranks out for those years. I have lots of doubts about the predictive abilities of the models, so I thought this exercise might be interesting.
BTW, a retired earth science professor was working on a paper examining the role of lower lever volcanism on the ocean floor (“black smokers” and other phenomenon). We know embarrassingly little about the ocean floor – only about 30% is mapped. In addition to isolated hot spots, we have volcanic mid-ocean rifts across the globe that drive the spreading of the ocean floor. He claims to be able to tie this to temperature changes.
Yes you are right, all people – me included – regularly comparing temperatures like for UAH LT and for surface (or for different UAH layers) are always bound to anomalies relative to the same reference period.
To avoid polemic about surface data being always too ‘hot’, I computed UAH LT’s absolute data for the Globe out of their grid data:
https://drive.google.com/file/d/1XQoFaGUzGXThACXe2yh9xKZwyZ3qs4WP/view
Linear and quadratic temperature increases in case of absolute values
– linear:
2045: 0.68 °C
2065: 1.25
2085: 1.56
– quadratic:
2045: 1.00 °C
2065: 2.42
2085: 3.40
*
Why the linear case keeps nearly constant but the quadratic case show much lower values, I don’t know; mostly it is due to the noise induced by the seasonality (the annual cycle) included in the absolute data.
It depends on what it does next!
It depends on what it does next! https://oz4caster.wordpress.com/cfsr/
Not a scientist and so I just look at the numbers, for the most part. I want to understand how Canada average could increase by 1.1 C while USA declines by .99 C and Arctic is pretty much flat. Given that Canada is between the two and entire northern hemisphere only rose by .1 C, doesn’t that make anyone here suspicious for the input from Canadian sources?
Those Canadians have been blowing a lot of hot air.
martinitony, you seem to be talking about the temperature change (in monthly averages) from April to May in US48 (1.6% of Earth’s surface) and Canada (2% of Earth’s surface). The combination of such a short short time and such small parts of Earth means that the numbers can differ widely. Regional monthly temperature behaviour is totally different from planet-averaged temperature behaviour. The longer the averaging (months, years, decades…) and the bigger the region (country, hemisphere, globe), the clearer the CLIMATE change signal. See for example the 30-year global average (third graph) of the UAH data at https://datagraver.com/climate-data-set-uah/ .
Gadden – great, concise answer. Short term climate is extremely variable. We live in the eastern U.S. – Ohio. Our grandchildren live in the mountain west of the U.S.- Idaho. A strong jet stream can bring hot weather to one region and cold to the other, or vice versa. This is a fairly common aspect of our short term – weeks or maybe a month at a time – climate. The same thing goes with other regions of the world.
Yours and other answers are not really addressing my question. The question is about variances and deviations from the mean. The mean here is not a mean of temperatures but mean of temperature differences from one area to the other. Some of you have programs that can do actual calculations. A cursory look tells you that something appears to be amiss these days. These differences that I drew your attention to are very large if you take a look at the record for several years. I would suggest they lie more than two deviations from the mean and that means if they were random, they happen only about 1 in a hundred months or even less and that should give everyone pause to wonder. Yes, the jet stream is the cause, but it pretty much should always be and yet you can go back over decades and not find such extreme differences. Why is that? That questions is not just answered by “it’s the jet stream.” Why is it the jet stream NOW? Why so much NOW? If I just accept your answers, I am accepting that these are not unusual events and statistics. I don’t like doing that.
Martinitony,
Interestingly, if you look at March, US was a record 3.74 C above average, while Canada was 3.17 C below average.
It seems that the jet stream was keeping all the cold Arctic air in Canada that month, blocking it from the US.
Some here claim that the recent warming is unprecedented. That’s not what the observations say. To go back in time, you have to use temperature proxies, and none of them show any particular behavior over the last century. The belief in a specific modern pattern stems from combining thermometer-based indices with temperature proxies. But that’s an illusion; the two diverge significantly over the common period—they don’t measure the same thing.
phi,
[“To go back in time, you have to use temperature proxies, and none of them show any particular behavior over the last century.”]
Proxies are not expected to reproduce every feature of the 20th and 21st century warming perfectly. Their purpose is to estimate large scale temperature variations over centuries to millennia.
[“But that’s an illusion; the two diverge significantly over the common period—they don’t measure the same thing.”]
In a typical reconstruction, a statistical relationship between proxies and observed instrumental temperatures is developed during a calibration interval.
The reconstruction is then tested on a different overlap interval that was not used for calibration (holdout testing).
If the reconstruction can successfully predict temperatures in the withheld period, that is evidence the proxy contains temperature information.
If the proxy genuinely had no temperature signal, it would fail these verification tests.
The mere fact that proxies and thermometers are different measurements does not imply they are unrelated or incomparable.
The problem is that they diverge in the 20th century, depending on the location, from the first quarter or at the latest from the last quarter of the century. This divergence is comparable with all proxies in the same region. Of course, I’m talking about verified proxies whose high-frequency behavior follows the data from thermometers.
The divergence problem is primarily associated with certain tree ring records. It is not regarded as a universal feature of all paleoclimate proxies.
Many modern temperature reconstructions synthesize multiple proxy types.
“An extensive new multi-proxy database of paleo-temperature time series (Temperature 12k) enables a more robust analysis of global mean surface temperature (GMST) and associated uncertainties than was previously available.”
https://www.nature.com/articles/s41597-020-0530-7
https://www.nature.com/articles/s41597-020-0530-7/figures/3
Kynqora,
No, the divergence is widespread and affects all quality proxies worldwide. See, for example, Briffa 1998.
Multi-proxy studies are simply unverifiable experiments; they should be disregarded, and we should return to the raw data.
> See, for example
Name a second one, phi.
You’ll never guess what I started to play Climateball.
Here’s a hint:
https://neverendingaudit.tumblr.com/
Best of luck.
phi,
[“No, the divergence is widespread and affects all quality proxies worldwide. See, for example, Briffa 1998.”]
Briffa 1998 is explicitly a study of tree ring width and maximum latewood density from high latitude regions or high elevation forests in the Northern Hemisphere. It’s not worldwide.
It also does not study ice cores, corals, Mg/Ca proxies, etc.
https://www.researchgate.net/publication/232785046_Reduced_sensitivity_of_recent_tree-growth_to_temperature_at_Northern_high_latitudes
[“Multi-proxy studies are simply unverifiable experiments; they should be disregarded, and we should return to the raw data.”]
I disagree.
Individual proxy records contain proxy specific uncertainties and very local influences. Combining multiple independent proxies is one way climate scientists attempt to isolate the common large scale climate signal.
And a single proxy record is generally representative of a particular site or region, not the globe.
Kynqora,
No, the data series leaked as part of the Climategate scandal is built on Schweingruber’s complete dataset, which covers the entire extratropical Northern Hemisphere.
No high-quality proxy shows any particular behavior in the 20th century.
The question you should be asking yourself is this: If no observational data points to any particular behavior in the 20th century, if the effect of CO2 on temperatures has no measurable consequences in nature, and if complicated processing involving hundreds of inconsistent observation series is required to extract a recalcitrant signal, is CO2 really the problem?
[“No, the data series leaked as part of the Climategate scandal is built on Schweingruber’s complete dataset, which covers the entire extratropical Northern Hemisphere.”]
Sorry, I don’t understand what this has to do with Briffa 1998. Would you mind explaining?
[“No high-quality proxy shows any particular behavior in the 20th century.”]
That is quite a strong claim.
Scientists usually look for proxies that have a strong and statistically significant relationship with observed temperatures during the instrumental period.
More importantly, I still do not see how Briffa 1998 supports your earlier claim that divergence affects all quality proxies worldwide.
[“The question you should be asking yourself is this: If no observational data points to any particular behavior in the 20th century, if the effect of CO2 on temperatures has no measurable consequences in nature, and if complicated processing involving hundreds of inconsistent observation series is required to extract a recalcitrant signal, is CO2 really the problem?”]
Doesn’t Dr. Spencer think CO2 has a measurable consequence in nature?
Yes, I think there is reason to believe it is a problem.
I don’t know whether CO2 is the dominant cause of recent warming or not. But it could be, and it could lead to a substantial amount of warming in the future.
The uncertainty itself is quite large. The contribution from CO2 could be smaller than many mainstream estimates if factors such as cloud cover variability play a larger role than currently thought. OTOH, it could be consistent with IPCC range, in which case CO2 would be a dominant contributor.
Some people do not find that uncertainty very comforting. In that sense, I can understand why people consider it a problem.
Briffa 1998 simply take the Schweingruber data base which extends to the entire extratropical Northern Hemisphere.
The divergence is significant: https://zupimages.net/up/19/47/ilvv.png
If nature is insensitive to rising CO2 levels, how could CO2 be a significant problem?
So if I am understanding correctly, you are arguing that the Climategate incident revealed something about the underlying dataset that is not disclosed in Briffa’s paper?
That would be a serious scientific integrity issue and could qualify as misconduct.
What makes you confident that Climategate was genuinely a scandal rather than a narrative advanced by bad actors?
Kynqora,
I’m not putting anyone on trial here; I’m simply observing that the proven proxies of temperature don’t carry the CO2 signal.
Nature is clearly unaffected by rising CO2 levels. We can draw a wealth of lessons from this, but that’s not my specific topic here.
> Schweingruber data base
That’s just for tree rings.
Here’s a multiproxy database:
https://www.nature.com/articles/sdata201788
Cranks will be cranks.
[“I’m simply observing that the proven proxies of temperature don’t carry the CO2 signal.”]
Unlike tree rings, ice cores are generally regarded by skeptics as among the more reliable proxies because they preserve information at relatively high resolution:
https://www.carbonbrief.org/factcheck-what-greenland-ice-cores-say-about-past-and-present-climate-change/
Notice the inflection in the early 20th century coinciding with the period of rapidly increasing industrial emissions.
And as the warming progresses, temperatures increasingly depart from the multi millennial cooling trend.
Kynqora,
Ouch! Look at your proxy in Figure 0 to 2000. The temperature rise begins in the early 18th century, peaks in 1950, and cools until the end of the proxy in 1970. CO2 is not involved in the 18th century, and it is generally accepted that the CO2 signal only appeared from the 1970s onward.
Do you realize how much your proxy contradicts you and doesn’t refute anything I’ve written? It’s simply irrelevant.
In any case, I don’t think we can properly assess the quality of a temperature proxy with such low resolutions (20 years) for reasonable calibration over a period of a hundred years at most. MXDs have an annual resolution. Furthermore, ice cores are often difficult to interpret due to gas diffusion.
“This graph is misleading for a number of reasons.”
Willard,
I believe Phi was referring to the second graph, labelled: Greenland temperatures over the past 12,000 years
Clint R, I didn’t even try to answer your questions as they’re impossible to answer. What I did was to ‘address’ them in the context of the discussion.
1. Your question about “how many warming trends have there been is impossible to answer as climate is constantly changing. Some of the most rapid warming trends are the End-Permian (aka ‘the Great Dying’), End-Triassic and the PETM, all of which were much slower than the current 2 degrees C per century warming rate. The deglacializations were on par with the onset of the PETM. After tge Chicxulub impact, there were likely significant warming of high rate as well. We know enough about climate change drivers to rule out a NATURAL global warning at the current rate to ever have occurred, with the possible exception of some huge asteroid impact VERY long ago. (Asteroid impacts first warm Earth (hours, days), then cool (month, years) and then warm again, and this latter warming could rival present-day man-made warming.
2. You asked about the rates of past warmings. All evidence indicates much lower rates thsn the present. See 1 above. Feel free to explain how a natural warming at the present rate could realistically occur.
3. You asked what the warming rate was ~100 million years ago when the land masses that would become North America were huge islands in the ocean. All we can be reasonably sure about was that it was way lower than the present warming.
This isn’t “beliefs”. It’s based on today’s knowledge about what CAN affect Earth’s gloval average temperature over climate-relevant timescales.
Again Gadden, you realize that all of your answers are based on your beliefs, right?
They don’t even qualify for “Soft Science”!
There are knowledgeable people that don’t think Chicxulub was an asteroid. The formation is in an area of big volcanoes, and a lot of evidence points to just another big volcano. Wait for the next “paper”….
In the area of global warming, we know Earth is in a current warming trend. The “consensus” is pretty solid on that, thanks to the work of UAH. But what specifically is causing it is another thing. I’m content with it’s just natural variations, but we know from “Hard Science” that CO2 isn’t causing it.
Gordon (and, by implication, CR):
“There must be a precise temperature for a photon.”
Dumb and dumber.
Clint R: “we know from Hard Science that CO2 isn’t causing it.”
Which, ahem, “Hard Science” would that be?
And some “knowledgeable people” think the Chicxulub event wasn’t an asteroid? That’s a new one, unless you’re just referring to the theory that it was a comet rather than an asteroid. Maybe you’re thinking about the theory that the Deccan Traps event, which occurred almost simultaneously with Chicxulub, contributed to the demise of the dinosaurs? The Deccan traps caused both cooling and warming but the warming (resulting from atmospheric CO2 increase) would have been MUCH slower than today since the rate of CO2 emissions was hundreds of times less than what we’re generating now. See https://pubmed.ncbi.nlm.nih.gov/33782114/
Anyway, I’d love to see your source for your statements about Chicxulub. Another blog?
And why do you call deduction from available information “belief”? I hope you’re not one of those who think science is about PROVING things. It isn’t.
This “studentb” child stalks me often. Because he has no science, he resorts to false accusations. There’s no way I ever said such a thing, consequently there is no way this child could provide a link with me saying it.
Why he gets to freely comment here attacking those who offer science is another issue….
“by implication”
That is the logical deduction based on your flawed interpretation of the 2loT.
The child gets caught making a false accusation, so he just makes another false accusation.
The cult loves that kind of perversion. The more, the better….
phi,
“Some here claim that the recent warming is unprecedented”
Recent warming is a bit vague. You could mean latest global temperatures or trends.
Some here and many in the literature say that the current rate of warming (last 50 years) is very likely unprecedented. The Earth’s surface temperature has been warmer in the past, such as the previous interglacial 120,000 years ago.
barry,
“Some here and many in the literature say that the current rate of warming (last 50 years) is very likely unprecedented.”
It’s possible but unlikely. Observations over 2000 years don’t have sufficient resolution, and annual proxies show fairly similar warming patterns a thousand years ago.
Source?
We’re talking about global, or NH warming (where studies only use NH data), so I’m unsure what you mean by ‘warming patterns’. When looking at regional climate patterns over the last 2000 years, the present patterns are far more uniform (almost the entire globe warming) than in the past. The MCA, for example has both warming and cooling trends depending on where you pick your proxies.
The lack of resolution contributes to the uncertainty, but you have it the wrong way around. It’s more likely the last 50/100 years are a steeper warming trend than any in the proxy record.
vhttps://www.nature.com/articles/s41561-019-0400-0
https://www.sciencenews.org/article/global-warming-today-unlike-last-2000-years-climate-shifts
barry,
A hockey stick evolution isn’t just a record slope, but a radical change in behavior. Do you have any observations that validate this exceptional behavior?
Any observation about the center of Earth?
So, no source for your contention? I’ll take it as uncorroborated. My sources corroborate. Check the first link – it’s the PAGES 2K report, which I believe is the largest proxy network there is underpinning the analyses.
I have no idea what your last comment means. It is more incoherent than the first one. There are dozens of studies about the past 2000 years. I gave a couple links, you’re welcome to acquaint yourself with the research there and more besides. Up to you.
barry,
You’re asking me for sources. It’s not up to me to prove that nothing unusual is happening, but rather up to the person claiming extraordinary behavior to prove it.
I’m not asking for reconstructions, but for observations—raw data. I don’t think it will be difficult to find some and offer one or two examples of the extraordinary impact of CO2 on nature.
> It’s not up to me to prove that nothing unusual is happening,
That’s often the excuse for Step 1 – Pure Denial.
phi, I just gave you 2 sources for what I said. I am providing corroboration, you are not. The burden of proof is equal on us. Bye bye.
phi,
As Willard points out, the chart you are referring to is misleading. It would be best for both of us not to refer to it.
[“it is generally accepted that the CO2 signal only appeared from the 1970s onward.”]
If my understanding is correct, mainstream science generally suggests that during the late 19th / early 20th century, CO2 was already contributing to the warming, albeit as a relatively modest and growing influence alongside other factors such as increased solar output and quieter volcanic activity.
Meehl et al. 2003 conducted separate model experiments using greenhouse gases alone, solar forcing alone, and a combination of greenhouse gases, solar forcing, and sulfate aerosols.
The combination of forcings reproduced the observed early 20th century warming more successfully than any individual forcing alone.
https://journals.ametsoc.org/view/journals/clim/16/3/1520-0442_2003_016_0426_saggfa_2.0.co_2.xml
The paper also mentions multi decadal variability in the Atlantic, which is particularly relevant to Greenland temperatures.
[“In any case, I don’t think we can properly assess the quality of a temperature proxy with such low resolutions (20 years) for reasonable calibration over a period of a hundred years at most.”]
Lower temporal resolution certainly provides fewer calibration points than annual resolution proxies such as MXD.
However, we can also compare it against independent reconstructions derived from different proxy records and methodologies.
As noted in the article, the Greenland composite used by Carbon Brief is broadly consistent with other large scale reconstructions (Marcott).
Independent replication across different datasets and methodologies is hardly something to scoff at.
Kynqora,
“The chart you are referring to is misleading.”
Really? And why is that, please?
“The combination of forcings reproduced the observed early 20th-century warming more successfully than any individual forcing alone.”
Yes, of course. Aerosol forcing is very poorly understood and allows for arbitrary adjustment.
“However, we can also compare it against independent reconstructions derived from different proxy records and methodologies.”
No. We don’t validate one theory by another, one model by another, or one reconstruction by another. We validate through observations.
The fact is indisputable: no observation validates a hockey stick-shaped temperature pattern.
Borehole temperatures are a reliable method of recovering past surface temperatures. They go back at most 500 y. But they show a clear hockey stick.
https://www.nature.com/articles/35001556
Fig 2.
Fig 2
https://www.nature.com/articles/35001556/figures/2
“Borehole temperatures are a reliable method of recovering past surface temperatures.”
This is a perfect example of “cult science”. Give some cultist a borehole and he can arrive at any temperature he wants!
That ain’t REAL science….
[“Really? And why is that, please?”]
Because it is based on a single site in Greenland and cannot be extrapolated to the rest of Greenland, let alone the globe.
Richard Alley is quoted as emphasizing that snowdrifts and other local influences complicate the interpretation of an individual ice core.
[“Yes, of course. Aerosol forcing is very poorly understood and allows for arbitrary adjustment.”]
Uncertainty in aerosol forcing does not automatically make the result arbitrary.
The authors did not just compare global temperatures. They also examined the seasonal and regional responses to the forcings.
One reason I find this paper plausible is that the enhanced early century South Asian monsoon response in the solar residual experiment is qualitatively consistent with observed rainfall trends in India, which were more positive in the early 20th century than later in the century.
That doesn’t prove the mechanism, but it does provide an independent line of support beyond simply matching the temperature record.
Nate,
I assume you’re joking.
Kynqora,
I only provided one graph, and it’s this one: https://zupimages.net/up/19/47/ilvv.png
“Nate,
I assume you’re joking”
Phi, we can assume you have no rebuttal.
FYI
https://www.forbes.com/sites/alexknapp/2013/02/21/new-study-shows-independent-evidence-of-global-warming/
phi,
I don’t know what that has to do with the reply I just made.
Nate,
Okay. So, it’s simply that you don’t know much about the world of proxies. You’re clearly unaware that borehole temperature can only have a shape similar to a hockey stick, one way or the other. It’s a proxy that carries very little information.
Regarding the Forbes link, I’m asking for raw data, not reconstructions. It’s still strange how you can’t find anything at the observational level.
Kynqora,
I don’t understand you either.
I was responding to your statement: “As Willard points out, the chart you are referring to is misleading.”
I was referring to a chart concerning the Northern Hemisphere, but it was you who provided the link to the Greenland study.
Me: *cites Carbon Brief article*
phi: “Ouch! Look at your proxy in Figure 0 to 2000. The temperature rise begins in the early 18th century, peaks in 1950, and cools until the end of the proxy in 1970.”
Willard: *quotes*: “This graph is misleading for a number of reasons.”
Me: “As Willard points out, the chart you are referring to is misleading. It would be best for both of us not to refer to it.”
“You’re clearly unaware that borehole temperature can only have a shape similar to a hockey stick, one way or the other. It’s a proxy that carries very little information.”
Again with absurd unsupported claims, Phi.
I am quite familiar with how surface temperatures are determined from borehole temperatures. There is certainly no reason for them to only produce a hockey stick.
They produce regional results with various shapes, in some cases cooling.
That’s exactly what I was saying, you don’t know what can be gleaned from borehole temperatures. The resolution, if we can even call it that, is the number of years relative to the present. So the hockey sticks are generated automatically, either up or down.
“That’s exactly what I was saying, you don’t know what can be gleaned from borehole temperatures.”
Non sequitur. The theory linking surface temp to borehole temps is well established.
“The resolution, if we can even call it that, is the number of years relative to the present. So the hockey sticks are generated automatically, either up or down.”
Error bars increase at earlier times. That alone does not produce a hockey stick.
Again, a non-sequitur.
You are just making up nonsense unsupported by evidence.
Nate,
No. You don’t understand the physics of borehole temperatures. The problem isn’t just the margins of error, but the indeterminacy of the temperatures. Several different evolutions can give the same shape to the temperature profile. Do some research.
Phi,
OK, I agree that there is some degree of indeterminacy. It is addressed by putting reasonable constraints on the inversion, such as limiting the output to long time-scale trends, as they did in the paper I cited above.
This produces a highly smoothed surface record, which can be compared in the overlap period with observations.
I dont see how this only produces hockey sticks.
Thomas Hagedorn, OK but if you refer to weather over weeks, months or even a few years, you’re talking about weather, not climate. Climate by definition refers to averages over longer time, at the very least a decade. Thirty years is generally taken as the lower limit.
Of course you are correct.
If you were to remove the interminable arguments on this blog about some basic laws of physics, which, frankly, I don’t understand at a deep scientific level (I am not a scientist, I am very interested in education on climate change) and am not interested in, you would be left mostly with observations of recent changes in weather – a month, a year, even three or four year weather trends – and even regional weather as opposed to global. Then those observations about WEATHER are used to argue for or against st the global warming narrative about CLIMATE. This is one of the reasons I am not concerned about climate change at this point (although I am open to changing my mind if the evidence is there). The scale of the changes in CLIMATE,which is where scientists camp out, and WEATHER, which is what most average citizens, politicians, journalists, and NGO policymakers seem to focus on just seem too small to make much of a difference in living conditions. I have looked at a lot of 30 year temperature normals for major U.S. cities and how they have changed from legacy normals. The changes are barely perceptible over the span of a lifetime. Sea level increase seems to bring the same, tiny (the depth of pennies) result. So, perhaps you and I can join forces and remind others that WEATHER is not CLIMATE.
Hunga Tonga has left the conversation.
Good point, Robert. We need to talk about HTE more, as it is still with us. The water vapor is slowing leaving upper altitudes, but lingering effects could last another year or so. If it’s gone by 2029, that could easily put UAH Global back to 0.0°C by 2030, if not earlier?
https://postimg.cc/5HqnsRxr
I am amazed at how many fortune tellers there are on a science blog. Nonetheless, there are at least 2 very interesting events unfolding. One is the continued dissipation of the 2023-effect — whatever that was. The other is the consensus El Nino that is approaching. The ensemble forecast is very strong. Is it possible that the models might be wrong? It seems unlikely with such a strong consensus. The problem is that, just like hurricane prediction, strength is often difficult to predict. There is no consensus on just how strong it will be.
Tim S, you weren’t able to solve the simple problems.
https://www.drroyspencer.com/2026/05/uah-v6-1-global-temperature-update-for-april-2026-0-39-deg-c/#comment-1744604
You try to sound like you understand science, but you run when given a challenge. It’s like you fear learning.
Boo!
“I am amazed at how many fortune tellers there are on a science blog.”
If you stopped posting there would be one less.
This is to Gadden and Kyngora:
You both appear to be Warmists, yet you’re behaving as adults, not like the cult Kids. So I’m curious about your level of knowledge of the science. For example, do you understand where the “240 W/m²” comes from? That is, what calculation does the CO2 cult use to arrive at that value?
Clint R, before deciding which camp I belong to, you might find a few quotes from the papers I have been citing, and the conclusions I draw from them, worth considering.
“The only previous GMST reconstruction for the Holocene based on multi-proxy data2 showed maximum warmth around 7000 ± 2000 years ago (7 ± 2 ka BP, where ‘BP’ is relative to 1950) followed by multi-millennial global cooling. This cooling trend occurred while the atmospheric concentrations of greenhouse gases were increasing.”
Takeaway: The extent of CO2’s contribution to modern warming remains an active area of research (though there is certainly substantial evidence that it plays an important role).
“The CCM3 has a relatively low equilibrium climate sensitivity for a doubling of CO2 of 2.1°C when coupled to a slab ocean with implied ocean heat transports, sometimes called a “q-flux” ocean (Meehl et al. 2000).”
Takeaway: The model used in this study (which reproduced not only aspects of the temperature record but also several regional and seasonal climate responses I discussed above) had an ECS near the lower end of climate model estimates and broadly comparable to values often favored by climate skeptics.
Thanks for better explaining your position, Kyngora. You seem open-minded and not yet fully committed to the CO2 cult. So, I want to warn you about some tricks the cult uses.
Responsible adults would agree that temperatures are rising (Earth is in a warming trend). That’s a “known”. But what is causing the warming trend is an “unknown”. The cult would have us believe that CO2 is causing the warming, but they are unable to describe how that can happen.
A morning cup of coffee is usually served very hot. And it can be “known”, without conjecture, how that coffee became “hot”. It may have been from a microwave oven, stove top, coffee maker, or even a campfire. But, we could find out how it became hot.
Now what if someone told you the coffee was hot because of CO2! You seem like someone that might question that. You might ask how could CO2 warm a cup of coffee. The “believers” might answer, “We know the coffee warmed from CO2 because CO2 is rising.” Then you might say “That might just be a coincidence. It does not prove CO2 warmed the coffee”. Then, a room full of “believers” would respond that they “know” CO2 caused the warming. But they would be unable to describe how CO2 could warm the coffee. They just believe it did.
So the first trick to avoid is being distracted by coincidences. Always stick to the basic science — How can adding CO2 to the atmosphere raise surface temperatures? REAL science knows it can’t.
That’s why I asked you if you understand where the “240 W/m²” comes from. That’s an example of how the CO2 perverts science. Just one of their convoluted “tricks”.
[Kynqora, I just realized I’ve been misspelling your “handle”. Sorry, my mistake. I’ve got it fixed now. I’ll finish my thoughts about the “240 W/m²”.]
The “240 W/m²” comes from the imaginary sphere used in cult science. The Solar Constant is first adjusted for albedo, resulting in 960 W/m². That is the flux striking the sphere’s disk. Since the sphere’s surface area is four times its disk area, the 960 W/m² is divided by 4 resulting in 240 W/m². Since the imaginary sphere is assumed to use no energy, the surface emission would then be 240 W/m², resulting in a surface temperature of 255K. So far, there is no perversion of reality. [It’s okay to divide flux is this special case, where the geometry allows, and there are no energy losses.]
The perversion of reality starts when they try to compare the imaginary sphere to Earth. They claim that since Earth’s surface temperature is 288K, and the imaginary sphere’s surface temperature is 255K, then Earth is 33K warmer than it’s supposed to be!
They completely ignore the reality that Earth has oceans, atmosphere, and land area, all with the ability to maintain thermal energy (enthalpy). Earth would have a completely different thermal equilibrium temperature than an imaginary sphere. They’re comparing two different things!
Yeah, it’s tricky. It’s convoluted. It’s perverted. But, it ain’t science….”
So any time you see the cult using “255K”, “33K”, or “240 W/m²”, you know you’re seeing “cult droppings”. Take proper precautions….
Hey Puffman, riddle me this –
“imaginary sphere”
Do you know of any real sphere, and is it flat?
Clint R, you’re right that the 240 W/m^2 cannot be directly translated into a global average temperature (of 255 K) by applying the Stefan-Boltzmann equation since Earth’s temperature is not the same all over the planet. The average value of T^4 over the planet is simply not the same as the average temperature raised to the power of 4. But you’re making incorrect conclusions from this. You see, Hölder’s inequality (combined with S-B equation) means that the 255K temperature is an UPPER LIMIT to the global average temperature when the average emitted flux from your “imaginary sphere” is 240 W/m^2. In other words, since we know that Earth’s temperature is around 288K, the greenhouse effect is AT LEAST 33K.
Furthermore, the average temperature of almost every single place on Earth is in the range 270K-300K (with only very few percent of Earth outside this range), so the deviation between the ACTUAL magnitude of the greenhouse effect and the simplified 33 degrees value isn’t very large.
Clint R, of course I know where the 240 W/m^2 comes from.
The TSI (Total Solar Irradiance at our distance to the sun) is 1361 W/m^2. The total solar power towards Earth is therefore 1361 x pi r^2 [W], since Earth looks like a disc with radius r and area pi r^2 [m^2] when (hypothetically) viewed from the sun. When dividing this power by Earth’s entire surface (4 pi r^2), we get 1361/4 = 340 [W^2] which is the average solar flux to Earth (before subtracting the flux reflected back to space) . Finally, we need to consider Earth’s albedo and the resulting reflection of sunlight. The reflected sunlight anounts to 100 W/m^2, leaving 340-100 = 240 [W/m^2] which is the solar flux to Earth.
Your “CO2 cult” seems to mean the people who understand climate science basics. The cult would be the science deniers, not people who understand textbook-level atmospheric physics discovered in the mid-1800s.
Would you be a science denier by any chance?
barry,
To help you, here’s an example of raw proxy temperature data:
https://zupimages.net/up/19/48/soa3.png
If you think global temperature trends resemble a hockey stick, if you think CO2 has a decisive effect on nature, you should be able to find measurements that demonstrate this.
If you can’t find anything, it means CO2 isn’t a problem for nature and that these reconstructions are artistic creations meant for gallery display, not for publication in scientific journals.
The chart displays raw polar MXD proxies from 1900, the data set with the well-known divergence issue. Where is the rest of the proxies? Where are the other 19 centuries?
You have shown nothing here that has not been identified and discussed over decades in NH temperature reconstructions.
NH and global reconstructions use many more proxies, different kinds of proxies, and the general results have been corroborated many times with some variation.
You are seeking to raise doubt, not illuminate. I did this round 20 years ago. Please don’t waste my time with these old, hackneyed talking points.
What is interesting is that Nate’s hockey stick doesn’t resemble Michael Mann’s hockey stick. In Nate’s plot every century had warming. The warming also looked like it was accelerating up preindustrial revolution. My questions to Nate are what caused the warming in every century from 1500 to today? What caused the acceleration preindustrial revolution?
What’s even more interesting is that the hockey stick did not show such thing:
https://en.wikipedia.org/wiki/Hockey_stick_graph_(global_temperature)
Besides the fact that it wasn’t Mike’s.
Wha?
OK, Williard’s hockey stick.
MBH, Troglodyte. MBH. And that’s just one of them.
The hockey stick is characterized by its shaft, not its blade. And it shows temps dropping *down* to industrial times. The industrial period started earlier than 1850, BTW.
Glad to see you found back your way to the S-word.
Williard,
Are you a girl? Why do you pretend to be a boy? Did you steal “Troglodyte” from a well-known television series? Nate’s hockey stick or your hockey stick doesn’t show that.
Troglodyte,
You can’t spell. You can’t read graphs.
What are you doing here?
Somebody wrote this nonsense:
“We need to talk about HTE more, as it is still with us. The water vapor is slowing leaving upper altitudes, but lingering effects could last another year or so. If it’s gone by 2029, that could easily put UAH Global back to 0.0°C by 2030, if not earlier?”
I am willing to bet that UAH will be greater than 0.0°C
by end of 2026
by end of 2027
by end of 2028
by end of 2029
by end of 2030
Name your price. (Easy money to be made here)
I’ll bet that absent some major cooling event like a massive eruption or asteroid, UAH lower trop temps will not hit 0.0 per the current 1991 – 2020 baseline in 2029 or 2030.
The baseline will be changed to the 2001-2030 30-year period at the end of this decade, dropping all temps downward on the chart. Worth mentioning for the bet.
I’ll put AU$1000 dollars on it. We’ll convert to your currency at whatever exchange rates apply in 2031.
(AU$1000 = US$705.20 right now)
Who believes what they’re saying?
Let’s make it easy for them.
I will offer 10 to 1 that UAH is back to zero by the end of 2030.
Any takers?
In more than a decade here here I’ve never seen a ‘skeptic’ put their money where their mouth is. I’ve offered bets about a dozen times against ‘predictions’ they make. They have no conviction at all.
I’m going to repeat myself because apparently common sense and climate change don’t mix.
If CO2 is a serious problem, we should necessarily be able to detect its effect in observations. This is a minimum requirement. I demand to be shown a set of observations where its signal is visible, and no one is able to provide anything.
Nature appears to be unaffected by CO2.
All I’m presented with are hockey stick reconstructions supposedly based on data where no CO2 signal is detectable.
Whether or not CO2 has an effect on temperatures, I don’t know. What I do see is that its potential effect is certainly too weak to emerge from observations.
The only thing that can be definitively demonstrated is that the recent warming is linked to sunlight:
https://www.zupimages.net/up/26/20/hvhk.png
phi
I already gave you a study that detailed the specific effect CO2 plays in surface warming. You rejected the study, not with any valid points, just plain rejected it.
Here it is again so you can reject it again.
You still think they cannot directly measure IR at room temperature using valid math and scientific principles. That is a hurdle for you to jump, not the science community. If you need detailed explanation of how this is possible I will provide information to IR measuring devices that are fairly accurate. Like being able to tell the correct temperature of cold water that is lower than room temperature. If the science behind the IR measuring devices is flawed it seems it should be unable to provide any valid temperatures that are colder than the instrument and yet they do!
https://newscenter.lbl.gov/2015/02/25/co2-greenhouse-effect-increase/
Norman,
They are assuming the increased CO2 level is causing warming. I’m assuming the increasing surface temperature is causing higher CO2 which is evolving as an integral of temperature. Hey, if they can assume then I can assume. Right?
Norman,
Off-topic. Refer to the discussion in question and don’t twist what I’ve said.
Stephen
You and Norman are both right.
Co2 and temperature have an equilibrium relationship.
Changes in temperature can drive changes in CO2.
Carbon sinks including the ocean and permafrost, release CO2 when the temperature rises and take up CO2 when the temperature falls. Thus a change in temperature can drive a change in CO2. The most recent past example is the start of the Holocene when an orbit driven increase in temperature from 9C to 14C increased CO2 from 200ppm to 280ppm.
Changes in CO2 can drive changes in temperature.
Increasing CO2 reduces the rate of heat loss to space around 15 micrometres and increases the temperature. Equilibrium temperature is reached when increased heat loss through the atmospheric window restores the balance. Past examples include the volcanic eruptions that drove several mass extinctions and the PETM.
The most recent example is anthropogenic global warming. An increase in CO2 from 280ppm to 420ppm has so far increased global temperature from 13.8C to 15C.
The study proves very little if anything. They are claiming some kind of qualitative relationship that is heavily influenced by other things as follows: “sources of infrared energy such as clouds and water vapor”. Sometimes you have to read the text:
“Both series showed the same trend: atmospheric CO2 emitted an increasing amount of infrared energy, to the tune of 0.2 Watts per square meter per decade. This increase is about ten percent of the trend from all sources of infrared energy such as clouds and water vapor.”
Here is the math: 0.2/240 = .00083 or 0.083 percent relative to the “ten percent” in the study. It is not clear how that translates to temperature. The satellite record does not show steady growth of temperature between 2000 and 2010.
What is your analysis and conclusion? Be honest.
phi
I look at your graph then you just need to consider the piece of the puzzle that easily explains your cooling trend.
Here:
https://www.sciencenews.org/article/50-years-ago-scientists-puzzled-over-slight-global-cooling
And a graph of SO2 on a global scale. You can see it was at a peak during the cooling your graph shows. Pollution standards reduced the emission rate and the warming picked up again. Your graph actually does show the warming trend matching the increase in CO2 when you remove the SO2 cooling effect to counter the CO2 warming.
https://ourworldindata.org/grapher/so-emissions-by-world-region-in-million-tonnes
Tim S
The article claimed they considered all the sources of downwelling IR and were able to find the 0.2 W/m^2/decade in the data.
This would not make a large difference in surface temperature. Roy Spencer calculates a 0.16 C/decade warming signal. But the signal is there. Other things do alter the course but they did find a real measured signal for the increased amount of CO2 in the atmosphere.
““Both series showed the same trend: atmospheric CO2 emitted an increasing amount of infrared energy, to the tune of 0.2 Watts per square meter per decade. This increase is about ten percent of the trend from all sources of infrared energy such as clouds and water vapor.”
Here is the math: 0.2/240 = .00083 or 0.083 percent relative to the “ten percent” in the study.”
Oops! Does Tim strangely think that 240 W/m2 is the “trend” in IR?
He needs think again…or think for the first time.
Ent,
I enjoy watching Clarkson’s Farm on Amazon. Do you ever watch it? I’ve learned that the climate crazies in UK are trying to destroy British farming. Climate crazies are just an extension of socialism. Capitalism stands in the way of socialism. Socialism grows out of envy. Socialists don’t like letting the free market decide. They use government to decide the winners and losers instead of the free market. That’s all this is about. That’s all you are about.
Nate,
I thought you just told us that downwelling radiation doesn’t transfer heat? So now it does?
“Socialists don’t like letting the free market decide. They use government to decide the winners and losers instead of the free market.”
Like this:
“The United States has not built a new utility-scale coal plant since 2013, and many of the nation’s existing plants are more than 40 years old. Since 2010, 330 coal plants have retired and 60 others have announced plans to close by 2031”
“President Trump on Thursday announced $700 million in new federal funding for the country’s struggling coal industry, including money that would help build the first two new coal-burning power plants in the United States in more than a decade.
In recent months, the Energy Department has ordered units at five aging coal plants to stay open instead of shutting down as planned. And Mr. Trump has directed the Defense Department to buy more electricity from coal plants to power military installations nationwide.” NYT 6-7-26
Nobody, not the public, nor the free market, wants to bring dirty, polluting, expensive, coal back.
Similarly:
https://fortune.com/2026/04/29/trump-spent-nearly-2-billion-of-taxpayer-money-to-undo-wind-projects-already-underway-dems-demand-answers/
”
Under a deal made public in March, French company TotalEnergies is getting $1 billion — essentially a refund of its leases for offshore wind projects off North Carolina and New York— if it invests the money in fossil fuel projects instead.”
and
”
The Trump admin paid a French company $1 billion to not build offshore wind farms. Blue states are suing”
https://www.cnn.com/2026/06/02/climate/trump-totalenergies-lawsuit-offshore-wind
The President clearly wants to decide the winners and losers in the energy market.
The left has used government to destroy the coal industry. Trump is using government to rebuild it.
Trump is one of the most anti-free marketers of recent presidents. The tariffs alone are the most significant hike in many decades. This is pure protectionism, not letting the market decide. But that’s just the beginning of Trump putting his thumb on the economic scales rather than letting business and consumers duke it out.
There hasn’t been a true socialist in federal government for more than 70 years. The conservative canon on this notion is the equivalent of schoolyard taunts, effective but pig ignorant.
Barry,
If there are tariffs all around the world on US goods, then that is a distortion of the free market. Trump is just playing their game.
“The left has used government to destroy the coal industry. Trump is using government to rebuild it.”
The primary cause of the decline of the coal industry is the free market. Gas from fracking surged and became cheaper than coal. Energy providers voluntarily moved away from coal towards the cheaper alternative.
Trump rolled back liberal policies that put heavier regulations on coal burners in his first administration but the decline continued, because coal couldn’t beat market forces. Clean energy subsidies made wind and solar viable, and now that the renewables industry has grown ad the technology improved, it is competitive even without subsidies. Now, instead of letting the market decide, Trump wants to wind the clock back and shield coal from market realities.
Coal has always been subsidised, even more in the early days and 100 years ago. It takes some explaining, with the history illuminated, why anyone today would further subsidise a more expensive source of energy than gas and renewables. It’s not just anti-free market, it doesn’t make economic sense. I can understand it from a national energy security perspective, where a diverse energy supply protects against shortages, but economically it’s the opposite of free market.
Speaking of national energy security, we’ve just had a fine lesson in the vagaries of oil supply, as if volatile petroleum prices haven’t long given us some insight.
Barry,
You are a plethora of leftist talking points. The energy industry has received no subsidies. They are called investment tax breaks. All industries get them; pharmaceuticals, chips, food, restaurant, banks, technology, mining, etc. etc. So, you’re saying all those industries should get tax breaks but energy companies that you don’t like? Sorry, that’s not the way it works, and we don’t listen to Australians to decide our tax policies.
“If there are tariffs all around the world on US goods, then that is a distortion of the free market. Trump is just playing their game.”
Sure. Just remember next time you moan about ‘leftists’ interfering with the free market that you yourself condone such practises when YOU think it’s justified. In fact, you thought the ‘reciprocal’ tariffs were a great idea – the largest distortion to international markets since the subprime mortgage fiasco of 2008/9.
But it’s not just tariffs, which have actually done damage to some American industries (eg semiconductors, agriculture – he’s had to give money to farmers to patch the losses from retaliatory tariffs – great deal-making Donald), he has redirected capital internally. Even at home he is thumbing many scales rather than letting demand and supply decide. Trump doesn’t give a fig about the free market.
Quit worrying about socialists. They have no power, and are no threat to capitalism.
stephen,
“You are a plethora of leftist talking points. The energy industry has received no subsidies. They are called investment tax breaks. All industries get them; pharmaceuticals, chips, food, restaurant, banks, technology, mining, etc. etc. So, you’re saying all those industries should get tax breaks but energy companies that you don’t like?”
“Like?” No, I pointed out the free-market economic peculiarity of continuing to subsidise an energy source (coal) that’s now more expensive than other sources. I also acknowledged it could be part of a strategy of diversification. I also pointed out that energy providers voluntarily trended towards natural gas because of the economic reality of it being cheaper (abetted but not caused by government regulating coal more heavily), a trend Trump wants to buck.
And like a true partisan dimwit you reduce this to “companies you don’t like.”
And thank you for pointing out the government interferes in the market across industries. Where is your vaunted free-market championing now? More to the point, why is it that the energy sector excites you on this point, but not the other industries? Answer – you’re don’t give a fig about the free market either, it’s just a foil to use to poke at industries or policies Let’s you “don’t like.”
Tax breaks for industry is public money used as a regulatory instrument on the free-market. You tax dollars subsidise tax breaks for business. Tax breaks for coal have been huge and ongoing for more than a century in the US.
As well as tax expenditure, the US fed has continued to provide direct subsidies for coal for about as long, the major part being R&D currently, but over the past century and longer the fed directly subsidised the building of infrastructure and transport for coal. Direct subsidies have been hovering around the $2 trillion mark per annum for the past decade.
You may see my focus on coal in this comment as “dislike.” No, it is to relieve you of disinformation.
For instance, while federal government subsidised coal infrastructure in the early days, it didn’t much fund power plant construction. The cumulative direct subsidies for coal over more than a century is only slightly higher than direct subsidies that exploded since the later 2010s for renewables, adjusted to today’s dollar.
So renewables have had a massive leg up in a very short time frame, compared to the longer slow drip of gov direct expenditure for coal. Government pushed harder on the levers for quicker results for renewables, and did so to help a new technology merge with an existing energy grid largely tailored for coal-generated energy. Renewables are now getting substantially more government assistanceI wonder if you than coal.
The pro-fossil fuel talking point implies that tax breaks aren’t really government subsidies. Of course they are, and the fossil fuel industry has had a massively disproportionate boost over time. Oil and gas have had the lion’s share, even more than coal.
It’s not “dislike,” nor is it preference for renewables that I challenge your ideas. If you’re going to talk about this stuff, at least get your facts straight. Check the hyperlink above for evidence of the direct subsidies for coal (and other sectors), as well as tax expenditure over recent years.
So, I know what you think of subsidising renewables, but I’m curious to know if you consider the historical and current direct subsidisation of the fossil fuel industry to be a market distortion to be frowned upon? Or do you think government help was necessary to accelerate public access to cheap energy in the past?
Barry,
Tax breaks for industry aren’t public money. It is their money. You’re showing your socialist stripes. That is the difference between a leftist and a free market conservative. Fossil fuels aren’t the demon. They are the drivers of capitalism and our economy. I feel sorry for the average Australian. They have allowed themselves to be duped by the left. You have no rights except those bestowed on you by the government. During the pandemic you were a clown show. Your system showed its authoritarian stripes and the people had no recourse. There’s a man on YouTube who silently protests by wearing a placard in city in Australia and the police show up and tell him he has to leave. The placard is “hate speech.” No free speech in Australia as well as many other socialist countries like Britain and Sweden. We don’t want your path. It is a path to tyranny. Of course, if Australia is threatened by China you will come to us to save your sorry asses.
“left has used government to destroy the coal industry. Trump is using government to rebuild it.”
I see, Stephen.
So you are perfectly ok with a socialist govt led by your guy, picking winners and losers in the energy market, as long as you like the picks.
Got it.
stephen,
It’s hard to know where to start to unpack that extraordinarily distorted view of economics, Australia, and of me.
I’ll start with you completely ignoring the fact I linked for you that coal gets $2 trillion in DIRECT subsidies. And that coal has received even more in direct subsidies in the early 20th Century.
I put that down to you being a purely political animal with big blinders.
It’s the reason why you are making a conversation about economics a political hammer. Is that all you can do?
Australia has a conservative party. We have conservative voters. They win half the time. We’re not a ‘socialist’ country. You clearly don’t know the meaning of the word. We’re a mixed economy, with a regulated free market, not much different from the US.
While our free speech freedoms are differently structured, the US is a little more free, but in some cases Australia is. No one gets locked up here for criticising the government. We can trash the ruling party just as freely as you can. Our laws vary state to state, the US has a constitutionally backed free speech protection. Both countries have similar restrictions, such as incitement to violence, defamation, fraud, perjury, etc. Your cartoon view of the situation is based on snippets.
As for tyranny, see to your own backyard. The Australian prime minister does not have nearly the power of the US president in the frame of government, and thus is unable to abuse that power as much as a US president can. The prime minister has far less scope to act unilaterally. The US president can issue decrees in the form of Executive Orders. The prime minister needs to work through cabinet approval and sign off by an executive council and the governor general, The US president is closer to a king than the Australia prime minister. The ‘checks’ on executive power are far stronger here than in your country, and we are witnessing your president push the envelope on presidential authority far further than any prior.
Tax expenditure: the government taxes individuals and corporations equally. That is expected revenue that is public money. When tax breaks are given, that is not a person or a company getting their own money back, that is directing public money which COMES from everyone’s taxes – to select industries.
If the government collects standard tax from a company and then writes a check to subsidise that company, it has exactly the same effect on the public purse as creating a tax break for the same amount. The accounting is exactly the same, the name of the vehicle is different. The federal government operates on a budget. If a corporate sector is granted a $10 billion tax expenditure, the government still needs to fund its operations. To make up for that missing $10 billion, the tax burden must be shifted onto the rest of the public—meaning everyday citizens and unsubsidized businesses end up paying higher taxes than they otherwise would.
It’s political optics: writing a direct multi-billion-dollar government check to a fossil fuel or green energy corporation can trigger public outcry. Passing a “tax deduction” or “credit” makes it sound like the government is simply letting a company keep its own money. It’s an easier sell to the public (and to congresscritters, who like to keep their constituents onside when they pass legislation). Either way, the economic effect is exactly the same. It’s also cheaper to write laws for tax exemptions and credits than set up an agency to disburse money.
But you didn’t answer my question, which I exempted from the idea of tax breaks being subsidies just for you. Hopefully you can wean yourself off the left/right claptrap for a whole post.
I’m curious to know if you consider the historical direct subsidisation of the fossil fuel industry to be a market distortion to be frowned upon? Or do you think government help was necessary to accelerate public access to cheap energy in the past?
Barry,
Again, a plethora of leftist talking points. The coal industry has not received any direct subsidies, even though you did capitalize direct. They get exploration tax credits and development tax credits like all other US corporations. Trump recognizes we need coal. Farmers get subsidies, direct by the way. The President can’t do anything more than the Constitution allows. We didn’t have your lockdowns. We didn’t have your vaccine mandates even though Biden (not Trump) tried. You recognize you don’t have free speech or the right to keep and bear arms. We don’t want to be like you. Yes, you do have conservatives. I love SkyNews Australia. But conservatives haven’t been in power for a long time. Your country is like Britain; conservatives exist but barely hanging on. We don’t want that. You hate capitalism until you need it to save your sorry asses.
Sharp comment, Nate.
Barry,
You don’t see conservatives on the whole or in any significant part supporting this global warming due to fossil fuels nonsense. That’s because it is seen for what it is. It is a way for government to control free market capitalism. Your faux concern about how tariffs are hurting US consumers is laughable. You don’t give a rat’s ass about US consumers. You hate Trump because you can’t control him. He sees socialism (leftism) which is just soft Marxism, for what it is-antithetical to the US Constitution.
Barry is like Scott Pelley, former 60 Minutes host. He’s a leftist but doesn’t know it or admit it.
Troglodyte is like Bari Weiss, a complete tool:
https://www.theguardian.com/media/2026/jun/07/scott-pelley-bari-weiss-renee-good-report
An inveterate liar too, most probably.
Is Nate actually confused about basic algebra? Percent increase per decade divide by baseline is a trend. The percent is the increase per decade.
left right left right left right….
What a limited, distorting lens to view things through.
There’s no such thing as center or an independent. An independent is a leftist who won’t admit it. Just accept who you are.
Tim,
The study was clear
“This increase is about ten percent of the trend”
Then you:
“Here is the math: 0.2/240 = .00083 or 0.083 percent relative to the “ten percent” in the study.”
So NO, that is not THE MATH, since 240 is not THE TREND.
You are either confused or trying to mislead people.
There is such a thing as a reactionary centrist, and Pelley is one.
https://bsky.app/profile/michaelhobbes.bsky.social/post/3mnpmqpbfus2p
There is such a thing as a troglodyte:
https://www.propublica.org/article/mark-mcafee-raw-milk-recalls-maha
https://www.tropicaltidbits.com/analysis/ocean/cdas-sflux_ssta_atl_1.png
https://www.tropicaltidbits.com/analysis/ocean/cdas-sflux_ssta_atl_1.png
https://i.ibb.co/7xkWWZcz/cdas-sflux-ssta-atl-1.png
Due to the Earth’s position relative to the Sun (aphelion in July), summer temperatures at the North Pole do not rise compared to the 1958–2002 average. The Sun is the primary factor influencing climate change on a timescale of thousands of years.
https://i.ibb.co/PGX4kWCD/daily-ts-2026.png
Polar bears can still hunt on the ice in Hudson Bay.
https://i.ibb.co/4n9nXqZz/masie-all-r10-4km.png
One of the hallmarks of pseudoskeptics is their constant tendency to ignore or discredit anything that contradicts them via irrefutable data.
*
First, a few clarifying words regarding the comparison between the “good” UAH data and the “bad” NOAA or NASA data.
Just as O2 emissions in the 60 GHz range are recorded by extremely precise AMSU instruments aboard polar-orbiting satellites, infrared radiant flux densities have also been determined since 1979 by extremely precise HIRS instruments aboard (sometimes the very same) polar-orbiting satellites.
And just as there is obviously no reason for pseudoskeptics to question the accuracy of UAH’s processing of 60 GHz O2 emissions to derive temperatures – simply because they like the results (due to the low temperatures) – there should likewise be no reason for them to doubt the accuracy of NASA’s processing of infrared emissions just because they dislike the results (which support the dominance of radiative processesin Earth’s energy budget).
*
1. I have already explained the origin of this 240 W/m² figure:
https://archive.data.noaa.gov/climatedatarecords#UMD_ESSIC/OLR_CDR/Daily/OLR-D-CDR_01B-21/
*
As with UAH, the data determined above the atmosphere are incorporated into data grids, where each cell is assigned an infrared radiant flux density value.
This flat grid (for OLR: 1 x 1 de sgree, i.e., 180 x 360 cells) must be mapped onto a sphere (or ellipsoid); therefore, the spherical surface area is calculated for each cell latitude.
Using the OLR grid and assuming a perfect sphere, a grid cell at 45° latitude has an area of 8,743 km² (compared to 8,762 km² for the WGS84 ellipsoid); at e.g. 220 W/m² (which equates to 220 MW/km²), this yields an available power output of 1,923,460 MW – or approximately 1.92 TW – on the day of measurement.
If one sums all these available power outputs and divides the total by the Earth’s surface area, a purely spherical calculation yields an average infrared radiant flux density of 240.37 W/m² for the year 2025, for example; the average across all years since 1987 is 239.56 W/m².
*
The “Chief Ignoramus” failed to grasp this some time ago, so I will state it again: just as a 900 MW power plant delivers 21.6 GWh of energy in 24 hours, the aforementioned cell at 45°N delivers approximately 46 TWh infrared radiation energy on the day the 220 W/m² figure was derived from HIRS measurements.
Summing the values for all cells for each day, and then summing the daily totals for the year, the calculation yields a total energy output (in the form of infrared radiation escaping to space) of 1,076,426,351 TWh for the year 2025.
**
2. And this MUST correspond over a period of say 10 years to the energy supplied by the Sun: cell by cell, hour by hour – during that same year, rather than the 100% figure of 1,361 W/m² everywhere at any time. Otherwise, we are heading either toward a furnace or a frozen snowball.
I will forgo the discussion regarding the variation in solar irradiance across a hemisphere – which effectively halves the total – as that topic has become irrelevant to me since I began analyzing solar data.
It is far more interesting and revealing to analyze the solar radiation actually measured by ground stations; this allows us to see, regardless of the location or year chosen, what remains of that famous 1361 W/m² when averaged over the day and the year.
I have presented a great deal of US SURFRAD, OLR and worldwide BSRN data in graphical form over the past few weeks; here is some new data, this time from the Selegua station (Mexico, lat. 15° N), whose data is accessible in the BSRN (Baseline Surface Radiation Network), for e.g. the year 2020.
Annual data
https://drive.google.com/file/d/1P5BXl2SBXvemsm24QvjxaC_wbDiBEybK/view
How can the blue average line be so low?
Simply look at the marked differences in the daily data for downwelling solar radiation versus downwelling and upwelling infrared radiation:
Daily data: January 1–7
https://drive.google.com/file/d/1j0yewnbibZxwoCegqfUnhGnovUWhC_z5/view
Daily data: July 11–17
https://drive.google.com/file/d/1hXqxon8zdPr-9tIDZS6S4psFp02-lNwD/view
*
The annual figures tell an even clearer story. Maximum of downwelling solar:
2020 09 25 1390 (*)
2020 09 07 1338
2020 09 06 1311
Minimum: 0 (yeah, zehro, night is night)
Maximum e.g. of downwelling infrared:
2020 09 05 471
2020 08 20 470
2020 08 02 466
Minimum:
2020 12 27 306
2020 02 03 306
2020 02 03 306
Number of days with less than 10 W/m² of incident solar radiation: 4512, i.e., 52% of the year.
Should anyone consider the solar radiation in Selegua to be exceptional, it should be noted that the average across all 10 BSRN stations whose data I downloaded was 51%.
{ (*) Don’t be surprised by the irradiance values, which are well above the actual maximum value of 1361: This is due to effects such as forward refraction or cloud lensing; values above 2000 have been measured in the Atacama Desert at altitudes above 5000 meters. }
*
This is precisely what pseudo-skeptics cannot accept: While solar radiation is interrupted daily by the night and seasonally depending on latitude, the same does NOT apply to the terrestrial response to it.
Number of days with less than 10 W/m² with downwelling solar: 4512, i.e. 52%
Should anyone believe the solar situation in Selegua is special, sorry: the average for all 10 BSRN stations I downloaded the data of is 51%.
*
If we now look at this budget diagram from 2015:
https://rmets.onlinelibrary.wiley.com/cms/asset/6af63d13-c314-46ec-86f3-82254ba4df4e/qj2704-fig-0001-m.jpg
…then there is simply nothing wrong with it, neither the 240 W/m² of averaged infrared radiant flux density at the TOA, nor the downwelling solar radiation, though appearing apparently so low compared to other radiation values.
What pyranometers, pyrheliometers, and pyrgeometers have been measuring for decades should not be called into question without well-founded technical objection—any more than the brightness analyses from UAH based on MSU and AMSU.
But I know: pseudoskeptics always reject numbers not fitting their narrative…
There was a little clash when transferring translated text from Google into the blog’s edit form, things duplicated, others missing.
*
Here are the averages of the BSRN stations I downloaded the data of (from Alert, Nunavut in Canada; over Nauru Island at the Equator; down to South Pole):
downwelling solar: 173 (W/m²)
downwelling infrared: 281
Only four of them had info for upwelling. Thus,
upwelling infrared: 278
is therefore not very informative in comparison to the former.
Bindi, thanks for proving me right again.
The satellites are NOT measuring infrared flux (W/m²) at TOA. They measure “spectral radiance” (W/m²/sr/μm). Then they use a model based on values like the bogus 240 W/m². There is NO valid measurement of OLR. It’s all modeling!
You don’t have to prove me right all the time, but I appreciate your efforts when you do.
Hey Puffman, riddle me this –
What’s the area of the Earth?
1. Some here don’t have the least idea of on what for emprical models UAH’s trasformations from brightness to temperature are needed…
*
2. ” Then they use a model based on values like the bogus 240 W/m². ”
This is a blatant lie.
*
I read about CERES EBAF years ago, anyone can see it today anywhere, just ask some AI bot.
The instruments measure indeed spectral radiance (W/m²/sr/μm) at specific angles, rather than directly outputting a globally integrated flux, and thir data processing is based on Angular Distribution Models.
Coincident imagers scan the same footprint to determine the exact scene content, such as cloud fraction, aerosol types, and surface properties (e.g., snow, ocean, desert).
Because the Earth does not reflect or emit radiation uniformly in all directions (it is anisotropic), scientists use scene-dependent ADMs to estimate how radiance varies based on viewing geometry (viewing zenith, solar zenith, and relative azimuth angles).
The measured spectral radiance is integrated over all viewing angles to obtain the total shortwave (reflected) or longwave (emitted) flux for that specific scene.
For times when a satellite isn’t passing overhead, algorithms use models to account for diurnal variations (how the reflection/emission changes throughout the day) to establish a daily mean flux.
*
If Clint R had the least idea of how to process the data stored e.g. in
https://archive.data.noaa.gov/climatedatarecords/UMD_ESSIC/OLR_CDR/Daily/OLR-D-CDR_01B-21/OLR-Daily_v02r00_s20250101_e20251231.nc
he would know that the 240.37 W/m² for the year 2025 is not a bogus number used by the scientists, but is on the contrary the result of processing the data stored in the file linked above, which contains for each of the 365 days a 1 degree grid array (180 x 360 cells which all contain the result of the spectral radiance accurately derived for each cell).
I.e. 189.87 W/m² for January 1 at 90S-180W resp. 171.82 W/m²at 90N-180E.
The average of all the 23,783,400 radiant flux density values for 2025 is 224.92 W/m² – a lot below the true value obtained by transforming the flat grid into a sphere or an ellipsoid.
*
But Clint R has, like Robertson and all the arrogant and ignorant pseudoskeptics infesting this blog, NO technical skills of how to compute the final result and contradict what I did, let alone what the scientists did; hence, what remains to him is to discredit, denigrate and… lie.
So are they, the Clint Rs…
Sometimes I feel sorry for Bindi. He’s such a sad case. He wants so bad to stalk me and prove me wrong, but he doesn’t understand any of the science. Like with the Moon issue, he STILL has no viable model of “orbiting without spin”. That means he knows NOTHING about orbital motions.
Here, he first claims what I said was a “blatant lie”, then he goes on to clog the blog to say what I said! (Only in 20 times the words!)
He’s an immature cult child, like the rest. He doesn’t understand the science, and can’t learn. He’s one of the cult kids that has NEVER answered one of my basic physics questions.
I don’t understand why he keeps beating his head against the wall. Immaturity combined with mental illness?
Allow me to remind everyone what Gordon (and, by implication, CR) believe:
“There must be a precise temperature for a photon.”
Dumb and dumber.
This “studentb” child stalks me often. Because he has no science, he resorts to false accusations. There’s no way I ever said such a thing, consequently there is no way this child could provide a link with me saying it.
Just another example of how the cult kids disrespect reality.
Anybody who refers to “CO2 15 micron photons”, by definition, is labelling them with a temperature.
I stand by my claim of “dumb and dumber”.
Making up false definitions is what a cult does to pervert reality.
Thanks for proving me right.
The North Atlantic is cooled by a vast upper-level low-pressure system. Heavy cloud cover prevents the surface from being warmed by solar radiation.
The highest sea surface temperatures in the eastern Pacific occur in a limited area south of Mexico and north of the equator.
https://i.ibb.co/4wB4L5kN/cdas-sflux-sst-global-1.png
Are the temperature increases accelerating?
I am still struggling with this question. I used an AI model for awhile and wasn’t completely satisfied with “our” conclusion: no (or very little) acceleration.
Dr. Roy has been publishing the linear trend since 1979 for awhile. I don’t want to hunt back through all those posts to see what it has been in the past. It is currently +0.16C/decade. I found +0.14C/decade through October 2020. Does anyone have the months when it first went to +0.16C, +0.15C, etc, back to, say, 2009, when we first had a 30 year period? Also, what is the potential error in the measurement? +/- what?
No new analyses and charts/graphs, please, unless they are quite clear. I am not a practicing scientist. Think of me as Feynman’s first year student (or bartender). BTW, whether you are a warming advocate or critic, that is how you have to communicate if you want to change policy.
Thomas Hagedorn
What exactly didn’t you understand what I wrote above for you:
https://www.drroyspencer.com/2026/06/uah-v6-1-global-temperature-update-for-may-2026-0-53-deg-c/#comment-1745986
1. The trend for 1978-2008 was 0.13 °C /decade
2. The trend for 1978-2026 is 0.16 °C / decade.
What else do you need?
This is a perennial problem for Republican politicians. Many are climate change deniers because that is what their campaign donors pay them to be.
For US temperature check, I went to:
https://www.extremeweatherwatch.com/countries/united-states/average-temperature-by-year. The Thi and Tlo data from 1901 to 2024 are displayed in long table. Here is the data for these two years:
Year—–Thi——Tlo Temperature are °C
2024—–16.8—–4.3
1901—–14.9—–1.6
Change—+1.9—-+2.7
For Thi the temperature increase is: 1.9/12.4 decades=0.15/decade
This value of 0.15° C is very close to your value.
The Extremeweatherwatch website has yet to updated temperature data for 2025 for the countries. However, temperature data for cities is available for 2025.
Apologies for some remarks letting me appear like an arrogant teacher.
What wonders me all the time again is that people can compare temperature trends for
– completely different periods: 1901-2024 versus 1979-2026
– completely different regions (US – I suppose you mean CONUS – versus the Globe.
Moreover, when we speak about ‘temperature increase’, I suppose you mean ‘trend’, a procedure used by everybody, and based on ordinary least squares rather than simply dividing an increase by a time period.
Please look at UAH’s regional and zonal data:
https://vortex.nsstc.uah.edu/data/msu/v6.1/tlt/uahncdc_lt_6.1.txt
There you will see at the bottom the trend for CONUS aka “USA48” till (currently) April 2026:
0.21 °C / decade (versus 0.16 for the Globe).
*
I just uploaded your EW data, and here are the linear trends in °C / decade for (Thi+Tlo)/2 (sat data has only Tavg), within different periods, compared where meaningful to UAH’s time series for CONUS:
1901-2024
EW: 0.11
1979-2024
EW: 0.32
48: 0.19
2000-2024
EW: 0.41
48: 0.24
*
Seems to look a bit different.
Tropical storm over Jamaica.
https://i.ibb.co/cX7mxk1W/goes19-ir-watl.gif
Stephen
You have it backwards. Through campaign donations the companies control the govermnent.
Oh, do you mean like Soros or Singham>
Doesn’t really make much difference who is donating or to which party.
The American political system is corrupt because the politicians at all levels are dependant on campaign donations and the donor then controls what the politician says, how he votes and where the government funding ends up.
As the old saying goes; “He who pays the piper calls the tune.”
The USA is probably the greatest country and best political system that’s ever been and ever will be. Is it perfect? No. It is the greatest wealth building, where even poor people are fat. Is it utopia? There is no utopia. Never will be. Socialism is nowhere near utopia. That’s the thing with you leftists, you think you can plan utopia, you can’t. Every socialist system ends in disaster, or they jump back into capitalism so it can save them. Our system has always been about equality of opportunity but utopians demand equality of outcome. Doesn’t work, never will. It goes against human nature. If you took every penny from Elon Musk and kicked him into the streets, within 5 years he’d be a billionaire again. That’s human nature and leftists hate it and thrive on envy and with every word that comes out of your mouths you prove my point.
“The USA is probably the greatest country and best political system that’s ever been and ever will be.”
ROFL.
More fun with “240 W/m²”
[CAUTION, not suitable for children.]
The cult is so obsessed with their bogus 240 W/m² that they even use it as the solar input to Earth, after albedo. So they have no problem replacing Sun with 4 sources equally placed around an imaginary sphere. The sphere is then receiving 240 W/m² at each of four disks, resulting in a temperature of 255K.
That works for an imaginary sphere. There are no violations of physical laws. The cult believes four sources supplying 240 W/m² is the same as one source supplying 960 W/m². But, that does not mean you can keep adding more 240 W/m² and still raise the temperature.
One source supplying 240 W/m² to the imaginary sphere would result in the sphere having a temperature of 180K and emitting 60 W/m².
Two sources each supplying 240 W/m² to the imaginary sphere would result in the sphere having a temperature of 214K and emitting 120 W/m².
Three such sources — 237K, 180 W/m².
Four such sources — 255K, 240 W/m².
Each new 240 W/m² is able to continue to raise the temperature. So the cult believes it will go one forever. However, once the sphere is emitting 240 W/m², an additional 240 W/m² would not be able to increase the temperature. Radiative fluxes don’t simply add.
An arriving flux MUST be greater than the flux being emitted by a surface to raise the surface’s temperature. Believing a lesser flux can raise temperature is one of the many flaws in the CO2 nonsense.
More fun: What temperature would result from four sources supplying 960 W/m² to the imaginary sphere?
Temperature of 361K, emitting 960 W/m².
Clint R
Since you believe all science minded people and those who have actually studied various branches are in some type of cult that you invented, can you verify your claims with an actual experiment. You claim adding more heat lamps to a sphere will not increase its temperature but you provide ZERO evidence. Textbook science, which I have linked you to, clearly states that EMR energy from a colder source will be absorbed by a hotter one. I linked you to a valid textbook and gave you the page numbers. I cannot help you when you claim valid science is a “cult” but will offer NO EVIDENCE whatsover to support your claims.
I can help you here. People who belong to cults blindly believe what authorities tell them to believe (like what you do, make claims with no evidence and that goes against established physics). Your posts are cultish. You make claims with no support and belittle any one who questions your claims. This is what cults do.
The science minded on this blog you insult regularly do support their claims with links and supporting evidence which is opposite of what you do and which is NOT cultish in anyway.
Norman, I’ve told you over and over that if you want me to teach you science, you MUST stop the insults and false accusations. But, like the rest of the cult kids, you can’t learn.
Thanks for proving me right.
Clint R
Sounds like you are admitting to being a cult mind! When I ask for evidence you divert. You do it all the time.
Basically you are clearly saying you have zero desire to provide valid science. You are happy to divert.
Wrong again, stalker.
What I’m saying is I no longer waste time with cult kids that have no respect for reality.
Norman,
Longwave radiation doesn’t warm the ocean. It doesn’t warm land either because the land is warmer. Shortwave IR will warm the ocean. You can’t have a warmer planet heating a colder atmosphere and then the colder atmosphere heating the planet. That would be a perpetual motion machine. If EMR energy could heat a warmer object you could create a perpetual motion machine.
https://www.realclimate.org/index.php/archives/2006/09/why-greenhouse-gases-heat-the-ocean/
Clint R
A correction for you. What you rally will not “waste” your time on is providing valid science evidence for your cult claims! Thank me for correcting you Cult Clint!
Stephen p anderson
I am hoping you have more ability to rationally think than our Cult friend Clint R. The atmosphere is not warming the surface!! Look the Global energy budgets. The surface emits around 398 W/m^2 (just an average). The colder atmoshere retuns 340. The effect is not warming. The GHE works because GHG reduce the Net surface energy loss of what would be 398 W/m^2 to 58 W/m^2. Still losing energy so not warming. This allows the average solar input of 163 W/m^2 has a net gain 105 W/m^2 which is removed by the other surface cooling, convection and evaporation.
In your experience you know the air temperature inside a car in summer is much higher than outside air. The inside air is not receiving greater input solar energy but the rate of heat loss is reduced so it gets much warmer. The body of the car restricting heat loss is not warming this air! It acts to reduce heat loss so solar input then results in higher temperature.
Please help me understand why the “skeptics” who post here are unable or unwilling to accept basic established science??
Here’s just one example of how Norman attempts to distort reality: “You claim adding more heat lamps to a sphere will not increase its temperature but you provide ZERO evidence.”
I never said any such thing. What Norman is confused about is my example above about 4 sources each providing 240 W/m² to a sphere. The sphere would be emitting 240 W/m². So a fifth, sixth, or more identical sources would be unable to raise the sphere’s temperature, since it is already emitting 240 W/m².
He can’t understand because he’s never studied radiative physics or thermodynamics. Worse yet, he can’t accept reality.
Cult Clint R
Are you goofy? You state “He can’t understand because he’s never studied radiative physics or thermodynamics. Worse yet, he can’t accept reality.”
I have linked you to textbooks on heat transfer I have studied. What up with your false claims? You are the one who has NEVER studied real physics.
Here:
https://lampinsider.com/how-many-watts-does-a-heat-lamp-use/
So you can buy yourself 6 heat lamps. If you buy a 250 Watt bulb it will not produce more than 250 watts of power. Now surround a globe with one and measure the surface temperature at various points. Add another then keep measuring the surface temperature until you have all six going. Make up a sheet and post your results as what happens to the sphere temperature as you add heat lamps. See if it is limited (eventually you will run out of space to add more but you can post the results of each addition).
You can babble like drunk about your supposed superior knowledge that you can’t support with valid science. I would expect you to do some actual science and demonstrate your knowledge of heat transfer is superior to one such as Tim Folkerts. Rational posters on this blog already know you will not perform any science (such as an experiment). You will keep calling intelligent people cult minded. You will attract a few ignorants like DREMT or Bill Hunter to your made up science. You have convinced zero scientists that you have any real knowledge. Let us see you convince NASA scientists the Moon does not rotate once per orbit (tidal locked). Send them your great idea of a ball-on-a-string and convince them that they are brain-dead Astrologers for thinking the Moon actually rotates.
Sorry Norman, but finding a source on the Internet is not the same as taking a dedicated college-level course. I can tell you’ve never had a real course in thermodynamics. That’s why you have to resort to insults and false accusations. But, I’m immune to such childishness.
Here’s just one example of how you attempt to distort reality: “You claim adding more heat lamps to a sphere will not increase its temperature but you provide ZERO evidence.”
I never said any such thing. You’re fixated on “heat lamps”, which is your attempt to pervert my example. What you are confused about is my example above about 4 sources each providing 240 W/m² to a sphere. The sphere would be emitting 240 W/m². So a fifth, sixth, or more identical sources would be unable to raise the sphere’s temperature, since it is already emitting 240 W/m².
You can’t understand because you’ve never studied radiative physics or thermodynamics. Worse yet, you can’t accept reality. You keep forgetting you have no viable model of “orbiting without spin”. You have to just keep making up crap.
Keep proving me right.
Norman says:
You will attract a few ignorants like DREMT or Bill Hunter to your made up science. You have convinced zero scientists that you have any real knowledge. Let us see you convince NASA scientists the Moon does not rotate once per orbit (tidal locked).
——————-
Norman obviously disputes the concept of a rotation on an external axis. Indeed the moon does rotate and does so around earth. Norman can’t even get the facts straight much less figure out that both DREMT and I recognize that the moon rotates with the only dispute being where the “true” axis lies. Talk about being an ignorant. Sheesh!
Norman,
You just linked a post to Berkley Earth that is in direct opposition to your claim that it is just “returning the warmth+ but not really warming anything, which doesn’t make sense, thermodynamically.
I asked google AI on an incognito tab:
“If I have 8 suns around a blackbody sphere, each supplying 240 W/m2 to the surface, what flux will the sphere emit?”
Copy and paste that question to an AI, Clint, and do it on a brand new incognito window/tab.
This is the answer I got (minus some of the math):
“At thermal equilibrium, the sphere will emit a flux of 480 W/m2.
Core Assumptions
The sphere is a perfect blackbody.
Absorptivity equals exactly 1.
Emissivity equals exactly 1.
Total power absorbed equals total power emitted.
Suns do not overlap or shadow each other.
Step-by-Step Calculation
1. Calculate the intercepted power per sun:
A sphere of radius R projects a flat cross-sectional disk area to a distant light beam.
[math]
2. Calculate the total power absorbed:
Eight suns each deliver 240 W/m2 across this cross-sectional area.
[math]
3. Determine the emission surface area:
The sphere radiates energy out into space from its entire surface.
[math]
4. Calculate equilibrium emitted flux:
At thermal equilibrium, total power emitted equals total power absorbed.
[math]
= 480 W/m2”
Go on Clint, try it. To keep the answer free of bias, ask it neutrally like I did, in a brand new conversation, incognito.
“Black Body Barry” is back!
Ask your worthless AI, “What the temperature of the sphere would be if surrounded by 8 sources that each provided 300 W/m² to its surface.”
If it again gives you the wrong answer, ask it is 8 blocks of ice could boil water?
I didn’t pay attention to this earlier.
“…8 sources that each provided 300 W/m2 to its surface…
…8 blocks of ice could boil water…”
Emitted flux v absorbed flux…
Oh, McGooo, you’ve done it again!
I think I can help you out, Clint.
Imagine it is our sun irradiating the sphere.
Now completely fill the entire field of view of the sphere with suns. A great sphere encasing the sphere, like a giant cavity.
We all know that the sphere temperature must equal the temperature of the cavity ‘wall’. The sphere must be 5778K.
This is radiative transfer 101, the basic equilibrium in a cavity scenario. If the walls are fixed at a certain temperature, all objects within the cavity must equilibrate to that temperature. They cannot be hotter or colder.
The flux for that temperature is 63,200,700 W/m2. That is what the sphere must emit at equilibrium on this scenario.
AI tells me that 184,260 suns like ours could surround a sphere at 1 AU.
Do you see it yet?
Now start taking away suns one by one.
Each sun removed reduces the temperature of the sphere.
4 suns equipositioned around the sphere do not provide the temperature limit for the sphere. Each sun added makes the sphere warmer, until the temperature of the sphere equilibrates with the surface temperature of the sun/s when completely surrounded.
With your view, we encase the sphere with an enclosure of suns at 5778K, and still the sphere remains at 340K.
Do you see it?
You mean the inconsistency between your two comments?
Yup, I see it.
Do you see it?
If not, you might need a responsible adult to help you.
Clint,
There’s no legitimate way around this very basic equilibrium cavity scenario. If the temperature of the walls are fixed, any object inside must come to the same temperature and radiate the same flux.
Surrounding the sphere with a wall of suns at 5778K must give the sphere the same temperature as the surface of the suns.
The corollary is obvious. As you remove suns the sphere drops in temperature and radiates less and less intensely. Eventually we get down to 4 equipositioned suns each delivering 340 W/m2 to the sphere, and a much lower temperature/flux emitted by the sphere.
Removing suns subtracts from the total radiative flux it absorbs, adding suns increases it.
If you don’t agree with this, could you please explain why?
barry, you’re perverting the problem, just like you attempt to pervert reality. That’s what you have to do to protect your cult.
My comment (above) involved 4 sources each providing 240 W/m² to the sphere. If you change that scenario drastically, you change the problem. That’s the problem with radiative physics and thermodynamics. If you don’t understand what you’re doing, you end up getting in trouble as you did with your AI. You’ve got AI basically saying you can boil water with ice!
You even have a bag of tricks you use to pervert reality — a black body, and the bogus “heat transfer” equation, for example. Others of your cult use “CO2 lasers”, microwave ovens, IR thermometers, and magnifying glasses, to pervert reality.
Now, what perversion will you attempt next?
A good rebuttal to your thesis isn’t a ‘perversion.’, it’s just something you have no answer for.
“My comment (above) involved 4 sources each providing 240 W/m2 to the sphere. If you change that scenario…”
Your comment mentioned an extra 240 W/m2 irradiating the sphere, asserting no effect. I took that assertion to a logical conclusion to demonstrate its falsehood. If what you say is true, 184,000 suns completely surrounding the sphere would provide no more warmth to it than 4. My argument scotched that assertion, as the sphere must be in equilibrium with its environment.
“a bag of tricks you use to pervert reality — a black body”
The sphere in your scenario is a blackbody. If it weren’t it wouldn’t absorb all the radiation from the 4 suns and its temperature would be lower than your solution.
Are you sure you want to say using blackbodies is a trick to pervert reality? You’re unwittingly accusing yourself.
Ad hom really won’t obscure your mistakes here, Clint. It is perfectly clear that you have no answer to this rebuttal.
Fluxes add. See above.
You, and some of you cult, have stepped in it again, blackbody barry.
I usually don’t waste my time debunking such nonsense, but this is worth it. You have revealed your vast incompetence and ignorance. Unfortunately I will have to wait until this weekend to find the time.
Stay tuned….
Clint has been thoroughly schooled.
Unfortunately, he has no time, and needs to crawl away. Though, as usual, he leaves a slimy trail.
A correction: a greybody would respond to radiative input like a blackbody. So your sphere could be a greybody rather than a blackbody, Clint.
However, both constructs are equally theoretical, so your criticism of blackbodies reflects equally on the sphere as greybody too (pun intended).
I was thinking of albedo when I said emissivity. The sphere is a planet in my mind.
Speaking of “cavities” reminds me of this:
https://www.drroyspencer.com/2026/04/uah-v6-1-global-temperature-update-for-march-2026-0-38-deg-c/#comment-1742689
Barry,
“Surrounding the sphere with a wall of suns at 5778K must give the sphere the same temperature as the surface of the suns.”
And thus, the Clint ‘theory’ is burnt like the surface of the Earth.
Nate comments in the wrong place (quite deliberately).
DREMT tries to distract us from Clint’s ‘theory’ going up in flames by baiting people into relitigating his Zombie arguments, and nost importantly, posting etiguette!
Actually, the dream is to post a comment and get no responses. Sadly that is not possible when I have so many stalkers.
Weird. Post bait, in hopes of getting no response!
Poof goes your credibility, again.
See what I mean?
These comments remind me of a time when I won a conversation. I do hope no one interrupts my perfection by commenting below. I do so hate getting dragged into conversations that I already won.
Yes, folks – barry’s another stalker.
All I want to do is just provide a link so people can read through the discussion, and hopefully learn something.
All I want is for no one to comment on my posts.
A little more for people to read, on the same subject:
https://www.drroyspencer.com/2026/04/uah-v6-1-global-temperature-update-for-march-2026-0-38-deg-c/#comment-1742923
[PUFFMAN] *Repeats one of his silly riddles*
[BARRY] A great sphere encasing the sphere, like a giant cavity.
[GRAHAM] Speaking of “cavities” reminds me of this:
[NATE] Yes, Barry. Puffman’s riddle is a little silly.
[GRAHAM] Go away, stalker!
[BARRY] Yes, Nate. Really silly.
[GRAHAM] ANOTHER STALKER!
*Faints*.
It goes without saying that my biggest stalker would appear, and thus identify himself as a stalker.
SOLAR MINIMUM UPDATE
Last month FastNet, the AI weather model we’re developing with
@metoffice.gov.uk, predicted the high temperatures of May’s heatwave 84hrs ahead.
It captured the highest midday temperatures more closely than the current operational physics-based global model.
Learn more: bit.ly/47JvdRm
https://bsky.app/profile/theturing.bsky.social/post/3mnu2mcrrjc2o
Meanwhile Sky Dragon cranks can’t make elementary divisions.
SOLAR MINIMUM UPDATE
Last month FastNet, the AI weather model we’re developing with @metoffice.gov.uk, predicted the high temperatures of May’s heatwave 84hrs ahead. It captured the highest midday temperatures more closely than the current operational physics-based global model.
https://bsky.app/profile/theturing.bsky.social/post/3mnu2mcrrjc2o
Meanwhile Sky Dragon cranks can’t make elementary divisions.
Nate,
This is related to these three characteristics:
1. Smoothing that increases with depth.
2. Regular and significant computational smoothing (one century) that is added to the physical smoothing.
3. The use of a point for the present, which is arbitrary given the smoothing used.
Bindidon – Thank you for your helpful post about temperature acceleration. Can you go way back up in these posts and answer my response? It was around 4:30 AM on June 9. Just asking for a few simple calculations. I could likely try them, but not sure they would be right.
“The USA is probably the greatest country and best political system that’s ever been and ever will be.”
ROFL.
Britain used to be a great country. It reached its apex probably during Victoria’s reign. Now it is a shell of its former self. Britain needed us to defeat the Nazi socialists and then it embraced socialism. Communism worked its way into Britain through the Labour Party. Why would Britain embrace socialism after it worked so hard to defeat it? It was already headed down that path. Staggers the imagination.
No deflection.
Never mind the UK; I want go hear you defend a system in which the fossil fuel lobby can buy a president.
Said president then enriches his family. He uses his Justice Department to harass his political opponents and he fires Senators and officials who dare to disagree with him. He packed the Supreme Court with his own appointees.
His party practices racism and discriminatory voting practices on a scale unheard of in recent history. Both parties practice gerrymandering to fiddle the vote.
Tariffs have damaged his economy by restricting trade and making necessary imports such as rare earths more expensivemore expensive. His enefgy policy discourages the use of cheap and plentiful renewables while encouraging the costliest and most expensive fuel on the planet.
His science policy is demolishing what used to be one of America’s greatest strengths. Finally he
We wont even discuss his egotism, his encroaching senility or his urge to put his name on everything and build monuments to himself.
Overall, the US has become a mockery of a democracy. It’s not yet a dictatorship, but its certainly an oligarchy with Trump as the supreme oligarch.
Entropic Man,
Did you say you don’t like companies and billionaires donating to presidential campaigns? Were you okay with the Harris campaign receiving $1.5 billion Vs Trump getting $350million
Ent,
OK, I get it. You hate Trump. Woo oooh. I don’t even give British politics a second thought. Why are you so interested in US politics if we’re a has been country?
Anon for a reason.
Do you not find it obscene that in the “world’s greatest democracy” people spent $1.85 billion trying to buy an election?
Entropic Man,
What I find obscene is the bias of the media. Joe biden was totally incapable of organising anything. Yet the majority of the media still claimed he was perfect.
The money is a problem but as Trump proved it’s not the whole answer as he had a fraction of what the democrats had and still won. You must be aware in the UK that a lot of union members don’t agree with political funding as it is at odds with their own voting preference.
Of course if you prefer a Chinese style of election then say so.
Also, by the way, these tranches of mail in ballots in California are coming in and can you believe they counted over 10,000 the other day and not one, zero, ballot was for the Republican? How is that even possible? Not one.
No, I dont believe it. Where is this data from?
Trumps been telling his base for months that mail in ballots are terrible and should not to be trusted
No one should then be surprised that his base listened to him, and few voted by mail.
Nor should anyone be surprised that when the majority of mail-in ballots indeed were for Democrats, that Trump would declare there must have been cheating!
And no one should be surprised that his supporters are fooled by this.
We heard exactly the same allegations during the 2020 election and those were debunked in court. So I looked it up.
Yep, a lag in updates to a news service for a candidate is the culprit.
“In fact, the update that showed zero Pratt votes was followed one minute later by another update that showed tens of thousands of votes for Pratt, and none for Bass or Raman.”
https://www.latimes.com/politics/story/2026-06-05/how-simple-mix-up-fueled-false-conspiracies-about-la-vote-count
Oh, it was debunked by Pravda. OK.
Barry,
So, does Australia allow the counting of ballots that come in after election day?
So, this fact checking and debunking is more leftist propaganda. For instance, if you look up Germany’s mail in ballots, first you have to request a mail in ballot. You either have to do so with a form or in writing. You also have to have a polling card. This essentially verifies that you are who you say you are and is like the old absentee ballot system. This is not mass mailing of ballots. The only reason to mass mail ballots is to allow cheating. Nate and Barry are a couple of lying propagandists.
In the UK registered voters must submit an application to the electoral registration officer. There are time and document requirements for the application. There must be a reason the person cannot show up to the polls on election day. So again, this is like our absentee ballot system. This is not what is happening in California. This is a mass mailing of ballots. What states allow mass mailing of ballots in all elections? California, Washington, Oregon, Nevada, Utah, and Colorado.
Stephen, if you dont like having your conspiratorial narratives fact-checked, maybe do it yourself before posting them here.
We will see, Nate. Why don’t you do mail in ballots in Pennsylvania?
Postal voting is commonplace worldwide, it is common to have many of them counted after election day, especially in places with high population density, and it is also normal in many countries to receive them after election day as long as they were posted by election day.
https://en.wikipedia.org/wiki/Postal_voting
Trump’s incessant and always debunked claims of election corruption appears to have misled his followers into thinking that postal votes are an aberration and a regular gateway to election fraud.
They are common practise all over the US, even in red states, and worldwide, in order to give everyone the best opportunity to participate in their respective democracies.
Yes, stephen, Australia has postal voting for people who aren’t able to vote in person on the day, and postal ballots can be counted days and even weeks after the election, in order to ensure everyone’s voice is heard.
stephen says: “Why don’t you do mail in ballots in Pennsylvania?”
facepalm
“If you’re a registered Pennsylvania voter, you may apply to vote by mail.”
https://www.pa.gov/services/vote/apply-for-a-mail-in-or-absentee-ballot
stephen, what are the procedures and safeguards in place for mail ballots in California? I’m not American, I believe you are, so you’d know more than I do, and no doubt you’ve taken the time to understand how it works. I know they are automatically mailed out. Then what happens?
“What states allow mass mailing of ballots in all elections? California, Washington, Oregon, Nevada, Utah, and Colorado.”
Utah is a red state, and the mass mailout provision was enacted under a Republican legislature. Republicans championed the cause to make voting more accessible for rural areas, military families, and to encourage people to vote.
Or they did it, according to the conspiracy theorists, to rig elections.
Do you realize that both Democrats and Republicans have won election in regions with mailout ballots?
I did a quick google and found that wherever mass mailout ballots have been adopted, there was no sudden shift in election results. Studies show that the only thing that noticeably changed was a modestly higher turnout for elections.
There’s a lot of smoke from MAGA in this issue. Let’s see the actual fires. Let’s see substantive evidence for impropriety rising above the noise about it.
Barry,
Stop deflecting. I never said there was no postal voting. There is no mass mailing of ballots and then counting those mass mailed ballots for days after election day except for California, Washington, Oregon, Utah and Colorado. Certainly not in Australia, UK or Germany. Stop your lying propaganda. You are just one lying machine.
Barry,
You don’t have the benefit of the US in your actions. You Australian leftists have Australia virtually destroyed and so you’re spending time on us. You don’t care if Australia and the US burn down into a pile of rubble as long as you leftists are standing on top declaring yourselves “Kings of the Pile.”
Barry,
So, Utah is changing their law so that mail ballots have to be requested. No more mass mailing. Also, it doesn’t matter that Utah is a red state. I disagree with their mass mailing. It is ripe for fraud.
Australia isn’t ‘destroyed’, you eejit. On scores of measures we have it as good or better than the US.
Australia is consistently ranked more free, more free and balanced journalism, better longevity (6 years more life than Americans), overall health, education (HDI). We rarely have mass shootings, no one shoots up schools, we have one of the highest median health per capita in the world.
The US has slightly better free speech protections, but Joe Aussie can trash the government without fear, as we do al the time.
Our towns and cities are sanitary, we don’t have as large a wealth gap as the US, and no one goes bankrupt from health care. We have mandatory voting, which you may think is ‘unfree’, but guarantees the populace not only participates in elections, but is also better informed. We see it as a civic duty, and it’s one of the reasons we rank higher than the US on the democracy scale.
The US has a higher GDP per capita than Australia, the most powerful military in the world and is a powerhouse in cutting edge technology and venture capital.
Our constitutions champion different ideals. The US constitution champions individual rights and separation of powers. The Australian constitution champions stable democracy and the rule of law largely set by the legislature. The framers trusted parliament to address the rights and protection of the people rather than unelected judges, or the committee that wrote the constitution. Rather than frame the values of the nation in a near immutable document, that task is given to the people through elected representatives.
Neither is better than the other. They each have strengths and weaknesses. I’ve always thought the American constitution is excellent.
“I never said there was no postal voting.”
Oh yes?
“Why don’t you do mail in ballots in Pennsylvania?”
You didn’t know Pennsylvania has mail in ballots. You have no idea what Australia is like.
Utah is a red state with universal mailout of ballots. Explain the conspiracy to rig the election here.
And while you’re at it, are you going to explain what safeguards are in place for mail ballots in California, or would finding out give you a tic?
Stop being a partisan and learn some stuff. Any fool can shout what they heard in their echo chamber.
Barry,
Yes, the Australian Constitution champions government not the individual. It trumpets democracy, which is nothing but mob rule, the whims of the day. The Parliament bestows people’s rights. You as an Australian citizen only have the rights that the current legislature decides. The US Constitution reinforces man’s natural unalienable rights through its Bill of Rights. It protects us from Government. There’s nothing natural about equality of outcome and it doesn’t work long-term as an economic system. Australia survives off of America’s capitalism. For instance, your healthcare system survives mostly off of our medical research, not yours. Same way with the rest of the world. But you want us to be like you. Why? Doesn’t make sense. There would be no one to develop medicine or protect the world from the bad guys.
https://cha.house.gov/the-elections-clause-states-primary-constitutional-authority-over-elections
“Republicans believe that every eligible voter who wants to vote must be able to do so, and all lawful votes must be counted according to state law. Through an examination of history, precedent, the Framers’ words, debates concerning ratification, the Supreme Court, and the Constitution itself, this document explains the constitutional division of power envisioned by the Framers between the States and the federal government with respect to election administration. Article 1, Section 4 of the Constitution explains that the States have the primary authority over election administration, the “times, places, and manner of holding elections”. Conversely, the Constitution grants the Congress a purely secondary role to alter or create election laws only in the extreme cases of invasion, legislative neglect, or obstinate refusal to pass election laws. As do other aspects of our federal system, this division of sovereignty continues to serve to protect one of Americans’ most precious freedoms, the right to vote.”
Concur.
Still can’t work out how to use a search function and check how California’s mail ballot works, stephen?
This was your complaint, it took a second to debunk, and you’ve changed the subject ever since. To topics you are even more ignorant about.
When grown-ups get something wrong, they say so.
I know exactly how California’s mail ballots work you blithering leftist. Why don’t you explain to me California’s Motor Voter registration process? Or how ballots are automatically mailed to “registered” voters? Or how mailed ballots have to be “dated?” Or how long they are counted? Or who Brenda Lee Brown Armstrong is?
“I know exactly how California’s mail ballots work”
Well, that’s great. Then you know the system of checks includes barcode ID, signature verification and random recounts to check the system is working.
You may or may not know that there have been many challenges to the system in court, and that there has been 100% consistent rulings that the challenges either lack evidence, or that they are simply wrong on investigation.
A lot of complaints, no fire.
Just like the 2020 federal election, where courts with judges of all political stripes unanimously found no evidence of widespread fraud.
All very familiar – cry foul and to hell with the facts. You’ve just exemplified that in this discussion.
Trump-appointed DoJ prosecutor checking California election for fraud
“There was a claim circulating on social media about an election night ballot update at the Los Angeles Registrar of Voters where one candidate received zero votes. We reviewed official county records. The claim is false. Each candidate received votes in every update.”
https://x.com/USAttyEssayli/status/2063108426461270199?s=20
Tell me about the checks and balances. How do you register in California? Tell me about the checks and balances on mailed out ballots? (There are no checks and balances by the way, but you go ahead.) Do you think Brenda Lee Brown Armstrong was a lone wolf?
Barry,
Are there large criminal organizations committing crimes in the US? Are they doing it every day? Do you have any evidence that they’re doing it?
Glad you ask:
https://www.ft.com/content/744ea8dc-6d93-4fe9-a5e3-36de4f5d06db
Want more?
One thing Barry is doing is pointing out a significant weakness in our form of decentralized government. It is a weakness in our Republic and ripe for exploitation by the corrupt. One or more states like California don’t have to follow the rules and there is nothing any of the other states can do about it. If one party completely takes over a state or a city like Chicago or New York, then the Federal Government can do nothing. Our system relies on the integrity of all the members. It is very similar to the game of golf. Do you improve your lie when no one is looking? If one party’s mantra is “By Any Means Necessary”, then their agenda is more important than the integrity of the system or the principles we were founded on. The Democrat Party is a party with no principles or one principle and that is the advancement of their utopian agenda.
Bill Essayli, the US Attorney in Los Angelese, who investigated and charged Brenda Lee Brown Armstrong, says that there are multiple other investigations similar to the Armstrong case being investigated and believes there will be other convictions. Is this the “no evidence” you were talking about, Nate?
You might also like:
https://www.bbc.com/news/articles/cge0grppe3po
Glad this fraudster was caught.
If this becomes a widespread problem then, maybe California will change its voting procedures.
As you agreed, that is up to the States.
If the Federal Govt tries to take over management of elections, or use ICE to ‘oversee’ voting, or to try to have the Post Office manage who gets a mail-in ballot, you should know that all of these are Unconstitutional.
Brenda Lee Brown Armstrong committed registration fraud. I looked the case up. She wanted money. There was no politics involved. No ballots were sent to be counted. No election rigging.
As you are familiar with California’s ballot safeguards, stephen, you would know that had Armstrong tried to actually send fraudulent ballots they would have passed the barcode check and failed the signature check.
Thanks for confirming that Bill Essayli is, as I said, investigating election fraud in California. A thoroughly good idea for every state in the union! There are always bad actors. Is there widespread fraud? According to a multitude of state and federal audits and reports, these remain exceedingly rare for a country with hundreds of thousands of head to head elections every 4 years (municipal, sherriff, mayoral, congressional etc).
“One or more states like California don’t have to follow the rules and there is nothing any of the other states can do about it. If one party completely takes over a state or a city like Chicago or New York, then the Federal Government can do nothing. Our system relies on the integrity of all the members.”
Utah Republicans are corrupt, too? Inconceivable!
All the states with universal mailout have striven to make the system foolproof. Those states have mandatory, independent audits of their electoral system every election cycle, and implement the recommendations if feasible. Hardly the behaviour of people trying to rig the system.
I thoroughly agree with you that election fraud should be wiped out. I think you should have a federal election commission, operating completely independent of party, like the reserve bank, managing federal elections at least, and possibly congressional and gubernatorial.
Unfortunately, we have this in Australia, and you don’t want to be like us. A pity, as we’ve never detected election fraud with our system, and our elections are widely held by international observers to be one of the most secure in the world. No party controls any state or federal election in Australia. It is inconceivable to us in the 21st century that any party should run a major election.
So I guess you’re stuck with a hodgepodge of electoral systems, most administered by party Republicans or Democrats, all over the greatest country in the world.
Bill Essayli, bulldog for electoral integrity, advises you were wrong about the vote spike that started this conversation.
Will you continue to spread that rumour anyway, or have you taken that correction on board?
DOJ is requesting California to turn over their voter rolls to be audited. The Federal Government has a right to do that. California is fighting the request. Why? California allows ballot harvesting. That is why these huge bundles of votes are arriving. There is no voter ID in California. When you register to vote it says only eligible voters (US Citizens) are allowed to register. How does it prevent ineligible voters from registering? It doesn’t. It is based on honor. Anyone can get an ID in California. Anyone can vote. Anyone can harvest votes. They system is fraudulent, intentionally under the auspices of increasing voter turnout. It is designed to favor the Democrat Party. However, it will end up causing California’s destruction.
Speaking of the DOJ:
https://ag.ny.gov/sites/default/files/tto_release_properties_addendum_-_final.pdf
Barry has a copy of “Rules for Radicals” beside his bed. He is a good commie propagandist; deny, deny, deny, obfuscate. Barry is about advancing his utopian vision. Barry will get a nice Dacha in the country while the rest of us are in cramped one-room apartments in the city.
Barry says Brenda Lee Brown Armstrong, also known as “Anika,” wanted money. Yes, she was a paid collector of registered voters. I wonder how many people she got to register? Isn’t “Anika” a nice name for a comrade. What is your “comrade” name, Barry? Or is “Barry” your “comrade” name? What is your real name, “Barry”?
“DOJ is requesting California to turn over their voter rolls to be audited. The Federal Government has a right to do that.”
Again, Stephen, according to the Constitution, the States manage their elections. Which means registering voters, keeping the lists. The Feds have no role in that.
The DOJ going on fishing expeditions, exclusively in Blue States, is a politicized, weaponized DOJ.
It is a Dept of Injustice.
Is it gonna take a Democratic President, going after Red State elections, for you to figure out why this is a problem?
Californian Victor Davis Hanson explains exactly what is happening in California:
https://www.youtube.com/watch?v=qzHVOcyZ0Qk&t=659s
The Claremont Institute is indeed “Californian”:
https://en.wikipedia.org/wiki/Claremont_Institute
Hanson is a Claremont Institute fellow.
Mike Johnson on the California election being rigged.
“Some of these efforts are so diabolical and so far upstream that it’s impossible to prove, but I think everybody knows instinctively, something is wrong here, and that’s a concern.”
The Kool-aid is so strong that he doesn’t realise what he said there. How many people are this dumb in the halls of congress?
Williard,
Maybe you should pay a little closer attention to your fact checking. He’s a Hoover Fellow.
Looks like for our Troglodyte fact checking is reciting AI slop:
https://www.encyclopedia.com/arts/educational-magazines/hanson-victor-davis-1953
Speaking of Hoover:
https://lostnotstolen.org/
More from Victor Davis Hanson about California’s doom loop. He also mentions the UK, but I think it also applies for Australia.
https://www.youtube.com/watch?v=5L1X3xvijYI
More fraud from Donald:
https://theweek.com/politics/trumps-conflicts-of-interest
For some reasons Tom doesn’t seem to mind Troglodyte…
“Californian Victor Davis Hanson”
And how many Californians see it differently?
BACK AT THE RANCH
The Alabama Legislature had just passed a bill to strip Black Alabamians of a second congressional district — not one where they are in the majority, mind you, but one where they are merely politically within reach of the winning side.
Alabama House Speaker Nathaniel Ledbetter was bullish on the prospect — if only the courts would side with them — and said so in a press conference at the close of the special session.
“It gives us a chance to look at all of them, if we get some reprieve from the courts, so we’ll see how that goes and certainly hope that the Supreme Court will overturn Amendment 14,” he said.
https://link.al.com/public/45636598
Watch this fool walk that back. Oh no, he meant the other Amendment 14.
Almost certainly he’s not alone in his rejection of the constitution and his duty to it. You only say stuff that dumb when it’s supported by the people around you.
“I solemnly swear that I will support the Constitution of the United States, and the Constitution of the State of Alabama, so long as I continue a citizen thereof; and that I will faithfully and honestly discharge the duties of the office upon which I am about to enter, to the best of my ability. So help me God.”
On review, he didn’t mean what he said. He said it twice, too. He was just very inarticulate.
“The Version 6.1 global area-averaged linear temperature trend (January 1979 through May 2026) remains at +0.16 deg/ C/decade (+0.22 C/decade over land, +0.13 C/decade over oceans).”
And the global figure is?
??
You just quoted it.
How long does this difference exist? Forever?
You’re welcome.
How long does this difference exist?
As above, AI has made it extremely easy to synthesize answers to well formed questions if getting an answer is the objective:
https://gemini.google.com/share/01c93dfb392f
AI is a method of pattern matching. Anything more is speculation.
Answering yes and no is AI at its best.
The AI response was not ‘yes and no’. It explained the difference (adding detail I wasn’t aware of), and affirmed it would continue without ceasing while the planet warms.
For the new information I checked the literature. The hydrological cycle and the lapse rate response over land v oceans do indeed seem to be the primary cause of the land/ocean difference.
https://journals.ametsoc.org/view/journals/clim/26/12/jcli-d-12-00262.1.xml
https://www.mdpi.com/2073-4433/14/3/560
https://www.nature.com/articles/s41612-021-00206-6
Note: though the 3rd link is relating the difference to CO2 warming, the phenomenon arises under warming/cooling no matter what the cause. The difference remains even with short term warming/cooling, such as ENSO events.
“The land-ocean warming contrast is not a temporary glitch; it will exist for as long as global warming continues” Yes.
“The land-ocean warming contrast is not a temporary glitch; it will exist for as long as global warming continues, and will persist even after greenhouse gas concentrations stabilize.” Yes.
“The land will always warm faster than the ocean.” Yes.
https://oz4caster.wordpress.com/wp-content/uploads/2026/06/d4-gfs-gta-daily-2014-2026-06-10.gif No. The protected line is trending downwards towards the last 10 years.
“Answering yes and no is AI at its best.”
You just confirmed that it didn’t answer ‘no’.
Then you posted a link to something different so you could say ‘no’.
You are the epitome of a contrarian. Coherence doesn’t matter, as long as you can be contrary. It’s as predictable as it is boring.
Your link is broken by the way. Don’t bother reposting. You can be contrarian on your own.
The data says no.
And still do ALL the ignorant pseudoskeptics dodge around two evidences:
1. First evidence
NO ONE – except the public relation ‘dis’informers at NOAA – does tell that ‘Backradiation warms the surface’.
That sounds exactly like
” CO2 traps heat. ”
which is shher unscientific nonsense
or
” A positive anomaly means the observed temperature was warmer than the baseline, while a negative anomaly means the observed temperature was cooler than the baseline. ”
which hardly could be a more stupid explanation of how UAH and the rest of the world compute anomalies.
*
2. Second evidence
When you compute the energy reaching the surface AT ANY POINT ON EARTH over a full year, the 1361 W/m² coming from the Sun above the atmosphere ALL TIME 365/6 days per year and 24 hours per day have NOTHING in common with what IS MEASURED at the point – due to DAY VERSUS NIGHT and SUMMER VERSUS WINTER – regardless where that point is on Earth, from the North Pole down to the South Pole.
*
If all these pseudo-skeptics were able to download and analyze the surface radiation data collected worldwide by pyranometers, pyrheliometers, and pyrgeometers, they would quickly realize that while solar radiation is effective for only half the year, infrared radiation is present continuously.
*
Take all seven US SURFRAD stations or ten stations affiliated to the Baseline Surface Radiation Network (BSRN), in latitudes from North to South, download their data in different years, and you see, for all of them – hence on their average – that while
– the yearly number of hours with downwelling solar radiation is half that of the number of hours in the year, and consequently the yearly incoming solar energy is half as well,
– the upwelling and downwelling longwave radiation is, while of course modulated according to the solar radiation, day and night, and all the year long, present.
For ten BSRN stations, average radiant flux density of
– downward solar during active hours only (48.5%): 355 W/m²
– downward solar during all 8760 resp. 8784 hours: 180 W/m²
– downwar longwave during all 8760 resp. 8784 hours: 280 W/m²
*
The very best is that while pseudoskeptics do discredit and denigrate all measuring devices and measurement evaluation techniques associated to climate research, not any of them would ask, for example:
” Which industrial applications of pyranometers resp. pyrgeometers do exist? ”
In France for example, pyrgeometers are used – among several other contexts – even for the early detection of radiation frost on vines in high-value cultivation areas producing top-tier Burgundies, Bordeaux and Champagnes.
*
Reminder:
– monthly absolute averages of downwelling solar, upwelling and downwelling infrared for all SURFRAD stations in the US:
https://drive.google.com/file/d/1jATtF_nsFH91UVKLQbxs4yldxYIc4wsd/view
*
three BSRN stations (Arctic, Equator, Antarctic)
https://drive.google.com/file/d/103bWbIPX7MwZwC42hfr15mcsO5Bu6c6h/view
Bindi Goebells,
Yet again you are promoting the cults falsehoods. When will you ever learn?
The earth doesn’t receive 1361 w/m2 every second of the year unless you believe that the earth orbit is circular. A step up from you believing that the earth is flat, which would be on par with your out dated scientific knowledge.
As an engineer you might even understand that the earth albedo also varies at different places and at different times of the year.
Just the changes in energy received and changes in albedo would create a chaotic system with pseudo trends. You might know how a gas will spread through an oven in your ideal world but we are talking about the real world where people are going to get hurt from your cults evil propaganda.
Bindi can’t make a point. He just slings crap against the wall, hoping something will stick.
He rambles aimlessly about pyranometers, pyrheliometers, and pyrgeometers, infrared radiation, Burgundies, Bordeaux and Champagnes, and SURFRAD, not understanding any of it.
Kids these days….
The stalker QAnon proves once again that he is not only a vile insulter but also a fool who fails to notice that others are perfectly well aware that the 1361 W/m² figure represents an average value, and that solar irradiance fluctuates between approximately 1,300 and 1,400 W/m² due to Earth’s orbit and solar cycles.
*
And since he apparenly lacks a mouth and, as we can all see, can effectively only speak out of his ass, whatever serves as his brain can’t be too far from that filthy location, as evidenced by the sheer stupidity of his post.
*
If he had a bit more brainpower, he would have grasped that the so-called ‘bogus’ 240 W/m² figure – along with all SURFRAD and BSRN data – ALL are averages; consequently, his attempt to sound knowledgeable with his superfluous hint on solar power fluctuation over the year was completely wide of the mark.
Bindidon says:
June 11, 2026 at 8:59 AM
The stalker QAnon proves once again that he is not only a vile insulter but also a fool who fails to notice that others are perfectly well aware that the 1361 W/m² figure represents an average value, and that solar irradiance fluctuates between approximately 1,300 and 1,400 W/m² due to Earth’s orbit and solar cycles.
*
And since he apparenly lacks a mouth and, as we can all see, can effectively only speak out of his ass, whatever serves as his brain can’t be too far from that filthy location, as evidenced by the sheer stupidity of his post.
—————-
Perfect! Now Bindidon can show he isn’t a fawning sycophant by providing a reference to the model that came up with that average that includes what the average was for say 2024. With calculations for all the variations he mentioned above.
Bindi Goebbel,
Your understanding of orbital mechanics is non existent, if it wasn’t then you wouldn’t be pushing your evil authoritarian socialist cult views on to the rest of us. At least you have stopped referring to orbital mechanics as astrology.
Earth will soon be at it’s furthest point from the sun by a few million kilometres. Yet we we will be experiencing the warmest part of the year in the northern hemisphere due to the earth’s tilt a thousand kilometres closer. There is no simple equation that defines the energy input, only crass over simplifications. Yet the cult believes it’s all averaged out!
But evil authoritarian socialists like Bindy expect everyone to believe that a slight increase in CO2 will cause a great calamity. They forget that a different offshoot of Marxism is the CCP who consume 70% of the annual coal production and yet Bindy, Dullard and Entropic Man don’t say a word about the CO2 being burnt.
Marxist coal burning is good,
non-marxist vocal burning bad
Sums up the whole CO2 cult as evil.
” Perfect! Now Bindidon can show he isn’t a fawning sycophant by providing a reference to the model that came up with that average that includes what the average was for say 2024. With calculations for all the variations he mentioned above. ”
*
Yeah…
The Hunter boy is once more writing such incomprehensible gibberish that you’d think he’d downed at least three glasses of bad whiskey beforehand.
But… at least he doesn’t insult like love to do some Fascists on this blog.
*
Instead of asking me, he rather should read for example
(1) a general publication about the matter
Total Solar Irradiance CDR
Odele Coddington (UCol) & al. (continuous)
https://www.ncei.noaa.gov/products/climate-data-records/total-solar-irradiance
and
(2) a no less interesting while local and very specific one
A sub-hourly spatio-temporal statistical model for solar irradiance in Ireland using open-source data
Maeve Upton & al. (2025)
https://arxiv.org/html/2509.21041v1
Bindi Goebbels,
You really dont understand your politics do you. Fascism evolved from Marxism and then Nazism evolved from fascism. Exactly what education have you had? Just look at the earlier personal history of those leaders and what they wrote.
Anyway, your first link as usual proves you don’t understand what is being discussed. Within the first the first paragraph it clearly states that a correction is being made to present the data as 1 au. So not the actual energy being received by earth.
Can you get anything correct?
Anon for Q-related reasons never disappoints:
https://en.wikipedia.org/wiki/Talk:Fascism/FAQ
See especially the point about Mussolini.
Knowledge of what Marx thought of socialists might be required.
Dullard,
Wikipedia is not unbiased. In fact because a lot of activists are unemployed/unemployable usethen they have the time to manipulate Wikipedia. Even the originators have stayed this is a problem.
So don’t quote Wikipedia at me and then expect me to be impressed by the left.
Dear Anon for Q-related reasons,
That FAQ acts as a reminder that you repeat troglodyte tropes refuted a thousand times by myriads of historians.
Your rants are amusing until some take their themes seriously and turn them into this:
https://www.theguardian.com/news/ng-interactive/2026/jun/13/belfast-southampton-riots-racism-why-is-the-uk-burning
I chose the Grauniad FYEO.
Bindidon said:
“and that solar irradiance fluctuates between approximately 1,300 and 1,400 W/m² due to Earth’s orbit and solar cycles.”
Bindidon only offers up uncalibrated estimates of the solar cycle irradiance changes and suggests it covers all the variables he acknowledged.
But he just skipped over his acknowledgement of earth’s orbit cycles without so much as devoting one word to it mirroring the IPCC corrupt practices.
Such an obvious omission and Bindidon expects it to just fly over our heads.
Orbital variations are an additional element of mean annual insolation in addition to changes in solar irradiance. You spend to much time close to the sun in summer you get a sunburn.
Solar irradiance changes are roughly estimated with limited calibrated measurements to be limited to about 2 watts. . .which if you apply the 6x feedback factor suggested in some models would amount to 12 watts of climate change. Which gives you more than 2 degrees of warming alone since the LIA.
Orbital variations have apparently not been responsibly estimated though they could be responsible for up to 15C climate variations considering feedbacks.
Orbital variations are also known to affect earth’s speed during the course of an orbit. We know that the Naval Observatory measures the effect of this exacted by the moon (per the naval observatory).
During the recent warming period 1980 to 2024 the effect of the moon causes changes in earth’s speed through half an orbit that slows progress through perihelion and speeds it up through aphelion by 5 days.
the IPCC is derelict in not modelling this lunar effect and ignoring physics underlying Milankovic’s work and the conclusion that Jupiter and Saturn are primarily responsible, not to speak of the other other jovian planets for the ice ages that come and go at various levels up to 15c.
the timing of these variations also explains the multi-decadal variations seen in the instrument record that climate modelers can’t duplicate with their CO2-based models. Not to speak of explaining the 10 major Holocene warming peaks of up to 3c seen in ice core data.
And Bindidon just lies about it while at the same time ignoring the fact he just acknowledged it. (“Earth’s orbit and solar cycles”)
Obviously Bindidon lacks the receipts he claimed.
From Engineer to CEO: In Memory of Lee Raymond (1938-2026).
Former Exxon CEO Lee Raymond, an executive who led one of the country’s biggest oil and gas corporations for more than a decade, died in Dallas on Saturday June 6, 2026, at the age of 87.
The former oil executive led negotiations to merge Exxon and Mobil in 1999 to form Exxon Mobil Corp., which is now headquartered in Spring, north of Houston. ExxonMobil is the second most valuable oil and gas company globally by market capitalization (surpassed only by Saudi Aramco), and it consistently ranks in the top 15 of all global corporations by revenue. Among Western “supermajor” integrated oil companies, it is the largest by market cap.
A native of Watertown, South Dakota, Mr. Raymond graduated from Watertown High School in 1956. He received a bachelor’s degree in chemical engineering in 1960 from the University of Wisconsin, and a Ph.D. in the same discipline from the University of Minnesota in 1963. He joined Exxon that same year as a production research engineer in Tulsa, Oklahoma. Over the next 16 years, he held positions of increasing responsibility with Exxon Company, U.S.A.; Creole Petroleum Corporation, which was Exxon’s operating affiliate in Venezuela before those facilities were nationalized; the former Exxon International Company, which was responsible for Exxon’s international supply and transportation of petroleum products and crude oil; and Lago Oil & Transport Company, Limited, the Exxon affiliate in Aruba.
He became president of Exxon Nuclear Company, Inc. in 1979, and moved to New York in 1981, when he was named executive vice president of Exxon Enterprises. In 1983, Mr. Raymond was named president and director of Esso Inter-America Inc., with responsibilities for Exxon’s operations in the Caribbean, Central and South America. Mr. Raymond was named a senior vice president and was elected to the board of directors of the corporation in 1984. He became president of the corporation in 1987. In 1993, he became CEO succeeding Lawrence G. Rawl and held this post until 2005.
Arklady,
So there was a report out of how many about. No company will be take a report in isolation without having an alternative view being expressed. Anyway, the IPC has removed the extreme scenarios as they were impossible. So this report you use as proof was based on what? Anything remotely possible?
Anyhow, there were many reports on Joe Bidon on his mental decline, his immoral behaviour towards girls and women, his business dealings etc. yet the left did absolutely nothing. So cherry pick much ?
There have been many reports on Chinese slavery, Chinese sponsorship of hacking and attacking the west’s businesses etc. The reports are credible and numerous yet the left politicians do nothing.
Double standards from the left, yet again!
US supermajor ExxonMobil is studying potential acquisition targets, including Australia’s Woodside Energy, as it eyes options to increase its share of the liquefied natural gas (LNG) markets, Bloomberg reported, citing sources with knowledge of the matter.
Clint R
I would be considered a glutton for punishment to somehow believe you possess enough logical rational thinking to see the flaw in your own statement.
YOU: “An arriving flux MUST be greater than the flux being emitted by a surface to raise the surface’s temperature. Believing a lesser flux can raise temperature is one of the many flaws in the CO2 nonsense.”
From:
https://www.drroyspencer.com/2026/06/uah-v6-1-global-temperature-update-for-may-2026-0-53-deg-c/#comment-1746074
So you can do a quick experiment to provide evidence that your statement is correct.
Concrete has an IR emissivity of 0.94 so it will work well. At room temperature of 70 F the concrete slab will be emitting about 400 watts/m^2. So based on your above statement, if you have a heat lamp that is generating 250 Watts you will agree it can’t produce more than 250 W/m^2 to the concrete? So if the concrete is emitting around 400 W/m^2 a 250 Watt heat lamp could not possibly warm up the concrete. So get a thermometer, a heat lamp and see if the heat lamp can increase the temperature of the concrete. If the concrete increases in temperature it would indicate your thought process and understanding of physics and heat transfer are not correct and maybe would be wise to read up on the actual science before posting again.
Norman, thanks for sharing your incompetence.
You’re confusing “Watts” with “W/m²”. That’s a common amateur mistake. gordon does the same thing.
The heat lamp, even with no focusing reflector, could be emitting close to 10,000 W/m² at its glass surface. So, within a distance of half a meter, or less, it would have no trouble warming the room temperature concrete.
What perversion of reality will you attempt next?
Clint R
It does not matter what the heat lamp is giving off at all! I do not know why you divert to this point.
It would not be emitting 10,000 w/m^2 to the concrete even if you twist it like a goofy pretzel. You real lack logic and reason at a most basic level. The heat lamp will still only put a flux of 250 W/m^2 on the concrete at its most.
Read your own words again and again.
I will post them for you: YOU: “An arriving flux MUST be greater than the flux being emitted by a surface to raise the surface’s temperature. Believing a lesser flux can raise temperature is one of the many flaws in the CO2 nonsense.”
The flux arriving at the concrete is not 10,000 W/m^2. The flux arriving at the concrete could not be more than 250 W/m^2 if the area of the concrete is one square meter. If you make statements that are incorrect on what you mean than that would be on you to correct.
The cult kids have given me a lot to comment on. But tonight all I have time for is this attempted perversion from Norman:
“The heat lamp will still only put a flux of 250 W/m^2 on the concrete at its most.”
So, according to Norman, heat lamps wouldn’t even be able to melt ice cubes! The food industry will be surprised to hear that….
(More this weekend.)
Norman is supporting the Easter Bunny GPE. The GPE has been completely debunked by textbooks, experts, and experiments. Check out last months UAH update to read all about it. . .again. We are still waiting for Norman and his ilk to bring a single one of those forward in explicit endorsement of the Bunny’s GPE.
Gill still pretends his pet gurus disagree with Eli:
https://www.drroyspencer.com/2026/02/uah-v6-1-global-temperature-update-for-january-2026-0-35-deg-c/#comment-1740662
Starting to feel a little sad for Gill.
See what I mean?
Willard spews out a nonsense response completely lacking support of any textbooks, experts, or experiments.
Bill Hunter
Wrong on all counts. You are just a contrarian crackpot who haunts the blog with ignorant science. What textbook material refutes the GPE?? Both Roy Spencer and E Swanson have done experiments to verify the effect. No amount of evidence will convince crackpots!
Clint R
Then you are saying a 250 watt heat bulb will emit more than 250 watts of power?? Not sure what you are saying here.
No, that is NOT what I’m saying child Norman.
If you would start paying attention to EXACTLY what I’m saying, you might eventually learn some science. But, you can’t. You’re too addicted to your cult.
You make up crap. You make up what you want me to say, then you make up that people have done experiments to “verify the effect”. What effect? If you can’t define/describe the effect, then it does not exist.
Gill keeps asking for sammiches he already got:
https://www.drroyspencer.com/2013/05/a-simple-experiment-to-show-how-cool-objects-can-keep-warm-objects-warmer-still/
Gill will keep denying he got any sammich.
Almost sad.
Norman claims the Roy Spencer and Swanson experiments establish the GPE but neither come even close to doing so. Instead both do a better job of supporting the MIT textbook process of establishing insulation in a GPE like experiment which rejects the anonymous source, non-experiment, ruminations they want to rely upon.
And of course Willard just keeps on lying about sammiches. There is nothing wrong whatsoever of questioning the legitimacy of an anonymous source and there are no legitimate facts supporting that source.
Gill continues to pretend he has not been served that specific sammich he now requests again:
https://www.drroyspencer.com/2026/04/uah-v6-1-global-temperature-update-for-march-2026-0-38-deg-c/#comment-1744494
Funny, but sad.
Wow Willard the MIT textbook has 307 discussions about plates. Bet you can’t point to a single page/paragraph that endorses or demonstrates how to calculate the Bunny rabbit’s GPE. . .and thats the point isn’t it. . .you said it was about the math and now you can’t deliver anything in support of the bunny rabbit GPE. However you can find calculations in that textbook that delivers the meager results due to emissivities less than 1.0 as seen in experiments including Roy’s, Vaughn Pratt’s, R.w. Woods, S&O and many others.
Gill keeps denying having received the sammich he’s requesting once again:
https://www.drroyspencer.com/2026/06/uah-v6-1-global-temperature-update-for-may-2026-0-53-deg-c/#comment-1746359
A little less funny, a little sadder.
And still Willard is all spew and no evidence.
I doubt if even MIT, as perverted as they’ve become, would endorse the bunny rabbit’s nonsense. But, it they did, I’d love to see it.
I can see the headlines now, “MIT proves 2LoT is invalid!”
[GILL] The GPE has been completely debunked by textbooks, experts, and experiments.
[ALSO GILL] And still Willard is all spew and no evidence.
Sad, truly.
Bill Hunter
So where does MIT heat transfer documents support your crackpot contrarian points? I see quite the opposite!
Here:
https://web.mit.edu/16.unified/www/FALL/thermodynamics/notes/node137.html
“For body 1, we know that $ E_b$ is the emissive power of a black body, so the energy leaving body 1 is $ E_{b1} A_1$ . The energy leaving body 1 and arriving (and being absorbed) at body 2 is $ E_{b1} A_1 F_{1-2}$ . The energy leaving body 2 and being absorbed at body 1 is $ E_{b2} A_2 F_{2-1}$ . The net energy interchange from body 1 to body 2 is
$\displaystyle E_{b1} A_1 F_{1-2} – E_{b2} A_2 F_{2-1} = \dot{Q}_{1-2}.$”
In the GPE both plates are theoretical black bodies so that all radiant energy is absorbed. In the MIT document, contrary to the false made up cult science of Clint R and others, the energy given off by the colder object is absorbed by the hotter one. This is established physics. Other views are contrarian and if you want to be believed you would have to provide some experimental evidence to support your view. Otherwise it is crackpot cult material. Bill Hunter, if you think the likes of the phony poster who insults everyone he can and posts misleading made up physics is a valid source of anything scientific, you are certainly an ignorant person.
I would like to see your evidence that MIT supports your crackpot claims? I have seen NONE from any of your alleged skeptics (actual crackpots). The likes of Clint R, DREMT, you, Gordon Robertson. If you make claims post links so posters can see where you get your ideas from.
Just a reminder that the GPE’s debunked:
https://www.drroyspencer.com/2026/02/uah-v6-1-global-temperature-update-for-january-2026-0-35-deg-c/#comment-1733329
Norman, the MIT textbook covers the elements of heat transfer. Without getting too technical for you, Nate claimed the GPE was standard textbook science. We have examined several textbooks and the GPE is absent in all of them.
If you want to change that you can’t do that by relying on a back alley website on the internet run by an anonymous blogmaster pretending to be the Easter Bunny.
In the MIT textbook the only variable in heat transfer between blackbodies is geometry known as view factor. The SB equation for blackbodies tells you that if the view factor is 1.0, the warmer body will continue to transfer “heat” to the cooler body until the two bodies are equal temperature.
I hope that’s not too technical to understand.
Gill keeps waffling:
https://www.drroyspencer.com/2026/04/uah-v6-1-global-temperature-update-for-march-2026-0-38-deg-c/#comment-1741500
Sad.
Already done all that:
https://www.drroyspencer.com/2026/05/pressure-causes-temperature-its-time-to-climb-down-from-mount-stupid/#comment-1745926
The GPE’s debunked.
Bill Hunter
The MIT link states the energy from the cold source is absorbed by the hotter source! I think you are stuck not understanding the difference between a static (no external energy added) and a dynamic one where there is a constant input of external energy. The fact that energy is absorbed from by the hot object from the cold is the correct basis for the GPE.
Norman, there is no such thing as a “black body”. It is used to make calculations easier, but it can NOT be used to violate 2LoT, as you cult kids try.
When your beliefs are built on things that don’t exist, and perversions of reality, you might be a cultist. When all you can do is attack others, you might be a cult kid.
Grow up, and face reality.
“The GPE’s debunked.”
Looks like thst narrative was debunked in that discussion.
Then we also have DREMT stuck in a logical pickle. His narrative contains an obvious contradiction.
https://www.drroyspencer.com/2026/05/pressure-causes-temperature-its-time-to-climb-down-from-mount-stupid/#comment-1745951
His “ongoing delusion that “the GPE is debunked” is based on these two claims that DREMT keeps making:
1. Blackbody plates DO reduce heat loss.
2. The mechanism for (1) violates physics, so it “Doesn’t happen”
His answer: shamelessly repeat the contradictory claims, and declare them not to be a contradiction!
My original comment, that I just linked to, refutes your response to it, Nate. Then you went on and on and on, endlessly repeating yourself, and I refuted you again and again. Now, apparently, you still believe there is a contradiction. Funny.
Your contradiction is simple and obvious and none of your words make it go away.
The only fix available is to acknowledge that only one of the contradicting statements can be true.
And the first one is an observable established fact.
While the second one is a claim unsupported by evidence of heat flow from cold to warm.
Thus, we know that #2 is the one that is false.
Nate says:
”1. Blackbody plates DO reduce heat loss.”
Nate argues that perfect absorption creates insulation. He bought that from the Easter Bunny and didn’t get a receipt. so now he is trying to make the best of it because there is no way to get his money back.
You haven’t even got 2) right, Nate. The “reduction in heat loss” does happen, but it doesn’t result in warming. GP warms to 244 K, same temperature as the BP, so “heat loss from the BP is reduced”. The BP does not warm to 262 K.
So you are content to look very foolish, by continuing to claim
1. X is happening
2. The mechanism for X is not allowed, so it cannot happen.
but then
3. but X still happens.
Round and round you go.
Your theory fails the simplest logical test: self consistency.
Yes Bill. And I have shown you the physics sources 5 times.
Nate, if you can’t follow slightly more complex arguments, you have to accept that it’s only you that looks foolish.
X cannot be both TRUE and NOT TRUE.
If you keep denying that then you are a fool.
So long as X = “blackbody plates reduce heat loss”, then X is true, but cannot lead to warming.
No need for another 30-day back-and-forth.
You clearly stated several times that the mechanism for X violates 2LOT..
For example:
“The way in which ‘heat loss is reduced’ matters. In the GPE, the mechanism is a direct transfer of thermal energy ‘against the flow’. That’s fundamentally different to the way ‘insulation’, or even an ‘insulating effect’, works.
2LoT says ‘no’ to it.”
Thus, logically, you are saying X = ‘blackbody plates reduce heat loss’, cannot happen.
Which is a plainly, obviously a CONTRADICTION.
Will you follow the LOGIC?
It is loudly informing you that your ‘mechanism’ for X must be wrong, and it does not violate 2LOT.
That’s right, Nate, blackbody plates can “reduce heat loss” (see the 244 K…244 K solution) but they cannot result in warming (see the 262 K…220 K solution). The reason they cannot result in warming is the good ol’ 2LoT, as explained in the quotes you clipped. Thank you.
Please do continue to try to manufacture a contradiction for the rest of your life. Most amusing.
Willard,
If you look at Kiddo’s first replies in each thread since that conversation, it becomes pretty clear that he is acting in bad faith. His attempts to bait people are far from subtle, as you say here:
https://www.drroyspencer.com/2026/04/uah-v6-1-global-temperature-update-for-march-2026-0-38-deg-c/#comment-1740670
Eldrosion’s commented in the wrong place, again.
Just a reminder that Sky Dragon cranks have nothing against that:
https://skepticalscience.com/green-plate-dynamics.html
…except everything that has already been explained dozens of times.
“manufacture a contradiction for the rest of your life”
Nothing to do with me. YOUR words create an obvious contradiction, as everyone can see.
Your words fail to explain it away.
Thus you are loudly declaring that logic can be sacrificed to preserve your beliefs.
Thus your credibility is dead.
Everyone can see that there’s no contradiction, so maybe it’s actually your credibility that’s dead?
Graham D. Warner’s credibility is more undead than dead, as he keeps killing it every month.
That makes Betty’ heart pound, so it’s worth it.
If I have no credibility then there is absolutely no requirement for any of you to respond to me ever again. Bliss!
[GRAHAM] Norman is completely unresponsive to every single point I’ve made.
[ALSO GRAHAM] If I have no credibility then there is absolutely no requirement for any of you to respond to me ever again. Bliss!
Astute readers might note that these two comments were made one after the other.
It’s not difficult, Willard. I’d rather you guys didn’t respond to me, but if you’re going to respond anyway, I at least expect you to actually engage with what I’m saying.
No, you want people to respond to you.
People who are capable of conceding points, who can think logically, who don’t resort to pathetic ad hom crusades, and who aren’t ideologically biased, are welcome to respond. Unfortunately, that’s the GHE Defence Team (GHEDT) completely ruled out.
Looks like Graham just admitted all he wants is the last word, Eldrosion.
“Astute readers might note that these two comments were made one after the other.
Yes, Willard. Kiddo was right that my earlier comment was misplaced. Looking back, though, it foreshadowed how the thread would evolve.
He is so transparent that even something I posted by mistake ended up accurately anticipating him.
Meanwhile, Team Science wins:
https://rabett.blogspot.com/2018/08/the-simplest-green-plate-effect.html
One day Sky Dragon cranks will be able to come up with something more serious than “but insulation”.
“If I have no credibility then there is absolutely no requirement for any of you to respond to me ever again. Bliss!”
Which shows trolling is your goal.
“GHE Defence Team (GHEDT)”
Just the standard DREMT meltdown after he loses another argument.
I’ll just wait to see if any of the more serious commenters return.
Indeed, Eldrosion.
Watch Graham D. Warner reply how he’s still waiting.
Nate, the 244 K…244 K solution and the 262 K…220 K solution are two completely different things, with different arrangements of energy flows, etc.
So, when I say that blackbody plates reduce heat loss, like in the 244 K…244 K solution, but do not result in warming, like they (wrongly) do in the 262 K…220 K solution, then there’s absolutely no contradiction, is there?
For there to be a contradiction, the 244 K…244 K and 262 K…220 K solutions would have to be the same thing, with the same arrangement of energy flows, etc. But, they’re not.
Just another way to explain why you’re wrong, and I’m right.
You may continue your meltdown.
[N] Just the standard Graham meltdown after he loses another argument.
[G] I’ll just wait to see if any of the more serious commenters return.
[W] Watch Graham D. Warner reply how he’s still waiting.
[G] Nate, the 244 K…244 K solution …
Just like Eldrosion said
He is now probably going to pretend to be sincere for a while, Willard.
Well, Nate was meant to be the more serious commenter I was waiting for, but his responses (which cross-posted with my “waiting for more serious commenters” remark) were just as immature as the two trolls.
Well, Nate was meant to be the more serious commenter I was waiting for, but his responses (which cross-posted with my “waiting for more serious commenters” remark) were just as immature as the two trolls.
“Nate, the 244 K…244 K solution and the 262 K…220 K solution are two completely different things, with different arrangements of energy flows, etc.”
In both cases back-radiation exists, the SB law applies, Kirchhoff’s Law is valid, and the radiative heat transfer equation applies.
And the ability of blackbody plates to reduce RADIATIVE heat loss comes from those radiative laws.
Then why would the mechanism for the blackbody plates to reduce heat loss be any different for the two cases?
You get no points for simply asserting. You need to EXPLAIN how the mechanism is different, while still satisfying the valid laws of physics.
Nate obviously realises there is no contradiction, so moves on to the next thing: requesting information he already knows full well.
Graham D. Warner repeats his gaslighting.
“pretend to be serious for awhile”
Yep, that didnt last very long.
As expected, he has no serious explanation.
…and they act like I’m the one that baits!
Is Nate seriously going to pretend to be unaware of the difference between the two solutions!? In the 262 K…220 K solution, “heat loss is reduced” by a direct transfer of thermal energy “against the flow”, something he already agreed can’t happen! In the 244 K…244 K solution, because that direct transfer of thermal energy can’t happen, it’s returned to the GP, and that results in “heat loss being reduced” from the BP.
But, all that was already known. Discussed over eight years!
Ah… reverse gaslighting:
“…and they act like I’m the one that baits!”
It’s a neat trick. But, if I were Kiddo, I would have maintained the facade of a sincerity / seriousness for a while longer before pulling the reverse gaslighting card.
It loses its effectiveness when it is deployed right after getting caught being unserious.
Still not serious, because you just keeps repeating the same nonsesnse over and over again, which lacks logic or facts.
Blackbody plates reduce heat loss regardless of the two temperatures of the bodies, and the mechanism does not change just cause you say so. I showed you physics sources, remember?
No credit for completely made up non-physical rules!
The mechanism is explained purely with the radiative heat transfer equation RHTE.
At 244k/244k we find by the RHTE that the heat loss Q = 0.
At 262K/220K we find by the RHTE that the heat loss is Q = 133 W/m2
At 244K/3K with no GP blocking the BP from space, we find that the heat loss is Q = 200 W/m2.
Notice there is no change in the mechanism! It is always just the RHTE.
And notice that with the GP present the heat loss from the BP is reduced, as all agree.
“In the 244 K…244 K solution, because that direct transfer of thermal energy can’t happen, it’s returned to the GP, and that results in “heat loss being reduced” from the BP.”
Utterly fake Clint-Fizux. Does not agree with the RHTE or Kirchhoffs Law.
If the back radiation from the GP is returned to it, then do the math:
The BP emits 200 W/m2, but receives nothing from the GP, then its heat loss is 200 W/m2.
Not at all reduced!
So again you are in a muddle of contradictions.
I’ve established what the mechanism is for both solutions via the points 1) – 7), which you cannot refute.
You went on and on about there being a contradiction. Without conceding that you were wrong, but instead quietly dropping the subject, you’ve now moved on to the next thing. Then, when that’s refuted, without conceding the point but instead quietly dropping the subject, you will move onto something else. All while trolls yap away in the background. It never ends. Yet you people think I want you to keep responding to me!? I really don’t.
“If the back radiation from the GP is returned to it, then do the math: The BP emits 200 W/m2, but receives nothing from the GP, then its heat loss is 200 W/m2. Not at all reduced!”
You’re confusing “heat” and “energy” (EMR), Nate. As the plates are at the same temperature, heat flow between them is at zero.
“So again you are in a muddle of contradictions.”
You’ve pointed out no contradictions that have withstood scrutiny. But, while we’re on the subject of contradictions, you state:
“Blackbody plates reduce heat loss regardless of the two temperatures of the bodies”
but then go on to say:
“The mechanism is explained purely with the radiative heat transfer equation RHTE.”
and your examples make clear that any reduction in heat loss is entirely due to the two temperatures of the bodies! After all, the RHTE relates the temperatures of the two bodies to the amount of heat flow!
Another meltdown.
Surely it must be all of us that cause you to contradict yourself and not make a sensible argument.
It is easier to imagine evil opponents conspiring, then to simply admit youve made errors.
No meltdown here, Nate. You sure do read a lot of things into comments that simply aren’t there.
And, there are no contradictions in my arguments. Let’s see if you can admit to the one I just found in yours!
The GPE’s debunked.
Science deniers say the darndest things:
“You’re confusing “heat” and “energy” (EMR), Nate. As the plates are at the same temperature, heat flow between them is at zero.
Heat is defined as NET energy transfer. In your narrative, with the GP emission returned to it (utter nonsense), the NET energy transfer from BP to GP, is most certainly not 0.
It is 200 W/m2.
You needed it to be 200 W/m2 to satisfy 1LOT, remember?!
This is what happens when you rely on made-up fake physics from the idiot Clint.
You end up in a muddle of contradictions!
You are making a fool of yourself.
“Blackbody plates reduce heat loss regardless of the two temperatures of the bodies”
but then go on to say:
“The mechanism is explained purely with the radiative heat transfer equation RHTE.”
and your examples make clear that any reduction in heat loss is entirely due to the two temperatures of the bodies!”
Where is the inagined contradiction?
The Q value depends on the two temperatures, no question.
But tbe fact of heat loss REDUCTION with blackbody placed in between is still happening.
Compare no GP: 244K/3K, BP heat loss 200 W/m2, to GP present:
262K/220K. BP heat loss 133 W/m2.
A heat loss reduction.
Nate apparently believes repeating his mistakes will cover up the glaring contradiction in his arguments.
Regardless your words, you have not explained your first contradiction.
Then by invoking Clint’s fake physics that violates laws of physics, you create a second contradiction.
Either
1. you use the RHTE, which requires the back radiation to be absorbed by the BP, which gives Q =0 at 244K/244K, which, if equilibrium ‘solution’, fails to satisfy 1LOT.
Or you
2. drop the RHTE and Kirchhoffs Law, to claim the back radiation is returned, which gives Q =200 W/m2, which means heat loss is NOT reduced, a contradiction.
You cannot mix and match to pick the results you want.
This all really exemplifies the tangled web you weave when you practice to deceive.
Graham apparently believes that adding “apparently” changes everything.
Nate, either:
“Blackbody plates reduce heat loss regardless of the two temperatures of the bodies”
Or:
“The mechanism is explained purely with the radiative heat transfer equation RHTE.”
Can’t be both.
Meanwhile, you’re trying to move on to criticising the 244 K…244 K solution. It’s exactly like I said – your argument gets refuted, and without conceding the point, you quietly move on to something else. Your original point about the contradiction was refuted. Can’t you admit that?
Distraction games: Accuse your opponent of your errors.
The RHTE applies in all cases being discussed.
Yes or no?
Blackbody plates reduce heat loss in all cases being discussed.
Yes or no?
Kiddo is cornered.
“Meanwhile, you’re trying to move on to criticising the 244 K…244 K solution. ”
Which you brought up to claim that its heat loss reduction mechanism is ‘different’.
Thus I asked you to explain that. Because, as I said, the mechanism is simply the RHTE, which applies in all cases.
That led YOU to explain the 244/244 is different because it uses Clint’s fake physics, which has all sorts of problems.
We saw it leads you to another contradiction, which you also cannot fix.
These contradictions show that your narrative just falls apart under scrutiny.
When you use fake physics, but try to satisfy real physics, contradictions inevitably arise.
More distraction games from Nate. That’s all you get from him when he’s cornered.
The points 1) – 7) debunk the GPE.
The RHTE isn’t a “mechanism”, Nate.
The mechanism by which “heat loss is reduced” in the 262 K…220 K solution is a direct transfer of thermal energy “against the flow”, which you have already agreed cannot happen. You’d think you would concentrate on that!
Since it cannot happen, the “back-radiation” transfer must be returned to the GP. As the GP warms to the same temperature as the BP, “heat loss is reduced” from the BP. This is, of course, a completely different mechanism to the one in the 262 K…220 K solution because the transfer of thermal energy “against the flow” is not happening!
Whether you accept the 244 K…244 K solution is immaterial. What matters is that your original claim of a contradiction is thoroughly debunked. You don’t have to like my logic, Nate, but you can’t claim it is not internally consistent.
Your entire argument against what I’ve said for eight years has always been based on “blackbody plates reduce heat loss”. I’ve shown that indeed they do, but they don’t lead to warming. So, now you should see why my arguments refute yours.
The GPE’s debunked.
“The RHTE isn’t a “mechanism”, Nate.”
The mechanism for reduction of radiative heat transfer is, obviously, governed by the RHTE.
We use it at 244/244, and at 262/220 to find the heat flow.
The physicists who derive the heat transfer for multple plates use it, in the sources I showed you.
There is no other mechanism at work.
“The mechanism by which “heat loss is reduced” in the 262 K…220 K solution is a direct transfer of thermal energy “against the flow”, which you have already agreed cannot happen. You’d think you would concentrate on that!”
Your feelings on this, no matter how often repeated, are not facts.
Again, ‘against the flow’ of what? Heat obviously. Thus heat is always flowing downstream as it should.
You offer zero evidence that the mechanism for ‘heat loss reduction’ is somehow different at different temperatures.
Use of the RHTE by you to calculate the heat flow = 0 at 244/244 means you are using the very FACT that the emissions from each plate are absorbed by the other and thus fully CANCEL, giving a NET energy (heat) transfer =0.
There is no other way to get 0!
So like it or not, the back radiation from the GP is transferred to the BP, even at 244/244!
So the very same mechanism is producing heat loss reduction in 244/244 or 262/220.
I’m tired of you saying it’s “my feeling”.
The points 1) – 5) logically demonstrate that in your 262 K…220 K solution, the “back-radiation” transfer builds up internal energy in the warmer BP at the expense of the cooler GP. “Feelings” don’t enter into it. As you can’t refute that chain of logic, you should concede the point. But, you never have! So, we get nowhere. Then, if I say “concede to proceed” that’s taken as being some sort of “bullying” or underhanded “tactic”!
So, now you change “the RHTE is the mechanism” to “the mechanism is governed by the RHTE” – then what exactly are you claiming is the actual physical mechanism itself, that the RHTE governs!? You won’t say. You keep it as vague as possible.
Obviously you are doing that because you know I’m right – the mechanism itself is the transfer of thermal energy from cooler to warmer which only happens in your 262 K…220 K solution.
The GPE’s debunked.
“I’m tired of you saying it’s “my feeling”.”
Well. If you say things that have no evidence, now matter how many times you say it, it does not become a fact.
To become a fact, requires both evidence, and no contradictory facts.
“The mechanism by which “heat loss is reduced” in the 262 K…220 K solution is a direct transfer of thermal energy “against the flow”, which you have already agreed cannot happen.”
Youve shown no evidence of net energy (heat) flowing from a cold body to a warm body. Thus no evidence of a 2LOT violation.
Yet you keep saying that it is so.
This demonstrates that your claims are just your personal feelings, not facts.
The SB law requires that all high emissivity surfaces emit according to their temperature.
This happens for the GP whether it is 244 K or 220 K.
Kirchhoffs Law states that high emissivity surfaces absorb nearly all radiation they receive.
This happens for the BP whether it is at 244 K or 262 K, with NO dependence on the T of the emitting GP.
So when you say there “a direct transfer of thermal energy “against the flow”, this nothing more that the normal SB law emission from GP and its absorption by the BP, which is neither heat nor NET energy.
And it happens at 244K-244K! There is no evidence of any different ‘mechanism’ at work.
Again, your feelings are not facts.
And this is consistent with the fact that at 244/244, the heat transfer Q= 0, as given by the RHTE.
Your claims that the BP does not absorb the GP emissions at certain T are not factual, and are inconsistent with the observable facts and the RHTE.
These are just your personal feelings, no matter how often you repeat them.
Because you do not get to makeup your own kaws of physics, nor tell us that ordinary laws dont apply whenever you feel like they dont
You cannot refute the points 1) – 5). No matter what you say, and no matter how many times you say it. You don’t try to address it, even! It’s utterly pointless talking to you.
The GPE’s debunked.
8:53 am: the conclusion from DREMT’s points 1)-7) was addressed and refuted by the 2LOT eqn. months ago. DREMT’s GPE solution has nothing new since then thus remains debunked & imaginary even according to DREMT.
Eli’s original GPE solution remains physically & real world correct since it complies with 2LOT eqn.
Just repeating your claims is not debate.
Wheres the beef?
Where is the evidence that heat flows from cold to warm?
None offered? Then no 2LOT violation.
Wheres the evidence that heat loss reduction works differently at 244/244 than at 262/220?
Where is the evidence that the RHTE operates differently at 244/244 than at 262/220.
Where is the evidence that a blackbody can become a mirror?
Who made you a god that can alter the laws of physics?
“Youve shown no evidence of net energy (heat) flowing from a cold body to a warm body. Thus no evidence of a 2LOT violation.”
Why on Earth is Nate still talking about “net”? Has he never understood what is being argued!?
The GPE’s debunked.
“Wheres the evidence that heat loss reduction works differently at 244/244 than at 262/220?
Where is the evidence that the RHTE operates differently at 244/244 than at 262/220.”
Both of these questions indicate that you have not understood anything I’ve explained. Geez Louise. Please stop wasting my time.
Could it ever be remotely possible that Gaslighting Graham is gaslighting.
The simplest demonstration of the green plate effect remains unrefuted:
https://rabett.blogspot.com/2018/08/the-simplest-green-plate-effect.html
“Why on Earth is Nate still talking about “net”? Has he never understood what is being argued!?”
Bwa ha ha!
As much as youd like to deny it, HEAT is defined as NET energy transfer between bodies.
In radiative heat transfer between two bodies, you should know very well by now that both bodies emit, according to the SB law, and yet that one-way emission is NOT the NET energy transfer betwewn the bodies, and therefore NOT HEAT.
The relevant 2LOT statements are specifically about the flow of HEAT. That it can naturally flow only from a hotter to a colder body.
It is incredible that you still think that 2LOT says anything at all about the one-way energy emission in radiative heat transfers.
When it most certainly does not.
“Both of these questions indicate that you have not understood anything I’ve explained. Geez Louise”
New ways to evade explaining stuff that you cannot factually explain?
In your 262 K…220 K solution, the “back-radiation” transfer builds up internal energy in the warmer BP at the expense of the cooler GP. That’s an established fact. And, that makes it a transfer of heat from cold to hot.
“New ways to evade explaining stuff that you cannot factually explain?“
No. I already explained, perfectly clearly, here:
https://www.drroyspencer.com/2026/06/uah-v6-1-global-temperature-update-for-may-2026-0-53-deg-c/#comment-1746865
All you did, apparently, was read the first sentence. You seemed to ignore the rest, entirely.
Just stop responding to me altogether, if you’re not actually going to listen to what I say. Your questions indicate a total lack of understanding. And, if you don’t believe that’s a genuine remark, then stop responding to me altogether, again. What’s the point of you talking to me if you’re not going to believe anything I tell you?
“your 262 K…220 K solution, the “back-radiation” transfer builds up internal energy in the warmer BP at the expense of the cooler GP. That’s an established fact. And, that makes it a transfer of heat from cold to hot.”
Total bullshit. None of that are established facts.
Sorry you dont get to play God and redefine HEAT however you feel like.
What a loser you are.
Hard to be a loser when I’ve won an eight-year argument, Nate.
To prove you don’t pay attention, I linked to the wrong comment in my last response to you, and you didn’t even notice! It was meant to be this one:
https://www.drroyspencer.com/2026/06/uah-v6-1-global-temperature-update-for-may-2026-0-53-deg-c/#comment-1746847
In both cases you just quoted the first sentence, then ignored the rest entirely!
You can’t debate honestly, and you’re only lying to yourself.
The GPE’s debunked.
DREMT 1:27 pm again mistakes EMR for heat. According to 2LOT eqn. the added EMR from the GP to BP MUST increase the BP temperature as in Eli’s solution. There is no hope for DREMT to be correct.
No, Ball4, I’m not mistaking EMR for heat. It’s because EMR is not heat (and thanks to 2LoT) that the “back-radiation” EMR transfer does not cause the BP to warm. So, it’s actually your 262 K…220 K solution in which EMR is mistaken for heat. And, not by me.
“Hard to be a loser when I’ve won an eight-year argument, Nate.”
Lets poll the readers:
Is it winning, if to make your argument, you need to redefine standard scientific terms, like HEAT?
Is it winning, if to make your argument, you need to magically transform perfect absorbers into perfect reflectors?
Is it winning, if to make your argument, you need to ditch or alter various Laws of Physics, such as Kirchhoffs Law and 2LOT?
Is it winning, when your various claims are in contradiction with each other?
Earlier:
“your 262 K…220 K solution, the “back-radiation” transfer builds up internal energy in the warmer BP at the expense of the cooler GP. That’s an established fact. And, that makes it a transfer of heat from cold to hot.”
Now:
“No, Ball4, I’m not mistaking EMR for heat. It’s because EMR is not heat”
Another self-goal by self-contradiction.
First comment – there are no redefinitions, and no contradictions, Nate. Not from me, anyway.
Second comment – your reading comprehension fails you again.
The GPE’s debunked.
DREMT 1:27 pm obviously mistaking EMR for heat in the GPE: “a transfer of heat from cold to hot.”
Then DREMT tries and fails to back pedal 1:03 am: “I’m not mistaking EMR for heat”
If so, then what DREMT really meant at 1:27 pm: “a transfer of energy by EMR from cold to hot.” which is what is happening in Eli’s 2LOT eqn. consistent vacuum GPE solution showing the BP warming from the increased intensity light (EMR) of the added GP.
There remains no hope for DREMT’s GPE solution to be correct when it violates 2LOT eqn. with no BP temperature increase from the increased intensity light of the added GP.
No, Ball4. In your 262 K…220 K solution, the “back-radiation” EMR transfer is treated as “a transfer of heat from cold to hot.” That’s why I said it. Whereas, in the 244 K…244 K solution, the “back-radiation” transfer is treated as a transfer of energy (EMR). The difference in the plate temperatures speaks for itself.
DREMT,
No one on Team Science is claiming that EMR is heat. If thats what you think, then its a huge strawman.
Team Science has always maintained that HEAT is the NET transfer of energy between two bodies, and always in the GPE flowing from hot sun to warm BP to cool GP to cold space.
Here you are failing to understand that HEAT is NET energy transfer:
“Youve shown no evidence of net energy (heat) flowing from a cold body to a warm body. Thus no evidence of a 2LOT violation.”
‘Why on Earth is Nate still talking about “net”? Has he never understood what is being argued!?'”
.
Only YOU are falsely claiming that EMR back radiation, which is obviously not a NET energy transfer, is HEAT flowing from cold GP to warm BP.
You cannot put that on Team Science.
If, you are trying to say that since the BP warmed and the GP (sometimes) cools, then there MUST have been heat flow from GP to BP!
But this is simply you ignoring all other heat flows in the problem.
Ignoring that the GP is cooling to SPACE. And the BP has its flow of heat to space REDUCED while simultaneously being heated by tbe sun.
These changes in heat flows fully account for the warming of the BP and the cooling of the GP, while stisfying the laws of physics.
But you are playing the fool to claim that
‘there MUST have been heat flow from GP to BP, because there is no alternative explanation’
“Heat” is a transfer of thermal energy from hot to cold. Given that it’s defined as being from hot to cold, working out what a transfer of heat from cold to hot is, is not exactly “obvious”. Especially when it comes to radiative heat transfer. As the “back-radiation” transfer is building up internal energy in the warmer BP at the expense of the cooler GP in your 262 K…220 K solution, we know that this is EMR being wrongly treated as “heat”. Nobody’s saying that anyone on the GHEDT admits that they’re treating EMR as “heat”, but that’s what they’re doing, regardless.
That is simply what their solution entails.
DREMT’s 2:22 pm wording fails to physically describe the original GPE.
Physically, since the EMR transfer in the vacuum builds up internal energy in the warmer BP from the added warmer than space GP in the 262 K…220 K solution, Eli’s solution again complies with both 1LOT and the 2LOT eqn.
DREMT’s equilibrium solution does not increase temperature in the BP with the increased intensity light (EMR) above that of space from the added GP thus again fails the 2LOT eqn. It remains that there is no hope for DREMT to be correct at system equilibrium.
Ball4, once again, concedes the point Nate won’t dare admit.
“As the “back-radiation” transfer is building up internal energy in the warmer BP at the expense of the cooler GP in your 262 K…220 K solution, we know that this is EMR being wrongly treated as “heat”.”
The only one wrongly ‘treating’ it as heat has been you.
Everyone else understands that there is a perfectly sound alternative with normal heat flows.
Wrong, Nate. In the 262 K…220 K solution, the “back-radiation” EMR transfer acts as “heat”. That’s simply what your solution entails. In the 244 K…244 K solution, the “back-radiation” transfer acts as “energy” (EMR). The difference in the final plate temperatures speak for themselves, meaning that because the BP temperature is higher in the 262 K…220 K solution, and the GP temperature lower, you can see that the “back-radiation” transfer has built up internal energy in the BP at the expense of the GP in your solution. Thus, you can see it has acted as a flow of heat from cold to hot. It’s not me treating it as heat, it’s simply what your solution entails.
DREMT 12:57 pm is wrong, physically in the correct 262 K…220 K steady state equilibrium solution, the forward radiation added GP to BP EMR energy transfer acts as “higher intensity light” than that of space warming the BP to a higher equilibrium temperature to satisfy the 2LOT eqn.
DREMT doesn’t yet understand “Experiment Results Show a Cool Object Can Make a Warm Object Warmer Still”
“Wrong, Nate. In the 262 K…220 K solution, the “back-radiation” EMR transfer acts as “heat”. ”
Here you are reverting to what YOU personally feel is happening, ‘EMR transfer acts as “heat”‘, without a shred of evidence.
Whereas just above you declared that only Team Science is ‘treating’ EMR as heat.
Obviously you are still confused as to who is claiming what.
“That’s simply what your solution entails.”
Not at all.
You often claim to ‘understand’ very well how our ‘solution’ works, but here you knowingly misrepresent it.
Team Science claims that the blackbody GP causes heat loss from the BP to be reduced and thus with the steady solar heat input, the BP must warm.
Given that you agree that blackbody plates reduce heat loss from the BP, and obviously you agree that the sun is supplying a steady heat input, there is simply no sound logic to denying that the BP must warm.
“In the 244 K…244 K solution, the “back-radiation” transfer acts as “energy” (EMR).”
EMR emission by blackbody plates is required at 244K, 220K, or 262K according to the SB law.
Absorption of all EMR hitting blackbody plates is required at 244 K, 220K, or 262 K, according to Kirchhoff’s Law.
Your claim that something different happens at 244/244 is unsupported by the laws of physics.
And it disagrees with what the RHTE produces, which is Q = Net Energy Transfer = 0.
So that is a contradiction, and thus it is pure fantasy.
“The difference in the final plate temperatures speak for themselves, meaning that because the BP temperature is higher in the 262 K…220 K solution, and the GP temperature lower, you can see that the “back-radiation” transfer has built up internal energy in the BP at the expense of the GP in your solution.”
Again feelings unsupported by any facts or physics.
You often claim to ‘perfectly understand’ Team Science’s solution. Then you perfectly understand that 262K/220K are valid equilibrium temperatures that satisfy the RHTE and 1LOT.
Lets summarise what happens at 262K/220K:
The sun supplies 400 W/m2 to the BP, which emits 267 W/m2 from both sides to space and to the GP (total 533 W/m2).
The GP emits 133 W/m2 to the BP and to space.
Unlike Bill, I believe you can do the accounting and find that each plate is in energy balance at these equilibrium temperatures.
If you understand this accounting, then you must agree that these are valid equilibrium temperatures.
It makes sense to argue that equilibrium temperatures cannot be reached, nor that there are any other valid equilibrium temperatures.
Correction:
It makes NO sense to argue that equilibrium temperatures cannot be reached, nor that there are any other valid equilibrium temperatures.
“Obviously you are still confused as to who is claiming what.”
Obviously your reading comprehension sucks.
“Your claim that something different happens at 244/244 is unsupported by the laws of physics.”
It’s not that “something different happens at 244/244”. It’s more that the 244 K…244 K solution is fundamentally different to the 262 K…220 K solution. I already linked you to this comment:
https://www.drroyspencer.com/2026/06/uah-v6-1-global-temperature-update-for-may-2026-0-53-deg-c/#comment-1746847
which explains everything perfectly clearly.
I get your argument, Nate, you still don’t get mine. My argument refutes yours.
The GPE’s debunked.
“which explains everything perfectly clearly.”
It perfectly asserts your beliefs, while not showing any evidence.
“I get your argument, Nate”
Great which parts do you get? And which parts do you refute, with what rationale?
“the 244 K…244 K solution is fundamentally different to the 262 K…220 K solution”
Yes it is different because, as I explained, it does not agree with the laws of physics, eg Kirchhoffs Law, and it disagrees with the RHTE result Q=0 that you agree must be correct.
So again this is a fundamental contradiction that you have not fixed.
No, you dont get to ignore the definition of Heat = Net energy transfer.
No, it is not sufficient to declare no contradiction, when there obviously is one.
” My argument refutes yours.”
Again you fail to understand how honest debate works.
Your argument contradicts established laws of physics and contradicts your own statements.
Thus it refutes only itself, if we are going to be honest.
So, skipping over Nate’s arrogant and ignorant posturing, let’s go over something important that he keeps failing to understand. It doesn’t matter if I say “he treats EMR as heat” or “EMR acts as heat” in his 262 K…220 K solution. I mean exactly the same thing either way. I’m simply trying to find a way to get across the idea that in his 262 K…220 K solution, the “back-radiation” EMR transfer is behaving as a transfer of heat from cold to hot, in that it is building up internal energy in the warmer BP at the expense of the cooler GP. And, if he could only accept that, he’d stop worrying about the 244 K…244 K solution altogether!
DREMT is still physically wrong at 11:45 am and has no hope of being correct as already explained.
“…it disagrees with the RHTE result Q=0 that you agree must be correct.“
It doesn’t disagree, because heat flow is indeed zero between plates at the same temperature. That doesn’t mean there can’t be energy (EMR) flow between them. You just need to understand the difference between “heat” and “energy” (EMR).
So, that point is refuted once again.
That means there are no contradictions in my arguments, as the first alleged contradiction (which was supposedly the whole reason for this discussion taking place) was debunked some time ago and has been dropped completely, but with no actual concession from Nate!
And, he tries to lecture me about “honest debate”!
The GPE’s debunked.
“doesn’t disagree, because heat flow is indeed zero between plates at the same temperature. That doesn’t mean there can’t be energy (EMR) flow between them. You just need to understand the difference between “heat” and “energy” (EMR).
Again, sorry, you dont get to randomly redefine Heat as needed to suit your narrative.
Heat is the spontaneous Net Transfer of thermal energy between bodies.
In your bizarre 244/244 narrative you claim there IS a spontaneous Net energy transfer of 200 W/m2 of between the plates at the same temperature.
This was invented to fix your 1LOT problem.
Then you correctly note that the Heat (Net energy) transfer is 0 by the RHTE.
This is you contradicting yourself.
If there is 0 Heat transfer, then by definition, there must be 0 Net Energy transfer.
This proves that your narrative is a house of cards that easily collapses in contradictions.
“That doesn’t mean there can’t be energy (EMR) flow between them. You just need to understand the difference between “heat” and “energy” (EMR).”
Yes it does mean that.
Clearly you still dont understand basic heat transfer.
No, there cannot be a NET spontaneous exchange of energy between bodies at the same temperature.
There has to be a driving force to transport energy from place to place. That is a temperature difference.
If energy can be transported without a T difference then this would save our economies billions in energy costs.
The reason you invented this energy innovation, was to satisfy the 1LOT.
Lets review 1LOT. It connects heat flow from a body with internal energy change in a body and work done by the body.
There is no work involved. That leaves HEAT as the only way for internal energy to increase or decrease in a body.
Only HEAT can do that in our problem.
Sorry, you are not allowed to makeup your own fake physics.
As noted, If there is 0 Heat transfer, then by definition, there must be 0 Net Energy transfer.
But hey, just for a laugh, if you can find real world examples of net energy transfer without heat or work involved, and a physics source that indicates this can happen, then I will stand corrected
But lacking that, it is just another loser’s argument.
I’m not redefining “heat”. “Heat” is a transfer of thermal energy from “hot” to “cold”, as I said:
https://www.drroyspencer.com/2026/06/uah-v6-1-global-temperature-update-for-may-2026-0-53-deg-c/#comment-1746986
Your endless focus on trying to discredit the 244 K…244 K solution is understandable. You’ve got nothing else. However, attacking the 244 K…244 K solution does not save your 262 K…220 K solution, which is debunked by my points 1) – 5), and always will be. If you could only accept that, you wouldn’t even worry about the 244 K…244 K!
The GPE’s debunked.
Your original complaint, which started this whole discussion on this thread, is debunked.
You’re just incapable of conceding any point, ever. A thirty-day back-and-forth was what you intended to have, and so you do what you always do – get to the point where you should concede, then just…don’t concede. Change the subject, instead.
Bemoaning my “focus on 244/244 solution”
I see. So we’re doing the Motte-Bailey routine again.
You keep bringing up your 244/244 ‘solution’.
But clearly you recognize that it cannot survive scrutiny, wit ith its physics-defying, contradictory net energy flows and magical perfect absorbers turning into perfect mirrors, it is truly truly indefensible.
So you return to talking about the 262/220 solution?
Gladly.
You often claimed to ‘perfectly understand’ Team Science’s solution. Then you perfectly understand that 262K/220K are valid equilibrium temperatures that satisfy the RHTE and 1LOT.
Lets summarise what happens at 262K/220K in equilibrium:
The sun supplies 400 W/m2 to the BP, which emits 267 W/m2 from both sides to space and to the GP (total 533 W/m2).
The GP emits 133 W/m2 to the BP and to space.
Note that these numbers are simply found using the valid RHTE.
Note that they show a REDUCTION in BP heat loss on the right side relative to without the GP (133 vs 200).
Unlike Bill, I believe you can do the accounting and find that each plate is in energy balance at these temperatures, thus in equilibrium.
If you truly understand this accounting, then you must agree that these are valid equilibrium temperatures.
Yes?
If not, then quote what you want to refute, and give a fact-based reason for it.
We are just talking about equilibrium, not yet about getting there.
The 244 K…244 K solution is perfectly fine, especially once you’ve realised why the 262 K…220 K solution is debunked. I responded below on bill’s behalf, but realise it also resolves your query up here. So, let’s take it down-thread:
https://www.drroyspencer.com/2026/06/uah-v6-1-global-temperature-update-for-may-2026-0-53-deg-c/#comment-1747077
“The 244 K…244 K solution is perfectly fine, especially once you’ve”
As noted, you KEEP bringing up this truly indefensible disaster, while bitching that Im bringing it up!
Meanwhile unable to find any actual problem with 262/220 in equilibrium.
Your claims of it being debunked are pure fantasy.
I neither bitched nor brought it up. You brought it up.
Take the discussion down-thread, Nate. I’m not talking to you in two places in the comments at the same time.
Pulleez, you bring up 244 K constantly.
Your flimsy excuse for your ‘blackbody plates reduce heat loss’ contradiction was to declare without evidence that they have a different mechanism at 262/220 than at 244/244.
Meanwhile there is this:
“You often claimed to ‘perfectly understand’ Team Science’s solution. Then you perfectly understand that 262K/220K are valid equilibrium temperatures that satisfy the RHTE and 1LOT.
Lets summarise what happens at 262K/220K in equilibrium:
The sun supplies 400 W/m2 to the BP, which emits 267 W/m2 from both sides to space and to the GP (total 533 W/m2).
The GP emits 133 W/m2 to the BP and to space.
Note that these numbers are simply found using the valid RHTE.
Note that they show a REDUCTION in BP heat loss on the right side relative to without the GP (133 vs 200).
Unlike Bill, I believe you can do the accounting and find that each plate is in energy balance at these temperatures, thus in equilibrium.
If you truly understand this accounting, then you must agree that these are valid equilibrium temperatures.
Yes?
If not, then quote what you want to refute, and give a fact-based reason for it.
We are just talking about equilibrium, not yet about getting there.”
Wrong, Nate. You brought up the 244 K…244 K solution, to distract from the fact that the original alleged contradiction (the basis of this entire discussion) was debunked.
Take it down-thread, where you just conceded the entire argument (and apparently don’t even realise it). I’m not discussing anything else up here.
Down thread is Bill talking about 244/244.
Up here we are talking about 262/220 that you wanted to explain why its wrong.
So respond to my questions about the 262/220 if you think its wrong.
No, Nate. This comment, down-thread:
https://www.drroyspencer.com/2026/06/uah-v6-1-global-temperature-update-for-may-2026-0-53-deg-c/#comment-1747077
debunks your 262 K…220 K solution.
And, you agreed to the comment! That’s the funny thing.
Take it down-thread. What’s the matter with you? Are you addicted to talking to me, or something!?
“debunks your 262 K…220 K solution.
And, you agreed to the comment!”
Absurd.
How can it possibly debunk the 262/220 when it clearly agrees with the RHTE and 1LOT.
Lets summarise what happens at 262K/220K in equilibrium:
The sun supplies 400 W/m2 to the BP, which emits 267 W/m2 from both sides to space and to the GP (total 533 W/m2).
The GP emits 133 W/m2 to the BP and to space.
Note that these numbers are simply found using the valid RHTE.
Note that they show a REDUCTION in BP heat loss on the right side relative to without the GP (133 vs 200).
Unlike Bill, I believe you can do the accounting and find that each plate is in energy balance at these temperatures, thus in equilibrium.
If you truly understand this accounting, then you must agree that these are valid equilibrium temperatures.
Explain which parts you refute, with a fact-based rationale.
Nate is having a stroke.
Take it down-thread, Nate.
Not at all. Im simply showing you that 262/220 is a perfectly good equilibrium solution, according to the laws of physics. And you are obviously unable to refute any of these confirming numbers.
So that is you conceding that 262/220 is a valid equilibrium solution.
There cannot be two different equilibrium solutions.
And downthread, I showed Bill that 244/244 cannot be an equilibrium solution according to a proper accounting with real physics.
Then I agreed, as I ALWAYS HAVE, and unlike you, that heat never flows backwards from cold to warm, from GP to BP.
If you can construe any of that into me ‘conceding the argument’, then you have lost touch with reality.
Oh, just go back to sleep, Nate.
Im up at my usual time.
Frustrated that your argument up here against 262/220 is failing, and you have no answers?
Then go down, and watch 244/244 fall apart.
Down-thread is where your 262 K…220 K solution has just been debunked again, for the twentieth time. Take the argument down there, Nate. Stop responding to me up here.
No DREMT, as already explained, the 2LOT eqn. debunks DREMT’s solution; Eli’s solution complies with 2LOT eqn. thus is correct.
So cool, I control what you do up here?
Good, then I note that you keep dodging even trying to refute the physics accounting of 262/220, which clearly shows it is a valid equilibrium solution.
And there can only be one!
Because both plates are in perfect energy balance at 262/220 according to the SB law and the RHTE.
Your reluctance to face these inconvenient facts demonstrates that your endless claims that it is ‘debunked’ are just groundless beliefs.
Wrong, Nate. It seems I control what you do. You just keep responding to me up here even though the discussion has moved down-thread. Very odd.
Up here is all about detailing the reasons the 262/220 works. Not at the moment what is being discussed with Bill.
So right here is where you need to rebut it, or just acknowledge that you have none.
Endless baiting and goading from Nate.
The 262 K…220 K solution satisfies 1LoT but violates 2LoT. See the points 1) – 5). I have nothing more to say about it, since it is debunked down-thread as well anyway.
So, just go down-thread.
Ahh and there we have it.
“The 262 K…220 K solution satisfies 1LoT but violates 2LoT.”
The equilibrium solution satisfies 1LOT and the RHTE. These are valid equilibrium temperatures.
When it is in equilibrium, and all heat flows obviously are from the warmer bodies to the cooler, how can 2LOT find anything wrong with it?
Now if you are trying to argue that this is a valid equilibrium, but it never be reached, sorry that is not plausible.
1. If we simply bring together the bodies at those two temperatures, then they will simply stay at those temperatures.
2. Now give a brief burst of extra heat to warm up either one of the plates. What dp you think happens?
Nate just insists that he’s right, and makes arguments based on the premise that he’s right, leading to the conclusion that he’s right!
It’s hard to know what to say to this level of self-delusion.
I’ll go with: “OK, Nate”.
“Nate just insists that he’s right”
Basically you cant back up your claim that 2LOT is violated at 262/220 in equilibrium.
And blaming the messenger.
You correctly stated that 1LOT is satisfied at 262/220.
And that is the real 1LOT with only HEAT, work, and internal energy.
The real 1LOT cannot also be satisfied at 244/244.
Thus you shamelessly try to invent a new 1LOT, with other energies added in.
Sorry, not allowed in this universe.
“OK, Nate”.
“Bottom line…if the “back-radiation” transfer happens to completion, then (as with any other transfer of EMR between passive objects) the object the transfer is coming from will have less internal energy than it would otherwise, as a result; and the object the transfer is going into will gain more internal energy than it would otherwise, as a result. To deny that is to deny the very nature of a transfer!”
So we are oscillating back to treating EMR as if it is heat. Ie NET energy, or Is this us doing that?
Does this apply only to 244/244 or only 262/220?
Its all just a muddle.
Bottom line. You want to treat these temperatures differently. Apply 1LOT to 262/220, but for 244/244 you try to use a different ‘1LOT’.
There is only one correct 1LOT, and it relates only Heat, and Work to Intarnal energy changes.
There is no Work involved, and there is no ‘other energy’ that can be included.
No “muddle”, Nate.
EMR is not “heat”.
“Heat” is a transfer of thermal energy from “hot” to “cold”.
1) When a transfer of EMR between two passive objects reduces the internal energy of the warmer object and increases the internal energy of the cooler object, that is a transfer of heat.
2) When a transfer of EMR between two passive objects reduces the internal energy of the cooler object and increases the internal energy of the warmer object, you cannot technically call it a transfer of “heat” since “heat” is defined as being a transfer of thermal energy from “hot to cold” and this is the reverse of that. However, since it is the reverse, it is still EMR acting as a transfer of “heat” from cold to hot, and would hence violate 2LoT. Just because you cannot technically call it “heat” due to the definition specifying “hot” to “cold” does not mean that 2LoT allows such a transfer – semantics can’t change the underlying physics.
A transfer such as in 2) is thus not possible, and the EMR must be returned. That shows, again, that EMR is not “heat”.
As your 262 K…220 K solution involves a transfer such as in 2), which is not returned but instead goes to completion, that solution violates 2LoT.
As the 244 K…244 K solution has the EMR returned, it does not violate 2LoT.
I expected all of the above to be already understood.
> that solution violates 2LoT
Graham D. Warner might never get tired of making this invalid inference.
Willard may never get tired of being wrong.
“1) When a transfer of EMR between two passive objects reduces the internal energy of the warmer object and increases the internal energy of the cooler object, that is a transfer of heat.”
Except, there would need to be a NET transfer of energy, which is, by the RHTE, simply the two EMR emissions subtracted.
“2) When a transfer of EMR between two passive objects reduces the internal energy of the cooler object and increases the internal energy of the warmer object, you cannot technically call it a transfer of “heat†since “heat†is defined as being a transfer of thermal energy from “hot to cold†and this is the reverse of that. However, since it is the reverse, it is still EMR acting as a transfer of “heat†from cold to hot, and would hence violate 2LoT. Just because you cannot technically call it “heat†due to the definition specifying “hot†to “cold†does not mean that 2LoT allows such a transfer – semantics can’t change the underlying physics.
A transfer such as in 2) is thus not possible, and the EMR must be returned. That shows, again, that EMR is not ‘heat’.
As your 262 K…220 K solution involves a transfer such as in 2), which is not returned but instead goes to completion, that solution violates 2LoT.”
Oops!
NO, they are NOT two passive objects. One is heated by a heat source.
This is an evolving convoluted tall tale, leaving out critical information, in order to manufacture a 2LOT violation.
You previously called it a heat transfer.
Here you correctly note here that it is not actually a HEAT transfer.
2LOT is specifically about actual HEAT transfers, so we know this cannot be an ACTUAL 2LOT violation.
And we have a much simpler and accurate accounting which goes like this:
‘When a heated blackbody has a passive blackbody plate placed between it and its cold environment, then its HEAT LOSS IS REDUCED (as all agree blackbody plates can do).
Thus by the First Law of Thermodynamics, with a steady HEAT GAIN and a REUCED HEAT LOSS, its internal energy must increase.’
And this accouting has two premises that you already agree with!
So that leaves nothing refuted.
Sorry Nate, but you can quite easily isolate the effect of individual transfers of EMR. That’s what I did for the “back-radiation” transfer with my points 1) – 5). The transfer builds up internal energy in the warmer BP at the expense of the cooler GP in your 262 K…220 K solution, which as I just explained, violates 2LoT.
What I’ve been doing is making my position increasingly clear to someone who plainly doesn’t want to understand, but just keeps wanting to respond indefinitely in a sub-thread that died some time ago.
“Oops! NO, they are NOT two passive objects. One is heated by a heat source.”
It just gets so tedious. I don’t bother correcting half the mistakes you make because there are so many in every comment from you, it would take forever to correct them all. I’ve just picked two from your last essay to pick apart as examples.
The GPE consists of a heat source and two passive plates. If you’re going to say the BP isn’t passive because it’s heated by the Sun, you may as well say the GP isn’t passive because it’s heated by the BP! No. That’s absurd. The GPE consists of a heat source and two, yes two, passive plates.
“You previously called it a heat transfer. Here you correctly note here that it is not actually a HEAT transfer.”
Try to be reasonable, Nate. Since a heat transfer is a transfer of thermal energy from “hot” to “cold”, we can’t call a transfer of thermal energy from “cold” to “hot” a heat transfer. Surely you can see, though, that as far as the 2LoT is concerned, a transfer of thermal energy from “cold” to “hot” is what would constitute a violation of that law!? Otherwise, what is a 2LoT violation supposed to be!?
Your way of looking at it leads you to the absurd conclusion that a radiative 2LoT violation requires that the SB Law is also violated!
“The GPE consists of a heat source and two passive plates”
Oops. Yes correct. My mistake.
MY point was that you cannot neglect the heat source.
Because 1LOT for each body must account for heat input and output of the body.
For the umpteenth time, if either the heat input increases or the heat output decreases to the BP, it must warm.
In the GPE it is the heat output which reduces, when a warmer-than-space GP is placed behind it.
There is simply NO good reason to treat that passive plate as a heat source producing a new heat input to the BP, as you keep trying to po.
Because, as you well know, a passive blackbody plate can reduce heat loss.
Nate’s gone full circle and is back to the beginning again – and he hasn’t learned a thing:
https://www.drroyspencer.com/2026/06/uah-v6-1-global-temperature-update-for-may-2026-0-53-deg-c/#comment-1746441
Talking to him is just a complete waste of time. But, if you try and put him on “ignore”, he’ll relentlessly follow you around from thread to thread for months on end. Years, even.
Graham D. Warner always end up gaslighting:
https://rabett.blogspot.com/2017/10/an-evergreen-of-denial-is-that-colder.html
He can’t even convince Bordo, Gill or Puffman.
And so he ends up peddling his crap in almost every single thread since 2017.
Nobody knows why Willard keeps interjecting in this discussion, when he knows nothing at all about it, and contributes absolutely nothing of any value. Must just be his blind hatred and total obsession with me, personally.
Astute readers should remind themselves that this subthread started with was an exchange between Puffman and Norman.
Graham D. Warner now pouts because he just can’t “last word” another thread he derailed.
Almost nine years like that.
See what I mean?
Readers who paid attention to how this subthread evolved know that Gaslighting Graham simply tag teamed with Gill to peddle Eli’s refutation of Sky Dragon cranks:
https://www.drroyspencer.com/2026/06/uah-v6-1-global-temperature-update-for-may-2026-0-53-deg-c/#comment-1746266
That Gill does sad things doesn’t mean Gaslighting Graham does sad things when he does the same things. They’re more pathetic.
Willard provides more evidence of his hatred and obsession with me.
Aww you’re frustrated again, that I refuse to accept fake physics?
“There” no contradiction, Nate. What is proposed in the GPE is that the back-radiation transfer builds up internal energy in the warmer BP at the expense of the cooler GP. That can’t happen, due to 2LoT. So, the BP won’t warm to 262 K.”
Except that I JUST showed you again, that there is simply no reason to treat the passive GP as a heat source, since there is a perfectly satisfactory alternative, that does not require a NET transfer of energy from the GP to the BP.
“What does happen, however, is that the GP, if introduced at a temperature lower than 244 K, warms to 244 K, at which point heat flow between the plates goes to zero. So, “heat loss is reduced†by adding the blackbody GP, but warming of the BP does not occur.”
You are still not actually doing the math to show that is consistent with the actual heat flows.
The numbers matter!
For example, suppose the BP is 244 K and the GP is 234 K. What happens? Apply the RHTE to the plates.
You will find that the GP would have a NET LOSS of heat and must COOL, not warm. And the BP would have a NET GAIN in heat and must warm.
DO THE MATH, and prove me wrong.
“Yes, you find this to be strange because you believe that any “reduction in heat loss coupled with a continuous input of energy from an external source ought to lead to warming. But, like I already explained, the mechanism matters. Thermal energy cannot just “go against the flowâ€. It’s like water flowing uphill. Doesnt happen.”
DO the MATH. Use the RHTE for BP @ 244 K and the GP @ 234 K to prove to us that NET thermal energy is flowing from GP to BP!
This is your chance.
“Aww you’re frustrated again, that I refuse to accept fake physics?”
I’m not bothered by your failure to understand, Nate.
Your comment demonstrates that you still don’t get it.
Not my problem. I don’t write my comments for you.
We’re done.
Well i think it is quite interesting that you made a very specific claim:
“What does happen, however, is that the GP, if introduced at a temperature lower than 244 K, warms to 244 K, at which point heat flow between the plates goes to zero”
And when I challenged you to back up that claim, with the very straightforward math, you cannot provide
The fact is your claim is easily fact-checked with simple math and the RHTE.
So if the GP is introduced at say 234 K and the BP is 244K, will the GP warm?
Its Heat loss to space is sigma*(234^4-0) = 170 W/m^2
While its Heat gain from the BP is sigma*(244^4-234^4) =31 W/m2
The GP has a Net Heat Loss of 139 W/m^2. It must COOL.
This is easy to understand, it means that 244/244 is not an equilibrium.
But if you can prove otherwise with real math and physics. Do so.
Otherwise that’s that.
Nate, you agreed that the GP can only lose heat from half of its surface area – the side facing space:
https://www.drroyspencer.com/2026/06/uah-v6-1-global-temperature-update-for-may-2026-0-53-deg-c/#comment-1747089
So, if it’s receiving 200 W/m^2 from the BP, but losing 170 W/m^2 to space, then it’s receiving more than it’s losing and must warm.
Remember, as you have agreed, what is emitted from the GP on the side facing the BP does not count as a loss. Since it doesn’t count as a loss from the GP, it can’t be counted as a gain to the BP either. So, the BP, being able to lose heat from both sides, is already at equilibrium emitting 200 W/m^2. Once the GP warms to 244 K, that will be at equilibrium too – receiving 200 W/m^2 from the BP and losing 200 W/m^2 from the only side it can lose heat from.
“Remember, as you have agreed, what is emitted from the GP on the side facing the BP does not count as a loss. Since it doesn’t count as a loss from the GP, it can’t be counted as a gain to the BP either.”
Nowhere have I claimed the BP is gaining heat from the GP.
Strawman. Respond to what I actually say.
“Once the GP warms to 244 K, that will be at equilibrium too – receiving 200 W/m^2 from the BP and losing 200 W/m^2 from the only side it can lose heat from.”
You completely skipped the step of finding out what happens to the GP when it is introduced cooler than the the BP!
You just assume it will warm back to 244K.
The point is to fact-check that claim.
It is quite easy to find out with the RHTE. Why not simply apply the RHTE, which you agree should apply, and is quite easy to use?
Then you will find, with no uncertainty, that the GP must cool, not warm.
“You completely skipped the step of finding out what happens to the GP when it is introduced cooler than the the BP!”
No, I didn’t, Nate. You just completely skipped quoting from, or responding to, that part of my comment!
Gee whizz.
“You just completely skipped quoting from, or responding to, that part of my comment!”
Gee when have you not done that to my comments?
Feel free to point out the part that does that.
“So, if it’s receiving 200 W/m^2 from the BP, but losing 170 W/m^2 to space, then it’s receiving more than it’s losing and must warm.”
Again you use changing rules to suit your needs. Sometimes physics, sometimes not, in order to achieve your desired outcome.
For the GP, you use the RHTE to find the heat loss to space, but fail to use it to find the heat gain from the BP.
Who knows what law of physics you are using to find its heat gain from the BP is 200 W/m2!
THE RHTE applues for both heat gain and heat loss
The heat gain is sigma(144^2-134^2) = 31 W/m2.
And the GP cools.
Because Team Science must consistently apply the laws of physics.
No, Nate. I am not using the RHTE to find the heat loss to space. I am simply understanding that the GP emits 170 W/m^2 at that temperature, and only the emission to space need be considered.
“I am not using the RHTE to find the heat loss to space.”
And why not us for either?
When is it to be used?
“I am simply understanding that the GP emits 170 W/m^2 at that temperature, and only the emission to space need be considered.”
And same for BP to GP?
So we are back to EMR is heat?
It seems whatever you say these days puts you in contradiction with another DREMT.
Nate, I explained myself clearly enough in the first place:
https://www.drroyspencer.com/2026/06/uah-v6-1-global-temperature-update-for-may-2026-0-53-deg-c/#comment-1747450
You then skip the parts you want to skip, make false accusations of straw men, and claim that I haven’t provided an answer on something when actually I had. Then, when I call you on that, you don’t admit you made a mistake or anything, you just make some childish remark. Then you’re onto the next thing you can misconstrue. It never ends. My comment, as I said, was clear enough in the first place. You pick everything apart, chop it all up into bits, take everything out of its full context until the clear meaning is gone.
Then someone else will come along and say that I’m the one not arguing in good faith! Hilarious.
“Nate, I explained myself clearly enough in the first place:”
Which was thoroughly rebutted. Your narrative still keeps putting you in a muddle of contradictions.
Then we get from you a whole paragraph of woe is me, playing the victim card, but no actual answers.
I remind you that I used the RHTE to find the heat (net energy) flows between the plates at 262 K and 220K, and found that both plates were in energy balance and obeyed 1LOT,
https://www.drroyspencer.com/2026/06/uah-v6-1-global-temperature-update-for-may-2026-0-53-deg-c/#comment-1747075
and you agreed.
So why NOT use the valid RHTE to find the heat (net energy) flow between the plates at 244 K and 234K?
Yes, Nate – rebutted, but not refuted.
You say stuff to try to contradict me, but because you never actually properly listen to what I say in the first place, and constantly misrepresent and falsely accuse me, you never refute my arguments. You keep suggesting I’m contradicting myself, but you never demonstrate that. For example, you suggest I’m now saying that EMR is heat, contradicting a previous statement – but I’m not saying that EMR is heat. And, if you understood this comment:
https://www.drroyspencer.com/2026/06/uah-v6-1-global-temperature-update-for-may-2026-0-53-deg-c/#comment-1747295
You would know that. But, you don’t understand. You don’t understand, and you can’t learn.
“Nate ignores the response. On and on it goes.”
To Bill’s usual trolling without substance? Yep.
You keep posting in the wrong place.
This sub-thread is closed for comments. Take it down-thread.
”
Yes, Nate – rebutted, but..”
Good. Then quote and respond to the spefific points in my rebuttal that explain the flaws in your post, instead of simply repeating the post.
https://www.drroyspencer.com/2026/06/uah-v6-1-global-temperature-update-for-may-2026-0-53-deg-c/#comment-1747528
Now evaded twice.
Nate says:
1. Any blackbody emits EMR according to its temperature, by the SB Law. That means the GP emits EMR toward the BP.
2. Blackbodies absorb all EMR that hits them, according to Kirchhoffs Law. That means the BP MUST absorb the EMR emitted by the GP.
There is no way to avoid these two ordinary facts.
———————
And after that you have no idea which has led you to question actual observations. That and the details of those experiments worked out by experts show your thoughts on the matter are totally bogus.
What one needs to respect is the outcome of experiments and you choose imaginary experiments over real ones. Any scientist worth a smidgen of respect, respects the real ones.
Any any scientist worthy of smidgen of respect realizes that he needs to be smart enough and quick enough to design a real experiment that can show where new exceptions need consideration but its a fool’s errand to just ignore the real experiments and invent something totally contrary to observations. Talking about being a flat earther. . .LMAO!
Unfortunately there are those who would prefer to accomplish it by fiat and makes every effort to do so. That’s only worthy of disrespect.
Nate, I said your solution satisfies 1LoT because all the transfers balance – same as they do in the 244 K…244 K solution. Both solutions satisfy 1LoT. This is nothing new.
I never mentioned anything involving the RHTE and 1LoT. Just 1LoT, and just because the transfers balance.
OK?
Now: this sub-thread is closed for comments.
Take it down-thread.
> That and the details of those experiments worked out by experts
Gill’s daddies are so strong, and yet:
https://www.drroyspencer.com/2013/05/a-simple-experiment-to-show-how-cool-objects-can-keep-warm-objects-warmer-still/
Cranks are not welcome here. Sad.
“Nate, I said your solution satisfies 1LoT because all the transfers balance – same as they do in the 244 K…244 K solution. Both solutions satisfy 1LoT. This is nothing new.”
Both solutions do not satisfy 1LOT, because one of of these obeys the actual laws of radiative heat transfer, kirchoffs law, and 1LOT, and one does not.
I need to remind you that you say you agree that the RHTE gives Q=0 at 244K/244K.
And I need to remind you that 1LOT relates three quantities heat Q, internal energy U, and Work W for a body. Nothing else.
There is no W here in this problem.
Thus only heat and internal energy are related by 1LOT in this problem. And no other energies that you may dream up are involved
The GP has Q =0, no heat from the BP, and is losing heat to space. It has a Net Loss of heat, and hence a net loss of internal energy.
It must be cooling to satisfy 1LOT.
244/244 cannot be equilbrium.
You dont get to invent your own version of 1LOT.
I’m not inventing a new definition of 1LoT, Nate. But, you appear to be inventing a new definition of “heat”!
“Heat” is a transfer of thermal energy from “hot” to “cold”. Thus, in the GPE, the transfer from the Sun to the BP, the BP to space, the BP to the GP, and the GP to space, are all “heat” transfers by definition. Guess which transfer is not a transfer of “heat”? That’s right…the “back-radiation” transfer. Yet, in your 262 K…220 K solution, you have it acting like a transfer of “heat” in that it builds up internal energy in the BP at the expense of the GP! 2LoT says “no” to that, Nate.
As I said, you seem blissfully unaware that in your 262 K…220 K solution, every single transfer of EMR is treated as a transfer of “heat”! Whereas in the 244 K…244 K solution, the “back-radiation” transfer is treated correctly as a transfer of EMR energy only – i.e. it can’t build up internal energy in the warmer BP at the expense of the cooler GP! So, it’s returned to the GP.
Now, don’t forget – this sub-thread is closed for comments.
Take it down-thread, Nate, if you want to respond further.
That’s physically wrong yet again DREMT 2:12 pm since the transfer of GP EMR builds up internal energy in the BP at the expense of the GP. DREMT again 2:12 pm confused “heat” and EMR as even DREMT has admitted then forgets EMR is not “heat”.
Ball4 says:
“…the transfer of GP EMR builds up internal energy in the BP at the expense of the GP”
Thank you for your agreement on that point, Ball4. I have no further need for you, so you are dismissed. No need for you to respond to me ever again.
There is no agreement DREMT 3:59 pm; my comment agrees with 2LOT eqn. so my comment corrected DREMT’s comment which does not comply with 2LOT eqn. since DREMT earlier once again forgot EMR is not “heat”.
There is no hope for DREMT to be correct when violating 2LOT eqn.
“I’m not inventing a new definition of 1LoT, Nate.”
Another cake that you cannot eat and still have.
Then the only alternative is for you to agree that with no heat provided to the GP by the BP, it must cool, in order to satisy 1LOT.
And thus 244/244 cannot be equilibrium.
Poor confused Ball4, his:
“…the transfer of GP EMR builds up internal energy in the BP at the expense of the GP”
agrees with what I’ve been saying all along, and plainly takes a huge, steaming dump right into Nate’s open, screaming mouth. A transfer of EMR cannot build up internal energy in the warmer object at the expense of the cooler object, so the 262 K…220 K solution is debunked.
Thank you for handing me this glorious, eternal victory.
No need for you to respond to me ever again.
Again DREMT 6:05 pm, is physically wrong since the transfer of EMR energy must build up internal energy in the BP at the expense of the GP according to the 2LOT eqn. Both plates continuously warm to Eli’s correct temperature equilibrium powered by the sun.
There is no hope for DREMT to be correct when violating the 2LOT eqn.
Ball4 keeps saying the part that Nate has fought for months to deny:
“…the transfer of GP EMR builds up internal energy in the BP at the expense of the GP”
Every time he says it, it’s a dagger to every argument Nate has made. Glorious.
Thank you so, so much, Ball4.
No need for you to respond to me ever again.
Nate, Ball4 has again conceded the following:
“…the transfer of GP EMR builds up internal energy in the BP at the expense of the GP”
According to 1LoT, changes in internal energy directly relate to heat transfer (as you pointed out, there is no work performed in the GPE).
Therefore, per 1LoT, the transfer of GP EMR building up internal energy in the BP at the expense of the GP is indeed EMR acting as heat transfer from cold to hot, and a 2LoT violation.
So, your 262 K…220 K solution is debunked per Ball4. Your argument is now with him.
You can have that discussion where you like.
“According to 1LoT, changes in internal energy directly relate to heat transfer (as you pointed out, there is no work performed in the GPE).”
Thank you. Could not agree more.
Also you say:
“I’ve acknowledged for eight years that when the GP is at the same temperature as the BP (both 244 K), that heat flow between the plates has gone to zero.”
Thus the GP, which is losing heat and internal energy to space, MUST COOL. else 1LOT cannot be satisfied.
There is no way around it.
QED
Is Ball4 now your ‘expert’?
Sure, Nate, if you like. Ball4 is my expert, and he’s right here waiting for you to argue with him!
Off you go.
[Yes, I know you have many arguments that you make against the 244 K…244 K solution. You’ve been making them for eight years. However, none of them save your 262 K…220 K solution, which is debunked as explained].
DREMT 2:22 am: EMR cannot ever act as heat except in DREMT’s faulty imagination so DREMT’s years long mistaking EMR for heat is again fully exposed.
There is no hope for DREMT to be correct when violating the 2LOT eqn.
“EMR cannot ever act as heat…”
…fascinating. So the EMR from the Sun cannot act as heat upon the Earth!? It’s a wonder we’re not a lot colder, then…
…in all seriousness, it’s time for Nate and Ball4 to duke it out. Off you both go.
DREMT 6:29 am, yes, here DREMT makes a small step toward physical reality since the EMR from the sun is not heat. Now just apply DREMT’s new found reality to the GPE.
The eight-year argument was (once again) settled in my favour at 2:22.
You and Nate can argue it out, or not. I’m past caring.
“Yes, I know you have many arguments that you make against the 244 K…244 K solution. You’ve been making them for eight years. However, none of them save your 262 K…220 K solution, which is debunked as explained”
What is different now is thst we now have you, on record, aquiescing to the main ingedients in the case.
Lets review, shall we:
1. The Fist Law of Thermodynamics equates Net Heat transferred to a body with its Internal energy change.
You now underst and agree with that.
2. The heat transfer from BP to GP is 0 when the two are at the same temperature.
You have long agreed.
3. The GP, when much wRmer than space, is losing heat to space.
You obviously agree, and stated it the other day for T = 234 K.
Thus, by #2 and #3, we must conclude that at 244/244 the GP has NET HEAT LOSS.
Then by #1, the GP at 244/244 is losing internal energy, which is proportional to temperature.
Thus the GP is cooling, and thus it is Proven that @ 244K/244K the plates cannot be in equlibrium.
QED.
Nate says:
“…Net Heat…”
Whoops! I never agreed to the existence of any “Net Heat”! That implies heat flowing both ways. That’s a no-no.
Nothing’s changed in eight years, Nate. Obviously, I’ve always understood 1LoT. And, the principle of conservation of energy, of course, applies to all types of energy. Not just “heat”.
Although, my 2:22 AM argument that you keep avoiding, is a new one.
And, it’s yet another issue settler.
That’s that.
2:22 am: comments “EMR acting as heat transfer” but since EMR is not “heat” DREMT is incorrect and the GPE argument long ago settled in Eli’s solution favor.
There is no hope for DREMT to be correct.
Well, those who actually read the entire 2:22 AM comment, and not just the tiny bits that Ball4 clips, will understand that either the 1LoT equation is correct, or Ball4 is correct.
Sorry, Ball4…you lose that one, I’m afraid.
“Whoops! I never agreed to the existence of any “Net Heat”! That implies heat flowing both ways. That’s a no-no.”
Whoops. Not at all.
Net means Heat input – Heat output, which is what 1LOT cares about, obviously.
OK, well, the principle of conservation of energy, on which the 1LoT is based, applies to all types of energy. Not just “heat”. Since all the (EMR) energy transfers balance in both solutions, that’s good enough for me. And, seemingly everyone who’s ever taken part in this debate, besides Nate.
Now, I wonder how long Nate thinks he’s going to get away with evading my 2:22 AM comment:
https://www.drroyspencer.com/2026/06/uah-v6-1-global-temperature-update-for-may-2026-0-53-deg-c/#comment-1747611
2:37 pm: DREMT’s GPE solution transiently is in accord with 1LOT but fails the 2LOT eqn. when DREMT mistakes EMR for heat in the “tiny bits” (DREMT term) clipped. .
There is no hope for DREMT to be correct when his GPE solution is not in accord with 2LOT eqn.
The 1LoT equation proves you wrong, and me right, Ball4.
Thank you for your part in debunking the 262 K…220 K solution. Much appreciated.
> applies to all types of energy
Which of course explains why Graham D. Warner tries really hard to argue that backradiation is not, strictly speaking, insulation.
Not only he’s a jerk, but he’s a Philistine.
Speaking of whom:
https://www.youtube.com/watch?v=B965f8AcNbw
Another nonsense comment from Willard.
“OK, well, the principle of conservation of energy, on which the 1LoT is based, applies to all types of energy. Not just “heat”. Since all the (EMR) energy transfers balance in both solutions, that’s good enough for me. And, seemingly everyone who’s ever taken part in this debate, besides Nate.”
Everyone? Except all physicists, chemists, and engineers, oh and YOU as of yesterday:
“According to 1LoT, changes in internal energy directly relate to heat transfer (as you pointed out, there is no work performed in the GPE).”
So there is nothing other than HEAT that can add or subtract from the GPs internal energy.
And you agreed for a long time that Q=0 from the BP.
That means that nothing from the BP can replace the lost internal energy sent from the GP to space.
The GP cannot be in equilibrium at 244K.
Again we find you can’t eat this cake and still have it.
This demonstrates that when you make up your own physics rules on the fly, you are going to end up, again and again, in a state of contradiction.
Let’s see then, Nate.
Apply your “heat input and heat output” logic to the BP, in the 244 K…244 K solution.
Tell me how that works out.
Then, respond to my 2:22 AM comment. Stop evading.
So no rebuttal for the GP. Then it must cool.
“Apply your “heat input and heat output” logic to the BP, in the 244 K…244 K solution.”
Sure, as explained many times, it has heat input of 400 W/m2 from the sun. It is 244 K, so it loses 200 W/m2 of heat to space on one side, and it loses Q = 0, heat to the GP on its other side (as you agree).
It has a Net HEAT GAIN of 200 W/m2. Its internal energy must INCREASE. It must warm.
This is a quite straightforward.
Here’s why I disagree:
We know that in your 262 K…220 K solution, the “back-radiation” transfer builds up internal energy in the BP at the expense of the GP. That’s become so obvious that even Ball4 agrees. We know that, for one thing, because when the transfer is returned to the GP, and thus the transfer does not go to completion, the plate temperatures are 244 K…244 K! So, obviously the completion of the transfer makes the difference between the plates being 262 K…220 K rather than 244 K…244 K.
Then, according to the 1LoT equation, since no work is performed in the GPE, the fact that the “back-radiation” transfer is building up internal energy in the BP at the expense of the GP means that the transfer is acting as a flow of heat from cold to hot, violating 2LoT.
So, the 262 K…220 K solution is debunked.
Correcting DREMT 9:47 am physically: Then, according to the 1LoT equation, since no work is performed in the vacuum of the GPE, the fact that the forward EMR transfer is building up internal energy in the BP at the expense of the GP means that the 2LOT eqn. is satisfied.
So, Eli’s 262 K…220 K solution was correct long ago and there is no hope for DREMT’s solution to be GPE equilibrium since DREMT violates the 2lOT eqn.
This discussion sure is repetitive.
The arguments have all been made, though.
No need for Ball4 or Nate to keep endlessly repeating themselves.
“We know that in your 262 K…220 K solution, the “back-radiation” transfer builds up internal energy in the BP at the expense of the GP. That’s become so obvious that even Ball4 agrees. We know that, for one thing, because when the transfer is returned to the GP, and thus the transfer does not go to completion, the plate temperatures are 244 K…244 K! So, obviously the completion of the transfer makes the difference between the plates being 262 K…220 K rather than 244 K…244 K.”
Repeating your opinions about what you think happens at 262/220, which is a non-sequitur for this discussion of what happens according to 1LOT at 244K/244K.
What you have understood and agreed to demonstrates in the above two comments, why 244k/244k cannot be an equilibrium. So you need to quote from and discuss those two posts, if you think you can refute them.
With regard to 262/220. We know that this is, according to 1LOT, each body is in energy balance (as you agree), and is a valid equilibrium.
“Then, according to the 1LoT equation, since no work is performed in the GPE, the fact that the “back-radiation” transfer is building up internal energy in the BP at the expense of the GP means that the transfer is acting as a flow of heat from cold to hot, violating 2LoT.”
None of that follows from 1LOT actually applied to 262/220.
We BOTH agree that back-radiation is a one-way EMR and is not HEAT. Therefore, according to 1LOT, it cannot be the cause of any ‘build up of internal energy’ in the BP.
As discussed above, using only 1LOT, and the RHTE, we can determine that starting at 244/244, the the HEAT input from the sun, the HEAT LOSS to space, and its HEAT LOSS to the GP REDUCED TO 0, the BP has a NET GAIN in HEAT, and Internal Energy and must WARM.
There is never HEAT flow (NET energy transfer) from cold to warm, so no 2LOT problem, and yet the BP warms.
So, the 262 K…220 K solution is clearly NOT debunked. Just the opposite.
Nate, you approach this problem the wrong way around. You have everything backwards. You think you can criticise the 244 K…244 K solution and somehow that will make your 262 K…220 K solution right “by default”. But, it won’t.
That the “back-radiation” transfer builds up internal energy in the BP at the expense of the GP in your 262 K…220 K solution is a fact, not my opinion.
It’s proven by the points 1) – 5), here:
https://www.drroyspencer.com/2026/02/uah-v6-1-global-temperature-update-for-january-2026-0-35-deg-c/#comment-1733329
Try as you might, you’ve never refuted that chain of logic. So, the conclusion stands.
And, that means, per the 1LoT equation, that the “back-radiation” transfer is acting as a transfer of heat from cold to hot, in your solution, violating 2LoT.
It’s as simple as that.
“You think you can criticise the 244 K…244 K solution and somehow that will make your 262 K…220 K solution right “by default”. But, it won’t.”
Not at all.
It is long been your approach to try to get from a T, eg 244/244, away from 262/220, and then create a false narrative that the only way to get from there to 262/220, is to violate 2LOT.
So I am showing you that
1. If we start at 244/244, the GP will naturally cool, and the BP will naturally warm, simply by correctly applying the RHTE and 1LOT, that you now understand, only cares about HEAT flows.
2. As you agree, at 262/220, the plates are in energy balance, and satisfy 1LOT. Thus it is the correct equilibrium.
3. As much as you try to treat it as HEAT, the one-way emission from the GP to the BP is not the HEAT transfer between the plates. Only HEAT transfers can change the internal energy of bodies, says 1LOT.
4. So, because of 3, it is impossible for the back-radiation to build-up the internal energy of the BP, as you falsely claim.
5. Yet, by 1 and 2, the heat input from the sun, the reduced heat loss from the BP with the GP present, it must warm.
You claim you are using some sort of logic to find that
“the “back-radiation” transfer builds up internal energy in the BP at the expense of the GP in your 262 K…220 K solution is a fact, not my opinion.”
I know form of Logic that allows one to come to a conclusion by IGNORING the contradictory fact, that there is a valid route (1-4) to 262/220 that does not require the back-radiation to act as HEAT.
You provide no evidence for heat needing to flow from cold to warm in order to get to the equilibrium at 262/220.
“3. As much as you try to treat it as HEAT, the one-way emission from the GP to the BP is not the HEAT transfer between the plates. Only HEAT transfers can change the internal energy of bodies, says 1LOT.
4. So, because of 3, it is impossible for the back-radiation to build-up the internal energy of the BP, as you falsely claim.”
You have it backwards, like I said. Because of the proven fact that in your 262 K…220 K solution, the “back-radiation” transfer builds up internal energy in the BP at the expense of the GP, we know per the 1LoT equation that the transfer is acting as a flow of heat from cold to hot, violating 2LoT.
“Because of the proven fact that in your 262 K…220 K solution, the “back-radiation” transfer builds up internal energy in the BP at the expense of the GP, we know per the 1LoT equation that the transfer is acting as a flow of heat from cold to hot, violating 2LoT.”
False. This was already cleatly explained.
You keep trying to violate 1LOT, as you claim to understand it: only HEAT transfers to and from a body can change the Internal Energy of body.
And this makes perfect sense, since HEAT is the NET transfer of thermal energy between bodies.
Back radiation is not HEAT. Thus it cannot ‘build up internal energy in the BP’ nor reduce internal energy in the GP.
To continue to take obviously contradictory stances is a credibility killer.
It shows that your narrative does not make sense.
Nate, it’s your credibility on the line, not mine. It’s a very, very silly position for you to take to assert that individual transfers of EMR cannot affect an object’s internal energy. I mean…consider the BP on its own with the Sun. Are you seriously saying you think the individual transfer of EMR from the Sun to the BP has no effect on the BP’s internal energy!? Come on, Nate. You’re making yourself look foolish.
“to assert that individual transfers of EMR cannot affect an object’s internal energy. I mean…consider the BP on its own with the Sun. Are you seriously saying you think the individual transfer of EMR from the Sun to the BP has no effect on the BP’s internal energy!? Come on, Nate. You’re making yourself look foolish.”
Umm, is that what I said?
Of course not. I said that only Heat transfers, which are the NET energy transfers, can change the Intarnal Energy of bodies, which is what the 1LOT for this problem states, as YOzu agree.
The individual EMR transfers are not the Heat transfer, but they contribute to it along with other EMR transfers.
As you well know, the Heat transfer is the NET of the two-way EMR transfer between the BP and GP, then it is clear that the HEAT flow is never reversed, never from cold to warm.
Instead, the HEAT flow is simply REDUCED. And if you were honest, you could recognize that this reduction, along with the steadt heat input from the sun, is totally sufficient to account for the BP warming.
And 2LOT has no problem with this. It is an ordinary everyday event, like closing the oven door and seeing the oven get hotter.
No hand waving or making up your own physics necessary. This is just what standard physics tells us.
“consider the BP on its own with the Sun. Are you seriously saying you think the individual transfer of EMR from the Sun to the BP has no effect on the BP’s internal energy!”
Ok lets do consider the HEAT transfer from the sun to the BP.
It is the NET of the EMR transfer from the sun to the BP and the EMR transfer from the BP to the sun.
The latter is negligibly small because the sun is so far away and is effectively a tiny dot in the view of the BP. So indeed most of the HEAT transfer from the sun is due to the sun’s EMR.
Whereas, when we consider the BP and GP, they are close together and the same size so the EMR from both contributes equally to the HEAT transfer between them.
“Umm, is that what I said?”
Yep. And, you say it again, here:
“I said that only Heat transfers, which are the NET energy transfers, can change the Intarnal Energy of bodies…”
That’s a ridiculous statement, Nate. You’re suggesting only “net” energy transfers can change the internal energy of bodies, but obviously a single transfer of EMR can change the internal energy of a body. Like the transfer of EMR from Sun to BP. Thus, a single transfer of EMR can act as “heat”. And, you can easily isolate the effect of individual transfers of EMR on the internal energy of bodies, as I did with the “back-radiation” transfer in my points 1) – 5).
You’re completely in denial. And, you won’t ever shut up.
Its all perfectly clear.
““I said that only Heat transfers, which are the NET energy transfers, can change the Internal Energy of bodies…”
I note that this is the only sentence you take issue with.
But it is a plain statement of 1LOT, exactly as youve already agreed to!
So??
It does not matter to me if you do the energy accounting for each body with the individual EMRs, as long as
1. you include ALL EMRs
2. you dont try to misrepresent a single EMR as HEAT.
3. you dont try to misrepresent a single EMR from a cold body to a warm body as a 2LOT violation.
4. you dont try to misrepresent a CHANGE in HEAT flow as THE HEAT flow.
5. Dont try to violate laws of physics.
So follow these reasonable rules, which are just the standard definitions from physics, then go ahead an explain your problem with the 262/220 solution.
“I note that this is the only sentence you take issue with…”
Wow, is that how debate works, now? If your opponent only quotes one sentence, then that is all they object to!?
OK, let’s follow that logic, then. You quoted absolutely nothing from my last comment to you. Therefore you have no objections to what I said, and thus you concede that I’m correct. Excellent! That was easy. Thanks.
Do you respond to everything in my posts?
Mostly not.
In any case I offered you a chance to explain yor issue with 262/220 with the one-way flows, ALL of them.
But you cant treat them as HEAT. Nor violate 1LOT. Nor treat a change-in-heat flow as the heat flow.
My 6:08 PM comment stands unchallenged. That’s that.
Unchallenged?
Only if you shamelessly ignore the challenges, and backpedal from your own understanding of what 1LOT means
https://www.drroyspencer.com/2026/06/uah-v6-1-global-temperature-update-for-may-2026-0-53-deg-c/#comment-1747854
Now it is clear that you are unable to explain your 2LOT violation at 262/220, even using your one-way EMR transfers, while satisfying these reasonable condtions:
1. include ALL EMRs
2. Do not misrepresent a single EMR as HEAT.
3. Do not misrepresent a single EMR from a cold body to a warm body as a 2LOT violation.
4. Dont try to misrepresent a CHANGE in HEAT flow as THE HEAT flow.
5. Dont violate any laws of physics.
Which of these is a major stumbling block for you, and why?
No, Nate. You can’t bait your way out of this. My 6:08 PM comment remains unchallenged. That’s that.
Oh?
Baiting?
Nope. Just getting at the crux of your argument.
Apparently asking you to explain it while adhering to established laws of physics is a bridge to far.
You are making it clear that it cannot be done.
And thst means your claims are unsupported in our universe.
Let’s summarize what we have learned in the last few weeks.
Things you have now agreed to.
1. Blackbody plates added between hot and cold bodies reduces heat loss from the hot body, without violating 2LOT.
2. At 262K/220K, both plates are in energy balance, and thus at equilibrium.
3. 1LOT for the GPE states that only Heat transfers can change the Internal Energy of bodies.
4. Back radiation exists but is not a HEAT flow.
Now if only you could follow the logic from these facts to where they lead.
Then you would find that:
-At 244K/244K 1LOT makes clear that the GP is losing NET heat and internal energy and must COOL, and the BP is gaining NET heat and internal energy and must warm.
-The warming of the BP and cooling of the GP continue until they reach energy balance and equilibrium at 262K and 220 K.
-No HEAT ever flows from a colder body to a warmer body during the eqilibration of the plates. So 2LOT is satisfied.
No, Nate. You’re still trying to bait. My 6:08 PM comment remains unchallenged. That’s that.
Agree to disagree.
In any case, your post seeks to use the one-way-EMR transfers to explain your POV.
And I am saying, please, go ahead and use the one-way-EMR transfers to explain why 262/220 cannot work, while ALSO
1. not misrepresenting one-way-EMR as HEAT,
2. not misrepresenting a one-way-EMR from a cold body to a warm body as a 2LOT violation.
3. not misrepresenting a CHANGE-in-HEAT flow as a HEAT flow.
Maybe these misrepresentations are central to your argument, and that is why you refuse to answer the question.
If so, then we can only conclude your argument is indefensible.
You have no explanation. Got it.
We can understand why you need to revert to pure troll mode.
Here’s the comment in full, again. Either respond to it, or stop responding to me.
“Umm, is that what I said?”
Yep. And, you say it again, here:
“I said that only Heat transfers, which are the NET energy transfers, can change the Intarnal Energy of bodies…”
That’s a ridiculous statement, Nate. You’re suggesting only “net” energy transfers can change the internal energy of bodies, but obviously a single transfer of EMR can change the internal energy of a body. Like the transfer of EMR from Sun to BP. Thus, a single transfer of EMR can act as “heat”. And, you can easily isolate the effect of individual transfers of EMR on the internal energy of bodies, as I did with the “back-radiation” transfer in my points 1) – 5).
You’re completely in denial. And, you won’t ever shut up.
“Nate is still playing dumb.”
Whereas you are not playing.
Rather than just repeating the thing that was dumb, and made no sense, explain how, if
The BP with GP, equilibrates to 244 K.
Obviously it is then in energy balance, with 400 W/m2 heat input and 400 W/m2 (200 each side) of heat loss.
Then, with same heat input, but now with the GP present, you say its
‘heat loss is reduced’.
It can no thus longer be in energy balance at 244 K. It must WARM according to 1LOT.
But you say the opposite :
““It doesn’t lead to warming”
Obviously disagreeing with logic, everyday experience, and 1LOT, which you now claim to understand!
Stop responding in the wrong place, Nate, and either reply to my last comment, or stop responding to me.
Indeed wrong place.
“I said that only Heat transfers, which are the NET energy transfers, can change the Intarnal Energy of bodies…”
That’s a ridiculous statement, Nate. You’re suggesting only “net” energy transfers can change the internal energy of bodies, but obviously a single transfer of EMR can change the internal energy of a body. Like the transfer of EMR from Sun to BP. Thus, a single transfer of EMR can act as “heat””
I very clearly did respond to this already. How could you have missed my posts?
My sentence above is a statement of 1LOT when no work is involved, directlt relevant to the GPE.
It is ridiculous for you to claim that is ridiculous.
It is even more ridiculous for you to deny that “only ‘net’ energy transfers can change the internal energy of bodies”
Which is basically denying that Energy is conserved.
“but obviously a single transfer of EMR can change the internal energy of a body”
Of course, ONLY if it results in a NET energy transfer!
So there is absolutely no good reason to look at a single one-way EMR!
You need to pause and think, if you are capable, before posting such absurdities.
Good, then you accept that a single transfer of EMR can change the internal energy of a body.
Yes, and you accept that a single transfer of EMR can change the internal energy of a body, only if it produces a NET transfer.
Nate is talking nonsense, again.
Graham returns to gaslighting, as usual.
DREMT: Good, then you accept that a single transfer of EMR can change the internal energy of a body.
NATE: Yes
DREMT: Great, then as per the 1LoT equation, a single transfer of EMR can act as a transfer of heat. Eight-year argument settled in my favour.
Take your opponents words out of context to misrepresent their position.
Desperate LOSER tactics.
Meanwhile,
“Great, then as per the 1LoT equation, a single transfer of EMR can act as a transfer of heat”
Only in a special case when the NET EMR = one of the EMRs.
Not at all true between the BP and GP!
Why are you so allergic to the word NET?
Which simply means count ALL energy transfers.
Nate back-tracks, and changes his answer from the correct “yes” to an illogical “no”.
Good to watch him squirming in defeat.
Graham gaslights, piles on his gaslighting, and gaslight a little more.
It’s a straight “yes” or “no” question, with no conditions or exceptions, Willard.
DREMT,
Clearly you are frustrated that several items you understood and stated recently produce contradictions in your narrative.
-You understood that 1LOT relates only HEAT flows to the Internal Energy and thus temperature of bodies.
-You understood that radiative Heat transfer is the Net of EMR transfers between bodies
-You understood that blackbody plates reduce heat loss.
But you now seem to recogniz the damage that these understandings do to your narrative.
So begins the wholesale backsliding.
Graham D. Warner loves to share his incompetence, even at word games.
Weird thing to say when you’ve lost an eight-year argument, but OK Nate.
Yes, DREMT 7:09 am has lost the 8+ years long argument so the Eli GPE solution was right to begin with. Never was any hope for DREMT to be correct when his solution doesn’t comply with 2LOT eqn. as anyone that reasonably understands 2LOT can easily see.
Ball4 suffers another catastrophic reading comprehension failure.
Apparently you are tired of continually getting stuck in multple contradictions.
Thus, as you always do, quit and declare victory. Then shift to pure troll mode.
Nate is on another planet from the reality of this discussion.
“It’s a straight “yes” or “no” question, with no conditions or exceptions,”
Pfft!
You remind me of jerk kids on the playground who constantly try to change the rules of the game so they can falsely claim victory.
I thought we were adults here.
My statement here was both clear and factual.
“Yes, and you accept that a single transfer of EMR can change the internal energy of a body, only if it produces a NET transfer.”
DREMT says:
“Nate is talking nonsense, again”
Can you explain why and how this could be nonsense?
It is simply saying that YOU have been claiming to understand Conservation of energy ands 1LOT.
If so, how can my statement be nonsense?
There doesn’t have to be a net transfer of EMR for the internal energy of a body to change, Nate. That’s why it’s nonsense. What do you think happens? The body receives a single transfer of EMR but says, “no, wait – let’s see what’s coming the other way, first?” before its internal energy changes!? Obviously not. The transfer of EMR in one direction induces a change and the transfer of EMR in the other direction induces a change. The overall effect might be the “net” of those changes, but it’s obviously required that both changes happen! You’re acting like the body receives the EMR from both directions, has a little think about what needs to happen, and then the internal energy changes!
> The overall effect might be the “net” of those changes, but
As if Graham D. Warner can’t always resist understanding.
Progress.
“There doesnt have to be a net transfer of EMR for the internal energy of a body to change, Nate.”
Yes, there does. That is exactly what 1LOT and conservation of energy means.
“Thats why its nonsense. What do you think happens? The body receives a single transfer of EMR but says, ‘no, wait“ lets see whats coming the other way, first’? before its internal energy changes!? Obviously not. The transfer of EMR in one direction induces a change and the transfer of EMR in the other direction induces a change. The overall effect might be the ‘net’ of those changes, but its obviously required that both changes happen!”
Interesting to see your thinking evolve, within one paragraph, from irrational disagreement with me to rational agreement.
Yes, that last sentence is nearly correct, the overall effect IS the ‘net’ of those changes, but its obviously required that both changes happen!”.
Because both bodies are emitting and absorbing — they are both changes are happening according to the Laws of Physics.
And cerainly that is what underlies the Eli solution.
“Youre acting like the body receives the EMR from both directions, has a little think about what needs to happen, and then the internal energy changes!”
Both BP and GP emit and receive simultaneously. No need for your bizarre notion that the bodies need to be ‘thinking about it’.
The RHTE gives the correct Q precisely because both changes happen.
“Because both bodies are emitting and absorbing — they are both changes are happening according to the Laws of Physics.”
So, Nate is back to unequivocally agreeing with me that a single transfer of EMR can change the internal energy of a body, with no conditions or exceptions. Great! I don’t know why he keeps chopping and changing!
That’s the issue settled in my favour, then.
Thats plainly not what that sentence says, scumbag.
Wow, one semi-serious post, then right back to trolling.
I’m not trolling at all, Nate. Will you follow along?
I wrote, from the POV of how you see things:
“The transfer of EMR in one direction induces a change [in the body’s internal energy] and the transfer of EMR in the other direction induces a change. The overall effect might be the “net” of those changes, but it’s obviously required that both changes happen!”
You agreed that it was indeed the way you saw it:
“Yes, that last sentence is nearly correct, the overall effect IS the ‘net’ of those changes, but it’s obviously required that both changes happen! Because both bodies are emitting and absorbing — they are both changes are happening according to the Laws of Physics. And cerainly that is what underlies the Eli solution.”
So, there you have it. You agreed that as you see it, each individual transfer of EMR induces a change in the internal energy of the body. So, no exceptions, no conditions, a single transfer of EMR can change the internal energy of a body.
Gosh this is hard work, isn’t it?
““Yes, that last sentence is nearly correct, the overall effect IS the ‘net’ of those changes, but it’s obviously required that both changes happen! Because both bodies are emitting and absorbing — they are both changes are happening according to the Laws of Physics. And cerainly that is what underlies the Eli solution.”
So, there you have it.”
What we have here is you agreeing with the FACT that it is the NET of the exchange of EMR between bodies.
And thst is what I have been saying all along, and is not nonsense, as you claimed.
For example, from Team Science’s POV, ie the Laws of Physics, with both plates at 244 K, the NET of the EMR exchange is 0. Which agrees with the RHTE.
Then this exchange, which idls the heat flow, on its own, cannot change the Internal energy of either plate.
But when we consider the other exchanges with the plates, from the Sun and to space, THEN we find that the Internal energy of the plates does change.
So what does that do for you?
“What we have here is you agreeing with the FACT that it is the NET of the exchange of EMR between bodies.”
Erm, no Nate. It is not the case that only the net of the exchange of EMR between bodies induces a change in internal energy. As you yourself have agreed, a single transfer of EMR can induce a change in internal energy in a body.
And, that settles the issue in my favour.
“Erm, no Nate. It is not the case that only the net of the exchange of EMR between bodies induces a change in internal energy. As you yourself have agreed, a single transfer of EMR can induce a change in internal energy in a body.”
False. I am not interested in playing any more semantic games.
The concept of conservation of energy is simple: all energy counts and must be counted to find the change in energy in a body.
If energy flows into a body that counts as +
If energy flows out of a body that counts –
NET means count both in and out. It is absolutely the case that only the NET = the change in Internal Energy of the body.
“And, that settles the issue in my favour.”
This could not be further from the truth.
Another credibility killer.
I’m not playing semantic games. As I explained here:
https://www.drroyspencer.com/2026/06/uah-v6-1-global-temperature-update-for-may-2026-0-53-deg-c/#comment-1748221
you’ve agreed that a single transfer of EMR can change the internal energy of a body.
And, as I showed months ago, in your 262 K…220 K solution, the “back-radiation” transfer builds up internal energy in the BP at the expense of the GP.
Ever since then, you’ve been trying to wriggle out of it. You’re the one playing games.
We’re done, forever. You’re a child that can’t concede.
“you’ve agreed that a single transfer of EMR can change the internal energy of a body.”
Again, you shamelesSly leave out my caveat.
My point is ALL energy flows count and must be included to find the NET. And the Conservation of Energy law says that the NET =the change in Internal Energy.
Sure, if there happens to be only one nonzero EMR transfer, then that IS the NET transfer.
But your line of argument here is obfuscatory. Its intent is justify isolating one EMR and FALSELY claiming IT =Internal Energy Change of a body, and thus is acting like HEAT.
As you plainly do here:
“And, as I showed months ago, in your 262 K…220 K solution, the “back-radiation” transfer builds up internal energy in the BP at the expense of the GP.”
When you properly include the forward radiation transfer, we find that the NET transfer is always from BP to GP.
And because NET EMR transfer = Internal Energy Change in the BP, it the exchange with the GP, cannot mathematically build up internal energy in the BP.
It is the net gain in HEAT to the BP due to the heat source and reduced heat loss that causes the buildup and warming.
Only your misreprsentation of 2LOT has any problem with this.
Nate, if both transfers “forward” and “back” count, as you say, then you’re accepting that a single transfer of EMR can change the internal energy of a body. You still don’t understand how simple this all is. You’re always claiming I’m “shamelessly” this and “obfuscating” that. The truth is, I’m keeping it as simple as possible, and you are endlessly obfuscating.
If both transfers “forward” and “back” count, then obviously you should accept that the “back-radiation” transfer changes the internal energy of the BP, and the GP.
Essentially, instead, what you’ve been trying to argue for eight years is to the effect that the “back-radiation” transfer happens, but somehow doesn’t have any immediate effect on GP or BP! You argue that it only affects them through changes to the RHTE and other such obfuscatory pathways. But, obviously a transfer directly moves energy from one object to another! There’s no getting around it.
If you believe that the “back-radiation” transfer happens to completion, as you do, then obviously that means the internal energy of the BP must increase at the expense of the GP. Relative to if the transfer does not occur to completion (is returned to the GP). You cannot argue against that. And, you usually don’t. You just change the subject.
Just stop it, already. It’s getting so boring.
“If both transfers ‘forward’ and ‘back’ count, then obviously you should accept that the ‘back-radiation’ transfer changes the internal energy of the BP, and the GP.”
Ummm, if the NET transfer is 0, such as with equal temperature bodies, it makes no difference what the back-radiation portion was, there will be NO change in the internal energy.
So to summarize, this statement:
”
“There doesnt have to be a net transfer of EMR for the internal energy of a body to change, Nate.”
is incorrect.
“Essentially, instead, what youvr been trying to argue for eight years is to the effect that the ‘back-radiation’ transfer happens, but somehow doesnt have any immediate effect on GP or BP!”
Not at all. When you fundamentally change a heat transfer problem by adding a plate that blocks the previoud flow of heat, and radiates normally as all bodies must do, then of course heat flows CHANGE, and as a result temperatures change.
You have been trying to argue for 8 years that this totally normal course of events is somehow a violation of the Laws of Physics.
But it is not.
Because a CHANGE in HEAT flow is not the HEAT flow. And thus not a 2LOT violation.
“If you believe that the ‘back-radiation’ transfer happens to completion, as you do”
I don’t know what ‘to completion’ means, but yes back-radiation happens. It is a FACT of nature that even YOU have to live with. You can’t wish it away. Instead you have to deal with it, and make an effort to understand its unavoidable consequences.
“then obviously that means the internal energy of the BP must increase at the expense of the GP.”
This is your SPIN, which is obvioysly not how physics explains this. The BP warms SIMPLY because it has a steady heat source, and the GP reduces its HEAT LOSS to space. 1LOT in action. Just as any coat or blanket can do for a person.
And in 8 years you have never factually refuted this.
“Relative to if the transfer does not occur to completion (is returned to the GP). You cannot argue against that. And, you usually dont. You just change the subject.”
Again, a CHANGE in HEAT flow is totally expected when you change the geometry of heat transfer problem!
But a CHANGE in HEAT flow is not the HEAT flow. The actual HEAT flow continues to be from hot to cold.
I dont why you would think otherwise
Without the GP present, the BP has 200 W/m^2 of heat loss on its right side. If the GP is brought in at 244K, the BP has 0 W/m^2 Heat Loss on its right side.
That is a CHANGE in HEAT LOSS from the BP of -200 W/m^2. But is the HEAT flow now from cold to hot.
NO!
If you think otherwise, FIND A 2LOT DEFINITION that says a CHANGE in HEAT FLOW from cold toward hot (ie a reduction in heat flow from hot to cold) is not allowed.
“Just stop it, already. Its getting so boring.”
You first. Stop responding. And stop bringing up and promoting this absurd illogical theory.
Nate quotes me: “If both transfers ‘forward’ and ‘back’ count, then obviously you should accept that the ‘back-radiation’ transfer changes the internal energy of the BP, and the GP.”
and responds:
“Ummm, if the NET transfer is 0, such as with equal temperature bodies, it makes no difference what the back-radiation portion was, there will be NO change in the internal energy.”
He’s already missed the point. As he sees it, both “forward” and “back” transfers occur to completion. Just because overall their effects cancel does not mean the “back-radiation” transfer doesn’t change the internal energy of the body. Of course it must, as he’s agreed the transfer happens. The only reason there is no overall or final change In internal energy is because the “forward” transfer also happens. As he should see it, both transfers are happening and thus changing the internal energy of the body, just in opposite ways. The point is, the “back-radiation” transfer still changes the internal energy of the body.
Same as in the GPE. The “back-radiation” transfer, in his 262 K…220 K solution, builds up internal energy in the BP at the expense of the GP. Just because the “forward” transfer is also happening, doesn’t change that fact.
I don’t know how to make this any clearer. The “back-radiation” transfer, if occurring to completion, as in his 262 K…220 K solution, is building up internal energy in the BP at the expense of the GP, and thus, according to the 1LoT equation, is acting as a flow of heat from cold to hot. Just because there is also an opposing flow, doesn’t change that fact.
I’m not going to stop, because I’m correct.
No DREMT 9:48 am, there is no hope for DREMT’s GPE solution to be correct when violating the 2LOT eqn. as already explained many times in this thread.
> Just because overall their effects cancel does not mean the “back-radiation” transfer doesn’t change the internal energy of the body.
So in the end, it’s the same “second by second” bullshit.
Graham D. Warner should get better material.
You can tell they’ve finally got the message when Nate goes silent and the two trolls are brought in.
No, Willard, it’s nothing to do with “second by second”. Think of it this way – if either one of the transfers (“forward” or “back”) didn’t happen, overall the internal energy would change. Thus we know the transfers are “doing something” to the internal energy even though they cancel in this scenario.
Or, think of a bathtub being filled at the same rate as it drains through the plughole. The level remains the same over time but the reality is, it’s both filling and draining, just at the same rate.
All simple enough to understand.
“The only reason there is no overall or final change In internal energy is because the “forward” transfer also happens. As he should see it, both transfers are happening and thus changing the internal energy of the body, just in opposite ways. The point is, the “back-radiation” transfer still changes the internal energy of the body.”
So this whole line of argument comes down to a philosophic distinction without a different result.
Then we should agree that If interested in finding the change in internal energy of the body we simply needs to look at the NET transfer of EMR between them. Which is the HEAT transfer. And this satisfies 1LOT.
Ok, then.
Astute readers can recognize that when Graham D. Warner says:
it’s all about “second by second” bullshit. Graham might not recognize that he’s appealing to some transitory state that happens between measurement of the net effect.
Nine years is a short time in a crank’s life.
“Same as in the GPE. The “back-radiation” transfer, in his 262 K…220 K solution, builds up internal energy in the BP at the expense of the GP. Just because the “forward” transfer is also happening, doesn’t change that fact.”
Umm, as you clearly noted above, it cancels it.
Thus no buildup results from the GP/BP exchange.
Again, only with the Heat source and reduced heat loss produces the buildup.
This should not be controversial.
“I don’t know how to make this any clearer.” Yep.
“The “back-radiation” transfer, if occurring to completion, as in his 262 K…220 K solution, is building up internal energy in the BP at the expense of the GP, and thus, according to the 1LoT equation,”
No, quite the opposite. 1LOT says look at the NET exchange to find the change in Internal Energy. En route to 262 K, the NET exchange is clearly always from BP to GP.
This is irrefutable with ordinary logic and math.
“is acting as a flow of heat from cold to hot. Just because there is also an opposing flow, doesn’t change that fact.”
Weird. Of course it does change the result!
With a HEAT flow, there is a NET transfer of energy from one body to another. Definitely not the case here.
Instead, what is happening is the forward and back transfers initially cancel (as you state above), but dont forget the steady HEAT flow from the sun. It can now produce the build up in the BP.
And from then en route to 262K the forward transfer becomes larger than the back. Then the buildup slows and finally stops at 262 K.
Nate quotes me:
“Same as in the GPE. The “back-radiation” transfer, in his 262 K…220 K solution, builds up internal energy in the BP at the expense of the GP. Just because the “forward” transfer is also happening, doesn’t change that fact.”
and stupidly states:
“Umm, as you clearly noted above, it cancels it.”
That’s not what I mean, and you know it.
We’ve been discussing, for years now, two scenarios. One where the “back-radiation” transfer does not go to completion (is returned to the GP) and the plate temperatures are 244 K…244 K. And, another scenario where the “back-radiation” transfer does go to completion, and the plate temperatures are 262 K…220 K. Does that not speak for itself!? The only difference is the “back-radiation” transfer. The effect of the transfer in the GPE is self-evident. Just because the “forward” transfer is also happening, does not change that fact! That forward transfer is happening in both scenarios.
And, stop pretending that 1LoT specifies “NET” transfer. It does no such thing. The equation links any change in internal energy of a body to heat transfer (in absence of work). That’s all. So, because the “back-radiation” transfer builds up internal energy in the BP at the expense of the GP, it’s acting as a transfer of heat from cold to hot.
According to DREMT, in the GPE sometimes the EMR is “acting as a transfer of heat” then sometimes the EMR must be “acting as a transfer of cold”. Here, only DREMT is able to tell readers the difference in EMR acting. However, in physics, EMR only acts as EMR.
There are no words DREMT can dream up to defeat the 2LOT eqn. so DREMT’s GPE solution remains incorrect; Eli’s GPE solution complies with 2LOT eqn. so is correct.
There are no words Ball4 can dream up to defeat the 1LoT eqn. so Eli’s GPE solution remains incorrect; Ball4’s endlessly repeated, but never substantiated, assertions about the 2LoT eqn. can therefore be dismissed as the mindless prattle they are. Proven liar and notorious climate troll Ball4 need never respond to me again.
“Nate quotes me:
“Same as in the GPE. The “back-radiation” transfer, in his 262 K…220 K solution, builds up internal energy in the BP at the expense of the GP. Just because the “forward” transfer is also happening, doesn’t change that fact.”
and stupidly states:
“Umm, as you clearly noted above, it cancels it.”
That’s not what I mean, and you know it.”
No I dont. You said they cancel. Im taking you at your word.
“We’ve been discussing, for years now, two scenarios. One where the “back-radiation” transfer does not go to completion (is returned to the GP) and the plate temperatures are 244 K…244 K. And, another scenario where the “back-radiation” transfer does go to completion, and the plate temperatures are 262 K…220 K. Does that not speak for itself!? The only difference is the “back-radiation” transfer.”
As I noted above, but you ignored, we KNOW that every body radiates according to its temperature and emissivity. And every blackbody absorbs all radiated flux that hits it. These are FACTs of how nature operates.
You dont get to tell nature not to do what it always does.
So it is not useful or convincing to compare a situation where nature does those things that it must do, to the situation where it does not do what it must do.
That us a waste of time.
It is only useful to talk about the GP being there, being opaque, and transferring EMR to the BP, and the consequences of that, vs. It not being there
“The effect of the transfer in the GPE is self-evident. Just because the “forward” transfer is also happening, does not change that fact! That forward transfer is happening in both scenarios.”
You are not making any sense.
What it changes is that it makes the NET transfer of energy from the BP zero. Without a NET transfer of energy, there is no way for this transfer to build up anything.
If you still claim it does, this is you simply being stupid.
“And, stop pretending that 1LoT specifies “NET” transfer. “It does no such thing”
Sorry that its a fact. No pretending neccessary.
“The equation links any change in internal energy of a body to heat transfer (in absence of work). That’s all.”
Fully agree. And radiative HEAT transfer is the NET transfer of energy by EMR given by the SB law, as the RHTE clearly states.
There are countless easily found sources that show that is what radiative heat transfer means.
You offer no actual source that claims otherwise. . So you are wrong.
“So, because the “back-radiation” transfer builds up internal energy in the BP at the expense of the GP, it’s acting as a transfer of heat from cold to hot.”
Pure fantasy from a non-expert on Thermodynamics.
Why should any reader believe that?
To convince anyone of this, SHOW a proper source that uses ‘acting like heat’ in a actual statement of 2LOT.
If you cannot, then it is unsupportable nonsense.
“No I dont. You said they cancel. Im taking you at your word.”
Nate, you can’t follow complex discussions. You raised a scenario in which two objects were at the same temperature and I was explaining that from your POV (or your way of understanding it) the two transfers would both go to completion and thus cancel. But, the point was that both transfers have to actually happen, in other words affect the internal energy of the bodies, in order for that to occur. It’s just each transfer affects the internal energy in the opposite way to the other.
Fundamentally, though, a single transfer of EMR always affects the internal energy of the bodies! That’s what a transfer is, it’s what it means, that energy is moved from one body to the other. “Transferred”.
I’m not responding in full to your comments because every response you make starts with a mistake or misrepresentation then spirals away from there completely out of control. You’re also chopping up my responses to such an extent, and taking each sentence or even sentence fragment out of context from the rest so completely, that you’re removing all meaning from what I’m saying.
If you just go back and read my comments in full, calmly, and without knee-jerk responding to them, you’ll understand what I’m saying.
> There are no words Ball4 can dream up to defeat the 1LoT eqn. so Eli’s GPE solution remains incorrect
Graham D. Warner attributes too much power to B4.
Eli’s thought experiment remains undefeated by Sky Dragon cranks:
https://rabett.blogspot.com/2018/08/the-simplest-green-plate-effect.html
Not that he disagrees with anything in that post.
But but but but but but but but but but but but but but but but but but but but but but but but but but but but but but but but but but but but but but but but but but but ….
“As I noted above, but you ignored, we KNOW that every body radiates according to its temperature and emissivity. And every blackbody absorbs all radiated flux that hits it. These are FACTs of how nature operates. You dont get to tell nature not to do what it always does. So it is not useful or convincing to compare a situation where nature does those things that it must do, to the situation where it does not do what it must do. That is a waste of time.”
Firstly, blackbody objects do not exist in nature, so your entire line of reasoning here is a bust. But, secondly, and perhaps even more importantly, you’re just seeking excuses to avoid acknowledging the obvious. Have you ever actually disputed that the plate temperatures would be 244 K…244 K if the “back-radiation” transfer were returned to the GP? No. You just dispute that it could be returned. 244 K…244 K is right, though, if the transfer is returned. So, the important point is, it’s self-evident that the effect of the “back-radiation” transfer is to make the difference between the plates being 244 K…244 K or 262 K…220 K. You can’t argue with that, so you keep trying to sidestep it completely.
“I’m not responding in full to your comments because every response you make starts with a mistake”
Well, the crucial points that you avoud responding to is this:
“ radiative HEAT transfer is the NET transfer of energy by EMR given by the SB law, as the RHTE clearly states.
There are countless easily found sources that show that is what radiative heat transfer means.
You offer no actual source that claims otherwise. . So you are wrong.
“So, because the “back-radiation” transfer builds up internal energy in the BP at the expense of the GP, it’s acting as a transfer of heat from cold to hot.”
Pure fantasy from a non-expert on Thermodynamics.
Why should any reader believe that?
To convince anyone of this, SHOW a proper source that uses ‘acting like heat’ in a actual statement of 2LOT.
If you cannot, then it is unsupportable nonsense.
“Firstly, blackbody objects do not exist in nature, so your entire line of reasoning here is a bust.”
This only serves to demonstrate your ignorance of this subject.
With real materials, the only difference is the emissivity cha ges from 1 to say 0.95. Then the heat flows are simply reduced by 5%.
Hardly a bust!
“But, secondly, and perhaps even more importantly, you’re just seeking excuses to avoid acknowledging the obvious. Have you ever actually disputed that the plate temperatures would be 244 K…244 K if the “back-radiation” transfer were returned to the GP? No. You just dispute that it could be returned. 244 K…244 K is right”
And that is quite sufficient!
If your argument requires the Laws of Physics to be ditched, its WRONG.
Simple as that.
I dont know why you have trouble understanding this.
Nate, you’re focusing on the phrase, “acts as a transfer of heat from cold to hot”. I explain in this comment what “heat” is and thus why that phrase is necessary:
https://www.drroyspencer.com/2026/06/uah-v6-1-global-temperature-update-for-may-2026-0-53-deg-c/#comment-1747295
No special definition of 2LoT required. Just the normal idea that heat only flows from hot to cold in absence of any work performed on the system.
The 1LoT equation supports my understanding of what “heat” is, as shown in the linked comment. Since the “back-radiation” transfer affects the internal energy of both bodies in the way that it does it’s acting as a flow of heat from cold to hot. As explained, I cannot just say it is a transfer of heat from cold to hot since “heat” is defined as a transfer of thermal energy from hot to cold! I’m simply trying to be fair and accurate with the language I’m using. I’ll just say it’s a transfer of heat from cold to hot if that’s simpler?
I’d said:
“You can’t argue with that, so you keep trying to sidestep it completely.”
Nate comes in with his second response to me today and immediately proves me right about that! He’s still trying to sidestep the argument completely.
“No special definition of 2LoT required. Just the normal idea that heat only flows from hot to cold in absence of any work performed on the system.”
Interestingly you dont quote 2LOT. Its statements are explicitly about HEAT flowing from hot to cold.
There is no statement in 2LOT that agrees with your opinion that that the 1-way EMR should count as HEAT.
You cannot find a textbook example of a 2LOT violation of the kind you imagine occurs here.
Because HEAT is understood by everyone but you, to be the NET transfer of thermal energy.
When we use the RHTE to find the Heat transfer between the plates (ie the NET energy transfer), it is always from hot plate to cold plate.
So what you are spinning here is a tall tale that makes no sense, and cannot be supported by any physics source.
And you are not a Thermodynamics expert, and you lack a shred of evidence.
So, seriously, why should anyone believe you?
“The 1LoT equation supports my understanding of what “heat” is, as shown in the linked comment. Since the “back-radiation” transfer affects the internal energy of both bodies in the way that it does it’s acting as a flow of heat from cold to hot.”
Look. Your approach seems to be to compare the situation with and without the back-radiation, and then try to call that difference a HEAT transfer.
But the reality is that difference is simply the CHANGE in Heat flow, between two problems with different geometries.
Is a change in heat flow the heat flow?
Obviously not. And the change leaves the actual heat flow always from hotter body to colder body.
2LOT is not a restriction on the change-in heat-flow when a problem changes.
If you think it is, show us evidence!
7:05 am: “acting as a flow of heat from cold to hot.”
So, the other GPE EMR must be acting as a “flow of cold from hot to cold” & only DREMT can see thru the acting.
No DREMT, EMR only acts as EMR in physics. Eli’s GPE only has EMR acting as EMR thus Eli got the right GPE answer long ago.
The 1LoT equation is quite clear that, in the absence of work, anything that changes the internal energy of a body must be “heat”.
Not sure why I need any more “evidence” than that equation!?
Meanwhile, both Ball4 and Nate have a serious problem. Their conception of what is a radiative 2LoT violation is such that the cooler body has to emit more than the warmer body, violating the SB Law as well! Let’s see them pony up some evidence from a textbook that this is the only way 2LoT can be violated, radiatively.
And so our Troll-in-Chief once again shows that he interprets heat as something bodies contain.
DREMT 10:35 am is not sure but physics is sure since the 1LoT equation is quite clear that, in the absence of work, the internal energy of a system can change by virtue of a temperature difference between it and its surroundings thru conductive, convective, or radiative energy transfer.
In physics, EMR is not heat and EMR only ever acts as EMR. Thus, Eli’s GPE solution is correct.
DREMT 10:35 am, no need to pony up some evidence from a textbook that this is the only way 2LoT can be violated, radiatively since the 2LOT eqn. can never be violated in a real process such as the GPE where Eli’s solution complies with the 2LOT eqn. that bill linked in MIT text and I already showed DREMT how to substantiate it.
“The 1LoT equation is quite clear that, in the absence of work, anything that changes the internal energy of a body must be “heat”.”
Well, no only heat is heat, which is the NET energy transferred.
Dont see how you could possibly think that if the NET of forward and back transfer is 0, that any change in internal energy could result!
I dont believe you are that stupid.
Meanwhile, is the CHANGE in heat flow tge heat flow?
Willard and Ball4 shamelessly troll while Nate fails to provide the evidence requested, and continues to wallow in his denial about what the 1LoT equation shows.
Another easy win for me. The GPE’s debunked.
> Dont see how you could possibly think that if the NET of forward and back transfer is 0, that any change in internal energy could result!
Think of it “second by second”, Nate.
Yes, Graham D. Warner is that stupid.
As the insults start coming in, we know the GPE’s debunked.
Astute readers can see what I mean.
Can they? Usually it’s not remotely clear what you’re on about.
Astute readers can certainly recognize more gaslighting by Graham D. Warner.
“Gaslighting is a form of psychological and emotional abuse where one person manipulates another into questioning their own memory, perception of reality, or sanity. The ultimate goal is to gain power, control, or an advantage by forcing the victim to become entirely dependent on the perpetrator’s version of the truth.”
So, no. I haven’t done that.
Astute readers can recognize Graham D. Warner returning to Step 1 – Pure Denial.
DREMT,
You are the only one here that has been unable to provide evidence to support your claims.
You offer no valid sources that interprets 1LOT or 2LOT the way you do.
Neither LAW is concerned with one-way EMR flows that are NOT HEAT.
Therefore no, you have not debunked anything, except your own credibility.
Find a new cause.
Willard is your classic, stereotypical, run-of-the-mill troll. The only thing that sets him apart from the pack is just how deeply, disturbingly obsessed with me he is.
Graham D. Warner must be humoring astute readers once more.
They know how that usually goes:
https://www.youtube.com/shorts/XT_0sn1Er7Q
Sorry, Nate, but you’re wrong and I’m right.
The GPE’s debunked, and I’ll continue to say so long after you’re dead and gone.
DREMT, your demanding of negative evidence of a 2LOT violation that occurs as you claim.
You are confused about the burden of proof here.
It is entirely your burden to prove your assertion that Eli’s solution violates 2LOT.
It is sufficient for us to show that you provided no evidence.
2LOT in this situation constrains the HEAT to flow from warmer bodies to colder bodies.
In no part of Elis process is heat flowing from colder body to warmer. You offer no actual evidence of that.
At the solution temperatures 262K/220K, the energy flows for each plate balance, as you agree, showing that this is the equilibrium.
It is quite easy for us to find the HEAT flows at any temperatures away from equilibrium, and calculate them with normal basic laws of physics.
At no temperatures of the BP or GP does HEAT flow from colder to warmer.
You have not met the burden of proof.
Your claim is wrong.
QED
1) If the “back-radiation” transfer (transfer from GP to BP) is not permitted to occur, the plate temperatures will be 244 K…244 K at equilibrium.
2) If the “back-radiation” transfer is permitted to occur to completion, the plate temperatures will be 262 K…220 K.
3) The above two points demonstrate that the “back-radiation” transfer is solely responsible for the difference between the plates being 244 K…244 K and the plates being 262 K…220 K.
4) That means the “back-radiation” transfer is effectively increasing the temperature of the BP by 18 K, and reducing the temperature of the GP by 24 K. This could be clearly seen if the GP were introduced at 244 K.
5) Which in turn means that the “back-radiation” transfer is building up internal energy in the BP at the expense of the GP. Per the 1LoT equation, in the absence of work, any transfer leading to a change in internal energy of a body is a transfer of “heat”. So, the “back-radiation” transfer is acting as a transfer of “heat” from cold to hot, violating 2LoT.
QED.
The GPE’s debunked.
Where is your evidence to support these claims?
You never have any. Therefore they are debunked.
You get no credit for mindlessly repeating illogical, debunked claims.
This is what a bot does.
Are you a bot?
DREMT 4:11 pm writes: “So, the “back-radiation” transfer is acting as a transfer of “heat” from cold to hot.”
No, EMR is not heat. EMR only acts as EMR in the GPE vacuum of space. Plus DREMT’s words don’t comply with the substantiated 2LOT eqn. in bill’s own MIT textbook so there is no hope they are correct.
Eli’s GPE solution remains correct as it does comply with bill’s own MIT textbook source.
“Where is your evidence to support these claims?”
What “claims”!? It’s an argument, Nate. A chain of logic, that you cannot refute. The points 1) – 5). I can summarise my argument neatly into these five points and it debunks your 262 K…220 K solution, and you have nothing to say against it. You’ve had no response to this argument since I first made it, back in January! You talk endlessly about the 244 K…244 K solution, you talk endlessly about “reduction of heat loss”, but you’ve got nothing against the actual argument that debunks the 262 K…220 K solution.
“What “claims”!? It’s an argument, Nate. A chain of logic, that you cannot refute.”
Sure, so long as the many refutations of these ‘arguments’ and ‘logic’ never happened.
Just like your ‘one-way EMR counts as HEAT’ fallacy, your one-way assertions cannot be isolated from their rebuttals to claim you won an argument.
They have convinced no one, are full of illogical contradictions, provide no expert sources to support them, and and require the rejection of established Laws of Physics.
And unable to answer the key question: Why should anyone believe you?
You’ve never refuted the argument, Nate. In fact, I don’t believe I’ve ever even seen you address it. But, I can summarise my argument simply enough. If you believe you’ve addressed my argument before, you should be able to write an equally concise rebuttal. Off you go.
Your premise is that a CHANGE in HEAT flow, when the GP is brought in, is a Heat flow.
That is not the case.
It is sufficient for us to show that you provided no evidence.
2LOT in this situation constrains the HEAT to flow from warmer bodies to colder bodies.
To show that 2LOT is violated YOU have the burden to show evidence that the 2LOT constraint is not met.
In no part of Elis process do you show heat flowing from a colder body to warmer.
You offer no actual evidence of that.
At the solution temperatures 262K/220K, the energy flows for each plate balance, as you agree, showing that this is the equilibrium.
It is quite easy for us to find the HEAT flows at any temperatures away from equilibrium, and calculate them with normal basic laws of physics.
At no temperatures of the BP or GP do we find HEAT flow from colder to warmer.
So what have you got to show that the constraint of 2LOT is not met?
Nothing!
You have not met the burden of proof.
Your claim is wrong.
Eli’s thought experiment remains unrefuted:
https://www.drroyspencer.com/2026/06/uah-v6-1-global-temperature-update-for-may-2026-0-53-deg-c/#comment-1746897
Go Team Science!
See? Nate simply cannot rebut the argument!
A couple of major problems for Nate:
a) He has no rebuttal to my points 1) – 5), so the argument stands.
b) His conception of a radiative 2LoT violation is so absurd he should immediately question all his beliefs. Of course, he never will.
The GPE’s debunked.
“a) He has no rebuttal to my points 1) – 5), so the argument stands.”
False. Pay attention and respond to recent rebuttals.
“b) His conception of a radiative 2LoT violation is so absurd he should immediately question all his beliefs. Of course, he never will.”
Not at all. My conception is abundantly clear and consistent, that if heat always flows from the warmer body to the colder, then 2LOT is satisfied.
2LOTs constraint above is satisfied by Elis solution, then there can be no 2LOT violation.
Sorry, you dont get to dream up new 2LOT constraints on the 1-way EMR transfers, that are found nowhere in any real definition of 2LOT.
A lack of such evidence or logic or facts means YOUR assertion of a 2LOT violation in Elis solution is proven absolutely FALSE.
It really is that simple.
Im sorry that you lose that particular argument.
You will undobtedly keep repeating the proven false claim, while continuing to provide no evidence, and thereby destroying altogether your credibility.
What “recent rebuttals”!? You’re simply lying, Nate.
And, your conception of what constitutes a radiative 2LoT violation is that the cooler object has to emit more than the warmer object, thus also violating the SB Law! Absolutely ridiculous.
Wake up.
“And, your conception of what constitutes a radiative 2LoT violation is that the cooler object has to emit more than the warmer object, thus also violating the SB Law! Absolutely ridiculous.
Wake up.”
You just get caught up in and fixated on weird ideas. Then due to a miswiring in your brain, these strange ideas end up in the ‘facts’ department.
In the real world there are no 2LOT violations.
If the other laws of physics are satisfied then so is 2LOT!
You and only you have invented this strange notion that there must be a way to violate 2LOT while satisfying the other Laws.
That is not the case!
In our problem, 2LOT simply constrains the HEAT to flow from warmer bodies to colder bodies.
And it always does in Elis solution.
Why? Because his solution is derived from and satisfies the other Laws: SB law, 1LOT, the RHTE, Kirchhoffs Law.
Thus the heat flows always correctly down the temperature gradient. And 2LOT is naturally satisfied.
There is NO constraint in 2LOT on the 1-way EMR transfers.
How could there be given that they are found by the SB law and Kirchhoffs Law?
If you still believe 2LOT constrains the 1-way EMR transfers, SHOW US A SOURCE!
Lacking that, we can safely dismiss your claims of a 2LOT violation.
What recent rebuttals!? You’re simply lying, Nate.”
Plenty to choose from:
https://www.drroyspencer.com/2026/06/uah-v6-1-global-temperature-update-for-may-2026-0-53-deg-c/#comment-1748286
https://www.drroyspencer.com/2026/06/uah-v6-1-global-temperature-update-for-may-2026-0-53-deg-c/#comment-1748258
https://www.drroyspencer.com/2026/06/uah-v6-1-global-temperature-update-for-may-2026-0-53-deg-c/#comment-1748286
https://www.drroyspencer.com/2026/06/uah-v6-1-global-temperature-update-for-may-2026-0-53-deg-c/#comment-1748289
https://www.drroyspencer.com/2026/06/uah-v6-1-global-temperature-update-for-may-2026-0-53-deg-c/#comment-1748302
My rebuttals are all there. You just choose not to deal with them.
“I’m not responding in full to your comments because..’ of various flimsy excuses.
Nate, you can’t see how silly it is that in your head, to violate 2LoT, the cooler object has to emit more than the warmer object! That’s not a “me” problem, that’s a “you” problem.
As for the one-way EMR transfers, my “source” is the 1LoT equation. In the absence of work, any transfer affecting the internal energy of a body must be acting as a transfer of heat. That’s simply what the equation says! Change in internal energy = heat. Why should one-way EMR transfers be exempt from this logic? You have no valid reason. It’s simply something you’ve been taught to believe. And, you can’t think outside that box. Again, that’s a “you” problem, not a “me” problem.
“Nate, you can’t see how silly it is that in your head, to violate 2LoT, the cooler object has to emit more than the warmer object! That’s not a “me” problem, that’s a “you” problem”
Bizarre that you think its ‘silly’ to take 2LOT statements literally.
In our problem 2LOT constrains HEAT to flow from warmer bodies to colder bodies.
Thats it.
I explained it clearly above. Quote parts you disagree with and why.
Nate, none of your linked comments actually rebut my points 1) – 5). And, two of the links go to the same comment.
“Nate, you can’t see how silly it is that in your head, to violate 2LoT, the cooler object has to emit more than the warmer object! That’s not a “me” problem, that’s a “you” problem.”
As opposed to what? Clarify when you think a 2LOT violation occurs.
Is it a 2LOT violation when heat flows from the hot body to the cold body, but a one-way EMR flows from th cold body to the hot?
Explain that.
OMG, Nate, what will bring this discussion to a close?
Jesus wept.
This is your reaction when you encounter yet another question that you just cant answer with sound reasoning.
This ends when you wizen up and realize that your narrative is truly indefensible, and stop defending it.
No, Nate. Far from it. Your question simply indicates you are either pretending not to understand, or somehow still genuinely do not understand, my position. Either way, I don’t see the point in continuing. What will it be once this question’s answered? You’ll just move onto something else.
You’re a waste of time.
https://www.drroyspencer.com/2026/06/uah-v6-1-global-temperature-update-for-may-2026-0-53-deg-c/#comment-1747959
As I said earlier, Nate – we’re done, on this subject, forever. You’re a child that can’t concede.
“we’re done, on this subject, forever.”
Great, so long as you stop bringing it up and defending it.
As in this thread, whenever somebody else brings up the GPE, I’m going to link to the debunking. You don’t have to respond, Nate. It’s your choice to make it a 30-day back-and-forth.
“You’re a child that can’t concede.”
Just like with Donald Trump, with you every accusation like this is a confession.
Incorrect, Nate. I’ve conceded points before. You’re pathologically incapable of conceding anything. You still haven’t even conceded you were wrong about your claimed contradiction!
“Great, so long as you stop bringing it up and defending it.”
DREMT says:
July 13, 2026 at 3:25 PM
As in this thread, whenever somebody else brings up the GPE, I’m going to link to the debunking. You don’t have to respond, Nate. It’s your choice to make it a 30-”
Bwa ha ha ha..
Obvioysly you cant stop bringing it up and defending it here, there and everywhere.
This is just your excuse to evade answerinh my simple to-the point-question:
If a HEAT is flowing from a warmer body to a colder one, then how is the one-way EMR from the cold body to the warm body a 2LOT violation?
Then how are there not constantly 2LOT violations going on in the world.
This is the kind of absursity thst your narrative produces.
If I answer your question, do you promise you will stop responding to me?
bill, as I’ve commented go to Chapter 1 Entropy Production in DREMT’s MIT Textbook to understand why there is no hope for DREMT’s GPE equilibrium to be correct. It’s not as easy to understand as Chapter 4 eqn. 4.59 in climate MIT Textbook.
After claiming we are done, you are continuing to respond to me elsewhere when I am addressing Bill.
You are clearly not tired of this subject and pushing your false narrative elsewhere.
So what’s the point?
You are just frustrated with that your arguments fail to convince me, and keep creating contradictions
Your belief that I, a physicist, would concede that the Laws of Physics should be altered, reinterpreted, or ditched altogether, as you require just to get your desired outcome for the GPE, is quite delusional and bonkers.
You addressed bill and I responded with a simple link to a previous comment, because it seemed silly you were again pursuing a faulty line of reasoning that I had already spent months correcting! I’m saying we’re done because I don’t intend discussing this properly with you ever again. You don’t concede anything, so progress is impossible. I know you will not stop hounding me, if I discuss it with somebody else, so in future you may just get links to previous comments or me just politely asking you to butt out. I’m sure whatever I do you will take advantage of to the fullest extent possible.
Graham D. Warner’s maturity is still too low.
I’m being as mature as I can be when talking to children.
“faulty line of reasoning that I had already spent months correcting!”
Months?
Translation:
You refused to apply what you claimed to understand during that period about 1LOT, about heat loss being reduced by blackbody plates, etc to come to the logical conclusion that there is a perfectly sound reason for the BP to warm and the GP to cool!
Thus, you spent months getting stuck in one contradiction after another.
OK, weeks. Maybe a couple of months. You pointed out no contradictions that withstood scrutiny, and my argument hasn’t changed in eight years. All that’s happened is, you’ve finally begun your glacially slow process of learning what that argument actually is.
But, I don’t have the patience to deal with you slooooooooowly coming to understand my argument over how ever many years it’s going to take you to get it. You can do that in the background, by yourself, while I talk to more intelligent, rational people.
”
But, I don’t have the patience to deal with you slooooooooowly coming to understand my argument over how ever many years it’s going to take you to get it. You can do that in the background, by yourself, while I talk to more intelligent”
You again act, comically, as if we need to ‘discover’ the hidden brilliance of your argument.
I understood long ago that your argument relies on ditching or altering the laws of physics.
We now see you saying that quiet part out loud.
Nate, I never said the argument was “brilliant”. So…that idea must have come from you. Thanks.
Nothing honest from you, no surprise.
I’m honest, you’re not. Not with me, and certainly not with yourself.
You regularly accuse people of stuff that you make a habit of.
Doshonesty is regularly employed by you in the GPE discusssion.
Lets see how your argument does when you employ only proven facts.
Fact: blackbodies absorb all EMR they recieve.
Fact: Heat transfer between bodies = Net Energy transfer between the bodies.
Fact: In the absence of Work, only Heat transfers can chsnge the Internal Energy of a Body.
Fact: in the absence of Work, 2LOT only constrains Heat to flow from hotter to colder bodies.
Fact: if Heat flows only from hotter to colder bodies, THERE IS NO 2LOT violation.
Fact: you do not get to make-up your own heat transfer facts!
“You regularly accuse people of stuff that you make a habit of.”
No, Nate. You do.
“Dishonesty is regularly employed by you in the GPE discusssion.”
No, Nate. By you, not me.
You know that the above facts are true.
For you to have a blackbody reflect EMR is dishonest, because you know blackbodies dont reflect, EVER.
You know that 2LOT constrains only heat flows. Yet you have it constraining energy flows that ARE NOT HEAT FLOWS.
Dishonest.
Shall I go on?
I’m sure you’ll carry on whatever I say. You’re incapable of shutting up.
When you have no answers, it must be the messengers fault.
I have already given you every answer you could possibly need, multiple times over. You just display invincible ignorance and keep repeating refuted crap indefinitely.
That’s why I’ve already told you, you’re not going to be involved in further discussions. But, you’re still carrying on posting regardless!
“I have already given you every answer you could possibly need, multiple times over.”
Answers that repeatedly contradict established facts are not really answers, are they?
It is your choice to keep baiting people with your ‘GPE is debunked’ lie.
No one is forcing you to keep arguing. You can stop anytime you want.
Sorry, Nate, but the GPE is debunked. If you find reality to be baiting, you need to ask yourself why that is.
We have no interest at this science forum in your religious beliefs.
We only give credit for fact-based arguments here.
Maybe come back when you find one.
You don’t get it, Nate. You’re obviously very insecure in your position. If you went to the very bottom of the comments and started a new thread with, “the GPE remains undefeated”, or something, I wouldn’t feel the need to respond…because I’m secure in my position. On the other hand, if I say, “the GPE’s debunked”, you are triggered. I’m not “baiting” you, Nate. I have no interest in talking to you. I simply want to spread the word that the GPE’s debunked, and you find it triggering every time I say it. You need to ask yourself why. Again, it’s a “you” problem, not a “me” problem.
Barry sums it up well.
“As soon as you reject standard physics you lose the argument. It is a monumental mystery why you don’t get that. I guess standard physics is not a valid yardstick for you. That instantly wipes your views out of contention.”
barry, like you, is very “selective” in what he responds to.
Clint R
Your post is noted but your inability to understand that a cold object’s radiant energy absorbed by a hotter one does NOT violate 2nd Law in any way!! I do believe a wall could grasp basic concepts better than you are able. You are a cult mimd. No evidence facts or logic can help you. I am trying to see if Bill Hunter is as hopeless as you are. So far the ignorants of real science are you, DREMT, Gordon Robertson. I am hoping valid science can alter Bill Hunter’s current contrarian crackpot thinking. I can always hope! You are too far gone though. Nothing will help you! You are too arrogant to consider the possibility you are very wrong in your understanding of heat transfer. Unlike cult people, like you most cetainly are, science minded people follow evidence!! They can change their views when evidence shows they are wrong. This is not a possible state for an arrogant cult mind!
The GPE is debunked, Norman:
https://www.drroyspencer.com/2026/02/uah-v6-1-global-temperature-update-for-january-2026-0-35-deg-c/#comment-1733329
It’s easy to ignore Norman when he’s spewing his usual insults and false accusations. But, as he’s never studied thermodynamics, there’s always a chance I can help him:
The cult has latched onto the concept of a “black body”. They use the concept in their attempt to pervert science to thereby justify their violations of 2LoT. Here’s how they do it:
Step 1: Point out that a “black body” is defined to absorb all frequencies.
Step 2: Point out that the “black body” is used in classrooms to make calculations easier.
Step 3: Now that the concept has been established, twist the concept so that everything is a “black body”.
Step 4: Since everything is now a “black body”, everything can absorb all flux, including a hot object will absorb all flux from a cold object.
Step 5: It now becomes “fact” to children like Norman that “cold” will warm “hot”. The cult has twisted science to support their false beliefs, again.
11:08 am:
Step 1: confirmed by definition
Step 2: confirmed by many college thermodynamic texts
Step 3: unconfirmed nonsense, no real object is a black body though black body radiation exists
Step 4: unconfirmed nonsense, real object reflectivity is never experimentally zero.
Step 5: confirmed, Experiment Results Show a Cool Object Can Make a Warm Object Warmer Still
Thus DREMT’s GPE solution is debunked by experiment and the 2LOT eqn.
Graham D. Warner, Puffman, and Gill keep repeating themselves on and on, even after being beaten cleanly by Team Science.
Only in Gill’s case is this a little sad.
DREMT
i looked at your allrged bebunk but is is not the best logic I have read. Your point that the green plate is warming the blue plate at its expense does not consider the dynamic dituation that the blue plate is receiving continuous 400 watts of energy. In the dynamic case as the GPE any reduction of energy loss will cause the blue plate to increase in temperature. If you had really good insulation on the backside of the blue plate the temperature would rise about 45 K reaching a temp of 289 K. Using your logic, the insulation is heating the blue plate. This is not good sound thinking. Any reduction of heat loss of a heated object will cause its temperature to increase. The green plate reduces the amount of energy lost by the blue plate and so the blue plate temperature increases.
The GPE’s debunked (which of course means the 262 K…220 K solution is debunked).
“Your point that the green plate is warming the blue plate at its expense does not consider the dynamic dituation that the blue plate is receiving continuous 400 watts of energy…”
…Norman is off to a terrible start. That’s completely false. Every single energy transfer is included in the analysis, just in one case you’re looking at all the energy transfers without the “back-radiation” transfer, and in the other case you’re looking at all the energy transfers including the “back-radiation” transfer. That’s how the effect of the “back-radiation” transfer is isolated. By looking at what the plate temperatures are without it, and comparing it to what the plate temperatures are when it is included and goes “to completion”. The analysis proves that in your 262 K…220 K solution, the “back-radiation” transfer builds up internal energy in the warmer Blue Plate at the expense of the cooler Green Plate.
That is not how insulation works, Norman.
12:31 … only in DREMT’s vivid imagination and not in the real experimental world.
DREMT
Your claim the GPE is debunked does not make it so.
“…unconfirmed nonsense, real object reflectivity is never experimentally zero…”
…which is why there are small warming effects observed in the various experiments people try to present as evidence for the GPE. All they are confirming is that radiative insulation functions via reflectivity.
2:33 pm: DREMT finally admits his GPE solution is debunked in the real world as his GPE solution has zero warming effect on the BP inconsistent with 2LOT eqn. & exists only in DREMT’s vivid imagination and not in the real experimental world.
DREMT 2:33 pm confirms he now agrees Experiment Results Show a Cool Object Can Make a Warm Object Warmer Still.
Ball4, try not to be a wildly dishonest sack of human garbage.
The GPE involves perfectly conducting blackbodies. The real world experiments do not. Again, all the real-world experiments do is confirm that radiative insulation functions via reflectivity. In other words, because the real-world objects are reflective (and have thermal resistance) they can insulate. So, you get a small warming effect. You do not get a warming effect in the GPE because the GPE objects are not reflective (and do not have thermal resistance).
GPE = no warming effect.
Real-world experiments = small warming effect.
The real-world experiments do not provide evidence that the GPE is real. Quite the opposite, in fact.
Sky Dragons have been defeated:
https://skepticalscience.com/green-plate-dynamics.html
Thanks for playing, everyone!
Finally correct DREMT 4:38, your imaginary GPE solution per your own admission has no hope of being correct in the real world. In the real world, the GPE solution warms the BP to equilibrium as Eli showed in his 2LOT eqn. compliant GPE solution because in the real world Experiment Results Show a Cool Object Can Make a Warm Object Warmer Still.
NB: Black body radiation is produced by real objects with thermal resistance in the real world so DREMT statements about thermal resistance are without merit & have nothing to do with the GPE as originally stated.
My statements about “thermal resistance” relate only to the fact that perfectly conducting objects have no thermal resistance, while real objects will have some degree of thermal resistance. Google what “thermal resistance” is if you need to, Ball4.
And, please stop being grotesquely dishonest.
Good DREMT 12:34 am, Eli’s original GPE says nothing about perfectly conducting plates. Eli’s solution remains real world while DREMT’s solution is purely imaginary in not complying with the 2LOT eqn. since DREMT’s BP does not increase in temperature as required.
“Ball4 says: Eli’s original GPE says nothing about perfectly conducting plates.”
He doesn’t explicitly say the plates are perfect conductors, but it is implicit in his solution in that both surfaces of the blue plate are presumed to be the same. If they were not perfectly conductive there would be a thermal gradient across the thickness of the plate. This assumption makes the problem more mathematically tractable, but doesn’t change the fundamental physical principle.
DREMT’s alleged solution is still stupid reasons I won’t repeat, but he’s right about this unstated assumption of the problem.
He says they’re perfectly conducting plates in the comments under the original article, Ball4, and ever since then, that’s how they’ve been treated. As you know. Please stop lying.
7:08 am: I never started.
NB: I wrote “original GPE” with the original solution. DREMT’s GPE answer is imaginary and transient so not steady state equilibrium. Comments can and do change things.
Mark B: There is nothing implicit about blackbodies being perfect conductors in their formal definition. In the original GPE, no plate thickness is specified but Eli’s math implies no thermal gradient so that implies thin enough for government work. And right, the real 2LOT eqn. compliant Eli solution is far from DREMT’s admittedly imaginary solution.
https://rabett.blogspot.com/2017/10/an-evergreen-of-denial-is-that-colder.html?showComment=1507945224036#c4948017542973854095
Sorry, Ball4, but saying that you never started lying is just another lie.
DREMT
If you are a rational person who has the ability to think logically, why do you think the blue and green plate would reach the same steady state temerature? They have the same radiant emitting surfaces. The blue plate is receiving 400 watts of energy (assuming one square meter per side) and the green plate is receiving only 200 watts from the blue plate. How do you logically come up with the absurb notion that receiving less energy will then be at the same temperature??? You post a strange graphic that is not based upon any real science to support your stange conclusion. Still not sure what actual science you have studied. Your posts indicate you have very little science background. More like you studied music theory.
Astute readers might take comfort in the idea that Betty Pound might have found her man.
Norman, here is where we are in our discussion:
https://www.drroyspencer.com/2026/06/uah-v6-1-global-temperature-update-for-may-2026-0-53-deg-c/#comment-1746488
I wrote that comment, and you have yet to respond to it. OK? As it stands, you lose.
Willard
I read comments on your link to Eli Rabbet blog. I might be convinced the poster here wo goes by Clint R is the same one who went by Betty Pound on Eli blog. She also thinks if eli is correct it means ice cubes can boil water. This is a signiture point of Clint R. Are they one and the same? Would appear to be.
Clint R obviously lives rent free in Norman’s head.
Just for the record, this is actually the comment from Eli I was referring to:
https://rabett.blogspot.com/2017/10/an-evergreen-of-denial-is-that-colder.html?showComment=1508404424409&m=1#c9132319957148497274
“EliRabett 19/10/17 5:13 AM
Just to concentrate minds. The problem assumes infinitely thin, infinitely large, perfectly conducting, flat plates with two sides.
This is physics, not engineering and such idealizations are common, clarifying and useful for understanding.
Blathering about the shape of the plates, how many sides they have, their thickness, their composition, how close they are to each other, etc are attempts (successful Eli might add) at distraction from the basic physics that the example provides.“
1:13 pm: Just to concentrate DREMT’s mind: only the modified problem in comments may assume infinitely thin, infinitely large, perfectly conducting, flat plates with two sides.
In the originally posted by Eli & correctly solved GPE problem statement, there is no mention of plate thickness, flatness, size, or material; only their color is mentioned & the explanatory graphics.
Why is Ball4 still allowed to comment? I’m not a fan of censorship, but I can make an exception for Ball4. He’s the most dishonest commenter on the blog, and should have been banned years ago.
Norman,
You might also like:
https://www.drroyspencer.com/2026/02/uah-v6-1-global-temperature-update-for-january-2026-0-35-deg-c/#comment-1734529
Norman, you have a comment to respond to:
https://www.drroyspencer.com/2026/06/uah-v6-1-global-temperature-update-for-may-2026-0-53-deg-c/#comment-1746488
Or, you could just concede that the GPE’s debunked.
Norman the GPE is debunked by scientific references and the fact the lot of you can’t come up with any scientific basis to even partially revive it.
Gill has no receipt.
Sad.
Norman runs away, again.
When he does not get a reply, Graham isn’t happy.
When he gets a reply, Graham isn’t happy.
Graham is seldom happy.
DREMT
First thing is you actually link to this total poop graphic!!
https://postimg.cc/F1fryx8h
That you would link to this indicates you have not studied actual science. It is a terrible graph that only someone with zero science background would post as credible.
It shows the green plate emitting 200 Watts to the blue and for no reason at all it bounces off the blue plate and returns to the green. Makes zero sense to have such an effect for what is stated as blackbodies. Radiant energy does not bounce off a blackbody like it is a mirror. So now we know you do not understand real physics and think, for unknown reasons that the blue plate warms up at the expense of the green? Bad logic leads you to this false concept and also the fact you do not understand science and will not read up on it, content in your Contrarian Crackpot opinions.
Here is a way to consider the blue plate. Get rid of the green plate completely, just partially insulate the back side with 1/2 insulation on it so the area goes from 1 square meter to 1/2 square meter surface. You already know that if you totally insulate the back of the blue plate the temperature will go up. Did it go up at the expense of the insulation?? Your logic truly sucks!
Anyway what do you conclude will happen to the blue plate temperature that receives 400 watts on one side and the radiating surface on the back is reduced not by green plate but by insulation?
I think most the science people on this blog will come up with the correct answer. I don’t know about a Contrarian crackpot. I guess we will have to wait.
Willard I have no need of a receipt. . .I am not advocating anything outside of the textbooks I have provided. You are just another one one in need of a receipt if you want to market unconventional science theories.
“You already know that if you totally insulate the back of the blue plate the temperature will go up. Did it go up at the expense of the insulation?? Your logic truly sucks!”
No, if you insulate the back of the BP the temperature of the BP will go up, and it is not at the expense of the insulation. That’s my point! That’s the difference between the GPE and insulation, and that’s why the GPE is not an insulation effect!
The rest of your comment does not address my linked comment at all. Did you even read it? I didn’t link to the comment with the diagram so I have no idea why you are referring to it.
DREMT
If you keep the blue plate at 244 K so the IR from the green plate will not force th temp up the green plate will receive constant 200 watts from the blue plate. It will then emit 100 watts from each side. It wil reach a steady state temp of 205 K. Now remove what maintains the blue plate at 244 K. It will absorb the 100 watts from the green plate. Now its net loss of energy on the side facing the green plate is only 100 not 200 as it would be with no green plate. The green plate net effect is the same as if you insulated 1/2 the backside of the blue plate. In each case it can only lose a net of 300 watts but it constantly gains 400 so it gains an excess of 100 watts in both cases. This change in energy will force the blue plate to a higher temp until it can get rid of 400 watts. You did have that extremely unscientific graphic in a previous post. The graghic has both plates at the same temp but for unknown reasons th energy of the green plate is reflected 100% of the blue plate but the energy of the blue plate is completely absorbed by the green plate. Thankfully at least you admit this graphic is terrible in all respects!!
[GILL] Norman the GPE is debunked by scientific references
[ALSO GILL] I have no need of a receipt
Saddening, a little.
Norman is completely unresponsive to every single point I’ve made.
DREMT says:
“No, if you insulate the back of the BP the temperature of the BP will go up, and it is not at the expense of the insulation. That’s my point! That’s the difference between the GPE and insulation, and that’s why the GPE is not an insulation effect!”
Norman maintains willful ignorance of the effects of insulation.
Reflection is heat not absorbed by the GP thus the GP only potentially emits 100w/m2 to space if its emissivity if .5.
If the GP has R-2 insulation it will also only emit 100w/m2.
In the first case, with reflection, the temperature of the GP is 205K.
In the second case, with insulation, the mean temperature of the GP is 227K with the BP facing surface at 244K and the space facing surface at 205K with a signature temperature gradient spanning the thickness of the GP. In the case of dual glaze window the gas inside the window, the molecules being free to move the gas adopts a temperature half way between the inner glass and the outer glass providing the insulation via the free movement of molecules. This has all been measured by experiment and our bunny rabbit worshippers continue to believe the bunny rabbit is omniscient and not in need of experiment.
There you have it the two means of insulating. Its incompatible with the GPE.
the GPE fails to recognize the cause and effect process of radiation. First the GP warms then it reemits and that reemission does not change the outcome as it is immediately provided with another refreshing wave of energy to support the relevant temperature profile of both the GP and the BP. Thus our bunny rabbit worshippers believe that future emissions to space can cause the wrong object to warm (the warmer one rather than the cooler one) by radiation itself being treated as an insulating force.
So to believe in the GPE, unless the rules change in outerspace keeping in mind you need to properly test every suspected outcome of radiation as established by QM. Where folks get off track is at the extremes of classic electromagnetics where odd behaviors have been noted in QM. Thus in space where apparently nothing has been published those behaviors could differ. but classic textbook physics doesn’t recognize that yet if it does. . .and worse it still wouldn’t apply to the GHE.
Nate is aware of that so he tries to prey upon the unknown to support a theory that only non-specialist scientists believe in.
Accountants run into this number game of halves quite a bit. Its an inherent issue with double entry accounting. Its a location in thought where numerology fails to solve the issue and one has to look to empirical outcomes to determine if the classic physicists hadn’t lost their minds wrt to entropy and 2LOT. And empiricism is where our bunny rabbit numerology worshippers fail to make their case.
Granted one has to appreciate the issue and if you think about it some you might realize that the surface emits nearly 400w/m2 and 200w/m2 of that is lost to space with the additional 40w/m2 coming from the approximate 80w/m2 of sunlight absorbed by the atmosphere.
So that leads to an interesting question, is the GHE static as it doesn’t matter having water vapor do anything but prevent radiation going directly from the surface to space.
DREMT
Actually my posts cover your points quite well. Since you are hung up about the word “insulation” it is not needed. A backbody green plate that warms up will send IR to the blue plate which absorbs this energy. This will reduce the net rate of energy loss of the blue plate so that the 400 watt input drives the temperature to the point it can get rid of the 400 watts.
You falsely believe the green plate gives up energy to the blue plate and cools which in your mind violates 2nd law. Consider blue and green plates not connected. Blue plate receives 400 watts green plate receives 200
Blue plate reaches steady state temp of 244 K. Green plate goes to 205 K. Remove green plate heat sourc and move it in place with blue plate. The temperature of both plates goes up so your theory is debunked. Read some actua heat transfer physics. It could help you!
Norman, it doesn’t matter what temperature you introduce the GP at. You could introduce the GP at 0 K and then, in your solution, it would warm to 220 K. It’s still warming to a lower temperature than it would if the “back-radiation” transfer didn’t occur. That means the “back-radiation” transfer still has a cost to the GP. At the same time, the BP is reaching a higher temperature than it would if the “back-radiation” transfer didn’t occur. And, that all means that the “back-radiation” transfer is building up internal energy in the BP at the expense of the GP.
So no, you haven’t debunked a thing, I’m afraid.
Norman,
The word “insulation” is certainly not needed.
It’s still interesting to note how Gill still tries to haggle over its price:
https://www.drroyspencer.com/2026/05/pressure-causes-temperature-its-time-to-climb-down-from-mount-stupid/#comment-1746152
Sadly.
The GPE ain’t insulation, and it’s not even an “insulation-type effect” or any phrase you guys can try to dream up. That only leaves one option – it’s heat flowing from cold to hot.
DREMT
Have you considered the Green plate will be at a lower temperature in steady state condition because it is receiving 200 watts of energy while the blue plate receives 400??
Both plates actually get warmer because the returning energy of the green plate causes the 400 watt input to drive blue plate temperature up. When the blue plate temperature increases it emits more energy to the green plate increasing its temperature as well. But no violation of anything here as the energy in is 400 and the total energy out is 400 watts.
I still wonder how you logically twist a simple idea into an absurd conclusion. I can’t fathom how you think the green plate would ever stay at the same temperature as the blue plate when it is receiving less energy input. None of your points are based on rational thought or logic and you are immune to seeing the weakness of your thoughts. It appears that regardless of anyone trying to correct your ignorance, all will fail and you will triumphantly (but incorrectly) declare the GPE is debunked. You will still be wrong but it will not alter your thought process in the least.
Norman is once again unresponsive, this time he doesn’t seem to acknowledge the existence of my 12:31 PM comment at all! I had hoped we could actually have a discussion, Norman, if you are going to bother to respond to me. Shame you’re not willing to.
Norman says:
”Have you considered the Green plate will be at a lower temperature in steady state condition because it is receiving 200 watts of energy while the blue plate receives 400??”
thats simple Norman, the blue plate has twice the area to lose heat to its surroundings. The Green plate only has one side to lose energy to space. It loses zero energy to the blue plate. Instead as you well know its the BP constantly losing energy to GP until the GP is the same temperature as the BP.
Norman says:
”Both plates actually get warmer because the returning energy of the green plate causes the 400 watt input to drive blue plate temperature up. When the blue plate temperature increases it emits more energy to the green plate increasing its temperature as well. But no violation of anything here as the energy in is 400 and the total energy out is 400 watts.”
So far Norman you haven’t found a single textbook, expert, or experiment that supports that idea.
Norman says:
”I still wonder how you logically twist a simple idea into an absurd conclusion. I can’t fathom how you think the green plate would ever stay at the same temperature as the blue plate when it is receiving less energy input.”
You are repeating yourself.
You are the one going out of bounds into perpetuum mobiles where energy can simply be circuited back to the BP causing it to warm despite losing energy GP. To avoid that you just ”invent out of whole cloth” a new kind of insulation for which you have absolutely zero support.
Reconcile that idea with a pile of bricks in a pile separated by tiny beads. Assume this pile is in a box with all the walls of the box radiating 200w/m2 into the pile. According to your math the bricks should all be at least 290k because it gets 200w/m2 from the walls and and where not exposed to walls providing primary radiation on all sides also receive 200w/m2 from mythological backradiation. Yet you don’t believe this pile will get hotter . . .or do you?
200w/m2 from the other bricks, and of course if that happens the brick in the middle of the pile will get even hotter. Obviously there is a flaw in your argument long ago settled by classic thermodynamics and the establishment of 2LOT and the rules of entropy. Undoubtedly those laws were need to bring experimental results in line with theory.
Getting this right reverberates throughout electromagnetics. As you learn electricity for example
”The Mechanics of Electron Flow” The “Drift”: Free electrons in a wire move randomly at incredibly high speeds. When voltage is applied, it pushes these electrons forward in a slow, collective march called drift velocity.
In a standard circuit, this net movement is actually very slow—often just millimeters per second. The Relay Effect: Individual electrons do not zip from the battery all the way to a lightbulb. Instead, they bump into neighboring electrons in a chain reaction, passing energy and charge from atom to atom almost instantly.”
You don’t analogize properly the pressure model where temperature is the equivalent of a voltage with a polarity of hot to cold.
You see all of electromagnetics is analogous to a pressure model despite theories of emission or random directional motion of electrons.
So yea you can have photons flying all over the place but the power is driven by temperature and it goes one way. . .call it photon drift if you like.
> the blue plate has twice the area
Allow Eli to correct Gill:
https://rabett.blogspot.com/2018/08/the-simplest-green-plate-effect.html
That Gill tries to wreck a trivial thought experiment is funny, until it is a little sad.
It’s hard to know whether Willard is intentionally trying to deceive with his quote-mining, or whether he genuinely hasn’t got a clue what bill meant. Either way, he’s convincing nobody rational with his relentless onslaught of crap.
Worse Willard is thinking I have no more credibility than the Easter bunny he worships.
While being correct about that.who he is actually believing the Easter bunny has more credibility than MIT, the classic thermodynamics physicist greats of history and the results of countless experiments by modern scientists many of them attempting to produce the effect because they bought into the political con job on the public producing consistent two answers from AI. And in every case only producing the results consist with MIT from emissivities less than 1.0
Bill
“Instead as you well know its the BP constantly losing energy to GP until the GP is the same temperature as the BP.”
And then what?
With the BP in equilibrium with the GP, it loses NO energy to it.
Yet the BP is receiving 400 W/m2 from the sun.
It can it now only LOSE energy on one side. How does it LOSE 400 W/m2 on one side to stay at a fixed temperature?
What must its temperature be?
You are supposed to be an accountant, Bill. Do the energy accounting for the BP!
Astute readers might wonder if Graham is going to defend Gill’s armwaving, which no one cares about, or if he’s just gonna repeat his gaslighting.
Meanwhile:
https://www.drroyspencer.com/2026/05/uah-v6-1-global-temperature-update-for-april-2026-0-39-deg-c/#comment-1744097
“…producing consistent two answers from AI…”
Yeah, it’s quite something that Google will consistently produce two entirely opposing answers on this subject. It’s been trained on two different sets of information, clearly. The GPE narrative seems to be something that’s been talked into existence on blogs, and now it’s the proverbial snowball running down the hill. It’s getting bigger and bigger, and it’s become like some kind of mass delusion. Obviously it didn’t start with the GPE. Before the GPE there was the “Steel Greenhouse” idea from Willis Eschenbach of all people, for example.
That’s what I don’t get. If you have a powered blackbody object, alone in space, it will come to a temperature at equilibrium with its internal source, Temperature A. Now, surround it with a blackbody enclosure, which has no energy source of its own. The GPE and Steel Greenhouse narrative suggests the object will rise in temperature to a new equilibrium, Temperature B! I truly don’t get how people can not immediately, intuitively just “see” that this is impossible. The only source of energy is within the object, but somehow the cavity just “recycles” that energy to get extra warming from the object!
It’s nonsense.
> …is thinking…he worships…he is actually believing
Gill is sadly not very good at mind reading.
Perhaps he could read to us from his pet textbook instead?
Nate says:
”You are supposed to be an accountant, Bill. Do the energy accounting for the BP!”
Nate I don’t need to do any accounting for you. I have already done it and you accepted it.
At the point that the Easter Bunny claims the BP starts warming where ever that is you have acknowledged repetitively that the SB equation is right and the BP is losing heat energy to the GP. If the GP is 0k that means 200w/m2 of heat energy is being lost by the BP to the GP yet the Easter Bunny claims it is warming.
So what else do you need? A smart pill?
DREMT says:
“…producing consistent two answers from AI…”
”Yeah, it’s quite something that Google will consistently produce two entirely opposing answers on this subject. It’s been trained on two different sets of information, clearly. The GPE narrative seems to be something that’s been talked into existence on blogs, and now it’s the proverbial snowball running down the hill. It’s getting bigger and bigger, and it’s become like some kind of mass delusion. Obviously it didn’t start with the GPE. Before the GPE there was the “Steel Greenhouse” idea from Willis Eschenbach of all people, for example.”
I researched that. Google AI always provides links to its answers. following Nate’s favored answer it took me to this paper:
https://scispace.com/pdf/the-theory-of-heat-radiation-revisited-a-commentary-on-the-3044gvrhf3.pdf
So I then put the reference to that paper through Google AI “title and authors” and appended a request to Google AI. . .”comments please”.
Google AI returned in part: “The scientific community overwhelmingly rejects the authors’ conclusions, maintaining that Max Planck’s derivation and Kirchhoff’s Law of Thermal Emission remain perfectly valid pillars of modern physics.”
LOL!
I will say I haven’t drilled down into the list of specific criticisms of the science underlying Nate’s “preferred answer” as it gets pretty deep going. . .but came away with the idea that Google AI while providing the answer because of published information. . .notes that it remains a very fringy claim not supported by the wider science community. Meaning of course it doesn’t stand as the preferred answer and to move it to that level, as I have said, somebody needs to devise an experiment to make Nate’s case.
Personally I think my reply above to Nate suffices just fine. He is the one that cannot explain the accountings.
Bill
“Instead as you well know its the BP constantly losing energy to GP until the GP is the same temperature as the BP.”
And then what?
With the BP in equilibrium with the GP, it loses NO energy to it.
Yet the BP is receiving 400 W/m2 from the sun.
It can it now only LOSE energy on one side. How does it LOSE 400 W/m2 on one side to stay at a fixed temperature?
What must its temperature be?
Since you are unable to do the simple accounting, I will do it for you.
The BP must lose 400 W/m2 from one side. Its temperature must be 290 K.
In your narrative, then the GP is also 290 K.
This does not agree with DREMT, who says they will be 244 K.
Now lets do the accounting for the GP. It is receiving 0 W/m2 from the BP, and emitting 400 W/m2 on its other side to space.
It must cool!
So in your ‘solution’ the GP is not in equilibrium.
> I researched that. Google AI
Gill gets sadder and sadder.
All this to hide that Robitaille’s now his new pet guru, and to deflect his refusal to do more than paying lip service to his pet textbook. Speaking of “Google AI”:
Progress in Physics is an open-access physics journal known for its inclusion on directories of potentially predatory or questionable publications, such as Beall’s List. It should not be confused with legitimate, prestigious journals like Reports on Progress in Physics.
The GPE’s debunked.
Nate says:
”With the BP in equilibrium with the GP, it loses NO energy to it.”
—————————–
The SB equation does not state how much energy the BP is losing Nate. It says that at equilibrium, the BP is losing zero heat to the GP.
I cautioned you about extrapolating with photons. Indeed there are a lot of mysteries surrounding photons so there is no basis of to extrapolate about them. The classic physicist greats laid out the math without any extrapolation about energy, using measures of heat loss. . . which isn’t the same thing as energy loss.
Making it a measure of energy loss is merely manufactured without an scientific support because you want it to be true. There obviously is no other basis you have brought forward.
There is no accepted EM equation that supports your claim there.
“Q” is a measure of “heat” transfer, not energy transfer.
Thus you need to stick with the science rather than making up your own science or believing some anonymous guy who made up science. One can use algebra to claim an infinite number of untruths.
From almost the first day I commented on the GPE I noted a degree of uncertainty wrt to radiant systems in space. But in view of classic physics that issue cannot be resolved without carefully designed experiment. Google AI which gave the two different answers says the answer you favor is one that scientific community overwhelmingly rejects. Changing that will require a carefully designed experiment.
The only reason you are ignoring that is because you have no response to it.
> The SB equation does not state how much energy the BP is losing Nate.
Few equations state how much Nate they lose.
Sad.
> “Q” is a measure of “heat” transfer, not energy transfer.
Allow Gill’s best buddy to explain:
“In physics, \(Q\) fundamentally represents thermal energy in transit—the specific measure of energy transferred between systems as a result of a temperature difference.”
Sadder.
Q is heat flow, Willard.
Willard amazingly you found the right source:
”In physics, \(Q\) fundamentally represents “thermal” energy in transit”
EMR is not thermal energy its simply “light”. When you use the SB equation you can compute how much thermal energy is being transferred by light. When you use a phony equation like the Easter Bunny’s you are not going to get the right answer. Pratt’s experiment for example shows that as do many others.
I see, Bill.
When heat flows dont work out in your narrative, you decide to stop talking about heat.
Go it.
Pretty sure you don’t see, Nate.
Nate says:
”I see, Bill.
When heat flows dont work out in your narrative, you decide to stop talking about heat.”
What are you talking about Nate?
You said on June 18, 2026 at 1:52 PM
Bill, With the BP in equilibrium with the GP, it loses NO energy to it.
The proper statement would be: With the BP in equilibrium with the GP, there is zero heat transfer from the BP to the GP.
The SB equation does not calculate energy transfer to the GP. . .it calculates heat transfer.
If you disagree with any part of the above be sure to point out exactly what you disagree with, and why, and sources that support your disagreement.
> With the BP in equilibrium with the GP, there is zero heat transfer from the BP to the GP.
Which reminds me:
https://www.drroyspencer.com/2026/05/uah-v6-1-global-temperature-update-for-april-2026-0-39-deg-c/#comment-1744097
Saddening.
Just stating what happens in the 244 K…244 K solution is not a criticism of that solution.
“It says that at equilibrium, the BP is losing zero heat to the GP.”
I agree. Then do the accounting from there, Bill.
With 400 W/m2 heat input, and 0 heat loss on one side, how much heat loss does it require on the other side from the BP?
And thus, what temperature will the BP have?
The what temperature will the GP have?
“I cautioned you about extrapolating with photons.”
Nowhere have I mentioned photons in this discussion.
Astute readers might wish to compare and contrast:
[GILL, June 19, 2026 at 6:31 PM] The SB equation says that at equilibrium, the BP is losing zero heat to the GP.
[MARK] Graham’s alleged solution has a net radiative flux moving from one plate to another at the same temperature.
[GILL, May 17, 2026 at 10:53 PM] thats correct
https://www.drroyspencer.com/2026/05/uah-v6-1-global-temperature-update-for-april-2026-0-39-deg-c/#comment-1744121
Nate says:
“It says that at equilibrium, the BP is losing zero heat to the GP.”
I agree. Then do the accounting from there, Bill.
With 400 W/m2 heat input, and 0 heat loss on one side, how much heat loss does it require on the other side from the BP?
And thus, what temperature will the BP have?
The what temperature will the GP have?
“I cautioned you about extrapolating with photons.”
Nowhere have I mentioned photons in this discussion.
—————————-
The BP does not have to be in equilibrium with its heat source Nate. It can be in a stabilized condition also due to radiation loss out of both sides.
We are only talking about equilibrium between the BP and the GP. If that is 200w/m2 as established by the Easter Bunny then thats what we are dealing with. If you want to reject the Easter Bunny and use a different number we can do that too. But you wanting to do that here is just your bid to obfuscate a long running discussion you lost.
> The BP does not have to be in equilibrium with its heat source Nate. It can be in a stabilized condition also due to radiation loss out of both sides.
Graham will either ignore Gill’s complete butchering of Eli’s thought experiment, or amplify it at some point.
Bill,
“The BP does not have to be in equilibrium with its heat source Nate. It can be in a stabilized condition also due to radiation loss out of both sides.”
Ok, words, but no numbers, no accounting. We know you are an accountant.
The pattern here is evasion. Is it because the numbers dont support your or DREMTs narrative?
So what are the numbers, and what do they give for the temperature of the BP? And the temperature of the GP?
Nate says:
”Ok, words, but no numbers, no accounting. We know you are an accountant.
The pattern here is evasion. Is it because the numbers dont support your or DREMTs narrative?
So what are the numbers, and what do they give for the temperature of the BP? And the temperature of the GP?”
One needs an example to give an accounting.
So if you want one lets take the situation where the BP is stabilized at 244k and emitting 200w/m2 in two different direction from each surface.
The Easter Bunny shows the GP at 205k and emits 100w/m2 in two directions.
That is the first accounting error of the easter bunny. The GP is prohibited from warming the BP because the GP is cooler while the BP is not prohibited from warming the GP because the BP is warmer.
So what happens here? Its simple the GP is initially emitting 100w/m2 to space and because temperature is analogous to pressure the 100w/m2 the easter bunny believes is warming the BP and has that baked into his calculation in violation of 2LOT and the rules of entropy that simply isn’t happening because the temperature pressure prevents it.
Now I am perfectly aware that the science community has not explained the exact process with little particles, its important to note that radiation isn’t known to be little particles but some kind of thing that shares characteristics of particles and waves.
So you try to take advantage of this known property to claim the 100w/m2 is going to pressurize the BP and force it to warm and then cunningly claim its not the emission from the GP that makes that happen but the sun instead.
However we know from the MIT textbook the only way that can happen via radiation is insulation and the MIT textbook does not recognize blackbody radiation as insulation. So you can’t account for this process either. Thus it appears anybody who can will be at the front of the line for a Nobel Prize.
But one cannot use a lack of accounting to discount what we know works and can measure to verify it and have measured it. Even people who don’t know how to measure it have done experiments that do measure it, but somebody forgot to use the MIT textbook and tables of emissivity to verify it in many of these cases of people trying to demonstrate the Easter Bunny obviously imaginary effect. We know that because the only way to approach the Easter Bunny effect is with an IR emissivity around .5 which you probably can’t even get out of even a “metallic black” cadillac. . .which would typically have an emissivity of .85 to .95.
Therefore we don’t care what happens to the photons in this example. We know how they are applied however. of the 200w/m2 emitting to the GP from the BP, 100w/m2 to is lost to space and 100w/m2 is devoted to warming the GP. We know both to be true because the GP can not manufacture energy and its only source of energy is the BP. We also know from the Stefan Boltzmann law that the other 100w/m2 is being utilized to warm the GP.
And what does that leave? Zero. The accounting is complete. And we have made no inconsistent claims in the process.
You have nothing. The BP is losing 400w/m2. 300w/m2 are lost to the surroundings (space) in two different directions and from the SB equation the balance of the 400/m2 is warming the GP.
Thus your claim the sun is warming the BP is hogwash and your claim the GP isn’t warming is hogwash. And your claim that the BP is not losing 400w/m2 is hogwash. And the pressure analogy along with 2LOT and the rules of entropy explains why the BP is not getting 100w/m2 from the GP.
Bill,
You are now continuing to evade my straightforward question, by talking about someone elses accounting problem.
So to repeat the question:
You say:
“It says that at equilibrium, the BP is losing zero heat to the GP.”
I say: “I agree. Then do the accounting from there, Bill.
With 400 W/m2 heat input, and 0 heat loss on one side, how much heat loss does it require on the other side from the BP?
And thus, what temperature will the BP have?
The what temperature will the GP have?”
Nate says:
You are now continuing to evade my straightforward question, by talking about someone elses accounting problem.
So to repeat the question:
You say:
“It says that at equilibrium, the BP is losing zero heat to the GP.”
I say: “I agree. Then do the accounting from there, Bill.
With 400 W/m2 heat input, and 0 heat loss on one side, how much heat loss does it require on the other side from the BP?
And thus, what temperature will the BP have?
The what temperature will the GP have?”
—————–
Hmmm, I can see your problem. Apparentlyh you are not very good at math problems.
If you want to learn hire a tutor that usually works.
AFA, the MIT textbook solution goes with zero insulation, blackbodies, and a field of views all around at 1.0 (cavity radiation where no EMR can escape.
The temperature of the BP gives you the equilibrium value and the EMR emission of the BP. No matter where it is in the warming process you can use the SB equation to determine how much EMR is utilized for warming the GP. The remainder is the EMR that goes to space. I solved for one example. I am sure with enough tutoring you can learn how to calculate other examples.
I say: “I agree. Then do the accounting from there, Bill.
With 400 W/m2 heat input, and 0 heat loss on one side, how much heat loss does it require on the other side from the BP?
And thus, what temperature will the BP have?
The what temperature will the GP have?”
What do we get from our accountant? No accounting. Just bla bla bla.
Clearly you are afraid to do the accounting, since it will reveal the failure of your narrative and it destroys DREMTs.
So let’s again do it for you, and you can tell us which part you refute and WHY.
All the units are W/m2. All are HEAT flows
BP input 400 output 400 to space , 0 to GP. T = 290 K
GP input from BP 0, output 400 to space. T = 290 K and must cool.
So how is it that your ‘solution’ gives equal plate temps in equilibrium, when clearly the GP must cool below the BP T?
How does DREMTs 244K/244K ‘solution’ make any sense?
Obviously, nothing emitted from the GP on the BP-facing side can lead to cooling of the GP…because then it would be cooling to the BP, i.e. sending heat to the BP! That would be a violation of 2LoT. So, the GP has only half its surface area over which it can cool – the side facing space.
I thought I was talking to Bill.
“Obviously, nothing emitted from the GP on the BP-facing side can lead to cooling of the GP…because then it would be cooling to the BP, i.e. sending heat to the BP! That would be a violation of 2LoT.”
Very good. Can I qupte you on that?
“So, the GP has only half its surface area over which it can cool – the side facing space.”
Very good. Now remember, it is receiving no HEAT.
What would a logical person say happens next?
Oh, I forgot – I have to spell everything out for Nate, as he’s incapable of thinking for himself. As I said, and you just agreed – the GP can only lose heat from half of its surface area. The BP, on the other hand, can lose heat from its entire surface area. The BP can cool to the GP, as heat can be sent that way, and the BP can lose heat on the Sun-facing side, as the Sun only occupies a tiny portion of what the BP “sees” on that side – the rest is space.
GP can cool from only half its surface area.
BP can cool from its entire surface area.
244 K…244 K is the result (I expect I will still need to explain further!)
Nate says:
June 22, 2026 at 6:04 PM
Bill,
You are now continuing to evade my straightforward question, by talking about someone elses accounting problem.
So to repeat the question:
You say:
“It says that at equilibrium, the BP is losing zero heat to the GP.”
I say: “I agree. Then do the accounting from there, Bill.
With 400 W/m2 heat input, and 0 heat loss on one side, how much heat loss does it require on the other side from the BP?
And thus, what temperature will the BP have?
The what temperature will the GP have?”
————–
You call that DREMTs solution for the BP, but its also your hero’s solution.
At 12:13pm yesterday I was giving you the example of the correct solution for the GP. And told you the BP was stabilized at 244k.
Your deity the Easter Bunny agrees.
the fact is there is a required level of knowledge that goes with any accounting for readers of that accounting.
Accountants don’t do accountings expecting bumpkins to understand.
They do their accounting and provide enough notes that a sophisticated investor can use to understand what the accounting says.
Obviously since I also said the BP will continue to transfer heat to the GP until the GP reaches the same temperature as the BP. . .that should be enough for anybody who isn’t a bumpkin to figure out what the GP temperature will stabilize at any temperature of the BP.
And yet just like a bumpkin you keep asking for more accountings.
If you want to change the topic away from cavity radiation where photons are allowed to escape to deep space and you have an ininsulated GP plate, thats an entirely different question for which I am not sure was addressed in classic physics. It certainly isn’t the black box experiment anyway.
Obviously in the blackbox experiment the BP is not allowed to warm and the radiation has to go somewhere cooler so it warms the GP to the same temperature as the BP. However, it appears somebody has managed to convince you otherwise. . .and using a heat transfer equation as a EMR transfer equation does not appear to have any support anywhere you have been able to reference to in the entire library of radiation science.
Bill,
Wading through a bunch of bla bla bla gish galloping, we fi ally see something similar to accounting
“We know how they are applied however. of the 200w/m2 emitting to the GP from the BP, 100w/m2 to is lost to space and 100w/m2 is devoted to warming the GP. We know both to be true because the GP can not manufacture energy and its only source of energy is the BP. We also know from the Stefan Boltzmann law that the other 100w/m2 is being utilized to warm the GP.
And what does that leave? Zero. The accounting is complete. And we have made no inconsistent claims in the process.”
Ummmm, No.
“100 W/m2 is lost to space”
Who is emitting that to space? If the GP is emitting 100 W/m2 to space, then its temperature is not 244 K.
It is 205 K.
So this accounting does not make any sense.
“The BP, on the other hand, can lose heat from its entire surface area.”
Not in equilibrium with the GP at 244/244, as Bill pointed out.
So we still have the issue that the GP recieves no heat from the BP yet is able to emit heat to space.
Nate, you don’t get it.
You’ve just conceded the entire eight-year argument.
You admitted that the GP can only cool from the side facing space.
Whereas the BP can cool from both sides.
That means for the BP, receiving 400 W/m^2, you divide by the two sides. It thus emits 200 W/m^2.
Whereas for the GP, receiving 200 W/m^2, you divide by the one side. It thus emits 200 W/m^2.
244 K…244 K.
The GPE’s debunked, and you just agreed to it.
Thx.
Pure gaslughting.
Unless you are really really stupid, you should be aware that at 244/244, Q =0 between the plates.
Which means NEITHER plate can lose heat on that side, as I said.
And in that condition, with Q =0, the GP has NO heat input, yet is emitting heat to space on, yes, one side.
That means, at least in this universe, that the GP must cool.
It also means, at least in this universe, the BP has reduced heat loss, with a steady heat input, thus it must WARM.
244K/244K cannot be a valid equilibrium.
Sorry that this frustrates you so terribly.
There’s no gaslighting, Nate. Read through the last few comments to you, until you understand.
You agreed that the GP can only cool from half its surface area.
The GPE’s debunked.
Nate says:
June 23, 2026 at 1:37 PM
Bill,
Wading through a bunch of bla bla bla gish galloping, we fi ally see something similar to accounting.
——————–
Indeed your only reply is that the MIT model is a gish gallop when your argument has been completely debunked and you have no scientific articles to support it.
All you have done is try without support to turn a heat transfer equation from classic physics into an insulation equation for EMR.
Bottom line is an insulated plate GPE with 5% reflective insulation according the MIT textbook allows more than 70% more radiation to pass to space out the GP backside than what is passed by the Easter Bunny’s blackbody model.
That completely debunks the easter bunny model and explains why you have never ever found a scientific article that supports it.
Bill,
How does your accounting of the GP emitting 100 W/m2 to space, which requires it to be 205 K, according to the valid SB law, get you to a solution with both plates at 244K?
Seriously, how does that work out?
DREMT,
Apparently you erroneously think me agreeing that HEAT never flows backwards from the colder GP to warmer BP, is me conceding something new.
It is not. I have always argued that. And if you think that makes your delreams come true, you have truly lost touch with reality.
On the contrary, YOU conceding that heat can never flow backwards from GP to BP IS something new.
Since, you have up until yesterday, maintained the absurdity that the GP must be transferring heat to the BP when it is cooler than the BP in Elis solution.
Your narrative is increasingly a muddle of contradictions.
Heat cannot flow from the GP to the BP, which is why the 262 K…220 K solution cannot happen.
Nate, you don’t seem to understand that your 262 K…220 K solution requires heat to be lost both ways from both plates!
If, as you accept, the GP can only lose heat to space, and not in the direction of the BP, then the solution is 244 K…244 K, as I explained.
Bill,
“Accountants don’t do accountings expecting bumpkins to understand.”
The ultimate excuse for shady accounting.
Are you in the habit of doing that? Of having your boss tell you he wants the numbers to work out a certain way, so make it happen.
That is your problem here. Having your boss DREMT tell you that he needs the accounting to make his prefferred solution 244K/244K happen.
But you are fudging the numbers.
If the BP is 244K and GP is 244 K, then the heat transfer between them is 0. ZERO.
Then there us NO heat input into the GP, yet there remains 200 W/m2 of heat loss from the GP to space.
By the simple and true accounting, that means the GP must COOL.
By the First Law of Thermodynamics, the GP is losing internal energy and must COOL.
No shady accounting can cover it up. 244K/244K is not an equilbrium solution.
“Heat cannot flow from the GP to the BP”
Yep! As I always agreed, but you did not.
“which is why the 262 K…220 K solution cannot happen.”
Non sequitur. Assertion that does not follow from any fact.
“Nate, you don’t seem to understand that your 262 K…220 K solution requires heat to be lost both ways from both plates!”
Yet another shameless false assertion. I showed you upthread exactly how the 262/220 solution works and fully satisfies the laws of physics.
And you could not refute any of it!
So this is plainly dishonest.
“If, as you accept, the GP can only lose heat to space, and not in the direction of the BP, then the solution is 244 K…244 K, as I explained.”
Nope. At 244/244 NEITHER PLATE can lose heat on one side!
The GP is receiving no heat yet emitting heat to space!
If you still cant understand why in those conditions it must cool, then you are stuck on Mt. Stupid.
You shamelessly ignore this inconvwnient fact
I’m bored of repeating myself.
https://www.drroyspencer.com/2026/06/uah-v6-1-global-temperature-update-for-may-2026-0-53-deg-c/#comment-1747110
Read, and concede.
Nate says:
June 24, 2026 at 5:38 AM
Bill,
How does your accounting of the GP emitting 100 W/m2 to space, which requires it to be 205 K, according to the valid SB law, get you to a solution with both plates at 244K?
Seriously, how does that work out?
—————-
It didn’t work out well at all did it Nate.
after all its the Easter Bunny initial solution and diagram here:
https://rabett.blogspot.com/2017/10/an-evergreen-of-denial-is-that-colder.html 4th diagram just before he performed his unconventional algebra to it.
I used that to demonstrate before using his algebra that the BP was still warming the
GP but he is depicting the GP warming the BP.
Understanding can come step by step. . . .more than happy to see you got through step 1 of the Easter Bunny solution and laughed at it.
How it got to 244K is explained by the classic physicists where the SB equation has the BP heating the GP until equilibrium. If you have a source that says different, by all means give us a reference to it. As you know the GP is prohibited from warming the BP and thus the GP is prohibited from warming the BP and sending any heat it receives to its surroundings on that side of the GP. If you don’t like that fact its on you to prove the classic physicists wrong. . .and for 8 years you have been making a fool of yourself attempting to do that with no success. And why is that? Did the easter bunny pull the wool over your eyes?
Hopefully this is a lesson to you that if you are going to make scientific claims you need some scientific evidence that your calculations are correct.
The fact that scientifically supported insulation allows more heat to pass than your calculations for a blackbody is prima facie evidence you are all wet. Blackbodies don’t insulate and even if they did additional insulation would cause them to be more insulative, not less. The MIT textbook completely destroys your argument with the scientific details of why.
If you think I am wrong there, do the math and show us your math of how much heat is allowed to pass for black plates coated with black paint with an emissivity of .95 compared to the easter bunny math.
Sure if you want to flunk 101 heat transfer at MIT knock yourself out. And while you are at it check the results of greenhouse experiments.
then either come back with the evidence or admit you have been wrong for the last 8 years.
Listen to Bill
“It says that at equilibrium, the BP is losing zero heat to the GP.”
So your claim that the BP can lose heat on two sides does not apply to 244/244.
At other temperatures, with the GP cooler than the BP, the BP is the only heat source for the GP.
It needs to lose heat on that side, to heat the GP, which is cooling on its other side.
What does that tell you about the temperature of the GP?
My points 1) – 5) established that in your 262 K…220 K solution, the “back-radiation” transfer builds up internal energy in the BP at the expense of the GP. That’s an established fact. And now, you have agreed that the GP cannot lose heat on the side facing the BP. So, you have agreed that what happens in your 262 K…220 K solution, is impossible.
Great! What are we still discussing, then?
“And now, you have agreed that the GP cannot lose heat on the side facing the BP. So, you have agreed that what happens in your 262 K…220 K solution, is impossible.”
My posts are clearly detailing the failures of this argument.
But you just dont even attempt a rebuttal.
We can only conclude that you have none.
Thus you shift into pure troll mode.
Here you try to shamelessly tell me what I believe, knowing full well that is not what I believe.
These are the tactics of someone who has lost.
Except anyone can see that you do agree, here, Nate:
https://www.drroyspencer.com/2026/06/uah-v6-1-global-temperature-update-for-may-2026-0-53-deg-c/#comment-1747089
Bill,
“How it got to 244K is explained by the classic physicists where the SB equation has the BP heating the GP until equilibrium.”
Sure, it stops heating when both are 244 K. Then Qin = 0.
But as I explained, your problem is that the GPs source of heat has stopped flowing…but it is STILL losing heat to space. QOUT > 0.
Therefore, obviously, it will have a NET HEAT loss, and must cool.
This is a straightforward consequence of the First Law of Thermodynmics.
Do you not know what that is? How long have you been coming here?
If not, then do you not know how to Google it?
Nate says:
“It says that at equilibrium, the BP is losing zero heat to the GP.”
So your claim that the BP can lose heat on two sides does not apply to 244/244.
—————–
You have been challenged to back up your claims rather than just continuing to blabber away.
Yet you haven’t come up with a single expert, a single classical principle of science, nor not one experiment to back up your blabber.
“Sure, it stops heating when both are 244 K. Then Qin = 0.
But as I explained, your problem is that the GPs source of heat has stopped flowing…but it is STILL losing heat to space. QOUT > 0.
Therefore, obviously, it will have a NET HEAT loss, and must cool.“
Since you keep making the same argument over and over again, let’s break you out of that cycle. Let’s say, for the sake of argument, that the GP cools by some infinitesimal amount. The GP is now ever so slightly cooler than the BP, and so heat flows from the BP to the GP, warming the GP back up to 244 K.
Remember, the BP can cool both ways, the GP can only cool to space. So, the output from the GP to the BP is not going to warm the BP. But, let’s say, for the sake of argument, that for whatever reason the BP warms, at the same time as the GP cooling, by some infinitesimal amount. The BP would then cool, both ways, until it was back to 244 K.
“Let’s say, for the sake of argument, that the GP cools by some infinitesimal amount. The GP is now ever so slightly cooler than the BP, and so heat flows from the BP to the GP, warming the GP back up to 244 K.”
Not if you bother to look at the numbers. Dont you think the numbers matter?
Lets say it cools even more than an infinitesimal amout. Say 10 K.
What is Qin and Qout?
Bu the RHTE, Qin = sigma(244^4-234^4) = 30 W/m2
While Qout =sigma(239^4 – 0) = 170 W/m2.
So it still has a NET heat loss of 140 W/m2.
Not warming back up, continuing to cool!
At 244 K…244 K, the GP receives 200 W/m^2 EMR from the BP, and as it can only cool on the space-facing side, that’s the only emission we need worry about. At 244 K it emits 200 W/m^2 EMR to space, thus all is in balance. The emission from the GP to the BP is of no concern, since you’ve agreed the GP cannot cool in that direction.
“What will you try next?”
While Graham keeps gaslighting, astute readers might note:
https://www.drroyspencer.com/2026/06/uah-v6-1-global-temperature-update-for-may-2026-0-53-deg-c/#comment-1747231
Really astute readers will click on the link and read the entire comment. Then they’ll realise how utterly without shame is Willard’s quote-mining.
N.B: “Astute readers” started with Ball4. He would say that to me all the time, as a subtle put-down. As I often mirror others’ behaviour as a way to show readers what these people are up to, I started to use “astute readers” myself. Now, both Willard and Nate have adopted it, trying to do the same thing to me, without realising the true origin of the phrase lies with one of their own! Always makes me laugh.
“At 244 K…244 K, the GP receives 200 W/m^2 EMR from the BP, and as it can only cool on the space-facing side, that’s the only emission we need worry about.”
But just a moment ago, you did worry about the only thing that matters here, HEAT.
You tried the infinitesmal increase in heat flow from 0. But numerically that did not work.
So what do you try next? Pretend again that the one-way EMR is a Net energy transfer.
It is NOT. That would be the Heat.
“At 244 K it emits 200 W/m^2 EMR to space, thus all is in balance. The emission from the GP to the BP is of no concern, since you’ve agreed the GP cannot cool in that direction.
False. Obviously, by your previous question, and your agreement about 262/220 that it it satisfies 1LOT purely via HEAT flows, you know better.
You know that there is no free magical energy transfer, there is only HEAT transfer and Work.
Just stop playing dumb.
Nate, there’s nothing wrong with either of my previous comments to you. Neither can be fully understood on their own, you need to use joined-up thinking to connect together everything I’ve been trying to explain to you. You have to at least try to understand.
Bottom line…if the “back-radiation” transfer happens to completion, then (as with any other transfer of EMR between passive objects) the object the transfer is coming from will have less internal energy than it would otherwise, as a result; and the object the transfer is going into will gain more internal energy than it would otherwise, as a result. To deny that is to deny the very nature of a transfer!
But, you’ve agreed the GP will not lose heat to the BP. Whether you accept that or not, that means the “back-radiation” transfer will not happen to completion. If it did, the GP would be losing heat to the BP!
In a heat transfer between two passive objects (hot to cold) the warmer object will have less internal energy than it would otherwise, as a result; and the cooler object will gain more internal energy than it would otherwise, as a result. Nobody would dispute that. So, for a heat transfer between two passive objects (cold to hot) of course it’s just the same, but in reverse. See my second paragraph!
[GRAHAM D. WARNER] That is not how insulation works
[PUFFMAN] Earth’s atmosphere definitely acts as a blanket… it’s insulation restricting the flow of energy to space.
No contradiction or inconsistency, Willard. Clint R has stated before (agreeing with me) that the Green Plate Effect does not involve “insulation” and is not an insulation effect of any kind. Here, as astute readers will have noted by clicking on your link and actually reading the full comment, Clint R is arguing that the non-radiative gases offer “insulation”, and I believe he has said before it’s conductive insulation (i.e due to the thermal resistance of the nitrogen and oxygen). So, absolutely nothing like the Green Plate Effect.
Astute readers will notice how Graham D. Warner gaslights to deflect toward his common ground with Puffman, i.e. that non-radiative gasses are the “true” radiative ones.
Insulation is insulation is insulation.
Nate says:
“Let’s say, for the sake of argument, that the GP cools by some infinitesimal amount. The GP is now ever so slightly cooler than the BP, and so heat flows from the BP to the GP, warming the GP back up to 244 K.”
Not if you bother to look at the numbers. Dont you think the numbers matter?
Lets say it cools even more than an infinitesimal amout. Say 10 K.
——————–
You don’t have a means to make that happen Nate. Each photon lost to space by the GP is instantly replaced with a photon from the BP.
You are talking about losing one photon of energy for about the duration of Planck time 5.39E-44 seconds. The classic physicists generally overlooked such insignificant deviations from perfection.
…and the GPE isn’t insulation.
“You don’t have a means to make that happen Nate. Each photon lost to space by the GP is instantly replaced with a photon from the BP.
You are talking about losing one photon of energy for about the duration of Planck time 5.39E-44 seconds. The classic physicists generally overlooked such insignificant deviations from perfection.”
Are we now allowed to talk about photons, Bill? Make up your mind!
Anyway pure gobbledegook. Planck time?
If you could just stick to the standard laws of radiative heat transfer, and 1LOT, the solution is simple.
But you seem unable to do that.
Thus you keep doing ‘creative accounting’ designed to be completely opaque, and yet produce your boss’s desired outcome.
Do I need to report you to AICPA?
“…and the GPE isn’t insulation.”
The GP is a passive blackbody plate and thus cannot be a heat source.
So what can it do?: it can reduce heat loss, as you agree!
So it does what insulation does, reduce heat loss, but you dont feel like calling it insulation, for some reason.
Does not matter what you call it, because it reduces heat loss, and thus enables heated objects to get warmer, just like blankets, coats, or oven doors do.
I’ve explained the difference a dozen times, and never been refuted, Nate.
Nate says:
Are we now allowed to talk about photons, Bill? Make up your mind!
Anyway pure gobbledegook. Planck time?
If you could just stick to the standard laws of radiative heat transfer, and 1LOT, the solution is simple.
——————–
Nate just waves his hand and the frontiers of science becomes gobbledygook.
Our know it all in-chief just declared it to be so, so in his mind it obviously is so. Reminds of a comment by Ronald Reagan. “The trouble with our liberal friends is not that they’re ignorant; it’s just that they know so much that isn’t so.”
Well you can’t “selectivity” stick to the standard laws of radiative heat transfer Nate you must also recognize the pressure model, 2LOT, and the Rules of Entropy.
I challenged you to explain in your model when 2lot and the rules of entropy apply and when they don’t apply but apparently you have no clue to the answer.
Instead of explaining how temperature could ever change if “each photon lost to space by the GP is instantly replaced with a photon from the BP”, Gill pretends to ignore what has been explained to him a thousand times:
https://skepticalscience.com/green-plate-dynamics.html
Astute readers may feel sad for him.
“I’ve explained the difference a dozen times”
And not rebutted each time?
Wrong.
Just like the one-way EMR, you have this weird notion that your one-way assertions can be considered in isolation and are decisive, when the reality is this is a two way argument.
The reality is that you assert that the mechanism by which heat-loss is reduced by blackbody plates is different at different temperatures, which is illogical and unsupported by evidence.
So that is the opposite of decisive. It makes no sense.
The mechanism for heat loss-reduction is the simple fact that a blackbody plate placed between hot and cold bodies, settles at an intermediate, warm, temperature.
And that means, by the RHTE, that the hot body now loses its heat to a warm body, rather than a cold body, and that means reduced heat loss.
And that mechanism works the same at all temperatures.
Bill,
“Well you can’t “selectivity” stick to the standard laws of radiative heat transfer”
And dont forget the First Law of Thermodynamics.
Yes, when trying to solve a radiative heat transfer problem, this is the best approach.
Your approach seems to be to talk about anything but those laws.
2LOT must be satisfied. But you cant use it, by itself, to solve a problem.
When properly using the other heat transfer laws and thermodynamic laws to find a solution, 2LOT naturally is obeyed.
Even DREMT agrees that 262K/220K satisfies 1LOT and the RHTE, and is thus a valid equilibrium solution.
https://www.drroyspencer.com/2026/06/uah-v6-1-global-temperature-update-for-may-2026-0-53-deg-c/#comment-1747182
What makes no sense is his unfulfilled desire for it to be impossible to reach the equilibrium at 262K/220K, without violating 2LOT.
“The reality is that you assert that the mechanism by which heat-loss is reduced by blackbody plates is different at different temperatures…”
Incorrect. I do not assert that. It’s different in the two completely different solutions. Temperature is not the issue. You cannot correctly represent my arguments, which is why you always lose.
“Even DREMT agrees that 262K/220K satisfies 1LOT and the RHTE, and is thus a valid equilibrium solution…”
Incorrect. It is not a valid equilibrium solution because it violates 2LoT. And, there is no such thing as “satisfying the RHTE”. Stop misrepresenting me, troll.
Willard says:
Instead of explaining how temperature could ever change if “each photon lost to space by the GP is instantly replaced with a photon from the BP”, Gill pretends to ignore what has been explained to him a thousand times:
https://skepticalscience.com/green-plate-dynamics.html
Astute readers may feel sad for him.
——————
Astute readers don’t get their science from a blog run by some anonymous guy wearing an Easter Bunny costume Willard.
Astute readers understand the difference between pseudonymity and anonymity, including cranks who deformed Eli’s real name to come troll this place 9 years ago. They might also know about Nikolas Bourbaki, perhaps the best mathematician of all times. Gill’s name rings too many names to be useful, and his pet gurus are just that: crank pets. More relatedly, astute readers know Bob’s name:
https://skepticalscience.com/green-plate-dynamics.html
Very sad.
Nate says:
”Just like the one-way EMR, you have this weird notion that your one-way assertions can be considered in isolation and are decisive, when the reality is this is a two way argument.”
——————-
What one-way EMR are you talking about Nate. When you run a black plate experiment all the non-reflected energy shows up in the results and you get a result of equilibrium close to the sum of all the energy moving through the system.
You get the same result from the examples and problems presented in Chapter 10 of the MIT textbook which you simply choose to ignore along with experiments.
Then you select the ”thought” results of some anonymous guy running a blog titled “bunny trail”. Thats extremely gullible of you.
If you google AI carefully describing the entire experiment most of the time you get the result that the two plates in a cavity radiation experiment end up the same temperature. Occasionally, google AI picks up a result explained as the heat moving through a thin plate so fast it doesn’t get thermalized. . .which of course is ridiculous as heat running through any plate has been thermalized.
Nate claims:
The mechanism for heat loss-reduction is the simple fact that a blackbody plate placed between hot and cold bodies, settles at an intermediate, warm, temperature.
———————
the GPE as modeled by the easter bunny is an object looking to 0.00 watts/m2 of sky over 99.999% of the sky. so your desperate effort here to change the goal posts is noted. Maybe you can convince the Easter Bunny to make another post detailing a different GPE. Maybe you can write your own textbook and sell it. But I really doubt that.
What you should note however, is a solid barrier does stop the physical/non-electromagnetic transfer of heat by preventing gas molecules in say a greenhouse from passing through the glass of the greenhouse. Beyond that its aided by glass of a emissivity of about .83.
as usual you are confusing paradigms of heat transfer. Its all included in the MIT heat transfer text book. You should read it and solve the examples and problems for yourself.
This of heat transfer was also noted by Roy in his post on January 13, 2026 with this comment: ”Maybe if the modelers figured out why their handling of moist convection is flawed, models would then produce warming more in line with observations, and more in line with each other.”
Modelling is a great tool of science but like any tool if you don’t use it right because of being stuck by enforced political dogma either coming from governments with an axe to grind or special interest institutions that gain power via the government funding it doesn’t help.
Willard says:
”Astute readers understand the difference between pseudonymity and anonymity, including cranks who deformed Eli’s real name to come troll this place 9 years ago.”
Willard if you want to believe the Easter Bunny GPE be my guest. That just makes you one of those cranks you are complaining about.
Gill still denies that Eli did not write this post:
https://skepticalscience.com/green-plate-dynamics.html
How many times will I have to post it?
More than we should need, sadly.
“Incorrect. I do not assert that. It’s different in the two completely different solutions. Temperature is not the issue. You cannot correctly represent my arguments, which is why you always lose.”
Completely different only because you choose to apply actual physics at 262/220 to find that 1LaoT is satisfied.
And then apply different rules at 244K-244K that do not agree with the laws of physics. Shameless.
“Even DREMT agrees that 262K/220K satisfies 1LOT and the RHTE, and is thus a valid equilibrium solution…”
“Incorrect. It is not a valid equilibrium solution because it violates 2LoT.”
I asked you to show how an equolibrium could violate 2LOT. You could not, because the heat flows are all in the right direction at equilibrium, satisfying 1LOT as you did agree.
“And, there is no such thing as “satisfying the RHTE”. Stop misrepresenting me, troll.”
Weird. How could you agree that 262/220 satisfied 1LOT with out evaluating the heat flows using the RHTE.
Those heat (net energy) flows that produced energy balance for each plate clearly satisfied the predictions of the RHTE.
As opposed to what you claim for the NET energy flow of 200 W/m2 between the plates at 244/244, which cannot satisfy the RHTE.
No, Nate. The mechanism by which “heat loss is reduced” in the 262 K…220 K solution is the illegal transfer of thermal energy “against the flow”. Clearly that is not the mechanism in the 244 K…244 K solution because that transfer does not occur to completion in the 244 K…244 K solution!
So, your:
“The reality is that you assert that the mechanism by which heat-loss is reduced by blackbody plates is different at different temperatures…”
was a total misrepresentation. Can you not admit that!?
“No, Nate. The mechanism by which “heat loss is reduced” in the 262 K…220 K solution is the illegal transfer of thermal energy “against the flow”. Clearly that is not the mechanism in the 244 K…244 K solution because that transfer does not occur to completion in the 244 K…244 K solution!”
So you declare. without a shred of evidence.
The fact is that blackbody plates DO reduce heat loss, as you agree.
And the physics sources shown to you derive it, and there is no change in that mechanism at different temperatures of the bodies.
The fact is that the mechanis is the same at all temperatures.
So when you claim the mechanism is different, and does not WORK at 262/220, that is you making up contradictory nonsense.
Why? Because the mechanism does work at any temperature.
And the mechanism IS as I described above.
A passive plate placed between a warm and cold body eg BP and Space.
The new plate equilibrates to a temperature intermediate between that of the two bodies.
Therefore the RHTE finds a reduced heat loss between the warm body and the intermediate plate, than it had previously directly to the cold body.
The intermediate blackbody plate shields the warm body from its cold environment.
It must get warmer.
This is no different from standing in front of an open freezer and your skin ‘seeing’ and feeling the cold. Then place a door in between, and suddenly your skin warms. It is no longer ‘seeing’ or feeling the cold freezer.
This is the mechanism. And there is no reason for it to be different at 262k or 244 k.
“The fact is that the mechanis is the same at all temperatures. So when you claim the mechanism is different, and does not WORK at 262/220, that is you making up contradictory nonsense.”
I literally just explained to you that I’m not saying the mechanism is different at different temperatures. Are you a bit slow?
Willard says:
June 27, 2026 at 11:06 PM
Gill still denies that Eli did not write this post:
https://skepticalscience.com/green-plate-dynamics.html
How many times will I have to post it?
More than we should need, sadly.
—————————-
Why should I care Willard? That post was written 6 years after the original and just repeated the same mistakes as the original and even copied large portions of the original post.
https://rabett.blogspot.com/2017/10/an-evergreen-of-denial-is-that-colder.html
I would suggest that quite likely your author got a degree in one of those ”arts” of science majors they crank people through to qualify them as government clerks in regulatory agencies.
Get over it guys. Study the MIT textbook for the right answer and stop posting stuff from guy who couldn’t even cut it at some Canadian government institution where science is whatever the leader determines it to be.
https://skepticalscience.com/posts.php?u=5454#:~:text=Bob%20Loblaw%20is%20the%20nom,climatology%20(especially%20microclimatology)%20and%20permafrost.
Designed for students who can’t handle the math. Where science and green religion are intermingled. Do you want to be a dancing physicist too artsy oriented to crank through a math education. . .more the salesman than the scientist.
https://www.colorado.edu/artsandsciences/
Nate says:
“No, Nate. The mechanism by which “heat loss is reduced” in the 262 K…220 K solution is the illegal transfer of thermal energy “against the flow”. Clearly that is not the mechanism in the 244 K…244 K solution because that transfer does not occur to completion in the 244 K…244 K solution!”
So you declare. without a shred of evidence.
———————
You mean the bunny rabbit’s math allocating wattage from the GP to the BP isn’t a shred of evidence? Dang its a thought experiment to begin with and the Easter Bunny’s math is its only description. Sheeesh its amazing how deep into intellectual dishonesty you are willing to dive Nate. then you compound it by not believing the results of actual experiments that validate the MIT Textbook approach.
xxxxxxxxxxxxxxxx
Nate says:
”The fact is that blackbody plates DO reduce heat loss, as you agree.”
False there is is not a reduction of heat loss.
You are just firing from the hip and missing the target by a mile.
Going back to DREMT’s analogy of splitting a plate in half and separating them doesn’t change anything with respect to cooling rates.
But 2 identical plates instead of one doubles the heat capacity requiring a longer period of time to actually cool at the same rate of cooling.
Meaning when you turn the light off photons continue to bounce between the theoretically completely non-resistive plates as theorized by the classic physicists without escaping completely satisfying 1LOT in essentially the same way the two plates put together in one plate would with phonons replacing photons.
So yes two plates take longer to cool than one plate without changing the rate of cooling.
And poof Nate’s entire GPE argument goes up in smoke.
Like I keep saying: Read the MIT textbook for understanding and stop listening to quacks.
> Why should I care
Why would Gill care about getting caught telling fib after fib?
The pet source he cites but never quotes isn’t “peer reviewed”, certainly not the creative accounting he promotes.
Sad.
“The fact is that blackbody plates DO reduce heat loss, as you agree.”
“False there is is not a reduction of heat loss.”
Your boss DREMT agrees that there is.
And Ive shown you links to physics textbook sources, now around 7 times, that DERIVE an equation that demonstrate that blackbody plates in parallel reduce heat loss.
One of the sources was yours!
Youve had now around 7 times to respond and rebut, and each time you just disappeared.
I think seven is enough opportunities wasted, dont you?
“I literally just explained to you that I’m not saying the mechanism is different at different temperatures. Are you a bit slow”
OK, the the mechanism, the one that DOES actuaLly reduce heat loss, should work at 262K or 220K, just the same as it does at 244K, or any other temperature?
Or not, because you WANT to have a different mechanism that does not work, for some reason, when operating between 262K and 220K.
But you still claim that heat loss is reduced, even while claiming it isn’t, between certain temperatures, when you say so..
Maybe you can make sense of these different stances, somehow.
Nate says:
“So you declare. without a shred of evidence.”
bill responds:
“You mean the bunny rabbit’s math allocating wattage from the GP to the BP isn’t a shred of evidence? Dang it’s a thought experiment to begin with and the Easter Bunny’s math is its only description. Sheeesh it’s amazing how deep into intellectual dishonesty you are willing to dive Nate. then you compound it by not believing the results of actual experiments that validate the MIT Textbook approach.”
Nate ignores the response. On and on it goes.
Nate, it’s got nothing to do with temperature. I actually think you may have a learning disability.
Again, the mechanism that doesn’t work is the one in Eli’s solution. That mechanism is the transfer of thermal energy “against the flow”. But, it doesn’t matter what the temperatures are. In any hypothetical scenario you can think of, a transfer of thermal energy “against the flow” will not work. A transfer of “back-radiation” will not result in the warmer object getting warmer still – whatever its temperature. 2LoT will prevent the transfer from completing.
The mechanism that does work is the one in the alternative solution. That’s where the transfer of thermal energy “against the flow” is returned to the cooler object. There, you have the cooler object warming until it’s at its equilibrium temperature – whatever it may be. As it warms to its equilibrium temperature, “heat loss is reduced” from the warmer object – and, obviously, it does not result in the warmer object getting warmer still, because that “back-radiation” transfer has been returned to the cooler object.
Do you finally understand, Nate?
Wow this is getting embarrassing for Nate. Imagine taking on MIT and the classic physicists. On what? the imagination of a failed scientist?
What do you think Willard? Did Bob Loblaw (pseudonym) get fired from the untenured assistant professorship because his bosses didn’t trust him with a budget for a study; or did he get the budget and botched it?
https://skepticalscience.com/posts.php?u=5454#:~:text=Bob%20Loblaw%20is%20the%20nom,climatology%20(especially%20microclimatology)%20and%20permafrost
thats some reference you are trying to shove down folks throat coming up with something totally incompatible with MIT heat transfer principles.
“Again, the mechanism that doesnt work is the one in Elis solution. That mechanism is the transfer of thermal energy ‘against the flow’. But, it doesnt matter what the temperatures are. In any hypothetical scenario you can think of, a transfer of thermal energy ‘against the flow’ will not work.”
1. Any blackbody emits EMR according to its temperature, by the SB Law. That means the GP emits EMR toward the BP.
2. Blackbodies absorb all EMR that hits them, according to Kirchhoffs Law. That means the BP MUST absorb the EMR emitted by the GP.
There is no way to avoid these two ordinary facts. Though the EMR emitted by the GP may be ‘against the flow’ of heat from the BP to GP, when the BP is warmer than the GP, this is NOT A PROBLEM, since that EMR is a one-way flow, not the NET transfer of energy, which is still from the warmer BP to the cooler GP.
You still seem unable to wrap your brain around this simple concept.
“A transfer of ‘back-radiation’ will not result in the warmer object getting warmer still’ whatever its temperature. 2LoT will prevent the transfer from completing.”
Indeed there can be no spontaneous transfer of Net energy (Heat) from cold to warm bodies, by 2LOT.
What can happen, is with a HEAT SOURCE applied to the warm body, if the heat LOSS is reduced, it can warm. And no heat transfer from cold to hot is NEEDED in that case.
This is a normal everyday phenomena, such as using a blanket or an oven door to reduce heat loss and thus enable a heated object to get warmer
You still seem unable to wrap your brain around this simple concept, that having a HEAT SOURCE makes all the difference.
“The mechanism that does work is the one in the alternative solution. Thats where the transfer of thermal energy ‘against the flow’ is returned to the cooler object.”
Sure, if one feels like they can simply turn off the Laws of Physics whenever they feel like it!
But that cannot happen in this universe.
“There, you have the cooler object warming until its at its equilibrium temperature, whatever it may be.”
Or cooling to its equilibrium temperature. Which in any case, cannot be the same temperature as the heated warmer object, else would violate 1LOT.
“As it warms to its equilibrium temperature, ‘heat loss is reduced’ from the warmer object”
Yes indeed, then please follow the logic here. If the heated object’s heat LOSS is reduced, and its heat input is steady, it MUST WARM.
“and, obviously, it does not result in the warmer object getting warmer still”
No, you are not following the simple logic, that the heated object has a steady heat INPUT, and if it now has reduced heat LOSS, as noted above, it MUST WARM.
“because that ‘back-radiation’ transfer has been returned to the cooler object.”
No, because the Laws of Physics are not on an a-la-carte menu that you can pick and choose from. They all must be always followed.
And furthermore, your notion that a blackbody can decide, of its own volition, to sometimes become a perfect reflector is utterly stupid.
Nate, you’ve misunderstood. I’m not asking for a line by line rebuttal. I wrote that post to explain to you that this:
“The reality is that you assert that the mechanism by which heat-loss is reduced by blackbody plates is different at different temperatures…”
was a total misrepresentation. Now, you should understand that there was never any contradiction. You’ve wasted weeks of everybody’s time complaining about a contradiction that never was. OK?
[GILL] You mean the bunny rabbit’s math
[GRAHAM D. WARNER] Eli’s algebra is correct.
Every single time Gill and Gaslighting Graham tag team they create double binds like that.
And I further explained why you are STILL in a state of contradiction.
https://www.drroyspencer.com/2026/06/uah-v6-1-global-temperature-update-for-may-2026-0-53-deg-c/#comment-1747494
If you have answers, then quote this and point out where you disagree.
The main point is you cannot say
‘blackbody plates reduce heat loss’ THEN try try to imagine a fake mechanism for this that will not work!
That is a strawman, it makes no sense and it produces a contradiction.
There is a perectly valid mechanism that works for 244K and 262K and 220 K, as I showed you in perfectly valid physics sources that derive that mechanism.
I also clearly describe how that mechanism works.
“If you have answers, then quote this and point out where you disagree.”
This comment explained everything:
https://www.drroyspencer.com/2026/06/uah-v6-1-global-temperature-update-for-may-2026-0-53-deg-c/#comment-1747498
If you are honest, you will:
1) Apologise for the misrepresentation.
2) Accept that there was never a contradiction.
I will accept nothing else from you, Nate.
“Eli’s algebra is correct…”
…but the physics it represents is wrong. That would be the full quote, if you weren’t such a disgusting, lying, sack of human garbage, Willard. So, no double bind.
Now, crawl back under your bridge.
Graham D. Warner could recognize that Gill and him disagree about Eli’s maths. But no, he has to rip off his shirt.
What a pathetic little crank.
Willard rips off his shirt after losing another point to a better man. Sad.
Poor Graham. Can’t even throw Gill under the bus.
Astute readers can bet he won’t correct Gill’s “Bob Loblaw (pseudonym)” either!
Well, with the GPE debunked:
https://www.drroyspencer.com/2026/02/uah-v6-1-global-temperature-update-for-january-2026-0-35-deg-c/#comment-1733329
and Nate’s claim there was a contradiction:
https://www.drroyspencer.com/2026/06/uah-v6-1-global-temperature-update-for-may-2026-0-53-deg-c/#comment-1746467
also debunked, there’s nothing left to discuss.
Poor Graham, can’t even convince Puffman:
[PUFFMAN] Earth’s atmosphere definitely acts as a blanket…it’s insulation restricting the flow of energy to space.
Here’s one such model of the atmosphere:
https://rabett.blogspot.com/2018/08/the-simplest-green-plate-effect.html
Team Science remains undefeated by Sky Dragon cranks!
Willard’s extremely dishonest quote-mining strikes again. Such desperate tactics mean he’s acknowledged defeat. Thx.
Willard says:
Poor Graham, can’t even convince Puffman:
[PUFFMAN] Earth’s atmosphere definitely acts as a blanket…it’s insulation restricting the flow of energy to space.
————————
And just like that Willard abandons the GPE and decides he wants to talk about the atmosphere.
Yes the atmosphere works somewhat like a blanket because a blanket quashes convection like a greenhouse does. Convection also accounts for clouds that are reflective and have some radiative effects on the GHE.
But Willard has decided to abandon the Easter Bunny as the going was getting rough for his propaganda there, and run to another place where he can continue to parrot the obfuscation his daddy inculcated him with.
And just like that Gill shows he has no idea about Eli’s model:
https://rabett.blogspot.com/2017/10/an-evergreen-of-denial-is-that-colder.html
Next he’s gonna act all surprised by this quote.
Our two cranks don’t even maths, physic or even reading.
And yet, Willard obviously failed to understand Clint R’s full comment. Or else, he’s deliberately misrepresenting it through quote mining. Neither would surprise me.
Clint R is already on record as saying the Green Plate Effect is not insulation:
https://www.drroyspencer.com/2026/01/uah-v6-1-global-temperature-update-for-december-2025-0-30-deg-c/#comment-1732832
“So for any adults following, here’s Nate’s problem:
He confuses “back-radiation” with “insulation”. This is another common mistake in the cult. They believe “back-radiation” is an actual insulator. To understand, consider only one plate. The plate is thick and composed of material that is a poor conductor, instead of being a perfect conductor. The plate conducts so poorly that when it is warmed on one side with 400 W/m^2, that only 133 W/m^2 is emitted from the other side. The side warmed by the 400 W/^2 reaches a temperature of 262K, emitting 267 W/m^2. And the back side reaches a temperature of 220 K. This is very valid, and does not violate any laws of thermo. This is what Nate believes happens with the blue/green plates. He confuses “back-radiation” with “insulation”.“
Graham D. Warner keeps gaslighting, oblivious that he cited the famous thread where he admitted:
[GG] I don’t have a problem with the existence of “back-radiation”. It’s there, to be sure.
And then he backtracked to the concept “warming” instead of “insulation”, which is also obvious when he spoke of “backradiation warming/insulation”.
Either the atmosphere insulates or it does not. Eli’s model is a model of the atmosphere. In a sane world, that’d be the end of it.
Besides, Mark B knocked down Puffman’s unphysical model quite cleanly:
https://www.drroyspencer.com/2026/01/uah-v6-1-global-temperature-update-for-december-2025-0-30-deg-c/#comment-1732860
Right under the comment he misrepresents.
All Gaslighting Graham has is word games.
He sucks at word games.
The Green Plate Effect is not insulation, Willard. Nor is it any kind of “insulation-type effect”.
I’ve never denied that “back-radiation” exists. Never. I’ve always maintained that it does not result in warming of the warmer object.
The entire foundation of the GHE (no matter what definition of it you go with) is the idea that “back-radiation” leads to warming. Refute that, and you refute the GHE.
So – refute the GPE, and you refute the GHE.
Mission accomplished.
Gaslighting Graham keeps gaslighting.
What he calls the “greenplate effect” is actually the greenhouse effect.
He calls that the “greenplate effect” because he will resist just about every single inference Team Science makes.
But when he pretends having refuted the greenhouse effect, now suddenly the “greenplate effect” is the greenhouse effect.
Gaslighting Graham sucks at word games.
No word games from me, Willard.
The GPE’s debunked by a simple chain of logic that absolutely nobody, despite their endless rambling in circles, can refute.
Willard,
KIDDO: [“Nothing’s changed in eight years, Nate. Obviously, I’ve always understood 1LoT. And, the principle of conservation of energy, of course, applies to all types of energy. Not just “heat”.”]
GR: [“Only a major ijit would try to apply this law as a generalized conservation of energy law when the only energies addressed are heat and work. How, for example, can you apply it to the relationship between EM and heat, or electrical energy and heat?”]
…in all seriousness, it is time for Kiddo and Gordon Roberston to duke it out. Off they both go.
https://www.drroyspencer.com/2026/06/uah-v6-1-global-temperature-update-for-may-2026-0-53-deg-c/#comment-1747630
Graham D. Warner has nothing but word games against a very simple demonstration:
https://rabett.blogspot.com/2018/08/the-simplest-green-plate-effect.html
Team Science Wins Again!
Willard says:
”And just like that Gill shows he has no idea about Eli’s model:
The relevance of this proof is that the Earth is heated by light from the Sun and layers of the atmosphere containing greenhouse gasses act as the colder third body.
https://rabett.blogspot.com/2017/10/an-evergreen-of-denial-is-that-colder.html”
———————
DREMT is correct to slow down the transport of energy and cause the warmer surface to warm you need resistance.
What happens if you have the insulation is the cooler object GP warms to the same temperature as the BP. Only at this temperature does the direction of Entropy become reversible.
But the guy that faked you out couldn’t make the science make any sense just making one error so he had to make multiple errors.
Once two conditions are met 1) equilibrium exists, and 2)insulation exists then entropy can be reversed.
If Eli recognized either of these laws of physics then he would be faced with too much radiation being lost so he had to 1) stop the warming of the GP before entropy could be reversed then 2) reverse the entropy anyway. . .violating 2LOT.
Thus the form of warming for the GPE is even wrong for an insulated surface by prematurely reversing the entropy. So you have two errors. . .one reversing entropy before its reversible, and two mistaking backradiation for insulation.
Thus the nameless guy disguised with the fake name, Eli, convinced you of this travesty of alleged science that doesn’t meet the conditions of any university in the nation.
You can confirm that by going through the numerous examples and problems in the textbook.
The MIT textbook page 569 example 10.25 says: If the plates are both black, ε = 1.0, then both surface resistances are zero.
You want to dispute that but you lack a credible source to back up something that simply cannot be backed up.
Richard Feynman famously declared: “It doesn’t matter how beautiful your theory is, it doesn’t matter how smart you are. If it doesn’t agree with experiment, it’s wrong.”
The rules in the MIT textbook have been backed up by over a 100 years of experiments. . .Eli has no experiments, no support, no experts, just a lot of true believers.
> [Graham D. Warner] is correct to slow down the transport of energy and cause the warmer surface to warm you need resistance.
Gill kinda forgot to quote Gaslighting Graham ever say that.
Besides, Gill kinda forgot about one of his pet gurus:
https://www.drroyspencer.com/2026/06/uah-v6-1-global-temperature-update-for-may-2026-0-53-deg-c/#comment-1746428
Sad.
Willard concedes that Eli is wrong about backradiation being radiation.
Then he argues for the MIT textbook that is if you do have insulation then you can reduce heat loss.
Welcome to our side Willard. I am overjoyed that you finally conceded the point. Congratulations. There may be some hope for you.
Fair enough, Eldrosion. And, since you and everybody else on your “team” disagrees with Gordon, you should all be taking my side on the “conservation of energy” point against Nate. So, that’s even more people who should be arguing against Nate, just on a different point. Off you all go!
Indeed word games are all DREMT can do here.
He admits that blackbody plates in vacuum are passive objects that can reduce heat loss.
Which is exactly what insulation does, what ‘to insulate’ means.
But he refuses to admit that blackbody plates insulate.
Honestly who cares? What he calls it makes no difference to what blackbody plates can do.
He also admits that blankets, and oven doors reduce heat loss, ie insulate. And that ability enables them to cause heated bodies, like a person, or an oven, to WARM.
But he refuses to admit that blackbody plates, with the very same ability to reduce heat loss, can enable a heated plate to get warmer.
Why? Mumbo jumbo about ‘its a different mechanism’ that would violate 2LOT. So ‘it cannot happen’.
And he STILL cannot figure out why stating that
1. ‘blackboody plates reduce heat loss.
2. But the mechanism violates 2LOT, so it cannot happen.
puts him in a state of CONTRADICTION.
Broken logic chip?
Nate finally crawls back down here, thinking he can get away with posting the same crap that has been completely debunked. I said here:
https://www.drroyspencer.com/2026/06/uah-v6-1-global-temperature-update-for-may-2026-0-53-deg-c/#comment-1747549
That he has two things to do, and that is all I will accept from him.
> concedes that Eli is wrong about backradiation being radiation
Gill’s waffling is getting harder and harder to support by our Sky Dragon cranks.
Perhaps one day Gill will read his pet textbook instead of going around in circles of abuse.
“…concedes that Eli is wrong about backradiation being radiation”
From context, I had assumed bill meant to say, “Eli is wrong about backradiation being insulation”.
More gaslighting by Gaslighting Graham.
“completely debunked. I said here:”
Again, some people have way too much trouble understanding the absurdly simple logic of contradiction.
Such as saying something happens, then saying it cannot happen so it does not happen.
If you then declare its not a contradiction…. it still is!
Allow me to correct you again, Nate:
1. blackbody plates reduce heat loss as per the 244 K…244 K solution mechanism only.
2. The different mechanism in the 262 K…220 K solution violates 2LOT, so that cannot happen.
No contradiction.
> as per the 244 K…244 K solution mechanism
More gibberish by Graham.
Nate says:
Indeed word games are all DREMT can do here.
He admits that blackbody plates in vacuum are passive objects that can reduce heat loss.
Which is exactly what insulation does, what ‘to insulate’ means.
But he refuses to admit that blackbody plates insulate.
—————————-
Nate continues to feverishly construct strawmen rather than use scientific references to support his argument.
It has only been a few hundred times DREMT has acknowledged that any plate with any radiative qualities can be insulated by restricting conduction rather than radiation.
This strawman gets constructed despite the construction of the GPE being one with uninsulated blackbody plates and he knows that.
He just plucked the idea that a cooler uninsulated blackbody plate
can warm a warmer blackbody plate off an anonymous blog run by some anonymous guy wearing a rabbit disguise. And now for 8 years has tried to sell it as settled science when he undoubtedly now knows it is contrary to science accepted by any sellable textbook or legitimate expert in thermodynamics in the entire world.
He simply isn’t man enough to admit he is wrong while on the inside knowing he is wrong. Really sad and completely spineless in fear of losing a reputation he only ever had just in his own mind. A real problem there for somebody who has never done anything to earn a good reputation on the subject matter ever.
One should take a hint that when the last 2 holdouts are fulltime constructing strawmen to try to win the point the argument has been over for a while.
> any plate with any radiative qualities can be insulated by restricting conduction rather than radiation.
Gill still plays dumb:
https://rabett.blogspot.com/2017/10/an-evergreen-of-denial-is-that-colder.html?showComment=1508060013485#c2304950519192962789
Something tells me that our two cranks are holding the weird idea that radiation is just convection at a distance.
“…the 244 K…244 K solution mechanism…”
…that means the mechanism of “heat loss reduction” from the BP that can be observed in the 244 K…244 K solution, as the GP warms (or cools) to equilibrium. Unless the GPE fanatics are trying to permanently remove the concept of equilibrium from existence, then as the GP nears its equilibrium temperature, of course “heat loss is reduced” from the BP. That should go without saying. It doesn’t lead to warming, in that solution. That’s because the “back-radiation” transfer is returned to the GP, in that solution.
I can explain this as many times as it’s necessary to finally sink in, for people.
> that means the mechanism of “heat loss reduction” from the BP that can be observed in the 244 K…244 K solution
Graham D. Warner keeps waffling.
Astute readers might wonder: as opposed to what?
Willard says:
”Conduction and convection are not relevant to a discussion of radiation except in that at equilibrium, internally a black body itself is all at the same temp by definition.”
https://rabett.blogspot.com/2017/10/an-evergreen-of-denial-is-that-colder.html?showComment=1508060013485#c2304950519192962789
Something tells me that our two cranks are holding the weird idea that radiation is just convection at a distance.”
Willard tries to construct another strawman then back it up with his same old tired totally refuted non-scientific source. . .the Easter Bunny.
“…as opposed to what?”
As opposed to the mechanism of “heat loss reduction” from the BP that can be observed in the 262 K…220 K solution. That mechanism is simply the “back-radiation” transfer occurring to completion, and as explained ad nauseam, that violates 2LoT.
Of course, astute readers would already know that, having read my previous comments which already explained all this.
> As opposed to the mechanism
Graham D. Warner keeps waving his arms.
Astute readers and everybody know hows anything about physics know that there’s only one mechanism.
8 years on that bullshit.
> tries to construct another strawman
Gill already forgot having said:
https://www.drroyspencer.com/2026/06/uah-v6-1-global-temperature-update-for-may-2026-0-53-deg-c/#comment-1747753
Graham D. Warner won’t say anything about that.
“Astute readers and everybody know hows anything about physics know that there’s only one mechanism…”
…there’s only one correct mechanism, the one in the 244 K…244 K solution. The mechanism in the 262 K…220 K solution violates 2LoT. The important point, though, is that the contradiction Nate claims is debunked. If he understood anything about my arguments he would never have claimed there was a contradiction in the first place! He’s wasted weeks of everybody’s time.
And, of course the plates could insulate via conduction, if they were not perfect conductors. They could also insulate if reflective.
> there’s only one correct mechanism, the one in the 244 K…244 K solution.
Graham D. Warner keeps equivocating. There is one mechanism. There are two interpretations. Graham’s current word game allows him to present his interpretation as a mechanism. His true Scotsman is cute, tho.
Astute readers might wonder how long he will try to hide the fact that what he presents as a MeChANisM is him waving his arms.
Willard has no credible sources, science, experts, or experiments to link us to in support of his fanatical belief system.
So he is just full on strawman building and obfuscating away needlessly without convincing anybody of anything about the GPE.
No, Willard. You’re confused. It’s my argument, and I’m instructing you on what that argument is. You don’t get to tell me I’m wrong!
There are two different mechanisms, one where the “back-radiation” transfer goes to completion, and one where the “back-radiation” transfer is returned to the cooler object.
Bill, you again forget that I showed you two physics textbook derivations, several times now, that prove that blackbody plates placed between a warm body and a cold envronment reduce radiatice heat loss from the warm body.
One of which was your own source!
There seems to be no point to showing you anything.
“1. blackbody plates reduce heat loss as per the 244 K…244 K solution mechanism only.
2. The different mechanism in the 262 K…220 K solution violates 2LOT, so that cannot happen.
No contradiction.”
Again, imagine a mechanism that is designed to not work, and claim, falsely that it operates at 262/220
But ALSO agree with physics sources that there is another mechanism that works at any temperature, but not at 262/220, for some reason.
Meanwhile we can simply apply the RHTE to show how heat loss from the BP IS REDUCED whenever a passive GP is placed behind it.
With no heat needing tovever flow from cold to hot.
As confirmed by physics textbook sources that I showed you.
Where are your physics sources?
So Nate waits a couple of days, then repeats his misrepresentation!
I don’t believe Nate is this dumb, so I’m going to have to go with this being a deliberate attempt to irritate. Nate is trolling me.
Here is the comment where I corrected Nate’s misrepresentation last time:
https://www.drroyspencer.com/2026/06/uah-v6-1-global-temperature-update-for-may-2026-0-53-deg-c/#comment-1747498
I’m not going to keep repeating myself.
[GRAHAM, 2026] I’m not going to keep repeating myself.
[GRAHAM, 2018] Rest assured I will (where possible) write just one post each day, from here until the article closes for comment, probably just something along the lines of, “my previous comments refute your arguments. I suggest you read them”, if you continue to respond in disagreement.
After all these years, Graham has yet to repeat the derivation that would support his “mechanism” and refute once and for all Team Science, for he never really stated it.
No rush.
Its not actual debate, to simply declare, without evidence or a source (where is it?) that you know the mechanism for heat loss reduction does not work at 262/220, but it works just fine at 244/244, when you do not actually know that.
Nor can you even describe the mechanism.
Whereas, I showed you a textbook source which derives the mechanism with real physics, which can operate at 262/220.
And you cannot refute this source.
That is called me winning that particular debate.
Here’s how you described your “mechanism”:
“A passive plate placed between a warm and cold body eg BP and Space. The new plate equilibrates to a temperature intermediate between that of the two bodies. Therefore the RHTE finds a reduced heat loss between the warm body and the intermediate plate, than it had previously directly to the cold body. The intermediate blackbody plate shields the warm body from its cold environment. It must get warmer. This is no different from standing in front of an open freezer and your skin ‘seeing’ and feeling the cold. Then place a door in between, and suddenly your skin warms. It is no longer ‘seeing’ or feeling the cold freezer. This is the mechanism.”
The only problem is – it’s not actually a mechanism, is it, Nate? You do not describe what actually, physically, happens to reduce the heat loss! You simply say, “therefore the RHTE finds a reduced heat loss…” leaving it completely unexplained as to how!
But, I can explain. In Eli’s solution, the actual physical mechanism is – the “back-radiation” transfer occurring to completion. Simple as that. It’s energy being transferred “against the flow”. And, it violates 2LoT.
So, what happens instead? The “back-radiation” transfer is returned to the GP. That’s the real mechanism by which “heat loss is reduced” by blackbody objects. The transfer is returned to the cooler object, and the cooler object approaches equilibrium with the warmer object. Thus, no warming of the warmer object occurs.
> You do not describe what actually, physically, happens to reduce the heat loss!
Lots of adverbs.
Graham D. Warner must be referring to his MeCHanISm.
Perhaps that will help:
https://en.wikipedia.org/wiki/Statistical_mechanics
His “no U” hides that he himself never really described his mechanism, unless by “describing” he means his troll bridge, not anything he could ever formalize well enough so that astute readers could see there’s no there there.
We’re past the month, but he won’t stop unless he finds a way to peddle one of his three pet topics in the next thread. And we can be sure he’ll try to blame otters for making him do it.
Nate wasted everybody’s time for the past month (or more) declaring there was a contradiction in my arguments that never was!
It doesn’t matter that you idiots want to try to endlessly criticise me personally, or try to desperately pick at some other imagined hole in the argument – the only thing that matters to this particular dispute is, is my logic internally consistent, or not? I’ve shown countless times that it is.
Nate and Willard’s egos prevent them from ever admitting they were wrong. That’s all that’s happening here.
Nate says:
Bill, you again forget that I showed you two physics textbook derivations, several times now, that prove that blackbody plates placed between a warm body and a cold envronment reduce radiatice heat loss from the warm body.
One of which was your own source!
There seems to be no point to showing you anything.
——————-
Gee I must have forgotten as I have no recollection of you ever doing that. Thats amazing to me because I have been asking you guys for link to a legitimate source for months now.
I take it that it isn’t a textbook since you say it was derived from a textbook. Obviously the textbook needs to support the form of the derivation so please provide a link to the textbook and where in I can find the derivation.
There are plenty of these types of derivations in the MIT textbook and MIT comes up with a different answer than what you are trying to feed DREMT in each and every one of them. Its a tough road to find a more respected source than MIT.
“Bill, you again forget that I showed you two physics textbook derivations, several times now, that prove that blackbody plates placed between a warm body and a cold envronment reduce radiatice heat loss from the warm body…”
…obviously. Because the cooler body warms to the same temperature as the warmer body! And, the warmer body doesn’t get warmer still, because the back-radiation transfer is returned to the cooler body.
> Gee I must have forgotten as I have no recollection of you ever doing that.
Graham’s gaslighting is rubbing on Gill a little.
Has he asked his “Google AI” buddy about statistical mechanics and how silly it is to try to decompose Eli’s model photon by photon?
Are what must be over one thousand false accusations of gaslighting from Willard enough to count as actual gaslighting from him?
“Gee I must have forgotten as I have no recollection of you ever doing that. Thats amazing to me because I have been asking you guys”
Sure, memory loss makes everything a new revelation.
DREMTs memory of it us still intact, though.
Just saw this remarkable comment from a couple if days ago.
“Unless the GPE fanatics are trying to permanently remove the concept of equilibrium from existence, then as the GP nears its equilibrium temperature, of course “heat loss is reduced” from the BP. That should go without saying. It doesn’t lead to warming, in that solution.”
Let’s be very clear about what you are saying here.
It is that the ‘heat loss is reduced’ from the BP.
But no mention tgat we also KNOW that its heat input from the Sun is FIXED.
“It doesn’t lead to warming”
How is that possible?
You claim to understand 1LOT.
It clearly states that a NET gain in HEAT must lead to a body GAINING Internal Energy and Temperature!
There is no ambiguity.
I dont see how you can still be SOoo confused about this?
It just illustrates very clearly how your narrative just makes no sense.
Nate is still playing dumb.
Graham D. Warner keeps gaslighting.
Perhaps he would prefer:
https://www.youtube.com/shorts/XT_0sn1Er7Q
Also just saw this!
“The only problem is – it’s not actually a mechanism, is it, Nate? You do not describe what actually, physically, happens to reduce the heat loss! You simply say, “therefore the RHTE finds a reduced heat loss…” leaving it completely unexplained as to how!”
Ummm, yep, I most certainly did.
Team science understands that the intermediate green plate must equilibrate to a temperature BETWEEN the temperatures it ‘sees’ on each side, that of the BP and space.
I think can all agree that the intermediate green plate will be somewhere between 220 K and 244 K.
At any T in this range, we can simply use the RHTE (which I assume everyone agrees is valid) to find the heat loss from the BP to the GP is reduced, from what it was without the GP.
QED
What is your problem with it?
PS the textbook sources derive the heat loss with math, which you will not understand. And they do indeed find intermediate plates are at intermediate temperatures.
The full comment (note the bits Nate deliberately left out):
“…the 244 K…244 K solution mechanism…”
…that means the mechanism of “heat loss reduction” from the BP that can be observed in the 244 K…244 K solution, as the GP warms (or cools) to equilibrium. Unless the GPE fanatics are trying to permanently remove the concept of equilibrium from existence, then as the GP nears its equilibrium temperature, of course “heat loss is reduced” from the BP. That should go without saying. It doesn’t lead to warming, in that solution. That’s because the “back-radiation” transfer is returned to the GP, in that solution.
I can explain this as many times as it’s necessary to finally sink in, for people.
Nate says:
But no mention tgat we also KNOW that its heat input from the Sun is FIXED.
“It doesn’t lead to warming”
How is that possible?
—————-
Read the MIT textbook Nate. It demonstrates in examples how. You will find the MIT textbook consistent with experiments. . .whereas your proposed solution (The Easter Bunny fraud) is not at all consistent with experiments. Educate yourself.
“Ummm, yep, I most certainly did.”
No, Nate. It’s not actually a physical mechanism you are describing. An equation isn’t a physical mechanism. Once again, in Eli’s solution, the physical mechanism is the “back-radiation” transfer occurring to completion.
However, none of this matters right now. The point of this long, long discussion was only about Nate’s claim of a contradiction, and I’ve shown repeatedly that there isn’t one. Nobody expects Nate to ever concede anything, though, so that’s that.
Nate refuses to recognize the MIT textbook.
So rather than disputing the MIT textbook he wants us mere mortals to answer a question as to the exact disposition of the photons that are theoretically emitted toward the BP. Which of course we in do in compliance with 2LOT, 1LOT, and the principle of black plates with perfect conductivity posing no resistance to the passage of energy via heat and radiation.
then we have Nate, the Easter Bunny, and probably Santa Claus to boot giving us a different answer.
The Easter Bunny computes the photons from the colder GP as warming the BP. Nate realizing this violates 2LOT denies the Easter bunny disposition of that energy. Then he claims that its the sun warming the BP beyond 244K and to punctuate that claims 1LOT must be violated if the BP doesn’t warm (cycling to and fro on his denial of a 2LOT violation.)
But in reality Nate is the only one with an argument that doesn’t account for all the photons. so on photon accounting Nate can’t figure it out yet photon theory tells us they need to be accounted for. We and the MIT textbook both provide calculations that tell us where they end up and has been verified by countless thousands of experiments over the past 125+ years.
The MIT textbook puts the final nail in the Easter Bunny coffin by directly saying that if both the plates are black (ε=1) the surface resistance of both plates is zero. . .i.e. zero insulation.
“No, Nate. It’s not actually a physical mechanism you are describing. An equation isn’t a physical mechanism. Once again, in Eli’s solution, the physical mechanism is the “back-radiation” transfer occurring to completion.”
Hand waving without math generally proves to be flawed reasoning.
Physics relies on math.
You should, after 8 years, understand that the RHTE is valid, and that it comes from taking the thermal energies radiated by all bodies according to their temperature, and absorbed by adjacent bodies.
Then taking the NET of these transfers.
Do you want me to show you the SB law derivation? Doubtful.
And physically, you ought to understand perfectly well by now that when a warm body’s view of its very cold environment is replaced with a view to a much less cold environment, then its radiative heat loss is reduced.
Are you really going to tell us that you still, after all these years, cant understand this simple concept?
> refuses to recognize the MIT textbook.
Gill keeps on gaslighting, following on Graham’s tradition.
He will just keep abusing until someone someone spoon feeds him.
Looks like nobody’s biting, so that might continue for a while.
Nate’s latest comments remain unchallenged by our Sky Dragon cranks.
An equation is not a physical mechanism, Nate.
Perhaps Gill could have helped Graham here:
Op. Cit.
With an S.
What you are saying is:
‘I, DREMT, after 8 years of learning, still can’t understand basic radiative heat transfer principles’
But you still expect people to believe you know what you are talking about?
Wow!
Willard hits and hopes, but unfortunately has no idea what he’s talking about.
Graham D. Warner mishandles another concept.
This time it’s MeCHaNisM.
Another false accusation from Willard, to ignore.
Nate says:
Physics relies on math.
You should, after 8 years, understand that the RHTE is valid, and that it comes from taking the thermal energies radiated by all bodies according to their temperature, and absorbed by adjacent bodies.
Then taking the NET of these transfers.
Do you want me to show you the SB law derivation? Doubtful.
——————–
doubtful? You have to be kidding. we have been trying to get you to use the mathematical treatment of a more than 2 surface system for over a month and you just ignore it.
This methodology is specified in the MIT textbook with examples and accompanying problem such that you would learn the correct way of doing it rather than relying on the Easter Bunny to tell you how to do it or ignorantly using Stefan Boltzmann’s 2 infinite surface radiation model which is correct but only for 2 surfaces.
The GPE is a 6 surface model with a point source of energy and 2 surfaces held at 0K. How to do that is specified by the entirety of Chapter 10 for any level of emissivity or field of view.
Yes do it absolutely, show your work and your references from the MIT textbook with labeled steps. . .the GPE is a more complicated problem than the 2 surface model of Stefan and Boltzmann but the MIT envisions far more complicated models than the GPE but you need to understand the entire chapter to learn that fact.
We would love to see you choke on your foot. But we are not holding our breath that you are going to actually do what you promised above using a credible source. So I wager all we will see is nothing but one big choke with you hiding behind a screen and not coming through because you are not man enough to face the music.
> we have been trying to get you to use the mathematical treatment
Gill finally admits that his constant sammich requests are pure bait.
Progress.
Willard gaslights, piles on his gaslighting, and gaslights a little more.
Weird No U by Graham D. Warner, but OK.
What happened to Nate? Why did he disappear?
Awww, ya miss me?
Nothing worth responding to here.
Nate says:
”Nothing worth responding to here.”
Your backpedaling especially from “Do you want me to show you the SB law derivation? Doubtful.” eh?
We can take your desired absence as a concession. . .we aren’t going to hold your head underwater until you verbally own up to it. You have demonstrated it adequately with your departure.
[GRAHAM] Yet you people think I want you to keep responding to me!? I really don’t.
[GILL] We can take your desired absence as a concession
Willard arranges two quotes from two different people seemingly at random, no obvious point being made, and he cannot even get either screen name right. Oh well.
Graham D. Warner might never get what is a double bind.
Or he does, and simply plays dumb.
After nine years, same difference.
I don’t want you guys to respond to me, but since you do anyway, and bait me into a month-long back-and-forth, I kind of expect you to not run away at the last minute. But that’s me, anyway. What’s my thoughts got to do with bill? We’re two different people.
Willard is just a troll. Their mission is produce irrelevancy. Therefore the best approach is just ignore them so they can be as irrelevant as possible.
Bill,
I get almost exclusively insults and misrepresentations of my posts from you.
That makes you a TROLL.
If you are not able to maintain a civil and honest discussion, then you will get no response from me.
Simple as that.
Nate you said you would show us the derivation of Stefan Boltzmann science for a 6 surface model with a point source. We asked you to use the Massachusetts Institute to Technology’s textbook as reference material verifying your derivation and now you are trying to dodge this anyway you can.
You have lost all credibility Nate.
And my discussion wrt to Willard is wrt to him never ever doing anything that wasn’t a dodge isn’t an avenue you for avoiding doing what you claimed to be able to do. . .its just you dodging doing what you claimed you were qualified to do.
By the criteria Nate mentions, he is the troll. Regularly insulting, and regularly misrepresents my comments. Then there’s the false accusations…
Gill has mentioned “MIT textbook” more than 25 times without ever showing he ever read any of it.
Who else but a silly Sammich Requester would do that?
Nice try Willard. I previously gave derivations before I ever saw the MIT textbook courtesy of Barry.
I read enough to verify it is consistent with the other sources I have produced in here. I prefer the MIT textbook as it actually has a lot more design variations than the other sources.
Nate graciously offered to do a derivation and has apparently read it and is now backing down on his offer obviously because he doesn’t want DREMT’s results to show up which is in fact the result of the GPE per the MIT textbook.
What more proof do I need? If I was wrong, Nate would be all over it popping out the results he has been promising for 8 years to prove me wrong. But Nate isn’t willing to touch it with a 10 foot pole.
I don’t expect you to read it Willard. You haven’t demonstrated any ability whatsoever to read a physics paper so I don’t expect any derivations from you.
Either it’s a joke:
[W] Gill has mentioned “MIT textbook” more than 25 times without ever showing he ever read any of it.
[G] I previously gave derivations before I ever saw the MIT
Or Gill is. Could be both.
All he has to do, then, is to
– find his derivation (no S) and
– find where this derivation (no S) is in his pet textbook.
But at least he conceded he “borrowed” that text book from Team Science.
Progress.
Willard, you have absolutely nothing to do with any “Team Science”, and nor does Nate.
DREMT says:
”Willard, you have absolutely nothing to do with any “Team Science”, and nor does Nate.”
Willard is 100% about arguing irrelevant points.
Nate doesn’t want anything to do with MIT textbooks or Team Science because he has backed down from supporting his “offered” derivation of Stefan Boltzmann heat loss equations with any legitimate scientific source.
> Nate doesn’t want anything to do with MIT textbooks
Gill is 100% about finding a hundred ways to request the same sammich over and over again. Even after it has been brought to him under many shapes and forms.
Of course Willard I will repeat it a thousand times.
When somebody is proselytizing non-science as science can you suggest of a better thing to do? If so please disclose it.
Yes, bill. And, barry, Ball4, Norman and Mark B don’t fare any better, really. Ball4 just repeats the same thing endlessly, but never substantiates it, Norman wouldn’t actually enter into a debate properly at all, and Mark B just does drive by comments where he throws in as many false accusations as he possibly can. If that’s “Team Science” then I feel sorry for science!
> I will repeat it a thousand times.
For some reason Gill kinda forgot to explain that one:
https://www.drroyspencer.com/2026/06/uah-v6-1-global-temperature-update-for-may-2026-0-53-deg-c/#comment-1747665
But then we know that Gill sucks at symmetry.
Willard happily links to the comment where Mark B embarrassed himself by failing to understand a simple, colour-coded diagram.
12:16 am: “… never substantiates it”
bill already substantiated 2LOT eqn. when linking to the MIT textbook, no need to keep repeating bill. Fyi, DREMT can google it & learn: Chapter 4, eqn. 4.59 well substantiated over the last 275 years or so.
DREMT here admits not knowing about 2LOT eqn. when making his original & then long running thermodynamics mistakes. Eli had the correct GPE answer long ago as substantiated by the MIT textbook.
Graham D. Warner gleefully endorses Puffman’s asymmetric boxology.
Will Gill endorse it too?
Astute readers knead to know!
The two trolls do their usual dishonest crap.
Graham D. Warner is being too hard on Gill.
As for how he calls himself, that’s between him and Betty.
See what I mean?
Ball4 says:
bill already substantiated 2LOT eqn. when linking to the MIT textbook, no need to keep repeating bill. Fyi, DREMT can google it & learn: Chapter 4, eqn. 4.59 well substantiated over the last 275 years or so.
—————————-
Ball4 jumps in with a red herring and introduces the resistance of convection to the GPE operating in the vacuum of space. Sorry Ball4 you are in the wrong chapter of the MIT textbook conduction resistance in the GPE has been specified as zero.
Here Google AI explains what Nate, Willard, Ball4, Barry and many others just don’t understand.
Google AI: How to create on equation using the Stefan Boltzmann heat transfer equation for a system of more surfaces than 2.
Answer:
To calculate radiation heat transfer between multiple surfaces, a simple direct equation doesn’t work because heat bounces and reflects between the surfaces repeatedly. Instead, engineers use the Net Radiation Method (developed by Hottel), which sets up a system of equations. Because of the \(T^{4}\) nature of thermal radiation, these equations are non-linear and must be solved using recursive numerical methods (like the Newton-Raphson method or successive substitution) rather than simple algebraic formulas.
Boy in the first sentence they blow off Nate and his extrapolations about the SB equation being extensible by the algebra of the Easter Bunny.
Here is what Google AI says about that completely destroying your position that you can extrapolate a single 2 surface sb equation with algebra:
”To calculate radiation heat transfer between multiple surfaces, a simple direct equation doesn’t work because heat bounces and reflects between the surfaces repeatedly. Instead, engineers use the Net Radiation Method (developed by Hottel), which sets up a system of equations.Because of the \(T^{4}\) nature of thermal radiation, these equations are non-linear and must be solved using recursive numerical methods (like the Newton-Raphson method or successive substitution) rather than simple algebraic formulas.”
Simply follow the directions in the MIT textbook.
bill 1:37 pm erroneously writes: “you are in the wrong chapter”
No bill, please at least read the contents when you are commenting on climate from an MIT textbook: “Chapter 4 Entropy: …we will introduce the concept of entropy…”
See section 4.4, eqn. 4.59 showing Eli’s original GPE work to be correct for a real process and DREMT’s GPE solution being purely imaginary. DREMT’s original GPE mistake was, and has always been, not complying with the 2LOT eqn., whereas Eli’s solution does comply with the MIT textbook.
> jumps in with a red herring and introduces the resistance of convection to the GPE operating in the vacuum of space.
Gill shows once again he can’t read an equation.
Also, he seems to forget:
https://www.drroyspencer.com/2026/06/uah-v6-1-global-temperature-update-for-may-2026-0-53-deg-c/#comment-1747695
Sad.
Sadder still is that he himself kept trying to peddle resistance, e.g.
[GILL, 2024-03] Obviously if you already believe that the physics of the GHE was determined one could explain that it isn’t radiation at all that causes the surface to warm but instead a resistance to convection
[GILL, 2024-04] Keep in mind that the concept of ”insulation” is a resistance to heat passing through a material.
[GILL, 2026-02] If the GP is not insulated it provides no resistance to energy traveling through it.
Perhaps he should ask his best buddy about projection.
What bill reports at 7:56 PM completely destroys the idea that the GPE as Eli solves it is standard textbook physics. The two trolls response is to completely ignore it!
Graham D. Warner rubberstamps Gill’s word game but omits to mention it’s just the same word game as ever.
All this because he fails to dodge Mark B’s destruction of Puffman’s model:
Our two cranks suck at word games.
How is what bill referenced a “word game”!? It’s directly saying that to solve something like the GPE requires a completely different approach to what Eli did!
bill’s 7:56 pm quote: “… heat bounces and reflects…”
Wrong DREMT 8:48 am: bill forgot to point out to AI that there is no reflection in the all-black body surface GPE and in the vacuum of space there is only EMR acting as EMR radiative energy exchange consistent with MIT textbook 2LOT eqn. for a real process.
bill’s 7:56 pm comment falls apart accordingly. Eli’s long ago solution stands, remains unchallenged, & is correct physics consistent with 1LOT and 2LOT for a real process.
Astute readers should know by now that Graham D. Warner’s ” completely different approach” is doing the same work as his previous “mechanism”.
Perhaps he could lay down Gill’s calculations and corroborate them?
Meanwhile, our two bozos are still stuck at a basic asymmetry:
https://www.drroyspencer.com/2026/06/uah-v6-1-global-temperature-update-for-may-2026-0-53-deg-c/#comment-1748344
I see. So, the AI uses one wrong word, and that means absolutely everything it brought up must be discarded.
Sounds reasonable.
Yes, it is reasonable bill’s comment falls apart but two wrong words since EMR in space is not heat and no reflection in GPE BBs. AI still needs a lot of instruction.
Funny that DREMT’s solution includes reflection so bill’s AI did get it right that DREMT’s solution is then wrongly solved.
As bill said:
“Here is what Google AI says about that completely destroying your position that you can extrapolate a single 2 surface sb equation with algebra:
”To calculate radiation heat transfer between multiple surfaces, a simple direct equation doesn’t work because heat bounces and reflects between the surfaces repeatedly. Instead, engineers use the Net Radiation Method (developed by Hottel), which sets up a system of equations.Because of the \(T^{4}\) nature of thermal radiation, these equations are non-linear and must be solved using recursive numerical methods (like the Newton-Raphson method or successive substitution) rather than simple algebraic formulas.””
Happy to repeat this, once every 24 hours, until the discussion closes for comments, if necessary.
It is DREMT’s position which includes reflection and heat that is completely destroyed by bill’s clip since Eli’s GPE solution has no reflection & just has EMR.
Eli had 2 independent eqn.s, 2 unknowns so Eli’s algebra is correct & complies with bill’s MIT textbook where DREMT does not.
I’ve about used up all my allowed comments so DREMT can repeat whatever of DRENT’s comments forever; those comments will still be wrong as physically accurate MIT textbook science already explains.
Ball4 keeps saying Eli’s solution does not involve “heat”. If that were the case Eli’s solution would be 3 K…3 K for the plates instead of 262 K…220 K. Ball4’s complete aversion to the word “heat” is often his undoing, and it is here. Sorry, but you can’t have a discussion about radiative heat transfer and pretend that none of the transfers are “heat” transfers! In Eli’s solution all the transfers of EMR are treated as “heat” transfers. Even the “back-radiation” transfer acts as a transfer of “heat” in his solution. That’s why it’s wrong.
Ball4 says:
”bill 1:37 pm erroneously writes: “you are in the wrong chapter”
No bill, please at least read the contents when you are commenting on climate from an MIT textbook: “Chapter 4 Entropy: …we will introduce the concept of entropy…”
See section 4.4, eqn. 4.59 showing Eli’s original GPE work to be correct for a real process and DREMT’s GPE solution being purely imaginary. DREMT’s original GPE mistake was, and has always been, not complying with the 2LOT eqn., whereas Eli’s solution does comply with the MIT textbook.”
———————–
It doesn’t matter if Chapter 4 introduces entropy, entropy applies to all modes of heat transfer.
Equation 4.59 discusses heat transfer from the root of a cooling fin to a liquid using the heat transfer coefficient of convection.
Its not even a radiation equation. Chapter 10 contains the variables in radiation equations. You can’t possibly be that ignorant on what is going on or are you?
Gill succeeded in quoting “Google AI” by omitting a few keywords, like “grey body” and “imperfect surfaces”. He also kinda forgot to think things through with his best buddy, i.e.
For some reason he hasn’t provided the sources that were given to him. Which he hasn’t read, for he’d have discovered that there are other even more complex methods, like DOM and even CFD-based simulations.
And of course Graham D. Warner will gobble Gill’s gobbledygook.
The 262 K…220 K solution is debunked by the points 1) – 5):
https://www.drroyspencer.com/2026/06/uah-v6-1-global-temperature-update-for-may-2026-0-53-deg-c/#comment-1748493
DREMT 12:56 am: “Ball4 keeps saying Eli’s solution does not involve “heat”.”
Even DREMT has repeatedly admitted EMR is not heat; there is only EMR in GPE so Eli’s is the correct solution. DREMT’s “heat” argument is easily refuted.
bill 6:42: “Equation 4.59 discusses heat transfer”
There is no heat in MIT climate textbook 2LOT eqn. 4.59, bill just makes up stuff.
DREMT 9:08 am forgets points 1) – 5) were thoroughly debunked several months ago. Eli’s GPE solution remains unchallenged.
Ball4, my 12:56 AM comment already refuted your argument. Simply repeating your refuted argument achieves nothing.
“DREMT 9:08 am forgets points 1) – 5) were thoroughly debunked several months ago”
Presumably the dog ate Ball4’s link to this “thorough debunking”.
Ball4 says:
”bill 6:42: “Equation 4.59 discusses heat transfer”
There is no heat in MIT climate textbook 2LOT eqn. 4.59, bill just makes up stuff.”
————–
Ball4 is trying to create a diversion. The entire section of 4.5 is described in the first sentence: ”We can substantially improve convective heat transfer to or from a surface by attaching extensions that increase surface area.”
Equation 4.59 is an equation to calculate Qnet (heat loss) from convection for fins of variable crosssections. A wedge shaped fin is one example. Variable crosssection fins present a couple of additional complexities related to how much heat conducts lengthwise through the fin from the fin root to the fin tip and also presents a variation of surface area for convective heat transfer.
Equation 4.59 is that Qnet equation that accounts for heat transfer through the fin to a liquid in the absence of radiative heat loss.
So is Ball4 completely ignorant of what equation 4.59 does or is just that big of a lying obfuscator. Must be one of the two. Perhaps Ball4 is the Easter Bunny who fits perfectly in that category also.
Anyway you cut it both Ball4 and the Easter Bunny are wrong.
bill is lost & needs to get on the right page and eqn. in the MIT climate textbook chapter on Entropy.
DREMT is also lost having been refuted on points 1) thru 5) repeatedly in the last several months. The Internet does not forget.
Ball4 is a filthy liar, and should be banned from commenting.
i am in the mit heat transfer textbook kindly provided to us by barry.
ball4 missed out on long parts of the discussion of the sb heat transfer equation being miapplied by nate.
this is part of the professional engineering curriculum at mit.
i wouldn’t be surprised to learn mit also might have a dumbbell climate management program to prepare employees for climate management policy analyst positions at ngos and government environmental agencies. so ball4 enrolling here late may also have come with the wrong textbook from the campus store.
he should perhaps get the right textbook from barry.
https://www.youtube.com/shorts/XT_0sn1Er7Q
Willard I am not a doctor. To get that catfish stuck in your throat by the Easter Bunny out, it would probably be a good idea to see a doctor who specializes in that kind of work.
Gill is not an astrologer. He wishes he was one, but he discovered Scafetta too late.
Has he discussed his astrological theory of climate with his best buddy yet?
wow! willard goes completely off the deep end and starts calling newtonian physics, orbit and rocket dynamics astrology.
your starting to look really desperate for a real argument there if all that ends up in your brain as a conclusion.
getting a catfish stuck in your gullet from an easter bunny fairy tale doesn’t even hold a candle up to that.
The chat Gill won’t post:
“Because Scafetta attributes the majority of recent warming to these natural astronomical cycles, he calculates a much lower Equilibrium Climate Sensitivity (ECS) to carbon dioxide—predicting that a doubling of atmospheric CO₂ would only cause a 1.5°C rise in temperature.”
So even his pet astrologer disagrees with the cranks he whiteknights on this thread.
bill has cited MIT textbook over 25 times this month. The discussion on entropy eqn. defeating DREMT’s position on the GPE is also supported by MIT textbook chapter on Entropy, bill. Please follow along more diligently.
Willard says:
”The chat Gill won’t post: “Because Scafetta attributes the majority of recent warming to these natural astronomical cycles, he calculates a much lower Equilibrium Climate Sensitivity (ECS) to carbon dioxide—predicting that a doubling of atmospheric CO₂ would only cause a 1.5°C rise in temperature.” So even his pet astrologer disagrees with the cranks he whiteknights on this thread.”
first off that isn’t a Scafetta post unless Scafetta tends to refer to himself in the 3rd person.
second, to verify I won’t post it I would have to have my hands on the chat. I don’t.
So without a link to that chat its not possible to verify your conclusions.
> that isn’t a Scafetta post
I’m sure Gill means something by that.
But what?
ROFL!
This is the textbook bill is referring to:
https://bpb-us-e1.wpmucdn.com/sites.mit.edu/dist/6/1810/files/2024/04/AHTTv600.pdf
As I recall, Bob Droege brought it up, and not barry. In any case, this is generally known as “the” MIT textbook.
bill is correct about eqn. 4.59. Ball4 is a compulsive liar, who should be banned from commenting.
That is all.
DREMT 4:18 pm, there are several MIT textbooks on line. bill did not specify which one in this entire discussion. The discussion on entropy 2LOT eqn. defeating DREMT’s GPE solution is also supported by the MIT textbook DREMT linked.
DREMT should gain an understanding of chapter 1 of his own link to know why Eli’s GPE solution is correct and DREMT’s GPE solution wrong.
Ball4 says:
”DREMT 4:18 pm, there are several MIT textbooks on line. bill did not specify which one in this entire discussion. The discussion on entropy 2LOT eqn. defeating DREMT’s GPE solution is also supported by the MIT textbook DREMT linked.”
You are lying Ball4. I did specify which textbook I was talking about in this thread for the may update, for the previous month for the April update, and even Bob Droege introduced the MIT textbook for the March update here:
Since then it has been called the MIT textbook, the MIT heat transfer textbook (by me 3 time in this update) and one time by Norman as the MIT heat transfer documents. There have been links provided to this textbook at least 3 times.
You gave an equation number that exists in that textbook the first time just 3 days ago. You are almost 3 months behind the rest of the class.
And even earlier than that 2 credible studies have been produced as to how to calculate the GPE, Thermopedia verifies those calculations, as does the Howell textbook introduced earlier in April by Barry that he also didn’t bother to read that. The MIT textbook was by far the most deep delving into the matter of explicitly how to calculate the GPE. And several experiments have been conducted the results of which point to reflection from high emissivity objects because of a very weak effect. these include R.W. Woods more than a 100 years ago, Roy and his effort years ago in this forum, Vaughn Pratt trying as hard has he could to prove the Easter Bunny GPE and got an MIT textbook level response instead. And of course there is also Seim and Olson series of experiments.
Your side has zero textbooks, zero credible papers, zero physics encylopedias, zero supporting experimental results.
You haven’t even provided a link to this “other” MIT textbook you claim proves how to calculate the GPE.
Just when are you guys going to learn anything?
> Thermopedia verifies those calculations
Gill is getting cheekier and cheekier:
https://www.drroyspencer.com/2026/04/uah-v6-1-global-temperature-update-for-march-2026-0-38-deg-c/#comment-1742023
Ball4 keeps on lying.
“Put in emissivity = 1, heat transfer is reduced when N increases…”
…and where in Thermopedia does it say the temperature of one or more of the objects will increase as a result?
“Put in emissivity = 1, heat transfer is reduced when N increases…”
Exactly. Demonstrating the ability to reduce heat loss, reduce cooling of a heated body.
Which everyone here should recognize that such an ability to reduce the cooling of a HEATED body, like the BP, makes it WARM.
But alas, ignorance is persistent and finds a way.
Indeed, Nate. Your ignorance is persistent.
bill 9:56 pm, “this discussion” would apply to the June monthly update not the May. All those experiments support the 2LOT eqn. 4.59 found in chapter 4 of the climate MIT textbook and chapter 1 of the other online MIT textbook which both defeat DREMT’s GPE solution. There is no hope for DREMT to be correct.
bill also put up an AI clip on reflection and heat that defeats DREMT’s solution which depends both on reflection and EMR acting as heat.
bill has added reliable sources to defeat DREMT’S position, so thanks for the support.
Ball4 is a compulsive liar, and should be banned from commenting.
My link to the actual textbook proved, once again, that he is a liar.
Now DREMT 8:20 am is posting a link to Chapter 1 Entropy Production defeating DREMT’s GPE position as Bill claims to have done. Thanks for defeating your own position with a link to an MIT textbook DREMT.
Proven liar and notorious climate troll Ball4 continues to do his thing.
Meanwhile, the GPE’s debunked. Poor Ball4 – no more job for him.
…and where does Thermopedia verify Gill’s calculations?
There’s nobody commenting here under the handle “Gill”, Willard. Increase your maturity levels and try again.
Ball4 says:
”bill 9:56 pm, “this discussion” would apply to the June monthly update not the May.”
LMAO! You are getting dizzy Ball4. Look and read the URL of the page you are on! ROTFLMAO! The June update is the one posted after this one.
The MIT Heat Transfer textbook was mentioned here by me in this thread on June 27 at 12:27pm. In the previous month April update I provided links to it and DREMT provided a link to it once you expressed your confusion wrt what this thread was discussing.
Ball4 says:
”All those experiments support the 2LOT eqn. 4.59 found in chapter 4 of the climate MIT textbook and chapter 1 of the other online MIT textbook which both defeat DREMT’s GPE solution. There is no hope for DREMT to be correct.”
Ball4 if you want to talk about your textbook post a link to it so others can follow along and then start over.
bill 1:52 pm, please scroll to the top post and find June 2, 2026.
Yes, bill cited “MIT textbook” 25+ times after that top post without mentioning which one. So there was no confusion by me. Bill can use google to find online “MIT textbook” the exact phrase bill cited 25+ times.
DREMT’s GPE position is defeated without hope by any relevant “MIT Textbook” found – in the chapter on Entropy – so that was a good find, bill, thanks. Obviously others accomplished enough in thermodynamics to read them can easily follow along in that chapter and find DREMT’s GPE position is defeated since google is your friend.
Of course, the dog ate Ball4’s link to his “MIT climate textbook” with his equation 4.59. But, just trust him. He’s a trustworthy guy, right? In no way is he a disgusting, lying, repellent disgrace.
We note that for the 7th time, Bill ignores this physics textbook source that proves that parallel blackbody plates in vacuum reduce heat loss, IOW insulate.
“The general textbook solution to multi-layer radiation problems have been shown to you guys many times. Such as here:
https://thermopedia.com/content/69/
See figure 2 and equation 3 for N plates.
Put in emissivity = 1, heat transfer is reduced when N increases.”
And that ability of the blackbody GP to reduce heat loss from the HEATED BP causes it to WARM.
https://www.drroyspencer.com/2026/06/uah-v6-1-global-temperature-update-for-may-2026-0-53-deg-c/#comment-1747967
…and where can we find Gill’s calculations?
Norman says:
”Your post is noted but your inability to understand that a cold object’s radiant energy absorbed by a hotter one does NOT violate 2nd Law in any way!! I do believe a wall could grasp basic concepts better than you are able. You are a cult mimd. No evidence facts or logic can help you. I am trying to see if Bill Hunter is as hopeless as you are.”
Norman, you can have the most beautiful theory in the world but if it doesn’t stand up to an experiment its wrong.
You can be a gullible wanger if you want but you can count us out.
MIT last I checked had either the top reputation in the world or very near to it. In 2024 MIT still wasn’t buying what you are selling.
The MIT heat transfer text book comes right out and says with regard to radiation between plates: “Notice, too, that if the plates are both black (E=1), then both surface resistances are zero and which, of course, is what we would have expected.
Everything else you try to sell doesn’t stand up to those word tests on the SAT that for instance if you have two trains hauling a product one faster than the other. how long does it take to haul the product type question.
If you were a senior in highschool you will likely see a question like that on the SAT.
If you get it right you racked up one question you needed to get right to get into a physics program at MIT. If you got it wrong chances are you aren’t going to make it.
You guys haven’t even established the ability of radiation to warm the air. All GHG does is cool the upper atmosphere then through some contorted thinking you conjure cooling into heating.
Every photon caught by a CO2 molecule increases its buoyancy thus increasing its ability to cool via GHG. But hey ignore that and fall for voodoo science.
Sure in a greenhouse you can trap warm air at the top of the greenhouse. But the top of the atmosphere is just where air thins out so much that if oxygen didn’t absorb UV it would probably cool to 3k instead it gets hotter because oxygen can’t emit IR or visible light.
Another one you wouldn’t want to get wrong is how many hours will it take to fill a lake with a capacity of 200,000 acre feet if your water input is an average of 2 acre feet per hour and you are running an average of 1 acre foot per hour through generators to the down stream side of the dam in order to generate electricity for the residents that live near the dam.
If you can’t get that one right maybe you ought to consider a career flipping hamburgers at McDonalds because its not going to work out being either the cashier or the assistant manager.
Willard’s maturity levels are still too low.
Nate says:
”“The general textbook solution to multi-layer radiation problems have been shown to you guys many times. Such as here:
https://thermopedia.com/content/69/
See figure 2 and equation 3 for N plates.
Put in emissivity = 1, heat transfer is reduced when N increases.”
And that ability of the blackbody GP to reduce heat loss from the HEATED BP causes it to WARM.”
You have several problems Nate. First look at the Figure 2. You hve two boundary condition surfaces and 5 radiation shields. N=5, plates equal 7.
Second problem: This set up is for grey plates. There is no reason to assume a radiation shield can be a blackbody as it is defined as not being one.
third problem, The MIT heat transfer keeps it clean and doesn’t immediately delve into special conditions. I recognize I am not an expert at this but I can count surfaces. I guess Nate is incapable of that. . .hows the burger flipping job Nate?
As expected MIT is a bit more disciplined in their thermodynamics department and comes out and says black surfaces present zero resistance. . .and you can’t add up a bunch of zeros but you can add up a bunch of resistances.
MIT mentions “radiation shield” 23 times always as an inefficient radiator or absorber.
Meanwhile Ball 4 has been following along with some textbook he apparently stumbled on despite the link to the MIT heat transfer textbook being provided several times and mentioned as such 3 times in this update.
After making a fool of himself he wants to blame is lack of attention on me.
Now even worse now he can’t find his textbook. Perhaps you can download a copy of the one the rest of us are using. I can assure him entropy is covered in there.
Wow, Bill, for the first time, you actually responded to this source. And respectfully so. So I will also respond respectfully, and see how that goes
“You have several problems Nate. First look at the Figure 2. You hve two boundary condition surfaces and 5 radiation shields. N=5, plates equal 7.”
Clarify why you think that example is a problem. N is the number of plates added between the two outer bodies, which in the GPE would be the BP and space.
With no added plates N =0, and the denominator = 1 for e =1.
The heat transfer is given by the standard RHTE Q = sigma(Th^4 -Tc^4).
Add 1 plate, e = 1. That is the GP in our ptoblem.
The equation now has a denominator = 2.
This proves that adding the GP, cuts the heat transfer between the BP and space in HALF, at any temperatures.
“Second problem: This set up is for grey plates. There is no reason to assume a radiation shield can be a blackbody as it is defined as not being one.”
The term grey body allows emissivity to be anything between 0 and 1
A blackbody simply is a body with emissivity =1. There is no reason the equations cannot apply with that emissivity.
If you dont like 1, use 0.995, and get nearly the same result!
“third problem, The MIT heat transfer keeps it clean and doesn’t immediately delve into special conditions. I recognize I am not an expert at this but I can count surfaces. I guess Nate is incapable of that.”
So can I. And there is no problem with the count, as explained above.
> First look at the Figure 2.
For some reason Gill succeeds in missing Fig. 1.
And he also succeeds in missing Fig. 3.
So of course he’ll miss that the relationship between the two corroborates Eli’s simplest explanation:
https://rabett.blogspot.com/2018/08/the-simplest-green-plate-effect.html
Too bad if Sky Dragon cranks can’t get it.
If you say so, Willard. Meanwhile, the points 1) – 5) trash Eli’s solution.
Pure denial that Points 1-5 have been debunked many times.
https://www.drroyspencer.com/2026/07/uah-v6-1-global-temperature-update-for-june-2026-0-46-deg-c/#comment-1748830
Nate, please butt out of my discussion with barry.
The point of my analysis is to isolate the effect of the “back-radiation” transfer. If you can think of a better way than calculating the plate temperatures without the transfer, then comparing it to the plate temperatures with the transfer occurring to completion, let’s hear it.
Until then, shut up.
OK Nate I goofed and relied on Google AI for the number of boundary layers in empty space. The correct answer is none as a boundary layer must be a solid two dimensional solid surface that stops the flow of fluids.
1. A boundary layer problem is a fluid flow issue. The GPE only has a potential of being a boundary layer problem via the interactions of fluids with the boundary layer. Quite simply you are just spinning your wheels trying to apply it to the GPE.
The GPE is a simple radiation problem that reveals itself and you will see below.
2. I am agnostic on whether you wish to treat the BP as a boundary layer (without considering the ramifications that it has no gases to trap). But that agnosticism is based on what the stated purpose of a boundary layer and nothing more. I haven’t studied boundary layers. I don’t think it was part of the curriculum of the meteorology classes I took back in the late 1960’s, or at least I can’t remember them being discussed.
3. You have a huge error in your equation Nate. Your equation after your adjustments to it now has two plates only. Near as I can tell there is no reason to call them boundary layers and you didn’t when you described everything as plates.
Empty space can’t be a boundary layer as there isn’t any limit to its depth thus it can’t contain an atmosphere or any other liquid for that matter. As usual Google comes up with the watermelon wrapped in blue cellophane answer first almost every time when you are exploring Lala land issues, especially in California.
I see no reason to or not to treat the BP as a boundary layer. But I am not an expert on that. All I am saying here comes straight from experts. I also see no issue with treating the GP as a radiation shield or a boundary layer.
Yet when you adjusted the equation to recognize the GP as a radiation shield you failed to remove the reflection resistance fraction for the now non-existent boundary layer.
So you need to fix that too or set N=0 and remove the middle term.
Once you fix that problem with variables that have no ability to act as a barrier or alternatively as a radiation shield you will find you have returned to equation 1a
While Gill googled and goofed, Eli’s demonstration remains undefeated:
https://rabett.blogspot.com/2018/08/the-simplest-green-plate-effect.html
Team Science wins again!
“1. A boundary layer problem is a fluid flow issue. The GPE only has a potential of being a boundary layer problem via the interactions of fluids with the boundary layer. Quite simply you are just spinning your wheels trying to apply it to the GPE.”
Fluids have no relevance to the GPE, a purely radiative problem
“2. I am agnostic on whether you wish to treat the BP as a boundary layer (without considering the ramifications that it has no gases to trap). But that agnosticism is based on what the stated purpose of a boundary layer and nothing more. I haven’t studied boundary layers. I don’t think it was part of the curriculum of the meteorology classes I took back in the late 1960’s, or at least I can’t remember them being discussed.”
???
“3. You have a huge error in your equation Nate. Your equation after your adjustments to it now has two plates only. Near as I can tell there is no reason to call them boundary layers and you didn’t when you described everything as plates.”
What adjustments? What error?
What boundary layers? We simply have a hot plate at temperature Th, transferring heat. Q, by radiation only, to a cold body at Tc.
We now introduce N =1 plates in between.
The equation 3 gives the new heat transfer, Q, by radiation only. It is reduced to 1/2 its initial value.
It is perfectly applicable to the GPE problem
“Empty space can’t be a boundary layer as there isn’t any limit to its depth thus it can’t contain an atmosphere or any other liquid for that matter. As usual Google comes up with the watermelon wrapped in blue cellophane answer first almost every time when you are exploring”
So you claim.
Yet we all seem to know how to solve for the heat transferred from the BP directly to space at T =0. And the result is 200 W/m2.
And we similarly know how to solve for the heat flow from GP to space.
In both cases we are treating space as if it is a large surface with VF =1.
“Team Science wins again!”
Thanks for referring to us that way.
Never advanced beyond schoolyard taunts?
“A classic comeback (often called a mirror taunt). It means whatever bad thing the first person said bounces right back to them.”
DREMT 7:37 am finally agrees to join Willard’s Team Science and Eli’s GPE solution is correct. bill’s MIT textbook link Chapter 1 Entropy Production was useful in educating DREMT.
Nothing honest from Ball4. No surprises there.
Nate struggles to say:
”What boundary layers? We simply have a hot plate at temperature Th, transferring heat. Q, by radiation only, to a cold body at Tc.
We now introduce N =1 plates in between.”
”The equation 3 gives the new heat transfer, Q, by radiation only. It is reduced to 1/2 its initial value.
It is perfectly applicable to the GPE problem”
But the GPE is a 2 plate situation Nate.
As clearly explained, the textbook derives heat flow between a hot body at Th and a cold body at Tc.
This is what we have at the start, with Th =244K on the BP and Tc =0 on space. Those are the two bodies!
We find Q = 200 W/m2 for that setup using eq 3 with N =0 plates in between.
Now add N=1 blackbody plates in between. The derived equation 3 tells us that the Q is cut in half.
We now have Q = 100 W/m2 flowing from the BP to space.
Lets see if can understand this time.
Nate says:
”As clearly explained, the textbook derives heat flow between a hot body at Th and a cold body at Tc.
This is what we have at the start, with Th =244K on the BP and Tc =0 on space. Those are the two bodies!
We find Q = 200 W/m2 for that setup using eq 3 with N =0 plates in between.
Now add N=1 blackbody plates in between. The derived equation 3 tells us that the Q is cut in half.
We now have Q = 100 W/m2 flowing from the BP to space.
Lets see if can understand this time.”
so you are really sure about that? i kind of see what you are getting at here and find it interesting it is after all rather intuitive.
would you stake your scientific reputation on that?
Good. I will let the facts speak for themselves.
My explanation is as clear as it can be, not sure what else specifically you are asking.
Good Nate is staking his entire scientific reputation on this math working out for him.
OK so we have 400w/m2 coming from the sun and it encounters the first boundary. We can focus here on the bottom of the fraction (denominator) because this is going to produce the resistance (r-value) we need to determine if “q” is to be reduced.
So at the first boundary we fill in the emissivity variable in the first fraction in the denominator.
then we treat the GP as a radiation shield (PER NATE’S CLAIM) and we fill in the emissivity factor there for each side of the radiation shield. SINCE ALL THESE EMISSIVITY FACTORS ARE THE SAME WERE ARE UP TO A SUM OF THE FRACTIONS EQUALLING 3.
Now Nate wants to use space as the last boundary. So we fill in the emissivity factor there of zero as space doesn’t emit. So we are still at 3.
Now from 3 we have to substract (n+1). Since Nate is treating the GP as a radiation shield n=1. 1+1=2. 3-2=1. So the resistance factor is 1.
Bate’s scientific reputation just went up in smoke since he was “sure as he can be”.
So exactly what happened here folks? Nate was told that a boundary had to be a barrier. . .that fact was reinforced by the equation, every single description of a barrier I can find on the net. Nate should know this. He was repetitively warned by me.
Its a principle of the simplest radiation science. Only objects can emit. Space is not an object. Space can’t emit. Yet here Nate is basing his entire scientific reputation on it being a barrier.
But he had managed to figure the resistance outcome of a simple boundary system in the Thermopedia equation 1a https://www.thermopedia.com/content/69/
so Nate decided rather than face the music he would fake it.
This is why Nate is not to be trusted. His reputation is now officially and permanently soiled. Not only that but the GPE is now further debunked. further debunked as it has been debunked simply on the basis of 2LOT.
Science is supposed to be replicable and each replication of a debunking increases the first debunking. Now it has been debunked by mathematics arising from his own source.
Of course science has known this for a long time, Nate obviously didn’t. Nate just faked it. Nothing worse than a dishonest scientist.
Bill,
As I noted “I will let the facts speak for themselves.
My explanation is as clear as it can be, not sure what else specifically you are asking.”
I was responding to you Civilly while you were, Bill.
But then you went off an yet another fact-free ad-hom filled rant, which ignores experimental facts in order to obtain a desired but incorrect outcome.
“bill hunter says:
July 17, 2026 at 10:57 AM
Good Nate is staking his entire scientific reputation on this math working out for him.
OK so we have 400w/m2 coming from the sun and it encounters the first boundary. We can focus here on the bottom of the fraction (denominator) because this is going to produce the resistance (r-value) we need to determine if “q†is to be reduced.
So at the first boundary we fill in the emissivity variable in the first fraction in the denominator.
then we treat the GP as a radiation shield (PER NATE’S CLAIM) and we fill in the emissivity factor there for each side of the radiation shield. SINCE ALL THESE EMISSIVITY FACTORS ARE THE SAME WERE ARE UP TO A SUM OF THE FRACTIONS EQUALLING 3.
Now Nate wants to use space as the last boundary. So we fill in the emissivity factor there of zero as space doesn’t emit. So we are still at 3.”
Here is where you go off the rails. Sorry you don’t get to make-up your own facts in order to obtain your desired result!
It is well established that space DOES emit, and has an emissivity of 1.
Lets ask Google AI
What is the emissivity of space?
“The vacuum of space itself has an emissivity of exactly 1 (a perfect emitter and absorber of light and heat) because it behaves as an ideal blackbody. This means that any heat an object radiates into deep space is completely absorbed without being reflected back”
And We have measured its emissions since the 1960s. Its measured temperature is 3 K.
(See eg Nobel Prize for Penzias and Wilson) We can approximate its T as 0 K with little change in result.
So here you are IGNORING established experimental facts, and getting the wrong answer.
Then you go off on your usual ad-hom filled rant.
I get your drift nate.
All we have to do is wait an eternity for the effect to return and warm up the BP. LOL! Finally I understand the philosophy behind the Easter bunny gpe. Congratulations!
If I understand you correctly, you are being gracious in ending the argument. Appreciate that.
…and yet, the GPE’s still debunked:
https://www.drroyspencer.com/2026/06/uah-v6-1-global-temperature-update-for-may-2026-0-53-deg-c/#comment-1748493
Nate says:
”If I understand you correctly, you are being gracious in ending the argument. Appreciate that.”
No problem Nate, the credit is all yours. You actually decided to pin yourself down to some actual heat transfer equations that actually represent a physics viewpoint. Now that viewpoint of physics can actually become a target of microscopic examination as to what it represents in terms of transfer by radiation, conduction, and convection. Thus I have to give you kudos for actually taking a position on this matter while your buddies are still out there without a physics position instead will find themselve tied to an algebraic simulation that doesn’t have any heat transfer equations in it at all.
So in short we now have a petard for your position to pin something to.
I think that is courageous of you considering how everybody else is so chicken to do that. So I felt that while it has taken 8 years to actually take a physics position on this matter its kudos to you that you have done so. Its a good brave step forward.
It is official now:
https://cpc.ncep.noaa.gov/products/analysis_monitoring/enso/roni/strengths/
https://www.cpc.ncep.noaa.gov/products/analysis_monitoring/enso_advisory/figure06.gif
https://www.cpc.ncep.noaa.gov/products/analysis_monitoring/enso_advisory/figure06.gif
https://i.ibb.co/nsXR7F5V/cdas-sflux-sst-global-1-1.png
Even more astonishing than simply looking at the (uncorrected) NCEP-CFSv2 situation from June 7 is the comparison with the forecast from April 6 — just two months ago!
1. April
https://i.postimg.cc/sXVbBdVp/nino34Mon-060426.png
2. June
https://i.postimg.cc/FKC8NktZ/nino34Mon-070626.png
*
However, even though it has long been known that the MEI (Multivariate ENSO Index) is based on a much larger ocean area (30S–30N, 100E-70W) —and on far more factors than just local sea surface temperature —the biggest surprise is that this index still remained below the La Niña threshold (-0.5) for March/April:
2026 -0.76 -0.95 -1.03 -0.64
We’ll see what MEI tells us for the April/May average.
BACK AT THE RANCH
View of the Kennedy Center after a federal judge in Washington, D.C., declined Donald’s request to temporarily pause an order requiring his name to be removed from the Kennedy Center for the Performing Arts.
https://www.youtube.com/watch?v=o5-d08Y-Vys
Cold spot in the Atlantic. Low ocean surface temperatures in this region. Heavy cloud cover.
https://i.ibb.co/whvmsY5J/ventusky-temperature-500hpa-20260613t1200-52n51w.jpg
Will bears be allowed to hunt on the ice in the western part of Hudson Bay until the end of June?
https://i.ibb.co/svhrNTH6/masie-all-r10-4km-2.png
Allowed?
I didn’t know they need permission.
They require facilitation from Mother Nature EM.
I read above without suprise:
” Cold spot in the Atlantic. Low ocean surface temperatures in this region. Heavy cloud cover. ”
The post’s author apparently was once more looking for something cold to report about.
He doesn’t seem to have understood that he posted a picture which hardly could have anything to do with surface temperatures… because the cold spot on the picture is at 500 hPa i.e. at an altitude near 5600 meters: a bit above UAH LT’s mean, 100% computed out of the layers MT, TP and LS since beginning of revision 6.0 in 2015.
*
A bit nearer to reality would be for example:
” At 52°N, 51°W (in the Labrador Sea southeast of Newfoundland), the estimated sea surface temperature for June 13, 2026, is approximately 9°C to 11°C (48°F to 52°F). This reflects the typical cold, subarctic water currents of the North Atlantic for early summer. “
https://i.ibb.co/7JLq7VXJ/ventusky-currents-20260613t1500.jpg
0.9 between Crete and Egypt? What’s that?
SST there yesterday: about 24 °C.
Planetary mean temperature increases with the product N⋅cp (rotation × thermal inertia).
Slow rotators like the Moon absorb less heat, while fast rotators like Earth absorb more heat.
The higher N⋅cp product causes more heat absorption, not only the more even heat distribution, but also the higher heat absorption.
When two planets are subjected to the same solar flux, the one with the higher N⋅cp product has a more even the absorbed heat distribution, but also the one with the higher N⋅cp product absorbs more heat, and therefore, because of the combined double effect (more heat absorption and more even the absorbed heat distribution), that planet develops a higher average surface temperature.
–
https://www.cristos-vournas.com
” Slow rotators like the Moon… ”
*
C’est ce que, selon quelques éminents apôtres de la religion mondialement connue de la Lune non-rotationelle (Clint R, Robertson, le pseudo-modérateur DREMT, Hunter boy et quelques autres ignorant[e]s), l’on appelle en français tout simplement du blasphème.
Attention: le bûcher n’est pas loin!
*
English:
https://tinyurl.com/23ev539a
Christos Vournas wrote:
If two planets receive identical solar flux and have identical albedo, then long-term absorbed energy must be equal by conservation of energy principle.
Thermal inertia does not create energy.
Thank you, Arkady, for your response.
“If two planets receive identical solar flux and have identical albedo, then long-term absorbed energy must be equal by conservation of energy principle.”
Shouldn’t the planets be identical too?
https://www.cristos-vournas.com
Christos Vournas, you wrote:
But you’re confusing a b s o r p t i o n with redistribution.
Suppose Earth and the Moon had identical albedo. By conservation of energy, they would absorb the same long-term average solar power per square meter regardless of rotation rate or thermal inertia.
What would differ is the temperature distribution since Earth’s atmosphere and oceans smooth temperatures spatially and temporally.
That is not additional absorbed solar energy. It is the same absorbed energy distributed differently.
Two bodies subjected to the same flux.
It is always there – a strongly irradiated area (24/7), which area moves on the rotating surface, but which always faces sun.
The planet 2, whith a higher Ncp product develops lower IR-emitting conditions(temperatures), and the planet 1, with a lower Ncp product develops higher IR-emitting conditions
Immediate IR1 > Immediate IR2
The planet 2 is not so hot at local noon hours, so it gives Immediatelly out less IR, so less heat is immediatelly lost.
The planet 1 is warmer at local noon hours, but those higher temperatures only weakly affect locally the planet average surface temperature rise, as it influences at their first power (T), whereas those higher temperatures – IR emission at fourth power (T^4) – they, at the same time, they lessen the average surface temperature significantly, because those the higher local noon temperatures contemplate for the much higher Immediate IR energy emission.
Tmean2 > Tmean1
The higher Immediate IR emission constitutes higher energy loss – lower heat input.
What we have is that the higher Ncp product lessens the Immediate IR emission. A planet absorbs more energy in form of heat then. More absorbed heat results to higher average surface temperature (Tmean).
Physical interpretation:
The higher average surface temperatures are well documented by the planets average surface temperatures (Tsat) measurements, alongside with their respective spin rates N, and, from the surfaces chemical composition, the values of surfaces specific heat cp.
In that context we claim, that planets and moons with a higher Ncp product – they are warmer, because they absorb more solar energy in form of heat!
–
https://www.cristos-vournas.com
Christos Vournas, you wrote:
When two planets receive the same solar flux and have identical albedo, asserting that the higher N⋅cp planet “absorbs more heat” violates conservation of energy.
Reduced instantaneous IR emission due to smoother temperature distribution is not the same thing as increased solar energy a b s o r p t i o n.
So where is this additional absorbed energy coming from?
Thank you, Arkady, for your response.
“Reduced instantaneous IR emission due to smoother temperature distribution is not the same thing as increased solar energy a b s o r p t i o n.
So where is this additional absorbed energy coming from?”
–
Because the planet is not the same energy-absorbing-wise when its Ncp product is higher.
–
https://www.cristos-vournas.com
Ok! When distributed, a portion of energy is distributed towards the instantaneous IR emission. When instantaneously emitted, that portion of energy doesn’t participate in further energy conservation.
=
https://www.cristos-vournas.com
Christos Vournas, you wrote:
Ok! You’ve now changed your claim from “higher N⋅cp product absorbs more heat” to “higher N⋅cp reduces immediate IR loss.” I will draw my own conclusions.
FWIW, even after energy is emitted to space, it absolutely still participates in energy conservation. The planet’s energy budget is given by dE/dt = Power absorbed – Power emitted.
Arkady.
“FWIW, even after energy is emitted to space, it absolutely still participates in energy conservation. The planet’s energy budget is given by dE/dt = Power absorbed – Power emitted.”
–
The energy emitted to space doesn’t warm planetary surface.
–
https://www.cristos-vournas.com
Christos, there is definitely something in your math that rings true. Have you looked at Nikolov’s math? Your math and his math are very similar.
Thank you, stephen, for your response.
“Christos, there is definitely something in your math that rings true. Have you looked at Nikolov’s math? Your math and his math are very similar.”
I am very glad to hear that! Hope my math were similar to someone else’s too.
–
https://www.cristos-vournas.com
A lot to catch up on. The fun starts here:
https://www.drroyspencer.com/2026/06/uah-v6-1-global-temperature-update-for-may-2026-0-53-deg-c/#comment-1746074
That comment explains that a surface already emitting a flux can NOT be warmed by a lesser arriving flux. This, of course, destroys the CO2 nonsense. So the cult is in panic.
First to respond was Norman, with:
“You claim adding more heat lamps to a sphere will not increase its temperature but you provide ZERO evidence.”
I never mentioned “more heat lamps” not being able to “increase its temperature”. So Norman clearly understood nothing from my comment. He’s just slinging crap at the wall, hoping something will stick. Norman continues:
“Textbook science, which I have linked you to, clearly states that EMR energy from a colder source will be absorbed by a hotter one.”
Norman never linked to any such thing. He linked to a textbook that used the bogus equation, which is NOT proof of anything, because fluxes do NOT simply add/subtract.
After that, in another comment, Norman is so perplexed he’s denying his own cult’s nonsense:
“The atmosphere is not warming the surface!! “And again, “The effect is not warming.”
Then Norman continues with a car in the Sun, but he’s so uneducated that he doesn’t understand that example has NOTHING to do with CO2. Or that there is no temperature “much higher” if car windows are open!
The cult has been unable to define their bogus “greenhouse effect” for decades. One time its “back-radiation” from CO2 is “warming the planet”. But, when shown that is impossible, the next time, they go to “CO2 back-radiation is keeping Earth warmer than it would otherwise be”. But, that is what the ATMOSPHERE does, not CO2. CO2 emits energy to space. The 15μ photons can NOT warm a 288K surface.
Norman always makes big claims to support his nonsense, “I have linked you to textbooks on heat transfer I have studied”, but falls on his face because his “links” seldom are on the same subject, of if they are, Norman doesn’t understand them!
He links to info about a heat lamp that he can’t understand, then he demonstrates his ignorance. He proposes an “experiment”: Heat a concrete surface with a 250W heat lamp.
He claims that a 250 W heat lamp cannot warm a room-temperature concrete surface because the surface is emitting 400 W/m². Again, he’s confusing “W/m²” with “Watts”. This is a common mistake by the cult, and they can’t learn.
The heat lamp, even with no focusing reflector, could be emitting close to 10,000 W/m² at its glass surface. So, within a distance of half a meter, or less, it would have no trouble warming the room temperature concrete.
Norman makes up his own reality: “It does not matter what the heat lamp is giving off at all! I do not know why you divert to this point. The heat lamp will still only put a flux of 250 W/m^2 on the concrete at its most.”
And this classic: “The flux arriving at the concrete could not be more than 250 W/m^2 if the area of the concrete is one square meter.”
So in Norman’s head, a heat lamp cannot warm concrete! And he finishes with:
“If you make statements that are incorrect on what you mean than [sic] that would be on you to correct.”
So, poor Norman has a lot of correcting to do. Don’t hold your breath….
Clint R
Looks like you need your attention fix. Most of what you post is garbage. I will spend time on just one of your multiple points that is quite stupid (meaning you cannot think or comprehend anything, kind of a mindless zombie).
“The atmosphere is not warming the surface!! “And again, “The effect is not warming.”
I have spent too much time hoping you have a rational mind only to see you have none.
HERE: “The atmosphere is not warming the surface!! “And again, “The effect is not warming.”
That is correct. You have no understanding of the GHE and yet many have explained it to you several times! The only thing warming the surface is the Sun and some geothermal activity. The GHG do not warm the surface, they reduce the rate of cooling allowing the solar input to force a higher surface temperature (similar to any other form of insulation, not that you can understand this at all).
So blab on. You have a few ignorants who follow your stupid posts, the science minded consider you a foolish poster who makes a fool of himself on a daily basis with clown posts.
Wrong again, Norman.
Sun is a constant heater for Earth. You’re confused because day temps are warmer than night temps. But, solar heating is constant.’
Again, it’s obvious you don’t understand any of this.
(I noticed you didn’t mention your other failings.)
What crap will you sling next?
Norman,
What I don’t understand is you say that it isn’t warming the surface but then link the Berkley Earth post that says radiative forcing from Carbon Dioxide is warming the surface. It seems like you’ll post anything that advances your leftist agenda.
Stephen p anderson
Your political mind and obsession with what you think is “left” has turned your mind to mush! Sad to see. You are super gullible to every crackpot theory that goes against GHE!! I reread the Berkley article and they do not claim the CO2 is doing the warming! The Sun is warming. The added CO2 reduces the amount of energy leaving the Earth system. I suggest you take of your political glasses and read cleary what the article is saying. You whine about the left while being a fanatic rightwing nutjob! Fanatics are bad on either side!! You lose the ability to think and just mindlessly react!!
Norman,
That isn’t what is happening either. The convective energy from the adiabatic expansion of the rising parcels of air at lower pressure results in a drop in internal energy of the air. That’s why it is called the adiabatic lapse rate.
Norman,
This is their exact statement: “The first graph shows CO2 radiative forcing measurements obtained at a research facility in Oklahoma.”
And “both series showed the same trend: atmospheric CO2 emitted an increasing amount of infrared energy, to the tune of 0.2 Watts per square meter per decade. This increase is about ten percent of the trend from all sources of infrared energy such as clouds and water vapor.”
I don’t know if your understanding of English is the same as mine, but it seems pretty clear what they’re meaning.
stephen p anderson
Forget the English and consider evidence! In the article they do not say the 0.2 W/m^2 per decade are warming the surface. You won’t find that in the article.
https://gml.noaa.gov/webdata/tmp/surfrad_6a3080aa51449.png
Look at this link. The Downwelling IR is less than the Upwelling IR. It is NOT producing warming of the surface!! It is reducing the rate the surface cools. You can see the Net IR is negative meaning the surface is still losing energy, just at a lesser value with GHG present. Without any GHG (like if just O2 and N2) the loss would be at a rate between 400-600 W/m^2 range as with GHG just less than 200 W/m^2. This allows the solar heater to produce a higher surface temperature (the forcing term they use).
Here is some English “Positive radiative forcing occurs when the Earth absorbs more energy from solar radiation than it emits as thermal radiation back to space.”
Nowhere does it say the colder atmosphere is warming the surface! The GHE works because the GHG present reduce the rate of energy loss to space. The surface warms via solar heating to the point where the emission of the surface is high enough so that 240 W/m^2 exit at the TOA.
I have given you actual values to demonstrate the GHE. If you choose not to understand it, that would be on you.
So, copying the verbiage word for word doesn’t convince you. OK.
stephen p anderson
In you quote from the article: “both series showed the same trend: atmospheric CO2 emitted an increasing amount of infrared energy, to the tune of 0.2 Watts per square meter per decade. This increase is about ten percent of the trend from all sources of infrared energy such as clouds and water vapor.”
Okay so where, in English, do these words convey that the increased infrared is “warming” the surface???
YOU: “but then link the Berkley Earth post that says radiative forcing from Carbon Dioxide is warming the surface.”
Where in your quote does it says this. I gave you a explanation in a post showing you what it means and giving you a link that the solar input is the energy source, the GHE lowers the loss of energy so the solar input is able to heat the surface to a higher temperature. It is stated as such in the Berkley article.
Norman,
So, the quote “CO2 radiative forcing measurements” isn’t a quote. OK. If I quoted an article that says “the ball is red” you’d say where’s the quote the ball is red? You’d say, no you said the ball is red but where’s the quote the article says the ball is red? And, I’d say I just quoted it. And, you’d say, no you didn’t.
Stephen p anderson
The lack of understanding is on your end. You do not know what radiative forcing means. You have some idea in your head but have not done the mental work necessary to understand what it means. Adding more GHG to atmosphere reduces the rate of energy lost to space. Please look at the SURFRED link in my post above!! It was put in for your benefit! The energy (back radiation) is not actually warming the surface. Remove the Sun and surface cools. Look at the Net IR in my link! It is negative!! GHG return some energy back to surface but less than the surface emits so it is still cooling the whole time. The increase in the DWIR they discuss will reduce the energy loss a bit which allows the solar input to establish a higher surface temperature. Tell me what I am saying that convinces you I do not have a solid grasp of the concept of Radiative Forcing??
Norman,
So, this is what you’re claiming the article says. CO2 goes up by X amount. Surface radiation goes up by X amount. Therefore, CO2 insulation causes more surface radiation. That’s real science.
Norman,
It isn’t my lack of understanding. I know that’s the propaganda now but that’s not what the Berkley Earth link implied. The IPCC’s model still has the 340 W/m² of downwelling radiation. So, you’ve flipped from that to the CO2 acting as an insulator schtick. Now, you just have to show evidence that greenhouse gases absorb outgoing radiation and results in the atmosphere warming.
So Norman, everyone has dropped the back radiation model like a hot potato, right? Maybe someone should tell the IPCC.
Stephen p anderson
Have to ask you, do you know how insulation works??
Yes there is an average back radiation of 340 w/m^2, bur the surface emits 398 w/m^2! The surface radiatively cools. The GHG reduce the rate of cooling allowing the solar input to maintain aa higher steady state surface temperature!! If the addition of CO2 results in a slighly higher DWIR, it will reduce the cooling rate and the solar input will reach a bit higher temp as cooling is reduced.
This might help you understand. Wrap a heated object in insulation and see if the effect of insulation increases the temperature of your heated item. You know the insulation is not the source of new energy but still the insulated object gets hotter!
Norman,
You go in circles. You claim the surface emits 398 but there is 340 of back radiation that counters the 398. Is there energy transfer with the back radiation? If so, then you have a cooler atmosphere heating a warmer planet. Doesn’t happen and there’s no evidence for ti.
stephen p anderson
Good Grief! Your lack of comprehension blows me away! Maybe you failed math as a youth? What do you not understand that if something is emitting 398 (loss) and getting a return from back radiation of 340 it still is losing 58 W/m^2. It is not gaining energy in this exchange!!
The reduced rate of surface heat loss of only 58 W/m^2 rather than 398 W/m^2 (case with no GHG) allows the Solar input to increase the surface temperature to a new steady state. Similar to what any insulating effect would have on a heated object.
Rather than show ignorance, do what I suggested and insulate a heated object and let me know what happens to the temperature of the heated object before and after you add insulation. If you can do this then maybe you can try to grasp what is going on with the GHE. If you can’t grasp the concept of insulation your mind is true mush!
Good grief yourself. There is no such thing as a heat exchange between a hotter object and a cooler object. Heat flows only flows in one direction, from lower entropy to higher entropy. Second Law of Thermodynamics. There is no net heat exchange in thermodynamics. I made an “A” in thermodynamics. Not sure what you made.
Norman,
Yes, I know how insulation works. The adiabatic lapse rate falsifies your CO2 acts as an insulator theory.
Troglodyte might never guess who wrote that:
Perhaps he might be able guess who wrote that:
He’ll get an A if he comes up with two correct guesses.
Glad to have you back, Clint! Let’s review.
“One source supplying 240 W/m2 to the imaginary sphere would result in the sphere having a temperature of 180K and emitting 60 W/m2… Four such sources — 255K, 240 W/m2… once the sphere is emitting 240 W/m2, an additional 240 W/m² would not be able to increase the temperature. Radiative fluxes don’t simply add.”
Make the sources just like our sun at 1 AU to an Earth sized sphere. We do this because we now know the temperature of the source, which is critical to the following.
Completely surround the sphere with suns. Now we have the classic cavity equilibrium scenario.
The sphere must equilibrate temperature with the walls of its environment, which is 5778K. This is thermo 101.
Ergo, you must keep adding fluxes beyond the 1360 W/m2 provided by 4 suns to the sphere to achieve equilibrium with the sphere’s environment when it is surrounded by suns. Each added sun is added flux until the sphere’s field of view is completely filled.
Sorry blackbody barry, but that’s no more than “focusing”, as with a magnifying glass.
That ain’t “simple” adding.
What will you try next?
If adding fluxes is equivalent to concentrating them, then adding more fluxes makes the target hotter.
The solar radiation falls as collimated light at 1 AU from the sphere. No concentration of light, it’s all just adding flux.
As you must agree the sphere is 5778K when surrounded by suns, I’m curious to know what happens if you add suns one by one until the sphere is completely surrounded. Is it a gradual rise in temperature or is there a sudden jump at some threshold, such as when the last sun is emplaced?
What do you see happening temperature-wise to the sphere on the journey from 4 suns to 184,000 filling the sphere’s field of view?
blackbody barry, when you grow up you will realize that changing the problem is perverting the problem.
What perversion will you try next?
It’s exactly the same problem. You added an extra source claiming no further temperature change was possible. Adding more sources stress tests your claim using your own method.
You’re now calling foul on the most logical extension of your own idea.
Fluxes add. It’s proven. Whether or not you own up to it, it’s plain to anyone reading.
No blackbody barry, it is NOT the same problem. You have perverted it. In your perversion of “184,260 suns”, what if the sphere remained at 255K, until the very last sun was added?
See, that’s the trouble with your perverted scenarios. You can get any answer you want.
But, in reality, you can easily prove fluxes do not simply add. Just try to boil water with the flux from ice blocks. You get to use as many ice blocks as you want….
(Got a diagram of the plates together yet?)
“what if the sphere remained at 255K, until the very last sun was added?”
Thank you for giving the answer I anticipated you’d try out.
“Is it a gradual rise in temperature or is there a sudden jump at some threshold, such as when the last sun is emplaced?”
“What if” indeed.
It doesn’t matter that there is no credible physical explanation for this magical proposition, what is important is that you answered speculatively, which is something you almost never do. Commendable.
The answer, of course, is that as the sphere’s field of view of coldest space is slowly replaced by a field of view with a high temperature, the sphere must equilibrate with each change to the temperature of the whole environment.
Fluxes add. You’ve been given quotes from physics texts, intuitive examples, and now an irrefutable rebuttal based entirely on your own argument. It is not commendable to cling to your opinion after all this.
Clint,
There is one more point that you have not considered, that refutes the notion that the sphere would not get any hotter beyond 4 sources even if we believed that only fluxes of higher irradiance can increase the temperature of the sphere.
It’s down to the geometry of the light. Four suns cannot provide an even spread of flux across a sphere. The irradiance is brightest directly underneath each individual sun, and it fades to where the light from the neighboring suns overlaps at a weak, shallow angle. I asked AI to do the math, and it said there is a roughly 20% irradiance variance across the surface of the sphere for 4 equipositioned suns.
So, adding more suns would provide an intensity of flux greater than being received at every point directly beneath each added sun, until every point on the sphere received an equal intensity of illumination. The sphere would get hotter even with your erroneous belief that ‘fluxes do not add’.
“But, in reality, you can easily prove fluxes do not simply add. Just try to boil water with the flux from ice blocks. You get to use as many ice blocks as you want”
Nope, I can only use as many blocks of ice that fill the field of view of the object being irradiated by the ice.
And, just like filling the sphere’s field of view with suns, the flux absorbed by the target is now equal to the flux emitted by each block of ice.
4 sun-sized blocks of ice at 1 AU from an Earth sized sphere: you think the sphere is getting 4 X 300 W/m2 irradiance?
You’ve been schooled on this for years, and yet you keep equating the flux emitted by an ice cube with the flux being received from the ice cube. You know better, because you correctly work with radiative geometry when you calculate the flux/temperature of 4 sources around a sphere.
Well blackbody barry, I suspect you’ve already figured out your mistakes. That’s why you’ve resorted to misrepresenting me.
I’m used to such childishness.
Again, the reality is your “184,260 suns” are not only a perversion of the problem, but they also debunk your “plates” nonsense. With the inner sphere at sun temperature, the suns are still emitting to it. Where do all those fluxes go? Does the inner sphere get even hotter? If you admit the fluxes can no longer warm the inner sphere, you’ve debunked the bunny rabbit nonsense!
And as usual you don’t want to discuss the fact that your beliefs mean you can boil water with ice. You avoided that before, and now you claim the geometry wouldn’t allow it? Instead of realizing how idiotic your beliefs are, you’re inventing ways the geometry won’t allow 300 W/m² to reach the sphere’s disk from multiple directions?
Since you believe fluxes simply add, it would only take 6 arriving 300 W/m² fluxes to total 1800 W/m². That would bring the sphere to 422K (300F, 149C), more than enough to boil water. You can’t visualize 6 large blocks of ice around a sphere?
Just think what 186,240 such arriving sources could do….
What childishness will you try next?
“With the inner sphere at sun temperature, the suns are still emitting to it. Where do all those fluxes go? Does the inner sphere get even hotter?”
What do you think happens in ANY enclosure at equilibrium? Do you honestly think objects inside get hotter than the enclosure?
Of course not.
Everything inside reaches the same temperature. Every surface emits all that it receives.
None of those replies responds to the rebuttal.
“With the inner sphere at sun temperature, the suns are still emitting to it. Where do all those fluxes go? Does the inner sphere get even hotter?”
The classic cavity scenario has the walls at a fixed temperature that doesn’t change. The point is about thermal equilibrium between the object and the environment, which is germane to your scenario.
Allowing the walls to change temperature is a different analysis and I’m not inclined to change the subject.
“you’re inventing ways the geometry won’t allow 300 W/m2 to reach the sphere’s disk from multiple directions?”
On the contrary. I said:
“And, just like filling the sphere’s field of view with suns, the flux absorbed by the target is now equal to the flux emitted by each block of ice.”
That’s how you get 300 W/m2 irradiating the entire surface of the target.
But, if you disagree, how many sun-sized blocks of ice at 1 AU from the sphere do you think it would take to irradiate the total surface of the sphere with 300 W/m2?
For context, our sun radiates 63 million W/m2 from its 5778K surface, but irradiates the disc of the Earth at only 1630 W/m2.
“Since you believe fluxes simply add, it would only take 6 arriving 300 W/m2 fluxes to total 1800 W/m2”
I didn’t read this before I replied, sorry.
Yes, that’s correct. However, you have again assumed that the flux arriving at the surface is the same as the flux emitted by the block of ice.
That’s like saying that because the sun emits 63 million W/m2 from its surface that must be the flux irradiating the Earth.
You can scale this all the way down to real ice cubes and a marble in space. The geometry issues are the same.
Inverse square law: the intensity of radiation is inversely proportional to the square of the distance from the source
Adding to this is that the arriving flux from the ice cube is spread over a curved surface.
Because of this geometry, you need the entire field of view of the sphere filled with ice cubes to get it radiating at 300 W/m2.
Barry
Good try. This has been explained to him multiple times. He is a Cult Brick. Reason does not enter this dim mind! I think one constant is true. Contrarian crackpots never change their points. They post the same nonsense month after month and year after year. I think the motivation for a crackpot mind is that they are incredibly intelligent and eveyone else are either dishonest or dumb! Their extreme ego does not allow the possibility they are wrong. Evidence and logic do not work on these mind types!
The cult kids have gotten themselves in deep doo-doo again!
Child Nate was able to quote me correctly, but he omitted the last sentence: If you admit the fluxes can no longer warm the inner sphere, you’ve debunked the bunny rabbit nonsense!”
And blackbody barry also quoted me correctly, but he ignored the word “arriving”: “Since you believe fluxes simply add, it would only take 6 arriving 300 W/m² fluxes to total 1800 W/m².
Kids these days….
“barry also quoted me correctly, but he ignored the word “arriving”: “Since you believe fluxes simply add, it would only take 6 arriving 300 W/m2 fluxes to total 1800 W/m2.”
That’s simply untrue. I’ll quote myself.
“However, you have again assumed that the flux arriving at the surface is the same as the flux emitted by the block of ice.
That’s like saying that because the sun emits 63 million W/m2 from its surface that must be the flux irradiating the Earth.”
I then explained the inverse square law: flux intensity (300 W/m2) dies off by the square of the distance it travels.
I made the same point to you two comments before that one:
https://www.drroyspencer.com/2026/06/uah-v6-1-global-temperature-update-for-may-2026-0-53-deg-c/#comment-1746517
Therefore, 6 arriving fluxes of 300 W/m2 are not coming from ice cubes, they are coming from much hotter objects.
In just the same way the 63 million W/m2 flux from the surface of the sun dies off to 1360 W/m2 by the time it arrives at Earth.
This is the point that is continually ignored. By you.
Dang, is blackbody barry still beating his dead horse?
I made it clear. The fluxes are ARRIVING. So there’s no need for the keyboard extravaganza involving emitting, inverse square law, hotter sources, and the endless babbling.
That’s called “clogging the blog”.
Kids these days….
“I made it clear. The fluxes are ARRIVING.”
And I made it clear that an arriving flux of 300 W/m2 MUST come from a source much hotter than an ice cube. UNLESS the ice completely fills the target’s field of view.
Which means it doesn’t matter how many ice cubes you irradiate the target with, the incident flux will always sum to a maximum of 300 W/m2.
You posited 6 fluxes from 6 sources irradiating your sphere at 300 W/m2 each, for a total of 1800 W/m2. That’s quite correct, as I said.
But those sources are much hotter than ice cubes to be able to supply that intensity of flux to the sphere.
Your ice cubes boiling water comment doesn’t pass the inverse square law and the view factor geometry. That’s the point of this conversation.
In case you’ve forgotten what you said, Clint, here it is.
“your beliefs mean you can boil water with ice. You avoided that before, and now you claim the geometry wouldn’t allow it? Instead of realizing how idiotic your beliefs are, you’re inventing ways the geometry won’t allow 300 W/m2 to reach the sphere’s disk from multiple directions?
Since you believe fluxes simply add, it would only take 6 arriving 300 W/m2 fluxes to total 1800 W/m2. That would bring the sphere to 422K (300F, 149C), more than enough to boil water.”
Are you saying that the arriving 300 W/m2 comes from an ice cube, in defiance of the inverse square law?
blackbody barry, you keep proving me right. You don’t understand the science and you can’t learn.
If a block of ice is close enough, it could easily provide 300 W/m² to the surface. Or, a sun at millions of miles away could easily provide 300 W/m² to the surface. It doesn’t matter. In your false beliefs, 6 such ARRIVING fluxes would add to 1800 W/m², which is more than enough to boil water. So you, and your cult, believe the flux from enough ice would add to boil water. And because you are so uneducated and immature, you can’t learn why you’re wrong. You just continue throwing crap at the wall.
Keep proving me right. I can take it.
Norman,
Please explain the cause of the difference in temperature between the base and the summit of Mauna Loa?
“If a block of ice is close enough, it could easily provide 300 W/m2 to the surface.”
A block of ice half a millimetre away from a surface of the same area provides 289 W/m2.
But the block of ice you slot next to the first one only provides 2 W/m2 to the same target area, because of the angle of incidence.
Let’s map this out.
An inch wide block of ice an inch away from a surface of the same area provides 60 W/m2 (assuming the ice radiates at 300 W/m2).
Surround that cube with eight others. 9 square inches of ice over the one inch target area = 215 W/m2 irradiating the target.
1 square inch of ice = 60 W/m2
9 square inches of ice = 215 W/m2
25 square inches of ice = 264 W/m2
49 square inches of ice = 281 W/m2
63 square inches of ice = 288 W/m2
121 square inches of ice = 292 W/m2
169 square inches of ice = 294 W/m2
225 square inches of ice = 295 W/m2
If you doubt these numbers, please check for yourself.
See what’s happening? Each expanded border of ice cubes we add is further away from the target, has an ever greater angle of incidence, and adds less and less flux to it.
We could add hundreds more ice cubes, and still we would not quite get to 300 W/m2 if the target’s field of view included even a sliver of cold space.
But, we can configure only 5 ice cubes to irradiate the area with 300 W/m2. Just slide 4 of them forward to make a closed box with the original cube at one end, and the target on the other.
Now the entire field of view of the target is filled with ice. It will radiate at the same temperature as the ice.
Fluxes add, but because of the inverse square law and view factor, no amount of ice cubes will ever irradiate a surface to greater than 300 W/m2.
I don’t know how to explain this any better. You’re on your own after this.
Actually, there might be a better way, and I already did it with the suns.
Create an enclosed box of ice using blocks, with the sphere inside. Sphere is at equilibrium with the environment, radiating at the temperature of the enclosing ice.
If you remove any ice and expose the sphere’s view to colder space, the temperature of the sphere will drop accordingly. 300 W/m2 – X W/m2.
Ergo, adding blocks of ice to the sphere’s field of view will increase the sum of flux to a maximum of 300 W/m2 and never any more.
So blackbody barry can’t visualize six 300 W/m² fluxes ARRIVING a sphere, from six different directions? Four equally spaced around the equator and one at each of the poles?
Cultism has obviously destroyed his ability to think rationally.
But, he can still clog blogs with nonsense, endlessly.
“So blackbody barry can’t visualize six 300 W/m2 fluxes ARRIVING a sphere, from six different directions? Four equally spaced around the equator and one at each of the poles?”
Of course I can. As I’ve laid out, those fluxes can’t originate from ice. Has to be a hotter source. And if the sources completely enclose the sphere, then in equilibrium they are all radiating at 1800 W/m2.
So each of those sources are at least 149C. Any gaps between them to open space, then they need to be even hotter to supply 300 W/m2 each to the sphere.
No amount of added flux from blocks of ice can ever boil water. That’s the point.
Clint,
Use delta U = Q + W
And each time you add a Q the U goes up.
No matter that the surface area of a sphere is four times the cross section of said sphere.
Sorry blackbody barry, but the ONLY consideration is what flux is ARRIVING. You just keep slinging the same crap against the wall.
You can learn how ridiculous you look by watching boob droege….
“the ONLY consideration is what flux is ARRIVING”
Ok, if you don’t care what the source is, fine. No problem.
However, you can no longer posit that ice cubes boil water, because no number of added flux from ice cubes will irradiate a target above 300 W/m2, as I’ve demonstrated.
As you are now categorically ignoring the source flux altogether, you no longer have an interest in the temperature of the source, and there’s nothing left to say.
The ONLY consideration is what flux is ARRIVING, blackbody barry.
You believe six 300 W/m² fluxes arriving the sphere could boil water. Ice, at freezing point, emits 315 W/m². So if you correctly positioned huge ice blocks around the sphere, you’d easily have enough to boil water, in your false beliefs.
You’re running out of crap to throw at the wall. That’s why you have nothing left to say….
“Ice, at freezing point, emits 315 W/m2”
That’s the blackbody flux at 0 C. Ice actually emits 306 W/m2, with emissivity 0.97.
In any case, to get the target object radiating at 306 or 315 W/m2, you need to completely surround it with an environment radiating at those fluxes.
Thus it is not possible for any number of ice cubes to boil water. Inverse square law and view factor means the maximum sum of fluxes from ice cubes arriving at a target is the same as what ice emits from its surface.
Just like surrounding a sphere with suns brings the sphere’s temperature to the same as the surface of the suns.
Can 6 arriving fluxes of 300 W/m2 sum to boil water? Of course. But despite your hopeful protestations to the contrary, those sources are hotter than ice.
If you cannot understand this very basic cavity equilibrium scenario, how can you hope to understand the physics of the GHE?
stephen p anderson
YOU: “Good grief yourself. There is no such thing as a heat exchange between a hotter object and a cooler object. Heat flows only flows in one direction, from lower entropy to higher entropy. Second Law of Thermodynamics. There is no net heat exchange in thermodynamics. I made an “A” in thermodynamics. Not sure what you made.”
First I did not make the claim of a “heat” exchange!! I have strong doubts you made an “A” in any science class. You show little knowledge of any physics and can’t see garbage physics when it is presented to you. That out of the way. There is a net energy exchange as stated by any textbook on the topic. I have linked to textbooks more than once which clearly states such.
The further proof that you did not get an “A” in a science class is you think pressure is the reason the surface is warmer than radiant energy alone could create. Dr. Roy Spencer could see this from the previous thread.
https://www.drroyspencer.com/2026/05/pressure-causes-temperature-its-time-to-climb-down-from-mount-stupid/#comment-1744940
I can tell you why such theories are garbage, not that you will care. If Venus or Earth did not have a radiative GHE but had these high surface temperatures from pressure and solar input, you would have bright IR temperatures at the TOA. Venus would be really hot. This is not the case. You just believe these nonsense theories because you are gullible and did not achieve any high grade in any science class. I would be amazed if you actually studied any science at a higher level.
What I have on my side is evidence. What you have is blind belief and a rejection of science as you believe it is created by the “left” and your hatred of anything “left” turns your mind to mush.
A thinking person could evaluate ideas from both “left” or “right” sources and be able to think about them. Some left ideas may be good and helpful and some may not be, some right ideas may be good and helpful and some might not me. You have a polarized mind and it has lost all thinking ability. I think it is sad, maybe in your youth you could think and reason and maybe did get an “A” in a science class. Now your mind is gone, lost to polarization.
You need evidence?
https://gml.noaa.gov/webdata/tmp/surfrad_6a320fe93a352.png
You can reject it in favor of some crackpot theory from some person with a degree in Forestry, that is your option, you are a free human. You might expect to get scrutinized by your choice on a science blog.
Norman,
Dr. Spencer says a lot of right things but he’s wrong about this. Please explain the cause of the temperature difference between the base and summit of Mauna Loa. Also, if there is an adiabatic expansion of a parcel of air against lower pressure, is there a drop in the internal energy of the parcel of air?
stephen p anderson
This debate is old and well thought out. Here is what a physics professor debunks the gravity heating hypothesis. Maybe read through this and see if Roy Spencer is not correct.
https://wattsupwiththat.com/2012/01/24/refutation-of-stable-thermal-equilibrium-lapse-rates/
Norman,
That guy’s response is gobbledygook. If pressure due to an outside forceNo one is saying that radiant heat isn’t heating the surface and the parcel of air isn’t heated from the ground up. No one is saying that air isn’t rising convectively. How is the lapse rate derived? It isn’t derived from radiative forcing. There is no radiative function in the lapse rate. Again, what causes the temperature difference between the base and summit of Mauna Loa? (
Norman,
I don’t need an appeal to authority to understand the physics. That guy’s response is gobbledygook and doesn’t really address the physics of the lapse rate. He doesn’t understand it. He creates a straw man. No one isn’t saying that the parcel of air is heated from the ground. Conduction and convection cool the surface. The parcels of air lose their internal energy from adiabatic expansion. The physics of the lapse rate isn’t really debatable. Pressure of an ideal gas is proportional to temperature. That’s a fact. Atmospheric pressure changes with altitude. That’s a fact. The outside force, gravity, is applying the pressure. That’s a fact. How does a diesel engine work? What causes the temperature of the air in the cylinder to increase? Again Norman, you answer, what causes the temperature difference between the base and summit of Mauna Loa? (Hint: It isn’t radiative forcing)
Troglodytes need to understand that what they understand is quite irrelevant. It’s the understanding they show that matters. For that, citing sources helps. Citing is not enough: explanation is crucial. Without authoritative support, cranks end up in Step 3 – Saying Stuff. We already have Bordo for that.
Playing riddles doesn’t count.
Handwaving doesn’t count.
It’s all pretty basic. Misunderstanding these social norms makes me wonder if troglodytes ever paid any attention to the social cues around them.
Stephen p anderson
The commpression initially heats the gas but does not keep it warm!! You can look at our atmosphere profile and see that in the region, tropopause, where there is no longer convection creating the lapse rate, the temperature is isothemal even though the pressure is still dropping the whole distance!
You will not accept evidence that goes against your established beliefs! I have already pointed out that if not for GHE you would have a much higher IR emission to space. I already know rational thought or evidence have zero effect on your contrarian crackpot brain. I would like to know what school gave you a A in thermodynamics when you don’t even understand emissivity??
Norman,
Yes, but with the Earth, heat transfer doesn’t stop. You get the continual input from Earth. With the diesel engine, you get combustion due to the increase in air temperature, some of the energy is converted to work and the rest is lost through inefficiency. My point was which you seem to want to continue to deny is that pressure can cause an increase in temperature. Also, when the pressure falls so low in the tropopause other factors take over temperature but the lapse rate due to pressure still applies. Also, the effective emission height of OLR is way before the tropopause. Convection doesn’t create the lapse rate. Changing pressure creates the lapse rate as seen in its derivation. Again, what is the cause of the temperature difference between the base and summit of Mauna Loa? You’ll need to support your answer.
BACK AT THE RANCH
In recent months, as Paramount and Netflix vied to buy Warner Brothers, Double Dealing Donald bought stock in all three companies. Now the Justice Department is considering whether to approve Paramount’s purchase of Warner Brothers.
https://www.brennancenter.org/our-work/analysis-opinion/epic-corruption-plain-sight
Dullard,
So how many USA public servants become millionaires?
Unlike all the previous presidents Trump has not claimed any salary.
So yet again your double standards is very evident.
Op. Cit.
Dullard,
Are you making up for all of your missing comments about the corruption of the Democrats and their very suspect behaviour?
Remember that Trump used to donate to the democrats, then they used to ask him favours.
Op. Cit.
TDS.
Oh, Tom:
https://magnatewealth.com/about-us/tom-hagedorn/
Is that what you’re Lord told you to behave?
Apparently, the truth can really hurt. I don’t know how else to describe the conduct of someone who continually posts political opinions about political figures and contentious political issues on a blog dealing with the science of climate.
Apparently, Tom is just an ordinary troglodyte.
Let’s hope he did not charge more than 1%.
Tom,
Wear the troglodyte label like a badge of honor. Williard’s a girl by the way.
Troglodyte,
Is there something in Tom’s bible using “girl” as an insult?
Catching up on the never ending nonsense…
Upthread, blackbody barry tried to disprove science using AI. He got AI to provide “evidence” that ice cubes could boil water!
But blackbody barry wasn’t finished. He formed a shell around a planet with 184,260 suns, proving enough suns could bring a planet to sun temperature.
But, that wasn’t even relevant to a fifth 240 W/m² arriving flux being unable to raise the temperature of a sphere already established by four 240 W/m² arriving fluxes.
Kids these days….
“…formed a shell around a planet with 184,260 suns, proving enough suns could bring a planet to sun temperature.
But, that wasn’t even relevant to a fifth 240 W/m2 arriving flux being unable to raise the temperature”
You were going to explain why not. Please lay out your argument.
Focusing with a magnifying glass is NOT simple adding.
Have you got your diagram of the plates in full contact yet?
You probably can’t create one, so feel free to use this:
https://postimg.cc/F1fryx8h
(Yea, that means your bunny rabbit is bogus, just like your imaginary sphere.)
I replied to this above.
Barry,
What percentage of the Australian labor force works for the government?
I condensed my argument just upthread.
https://www.drroyspencer.com/2026/06/uah-v6-1-global-temperature-update-for-may-2026-0-53-deg-c/#comment-1746420
“once the sphere is emitting 240 W/m2, an additional 240 W/m² would not be able to increase the temperature. Radiative fluxes dont simply add.”
But Barry showed that many sun sources, filling the sky around Earth WOULD increase the temperature by a huge amount.
“Your comment mentioned an extra 240 W/m2 irradiating the sphere, asserting no effect. I took that assertion to a logical conclusion to demonstrate its falsehood. If what you say is true, 184,000 suns completely surrounding the sphere would provide no more warmth to it than 4. My argument scotched that assertion, as the sphere must be in equilibrium with its environment.”
And Clint could not refute this.
Clint promised to go away and think and come back last weekend with a rebuttal.
But clearly he has come up with nothing.
An adult would admit that his theory has been falsified.
Child Nate, when you blindly follow blackbody barry, you fall in the same pits as he does.
That’s “togetherness”, I guess….
Happy to take on the title of blackbody barry. It has a good ring! Keep it up.
Do you not know your sphere has an emissivity of 1? Your math is true only if the surface of the sphere reflects no radiation. You’ve been working with a blackbody the whole time! LoL
Yes, I use the concept of a black body to keep things simple, so even children can understand. But, I don’t use the concept to violate the laws of physics, like cult kids do.
And, speaking of cult kids, I was trying to find an old comment and found this instead:
https://www.drroyspencer.com/2026/05/pressure-causes-temperature-its-time-to-climb-down-from-mount-stupid/#comment-1745851
I had been gone for 3 days and boob decides to sneak in a comment, full of his childish tricks, obviously hoping I wouldn’t see it. And as usual, he was more confused than funny.
What is it with these cult kids?
Hey Puffman, riddle me this:
https://popular.info/p/update-email-exposes-gop-dirty-tricks
What’s the Cosmic Microwave Background?
So sorry Clint, I wasn’t around for your regular trading.
Now back to Physics instructions.
Delta U = Q + W
You have been found repeatedly violating the above law.
What do you think?
Is it bogus?
According to that equation and law, what happens when a 15 micron photon hits a surface with 0.95 emmissivity?
Bob,
Why don’t you show us your evidence that the Earth’s emissivity is 0.95?
“Why don’t you show us your evidence that the Earth’s emissivity is 0.95?”
So you are skeptical even though you don’t know the evidence?
Stephen,
Google is free, but I charge 50 simoleans.
And Clint STILL has no answer, but plenty of insults.
He has been schooled.
But he cannot learn.
boob is addicted to stalking me.
Maybe he will out grow it someday, but it hasn’t happened for Willard yet….
Oh, yeah, Google, that’s the ticket.
Well Clint,
You were the complaining about not being fed.
Still trying to teach you some thermodynamics.
Apparently it is beyond your comprehension skills.
Again
Delta U = Q + W
Q is flux * area
Stephen,
I thought you might have enough competence to Google a chart of various emmissivities.
But I was wrong.
My cat can do better
Sorry boob, but in thermodynamics, “Q” is “energy” and “flux” is “energy per time per area”, or “power per area”.
So your “Q is flux * area” is WRONG.
It should be “power is flux * area”.
The more you stalk me, the more you prove yourself incompetent. Stick with comedy.
Hey Puffman riddle me this:
https://www.theguardian.com/society/2026/mar/29/full-network-clitoral-nerves-mapped-out-first-time-women-pelvic-surgery
Why are you proving every day that you’re a lousy engineer?
You are correct Clint I forgot to multiply by time.
Q = flux*area*time
Can you solve the problem now?
I no longer waste much time with cult kids that stalk me with insults and false accusations.
Problem solved.
Bob,
I’ve heard your cat is a very smart cat. I don’t know, it just seems the Earth has a lot of reflectivity to have an emissivity so high. Don’t you think?
Bob,
Emissivity is just a fudge factor, right? Ideal Black Body is 1. Everything else has a fudge factor called emissivity. I think they make emissivity what they want to get the answer they want. For instance, the Earth with an emissivity of 0.6 with an albedo of 0.3 gives you a surface temperature of 288K. Right?
Bob,
Hey, maybe we should ask your cat?
Troglodyte,
Given the 240K lives lost and the Taliban’s return to power, do you consider Occupy Afghanistan a victory?
Stephen,
Emissivity is not a fudge factor, it is measured.
Most of Earth’s albedo is due to reflection form clouds
Roughly 75% of Earth’s surface is seawater which has a very high emissivity, 98-99%.
Clint,
I am only stalking those who claim 15 micron infrared can’t cause any increase in temperature
If the boot fits, you gotta wear it.
And those who do not understand that 1st and 2nd laws of thermodynamics.
That be you.
boob, if you weren’t such an immature brat you would try to avoid making obvious false statements.
But, you can’t control yourself.
I NEVER said “15 micron infrared can’t cause any increase in temperature”. I don’t have time for your irresponsible childishness. You’ve just earned yourself a 30-day ban.
Hey Clit, riddle me this:
https://www.drroyspencer.com/2026/05/pressure-causes-temperature-its-time-to-climb-down-from-mount-stupid/#comment-1745472
What will you try next to keep deflecting?
Bob,
And I thought emissivity was dimensionless. My bad.
The incompetent, ineffective flak from the cult kids confirms I’m hitting the target.
“That’s why CO2s 15u photons cannot raise Earth’s 288 K temperature”
That’s what you posted.
Stephen,
It is dimensionless.
Bob,
So, it is a correction factor. Can you measure correction factors?
Stephen,
No, it is a measure of a materials ability to emitting thermal radiation.
SOLAR MINIMUM UPDATE
Conclusion: a good absorber (at freq ν) is a good emitter (at freq ν).
A perfect absorber ≡ “black body” is a body with α(ν, T ) = 1 for all ν, T .
So: thermal radiation is blackbody radiation.
This proves that the size, shape, reflectivity of the cavity don’t affect the spectrum.
https://mcgreevy.physics.ucsd.edu/s12/lecture-notes/chapter07.pdf
The name is Arthur:
https://www.nhc.noaa.gov/refresh/graphics_at1+shtml/171753.shtml?cone#contents
Apart from pesudoskeptics who doubt everything they either dislike or don’t understand, anybody can read this document and draw his own, mature conclusions:
The ASTER Global Emissivity Dataset (ASTER GED): Mapping Earth’s emissivity at 100 meter spatial scale
Glynn C. Hulley & al. (2015)
https://agupubs.onlinelibrary.wiley.com/doi/full/10.1002/2015GL065564
Just a hint:
” The emissivity of natural Earth surfaces is a unitless quantity and ranges between approximately 0.6 and 1.0 depending on the wavelength.
Surfaces with emissivities less than 0.85 are typically found over deserts and semiarid areas due to the presence of quartz grains, which are ubiquitous in these types of environments.
Vegetation, water, and ice have high emissivities above 0.95 that are nearly constant over the TIR wavelength range. ”
That should be sufficient for people with a normally functioning brain.
But…
Vegetation, water, and ice do not radiate visible light, they reflect light from the Sun. When the Sun dips below the horizon, there is no further radiation in the visible band unless the Moon is out or reflected starlight is included. Some ocean water does phosphouresce but not nearly enough to change the darkness of the oceans to be seen from any appreciable height.
The fact is that the only band where radiation is detected is in the infrared band and it is minimal compared to incoming sunlight during the day. According to Roy, there is some microwave radiation from the surface.
Methinks far too much is made of surface radiation, most of which, some 90+%, is radiated directly to space. If you look at any graph involving surface radiation, it is measured in milliwatts per frequency unit.
I can explain this. The guy posts this crap with an obvious error. The challenge is for you to find the error. If you find the error and respond, then it is game on. Do not respond. It just encourages him. The only regular who could not figure this out because he is so dense is Bindidon.
Others who play the same game include Clint R and the fake moderator. Others are just a dumb as they seem.
Nate and barry are playing a different game.
atephen…”Good grief yourself. There is no such thing as a heat exchange between a hotter object and a cooler object. Heat flows only flows in one direction, from lower entropy to higher entropy. Second Law of Thermodynamics. There is no net heat exchange in thermodynamics. I made an “A” in thermodynamics. Not sure what you made”.
***
Stephen…I agree with you completely re the one way transfer of heat. In fact, I am in general agreement with your posts. However, as skeptics, we need to get the idea of entropy onto the same page, since it has become a murky definition that many modern scientists fail to grasp.
Some have extended the meaning to a measure of disorder. However the units of entropy are joules/degree K (that is, a heat quantity/degree K), and I don’t see how that applies in any way to disorder. The idea of disorder came from a musing of Clausius after he had defined the 2nd law and entropy that on a larger scale that…
1)the energy in the universe is constant
2)entropy tends to a maximum.
He said nothing about disorder, it was other who drew that inference, albeit incorrectly. He did imply that all irreversible processes lead to disorder but that statement was incorrectly related to entropy becoming a maximum.
If you base that on hi definition of entropy, he is saying that the sum of all heat losses in irreversible processes is tending to a maximum. That makes sense in a way but it applies only to heat losses and not to other forms of energy being lost. Disorder is not simply related to heat losses it applies to any form of mass breaking up, with a heat loss or not.
Clausius defined entropy in support of the 2nd law. Any time you see someone defining the 2nd law in terms of entropy, they likely have no understanding of the meaning of entropy. Not talking about you here, I am referring to authority figures who tend to use the term entropy incorrectly.
Entropy as defined by Clausius is an integral quantity, that is, a summation of infinitesimal heat transfers (dq) in a process at temperature, T. Low entropy as compared to high entropy means there is less heat transferred in a lower entropy transfer.
Entropy is more clearly understood in the Gibb’s Free Energy equation…G = H – T.S. Here G is the total free heat (energy) while H (enthalpy) is the total heat (energy) while T.S is the entropy, or the heat (energy) lost and unavailable to do work.
T.S comes from the Clausius definition of entropy…
S = integral dq/T
The formula tells us that integral dq is the sum of infinitesimal quantities of heat at temperature T and S = entropy, is the sum of those tiny heat losses. T has been transposed to the LHS to isolate the integral, or sum, of individual dq’s.
In the Gibb’s free energy formula, T.S is the sum of those heat losses and it is a loss indicated by the minus sign. Obviously, a lower entropy means the integral(sum of) dq is smaller than the integral dq for a larger entropy. Comparing entropies is not really associated with the 2nd law since the law applies to each entropy case respectively, not to both. In other words if you had a low entropy, S1, and a high entropy, S2, case, each would require different heat quantities, Q1 and Q2. That means, essentially, two different processes.
Each to his own, but I find introducing entropy only muddies the water wrt the 2nd law. That’s why I stick to the Clausius definition of the 2nd law that heat can NEVER be transferred, ***BY ITS OWN MEANS*** from cold to hot. To me, that is far clearer than introducing an intangible like entropy.
SOLAR MINIMUM UPDATE
As with the first law of thermodynamics, the second law of thermodynamics has been verified by countless natural facts. The second law has different statements for different physical phenomena. The classic statements given in most of the literatures mainly include the Clausius Statement and the Kelvin–Planck Statement [1,2,3,4,5]. The Clausius Statement was expressed as “Heat can never pass from a colder to a warmer body without some other change, connected therewith, occurring at the same time”, and the Kelvin–Planck Statement as “It is impossible to construct a device that operates in a cycle and produces no other effect than the production of work and the transfer of heat from a single body”. The Clausius Statement is more in accord with experience and thus easier to accept, while the Kelvin–Planck Statement provides a more effective means for bringing out second law deductions related to a thermodynamic cycle [3]. Besides, the Carathéodory Statement also occupies an important position in thermodynamics, which is “In the neighbourhood of any arbitrary state of a thermally isolated system, there are states which are inaccessible from that state” [6,7]. It is not more widely used but brings out its essential features in a way that the traditional treatment does not [7]. Since then, various understandings for the statements of the second law came out continuously [8,9,10,11], which help to clarify the connotation of the second law from different angles. It is important to emphasize that these statements are logically interlinked, consistent, and equivalent [5,12,13].
However, it is strange that the second law of thermodynamics is quite different from other laws, like Newton’s law of motion, Ohm’s law of electric conduction, and Fourier’s law of heat conduction, etc. There are differences such as; (1) there are many different statements for the same law; (2) it is only a qualitative description of a physical phenomenon, rather than a quantitative relationship between different physical quantities; and (3) some phenomena similar to the Clausius Statement exist in other disciplines. For example, an object can never move from low to high location in a gravity field without some other change, and electrical charges can never move from low to high potential in an electrostatic field without some other change. However, none of them has been accepted as the statement of a certain law. With that in mind, we have reviewed Clausius’ mechanical theory of heat, published in the nineteenth century [14,15], and indeed found that he himself only called “Heat can never pass from a colder to a warmer body without some other change, connected therewith, occurring at the same time a fundamental principle rather than the statement of the second law of thermodynamics.
https://pmc.ncbi.nlm.nih.gov/articles/PMC7514258/
“The Clausius Statement was expressed as “Heat can never pass from a colder to a warmer body without some other change, connected therewith, occurring at the same time””,
****
Good point. I have seen this statement stated in other ways by Clausius and the point he emphasized is what he called ‘compensation’, or ‘by its own means’, which he associated with ‘some other means’.
If you look at a situation where heat appears to be transferred cold to hot, it involves a convoluted process involving external power, compressors, and a gas that can easily be compressed to a high pressure, high temperature liquid.
In other words, you are doing work on a gas to raise its pressure and temperature.
The idea here is to collect heat from a warmer location in a low pressure gas, then compress the low pressure gas to a high pressure, high temperature liquid. The high temperature liquid must exceed the temperature of the medium into which the heat is to be transferred, hot to cold, thus keeping the 2nd law intact.
In essence, you are increasing the collected heat’s temperature to a temperature higher than the medium to which you want to transfer the original room’s neat. If you check this out in the air conditioner of a vehicle, the compressed liquid can get seriously hot.
That can only be done using a special gas and a compressor that can increase the gas pressure, hence its temperature, to a higher temperature than the medium to which the heat is to be dissipated.
This is actually an application of the Ideal Gas Law. If you increase the pressure of a gas, it’s temperature must increase as well. Since the gas has been pre-warmed in the room needing to be cooled, that heat is, in essence, amplified by the compressor to a point where the gas, converted to a liquid, is now hotter than the medium to which the heat must be vented.
I think of that more as smoke and mirrors rather than a true heat transfer cold to hot.
More on Clausius’ statement:
Op. Cit.
Gordon,
Any energy source can power a refrigeration unit, for example The SSN Narwhal had steam driven air conditioners. The special gas being good ol H2O.
Clint,
Let’s go back to your original claim.
“One source supplying 240 W/m2 to the imaginary sphere would result in the sphere having a temperature of 180K and emitting 60 W/m2…
Three such sources — 237K, 180 W/m2.
Four such sources — 255K, 240 W/m2…
However, once the sphere is emitting 240 W/m2, an additional 240 W/m2 would not be able to increase the temperature. Radiative fluxes don’t simply add.
An arriving flux MUST be greater than the flux being emitted by a surface to raise the surface’s temperature.”
If your 4 sources ring the equator, then the poles will be very cold, emitting far less than 240 W/m2.
Place two more sources each supplying 240 W/m2 to the poles.
The arriving flux is greater than the flux being emitted at the poles, the surface temperature there must raise, and the global average becomes hotter than 255K.
The maximum limit of the temperature of the sphere is not set by the flux arriving from the sources, it is set by the flux emitted from the sources. Enclose the sphere in the source temperature and the sphere will match that temperature, whether ice or suns.
Wrong again, blackbody barry.
The “imaginary sphere” is also a super conductor, like your “plates”. So the poles would result in the same temperature.
You are really getting desperate to prove me right. Why not just admit I’m right?
The problem here is that Clint is just not very smart.
A spherical shell of suns around the planet gets you an equilibrium surface T = 5800 K.
A spherical shell of ice around the planet gets you an equilibrium surface T = 0C.
Whatever the T of the spherical shell, the surface must quilibrate to that T.
Clint is too dumb to comprehend that a spherical shell can be built from many individual emitters.
And he is too dumb to realize that this PROVES that temperature of the emitters is what sets the limiting T of the surface.
It is amusing to see Clint align his model’s parameters with Elis Rabbett’s to try to hold on to his mistaken belief.
All I have to do is ask, “what if the sphere isn’t a superconductor”, and his thesis goes up in smoke. Whereas, if you do the same wirth Eli’s model, the complexity increases but the thesis remains intact.
Clint will never be able to understand this distinction.
Of course, surrounding Clint’s sphere with sources to make a cavity instantly disproves his claim.
He’ll never understand that, either, it seems.
It’s been 2 days since my comment, so the cult kids must feel it’s safe to insult me and falsely accuse me.
But, they’re only proving me right, again!
Hope they keep it up, I’ll never get bored being proven right….
“But, they’re only proving me right, again”
We demonstrate glaring flaws in Clint’s ‘science’.
Do we get answers? Rebutal? Any sign of understanding?
No. We get throw away patent phrases.
Recently, Ark smirked….
““Partial temperature”? By all means, say more!”
***
If Dalton can break pressures from several gases into partial pressures what is wrong with associating the heat contributed by each partial pressure to the entire mix? After all, climate alarmists are doing precisely that by inferring that CO2 can heat the rest of the atmospheric gases. Some call it thermalization even though there is no way to measure it.
I am reasoning that a gas with an overall temperature, which some claim to be the average KE of all gases in a mix, should be able to be broken down in accordance with which gas contributed the heat associated with it.
If we have two gases in a mix, gas A and gas B, Dalton claimed that Ptotal = P gas A + P gas B.
That means according to the IGL, that …
Pgas A .(Vgas A) = ngas A. (R gas A) . (T gas A), and…
Pgas B. (Vgas B) = n gasB. (R gas B) . (T gas B)
Add those equations to get P gas total and you have two temperatures based on the KE contributed by each gas.
If you are going to talk about theoretical averages in such a gas mixture, you must account for the mass of each gas and its mass percent.
I think the idea that partial pressures cannot be associated with partial temperatures is rather anal.
Whoever defined temperature as an average was being rather short-sighted, but hey, when you are dealing with fake gas particles in a statistical environment, that’s what comes of it.
It should be remember that defining temperature as an average of the KE of gas particles is a definition based purely in statistical averages and not on real world gases.
The quantities used in reporting the experimental results for the absorption of radiation can be introduced by considering the derivation of Beer’s law for an absorbing solute in a nonabsorbing solvent. The decrease in intensity of the radiation as it penetrates a distance dl, is, according to Beer’s law, proportional to I, the radiation intensity; to C, the molar concentration; and to the path length dl. Introducing α(ν), the absorption coefficient, as the proportionality constant allows the equation
-dI=α(ν)IC dl
to be written. The dependence of α on the frequency is here emphasized by writing α(ν). Integration of this equation over the cell length l allows the absorption coefficient to be measured in terms of I₀, the incident intensity, or the intensity with no absorbing material, and I, the intensity of the radiation after passing through the cell containing the solution. The integrated form of Beer’s law is obtained in this way as
α=1/Cl ln(I₀/I)
An absorption band for a given transition usually extends over a range of frequencies. The total intensity of the band is obtained by measuring α(ν) in the region of the absorption and determining, usually by graphical integration, the integrated absorption coefficient A, i.e.,
A = ∫ α(ν)d(ν)
Where I expose the fantasy in the “two temperatures” argument.
Partial pressure is defined as the pressure that a component gas would exert if it alone occupied the total volume at the same temperature, assuming the gas behaves ideally.
Mathematically for a mixture of two gases, start with the ideal gas law:
PV=nRT
PV=(n₁+n₂)RT
If we remove Gas 2 entirely, leaving Gas 1 alone to occupy that exact same total volume (V) at that exact same temperature (T), it will exert its own specific pressure (P₁):
P₁V=n₁RT
We do the exact same thing for Gas 2 alone in the container:
P₂V=n₂RT
Adding the two partial pressure equations together:
P₁+P₂=(n₁RT/V)+(n₂RT/V)
P₁+P₂=(n₁+n₂)(RT/V)
(P₁+P₂)V= (n₁+n₂)RT
Since P=P₁+P₂ and n=n₁+n₂ we have recovered the ideal gas law equation.
If instead “you have two temperatures”:
P₁=n₁RT₁/V and P₂=n₂RT₂/V
P₁+P₂=(n₁T₁+n₂T₂)(R/V)
(n₁+n₂) can no longer be isolated, and the ideal gas law for the mixture does not exist.
Interesting stuff published at WSJ
https://www.wsj.com/tech/cybersecurity/how-millions-of-digital-home-devices-are-secretly-powering-cyberattacks-8fd73584?mod=WTRN_pos1
Robertson ‘think’s… Oh Noes.
” Methinks far too much is made of surface radiation, most of which, some 90+%, is radiated directly to space. ”
Since 1980, polar orbiting satellite-borne devices measure on global average 240 W/m² above the atmosphere.
Here is a computation of the radiant energy yearly emitted to space:
https://drive.google.com/file/d/1HbbQRfk_NniOO8NSTnFHhYiqvZiu2rNX/view
*
But Earth emits at its surface a lot more. A few examples:
https://drive.google.com/file/d/103bWbIPX7MwZwC42hfr15mcsO5Bu6c6h/view
*
” If you look at any graph involving surface radiation, it is measured in milliwatts per frequency unit. ”
Show us these ‘any graph’s…
Bindidon
https://seos-project.eu/earthspectra/earthspectra-c03-p06.html
This is the type of graphs Gordon Robertson refers to. This is an old ploy by him. I explained it to him a few years back but he has very low comprehension skills like most the Contrarians on this blog.
Gordon Robertson does not understand integration. The units are in Milliwatts per cm-1. You have to integrate each milliwatt over the entire band. They are also in steridan units so you multiply the value from integration by PI to get the actual value in milliwatts/m^2 than you divide that value by 1000 to get Watts/m^2.
You can spend much time with him and you will nut budge his ignorance. I have found all the contrarians on this blog stick to their idiot ideas for years. They are not seeking Truth. They come here just to throw a wrench in the works. Mostly just asshole personalities who think it is funny to provoke people. Kind of childish but that is where we are. Some are just fanatics that are polarized by a belief. I interact with the clowns from time to time but after some years of it I do realize that they have zero desire to learn any truth and mostly think it is funny to provoke posters.
Yes, I suppose the GHE deniers are content with undermining the skeptic movement, as Roy Spencer noted in April 2014:
“So why am I trying to stir up a hornets nest (again)? Because when skeptics embrace �science� that is worse that the IPCC�s science, we hurt our credibility.”
https://www.drroyspencer.com/2014/04/skeptical-arguments-that-dont-hold-water/
Whether they support it as a joke or in earnest, the effect is the same. Thanks to the Sky Dragons for inadvertently aiding Team Science.
Exactly!
While it’s true that some of the Skeptics do not fully understand the science, it’s even worse for the cult kids. Everyone would benefit from learning the basics.
But the big problem is the cult can’t agree on an exact definition/description of the CO2 nonsense. One time it’s “back radiation”, the next time it’s “insulation”. Until the cult can come up with a consistent statement of their belief how CO2 is warming the planet, they can expect many responses that don’t fit a moving target.
“One time it’s “back radiation”, the next time it’s “insulation”.”
Those two ideas are not in conflict.
CO2 absorbs some of the infrared radiation emitted by Earth’s surface and then re emit it in all directions, including back toward the surface.
As a result, some of the energy that would otherwise escape into space is redirected downward. This reduces the rate at which the surface loses heat and making the surface warmer than it would be without greenhouse gases.
Insulation is an analogy for that process (though not entirely).
I sincerely appreciate your efforts in helping take down these pesky fossil fuel shills and supporting meaningful progress toward a more sustainable future!
Eldro submits another attempt at defining the illusive CO2 nonsense: “This reduces the rate at which the surface loses heat and making the surface warmer than it would be without greenhouse gases.”
If he’s right, the “consensus” has moved away from its original Arrhenius equation that [fictitiously] produced a “forcing” from increased CO2.
We have to guess what ELdro means by “loses heat”. And we have to guess what he means by “making the surface warmer than it would be”.
It’s a lot of hand-waving and confusion. Just believe!
That ain’t science.
There are several different statements for the second law of thermodynamics.
Si if Planck, Clausius, Lord Kelvin, Carnation, and others couldn’t agree, then we should ditch that law too?
” CO2 absorbs some of the infrared radiation emitted by Earth’s surface and then re emit it in all directions, including back toward the surface. ”
Did H2O in its water vapor form suddenly disappear?
*
Devices like High-Resolution Fourier Transform Infrared (FTIR) Spectrometers, e.g. Atmospheric Emitted Radiance Interferometer (AERI), analyze downwelling infrared radiation “line by line” to determine the specific percentage caused by carbon dioxide (CO2) backradiation.
According to these measurements, CO2 backradiation accounts, depending on the location, for at best 15-25 % of the downwelling infrared radiation (some say even only 10 %); but water vapor however account for for 60-70 %. The rest is clouds, methane (CH4), ozone (O3), etc.
*
Why this endless, boring fixattion on CO2 ???
How long will we have to read that CO2 is the ‘control knob’, is ‘well-mixed’ and ‘doesn’t condense’ ?
That’s exactly what feeds the GHE deniers for years.
“We have to guess what ELdro means by “loses heat”.”
Earth continuously emits IR to space, and that is the main way it loses energy.
Either you didn’t know that or you did, and you’re trolling.
Whichever it is, it appeared only a few posts after the one that included the link where Dr. Spencer says GHE denial is embarrassing for skeptics….
Bindidon
Thank you for mentioning H2O. It is indeed important.
Warmer sea surface temperatures (resulting from the enhanced GHE) increase evaporation. The resulting increase in H2O concentration enhances the GHE further.
Global temperatures are going to rise substantially over the coming century.
Eldrosion,
IR absorbing gases emit 240w/m^2 OLR to space. That’s part of the energy budget. That’s what we think we know. Everything else is conjecture.
Eldrosion,
The lapse rate and Dr. Ed Berry’s model falsifies Greenhouse Gas Theory. There’s no doubt heat is radiated to space in the form of OLR. None of us deny that. That does not support GHT.
Sorry Eldro, but “loses heat” is not a meaningful phrase. You may have meant “loses thermal energy”. But, Earth emitting IR to space is NOT an alarming event. It’s quite natural.
Even Bindi doesn’t fall for your nonsense. You can’t responsibly describe your CO2 nonsense. No one can.
It’s not that hard to make a scientific statement. Want an example?
CO2’s 15μ photons can NOT raise the temperature of Earth’s average 288K surface.
See how easy that is? No endless rambling, no attempt at using differential equations, no appeal to authority, just basic physics….
“Humans will cease to exist without CO2.”
Is that a second law statement?
CR:
“CO2’s 15μ photons can NOT raise the temperature of Earth’s average 288K surface.”
Here we go again.
Try answering this simple question:
How can you tell the difference between a 15μ photon emitted by CO2 and a 15μ photon emitted by the sun?
Answer:
You can’t. Unless you erroneously believe photons have temperatures (which poor old Gordon believes).
Troglodyte’s JAQing off gets an F.
And Clint R continues his endless, futile attempt to manipulate the blog:
” CO2’s 15μ photons can NOT raise the temperature of Earth’s average 288K surface. ”
*
No one – except Clint R himself who is the one and only source of that nonsense – did ever claim it. No one!
*
Of special interest is once more that like all pseudoskeptics, Clint R always refers to CO2 ‘s 15µ photons but intentionally omits the fact that H2O is responsible for WAY more backradiation than CO2.
Why doesn’t he ask for example:
” IR frequency range of H2O’s absorption/re-emission in microns ”
*
But he never will.
*
And anyway, anyone except dense people understands that NOAA’s primitive, simple-minded explanations for the ‘grand public’ like
” CO2 traps heat”
or
” Backradiation warms the surface ”
don’t have anything to do with the reality that any gas molecule intercepting IR photons emitted by Earth
– reemits half of them back
– remeits the second half at a temperature much lower than the surface, hence with an energy lower than the photons reaching outer space directly.
*
But slow-witted people love simple explanations (“Keep It Simple, Stupid!”); no wonder they fall into traps like below:
” Anomalies higher than the baseline mean warmer temperatures, those lower than the baseline mean lower ones ”
what leads them to the ridiculous allegation that NOAA creates ‘fudged data’:
https://drive.google.com/file/d/1N9S1pa_aqJFqtP9HpoeYcZ79zZZtv3Sm/view
OMG…
Bindi, you’ve become as much a cult kid as the rest. A responsible adult would know not to make false accusations. You make false accusations because you have no science. You’re a complete fraud.
CO2’s 15μ photons can NOT raise the temperature of Earth’s average 288K surface. That’s a well know fact in “hard science”. You continually confuse your “cult science” with “hard science”.
I’ve mentioned H2O many times. Your cult hates it when I bring up the water vapor inserted into the upper atmosphere by Hunga-Tonga. Water vapor, because it can emit a large number of wavelengths, can do what CO2 can’t. Your cult doesn’t like that.
You’re a fraud. That’s why you have no viable model for “orbiting without spin”. That’s why you’ve been unable to answer any of the physics problems I’ve given you. Even the basics are way over your head. You believe making unreadable graphs is “science”. I could teach a high school kid how to make quality graphs in less than an hour!
You’re an empty vessel relying on cult tactics because you understand none of this.
Now, make some more false accusations to further prove me right.
Norman
Why did you feel the need to answer?
Better would have been to let Robertson reply himself with his usual nonsense.
Trump, who has long promised to drain the swamp in Washington, has literally created one.
He gave his fiend and donor a NO BID contract:
“Federal contracting records show that firm’s ultimate owner is the J.J. Cafaro Investment Trust, led by John J. Cafaro, a donor to Mr. Trump and a neighbor to Mar-a-Lago, the president’s private club in Florida.”
The Contract was for installing water cleaning devices to Reflecting Pool which has led to it turning green with a major algae bloom.
” We thank President Trump for fixing the Reflecting Pool for good. ”
Yeah.
bob d…”Any energy source can power a refrigeration unit, for example The SSN Narwhal had steam driven air conditioners. The special gas being good ol H2O”.
***
Yes, Bob, but the process is much the same. High pressure steam from a nuclear reactor is used to create a near vacuum in a container containing water. Due to the near vacuum conditions, the water boils at a much lower temperature and the latent heat of evapouration is drawn from the area requiring cooling.
Simply another use of the Ideal Gas Law re manipulation of pressure, volume, and temperature. Other systems use lithium bromide to cool water. Same old, same old…Ideal Gas Law stuff.
In other words, heat cannot be transferred by its own means from cold to hot, and even with such transfers, it’s not a transfer cold to hot. There needs to be an intermediate stage in which the temperature is artificially raised to a higher level so it can be transferred hot to cold.
Gordon,
Quote the whole law.
Not just the first half.
willard…
“Considering the natural tendency that heat always passes from a warmer to a colder body for eliminating the temperature difference, Clausius presented a well-known proposition that “Heat can never pass from a colder to a warmer body without some other change, connected therewith, occurring at the same time”. Unfortunately, it met with much opposition [15]. Muller [22] stated that “this statement, suggestive though it is, has often been criticized as vague”. And Muller believed that Clausius himself did not also feel entirely satisfied with this proposition for the reason of it lacking an unequivocal mathematic description [22]”.
***
This is not intended as a critique of Willard. The information he presents is sound on the face of it. However, the criticism presented by Muller of Clausius is way off base.
Since the Clausius definition of the 2nd law came out at the same time as the others, circa 1850, the 2nd law was not a well-known proposition. Carnot did not present such a law, in fact, Clausius critiqued the Carnot assumption that no heat losses occurred in such transfers in a heat engine. In fact, no other scientists of the time who offered definitions of the 2nd law offered such a detailed explanation as did Clausius.
The work done by Clausius on the 2nd law and entropy is classic and has never been negated.
I don’t know who this Muller is supposed to be but I don’t see his name offered in relation to the 2nd law. If anyone reads the Clausius explanation of the 2nd law there is nothing vague about it. Clausius lays it out precisely using the Ideal Gas Law to accurately map the steam engine processes re pressure, temperature, and volume.
Clausius did that by holding one variable constant then varying the other two. By carefully following the steam engine cycle to completion he demonstrated clearly why that process cannot be reversed, hence allowing a heat transfer cold to hot.
It seems to me that critics of Clausius have never read and understood the work he did in his mechanical theory of heat documents. I don’t think the criticism of Muller is justified on the basis that it is vague. The 2nd law as presented by Clausius applies to all energy forms in that none of them can be transferred from a low potential energy state to a high potential energy state by their own means. Ergo, if the Clausius definition is vague then all energy references are equally vague.
There is a certain snobbery among certain scientists in that they think any scientific observation bereft of a mathematical explanation is invalid. Faraday was sidelined for that reason. Although his work on magnetism is unequaled subjectively, it was dismissed by the snobs of the day as unacceptable due to the lack of in-depth math presented. In fact, Maxwell got the credit for Faraday’s work by presenting it mathematically to the liking of the snobs.
Pardon me for being a “snob” but I must insist that photons do not have temperatures.
then how do you explain that when a massive number of photons are emitted from a surface that the surface cools? The meaning is clear, if you divide the number of degrees cooling by the number of photons emitted then each photon must represent a fraction of the number of degrees of temperature change.
The point is, electrons emit photons as they lose KE upon descent from a higher orbital energy level. The loss of KE is a loss of heat in the overall mass, hence a reduction in temperature.
The reason it is silly to talk about an individual photon having a temperature is that we cannot identify where a photon is never mind its temperature. That is, we cannot measure anything related to an individual photon. That’s because the electron emitting the photon cannot be located precisely. That’s why they talk about temperature being an average KE of all atoms in a mass. Presuming that is, that the mass has a uniform heat distribution throughout.
Now, try to be a good student and try responding scientifically. I don’t hate you or intend any venting of my spleen toward you, it’s just that you insist on smart-assed answers.
Pardon me for being a “smartass”and a snob but, as all schoolboys know:
Photon energy E is the discrete amount of energy carried by a single photon, which is directly proportional to the electromagnetic wave’s frequency f and inversely proportional to its wavelength. It is calculated using Planck’s constant h.
E = h . f
As we can all see, there is no mention of temperature.
If a surface cools it is due to a loss of KE carried away by emitted photons. The temperature of the surface determines the NUMBER of photons being emitted at all wavelengths, NOT THEIR (non-existent) INDIVIDUAL TEMPERATURES.
Thank you for your attention to this matter.
Gordon,
I thought you claimed electronics experience.
Photomultipliers, Geiger counters, and scintillation counters just to name a few things that can detect individual photons.
Then there is PET, or postron emmision tomography, where both the location of an electron positron annihilation event and the location of the two photons produced when they hit the detector are found.
Tell the truth, you never passed the required physics classes in an engineering program.
Let’s repeat the relevant bit:
Muller did not criticize Clausius.
Clausius criticized Clausius.
eldrosion…”As a result, some of the energy that would otherwise escape into space is redirected downward. This reduces the rate at which the surface loses heat and making the surface warmer than it would be without greenhouse gases”.
***
You need to explain how IR back-radiated from CO2 affects the rate of heat loss at the surface. There is no known mechanism that can explain such an action.
Heat is dissipated at the surface at the instant the IR is created. To elabourate, heat is converted to IR, and is lost.
The heat is well gone before any IR is back-radiated. To understand that you need to understand basic quantum theory as proposed by Bohr in 1913. As he explained it, and it is still true, when electrons in surface atoms drop to a lower orbital energy level, they must give up kinetic energy. That is done by converting the KE to IR, an entirely different form of energy than heat.
The loss of KE represents a lost off heat and we all know that. When a surface radiates IR it is tantamount to a loss of heat since KE in atoms and electrons represents heat. It is not possible to lose that heat twice due to back-radiated IR. Surely anyone can see that heat lost by the initial production of IR is no longer related to the heat that produced the IR.
Some argue that heat loss by individual atoms/electrons is silly but overall, in an entire mass, the sum of KE losses of each electron in the atoms of a mass, represents an overall loss of heat.
Once that heat is dissipated at a surface, no amount of back-radiation from CO2 or WV in the atmosphere can affect the initial rate of heat loss. The only element affecting heat loss rate is the temperature difference between the atmosphere and the surface.
Since nitrogen and oxygen make up 99% of the atmosphere it is the temperature of those two elements that governs the rate of heat loss. Neither CO2 nor water vapour have a significant say in the matter. Since the atmosphere and surface are essentially in thermal equilibrium the surface should retain a lot more heat and Lindzen estimated that without the convection due to heated air rising, the surface temperature could rise to 70C.
That’s what saves us, the amount of heat dissipated by air heated by the surface that rises, being replaced by cooler air from above. GHGs have nothing to do with this process with the exception that WV in the Tropics may play a bit of a role. Still, it is N2 and O2 that control the heat dissipation rate.
Besides the total amount of IR absorbed by so-called GHGs is a trivial 10% at best, the rest being radiated to space.
Norman called me on that, claiming I did not understand the integration over a range of IR frequencies where the amplitudes are in milliwatts. I have already pointed out that the integration comes to about 28 watts. Google AI claims the total IR radiation is about 400 watts and 400/28 = 14%. That is a generous figure and the amount trapped by IR is closer to 10 watts.
And the 400 watts is bs anyway since that means more heat is being dissipated than the Sun can deliver. Ergo, we are arguing apples and oranges since the theory is nonsense.
Anyone here arguing on behalf of climate alarmists is using pseudo-science as the basis of their arguments. In all the years I have been posting here I have yet to see an alarmist argument that can be backed by hard science.
Gordon Robertson
You are quite wrong in your understanding of electron energy!! I do not know where you come up with these ideas. Do you just make them up or are you getting them from Crackpot blogs???
You keep claiming an electron gains kinetic energy when it absorbs EMR. This is a totally fictitious fabrication. All real science clearly states the electron loses Kinetic Energy but gains potential energy as it moves to a higher orbital. Similar to what you can understand with gravity. Mercury moves very fast around the Sun. Has a lot of kinetic energy. If you add energy to Mercury it will mover further away from the Sun. It will lose kinetic energy but gain potential energy. This is well established physics that goes totally against your made up version.
Can you be honest with me?? Why do you have this need to just make stuff up? You know it is not true but act as it is. I would like to understand the motivation of all the skeptics that post made up physics and act like some type of experts. I can easily look up the real physics and see your versions are wrong and actually bad. You, Clint R, Bill Hunter, stephen p anderson, DREMT all post bad science that is easy to find evidence it is bad. I post links many times showing the crackpot physics is not correct but it does not alter any of your beliefs. I am attempting to understand the way your mind works. You are fine to post false information and reject valid science. Not once or get something wrong now and then. These false made up physics is posted for year after year after year. No amount of actual evidence, or facts ever show any sign of changing your minds’. I wonder what is the structure of a mind that makes up this false version of reality and sticks to it like a super glue. Help me out here. Inquiring minds want to know what makes your mind work in that fashion. Science motivation is to find the truth and most accurate description of reality possible. They fail a lot but do not continue on paths that are shown to be false. Your mind works different. It is not seeking truth so what is it doing? What is it trying to accomplish on this blog??
There you go again, Norman. Making false accusations to cover up for your lack of understanding.
You claim that I provide “bad science that is easy to find evidence it is bad”. So, what “bad science” have I provided?
And since you can’t do that, you can give me your “viable model of orbiting without spin”.
Let me guess: You don’t have either?
eldrosion…”Earth continuously emits IR to space, and that is the main way it loses energy”.
***
Sorry to disappoint but the surface loses a lot more heat to conduction/convection. That’s because there are something like 10^28 air molecules touching the surface per square metre and each molecule absorbs heat from the surface. That heated air then rises via convection and the cycle repeats endlessly.
That is, as long as the sun can reach the surface. In winter, in the Arctic and Antarctic, the surface is much colder than the atmosphere and does not warm it. In fact, the air gets warmer up to a kilometre or so since the Sun is still warming the air at that altitude, making it warmer than surface air. So, the lapse rate is said to be negative up to that point, then it gets positive again.
Shula, who has done work with the Pirani gauge pointed out that conduction/convection is 260 times more efficient than radiation at cooling the surface. As I have tried to point out, heat dissipated from the surface is dissipated further as it rises, making it far less necessary for heat to be dissipated that is injected by solar energy.
To me, that is the real GHE. The atmosphere is warmed by solar energy far more than it should be since not all energy input is delivered back to space. The Earth retains heat in the atmosphere and oceans an actually dissipates a lot of it as the air rises when heated by the surface.
Gordon Robertson
The planet as a whole only loses energy through a net transfer to space. Radiation is the only form of energy transfer that can travel through a vacuum, so it is the only way energy can leave Earth.
Convection move energy within the atmosphere, and condition exchanges energy between the surface and the lower atmosphere.
Neither of these removes energy from Earth’s system. They just redistribute it internally.
Convection moves energy within the atmosphere, and conduction exchanges energy between the surface and the lower atmosphere.
Eldrosion,
Conduction doesn’t exchange energy. Conduction transfers energy from the surface to the atmosphere flowing by and pressing up against it.
Heat is transferred from the surface by conduction, convection and latent heat mostly, very little radiant heat until the effective emission height which is about halfway up the troposphere according to Nikolov. The parcels of air rise and are attenuated adiabatically by pressure volume work. The heat that does reach mid troposphere can then be transmitted radiantly to space. Then radiant heat transfer becomes dominant and creates OLR. The OLR is what we see in these satellite images. It isn’t surface radiation.
Eldrosion,
Also, there is no 33K Greenhouse effect. If you look at the lapse rate from the surface to the top of the troposphere, it is a lot more than 33K. It is all due to pressure. If there were no greenhouse gases in the atmosphere it would have zero effect on the dry lapse rate. It would have an effect on the moist lapse rate due to water’s specific heat capacity.
stephen, conduction transfers energy from the surface to the atmosphere during the day, in general, and transfers energy from the atmosphere to the surface at night, generally. The ground is a much more efficient emitter of radiation than the atmosphere (being able to emit at a far wider spectrum), so at night the surface gets cooler than the atmosphere just above it in short order.
Barry,
At night, why is there a temperature difference between the base and summit of Mauna Loa?
This is the dumbest of all dumb statements ever written on this blog, and you have a lot of competition for that prize. Our friend stephen p anderson wrote this all by himself:
“Conduction doesn’t exchange energy. Conduction transfers energy from the surface to the atmosphere flowing by and pressing up against it.
Heat is transferred from the surface by conduction, convection and latent heat mostly, very little radiant heat until the effective emission height which is about halfway up the troposphere according to Nikolov. The parcels of air rise and are attenuated adiabatically by pressure volume work. The heat that does reach mid troposphere can then be transmitted radiantly to space. Then radiant heat transfer becomes dominant and creates OLR. The OLR is what we see in these satellite images. It isn’t surface radiation.”
If you don’t like the criticism, then don’t write dumb statements.
Barry,
You’re from Australia, so you should know when you go out in the desert at night and it gets cold, you want to lay down on the ground to warm up. Also, out in the ocean, the ocean warms the atmosphere at night. And there is a lapse rate at night. That means that one nm above the surface the lapse rate starts. One nm above the surface it is conducting heat from the surface. Not really sure where you get these things, but I guess it’s necessary for you to believe your greenhouse propaganda
stephen p anderson
Why don’t you work to earn another “A” and do some real research on topics you post about. The lapse rate exists because the surface is heated much more by the Sun than the air above. This is like any heating process you studied when you got your “A” in thermodynamics.
Heat gradient established across a body from the hot side to the cold side.
https://www.engineeringtoolbox.com/conductive-heat-transfer-d_428.html
So the air above the heated ground will develop a natural lapse rate. But here is where your crackpot pressure idea fails completely. (Of course rational people on this blog already know that logic will not change your mindstate).
https://www.weather.gov/source/zhu/ZHU_Training_Page/winds/nighttime_influences/Nighttime_Influences.htm
At night an inversion forms in inverse of daytime lapse rate. The air above is warmer than the air below. Primarily because of radiant heat transfer through the atmospheric window. If your crackpot belief is correct than pressure should keep the lapse rate. It somehow fails to do this.
GHE established by radiant energy works on multiple levels of science. You tend to gravitate toward crackpots but for some reason will believe multiple scientists working from various fields are all wrong but a handful of crackpots know more than all the others.
You are similar to Gordon Robertson in some ways. He accepts the total credibility of a crackpot Lanka on Measles virus and rejects all the other experts in the field that state opposite of Lanka. Thousands of highly educated experts that continue to study and take in new information are wrong or dishonest while a handful of crackpots have all the answers and you blindly accept whatever BS they feed you with and reject all other evidence showing the flaws to their ideas.
stephen,
I’ve slept in the desert, around Alice Springs in the middle of the country and Tennant Creek 500km North.
Near Alice I used a swag to keep from going cold at night. You need a protective layer to avoid hypothermia when the ground temp drops down from the intense heat of the day. Takes an hour or so, depending on the kind of ground.
In Tennant Creek I slept in a hammock all night under the stars in boxer shorts. Because the air cools a lot slower than the ground I could do that. If I’d slept on the ground I’d have been shivering by midnight.
More info on air/ground conduction here.
“During the day, sunlight heats the ground, which in turn heats the air directly above it via conduction. At night, the ground cools and the heat flows from the warmer air directly above to the cooler ground via conduction.”
https://scied.ucar.edu/learning-zone/earth-system/conduction
Stop being a recalcitrant dummy and google stuff before you spout.
Changing the subject doesn’t make you smarter, mate. Accept the correction first, or else prove yourself a waste of bandwidth.
Norman,
It isn’t my crackpot idea although I would love to take credit. The crackpot idea can be attributed to Lord Kelvin. He derived the lapse rate in the 19th century. However, I had a good thermodynamics teacher who understood the role of differential equations in thermodynamics and physics. I made A’s in differential calculus too.
Barry,
You’re a big believer in that back radiation, aren’t you? Does the atmosphere warm the ocean at night?
Barry,
I’m not changing the subject. By what process does the air warm the Earth? Does the air warm the ocean?
So, Barry accuses me of changing the subject, but I ask him why there is a lapse rate at night at Mauna Loa. If the temperature of the atmosphere decreases with altitude at night at Mauna Loa, then the air can’t be warming the ground. Heat flows from hot to cold. It doesn’t flow in two directions.
This is the dumbest of all dumb statements ever written on this blog, and you have a lot of competition for that prize. Our friend stephen p anderson wrote this all by himself:
You need to read some of your statements. You accept GHE nonsense hook, line and sinker, then repeat them.
stephe, you senile? Let me help you remember.
stephen said: “Conduction doesn’t exchange energy. Conduction transfers energy from the surface to the atmosphere flowing by and pressing up against it.”
barry said in reply: “stephen, conduction transfers energy from the surface to the atmosphere during the day, in general, and transfers energy from the atmosphere to the surface at night”
stephen changed the subject: “Barry, At night, why is there a temperature difference between the base and summit of Mauna Loa?”
Then in a later comment:
stephen said: “You’re from Australia, so you should know when you go out in the desert at night and it gets cold, you want to lay down on the ground to warm up… And there is a lapse rate at night. That means that one nm above the surface the lapse rate starts. One nm above the surface it is conducting heat from the surface. Not really sure where you get these things, but I guess it’s necessary for you to believe your greenhouse propaganda”
So I replied I’d slept in the Australian desert and lying on the ground is a bad idea, but you can get warmth from the air – opposite to what you said. I’ve lived it. Then I provided a reference and returned the snark you offered after I’d been neutral. The silver rule applies.
” ‘During the day, sunlight heats the ground, which in turn heats the air directly above it via conduction. At night, the ground cools and the heat flows from the warmer air directly above to the cooler ground via conduction.’
https://scied.ucar.edu/learning-zone/earth-system/conduction
Stop being a recalcitrant dummy and google stuff before you spout.
Changing the subject doesn’t make you smarter, mate. Accept the correction first, or else prove yourself a waste of bandwidth.”
So stephen, you’ve proved you’re a waste of bandwidth. And you’re still a recalcitrant dummy. All you had to do was admit you were wrong about surface/atmosphere conduction being a one way process and you would have earned a litte credit for being an honest player.
There’s nothing wrong with not knowing something, but everything wrong with failing to admit it when shown.
Stephen,
I believe you know that weather happens in the atmosphere.
When there is an extreme heat wave, as there is in France right now, it is the atmosphere that is reaching 108 F.
And it warms everything it comes in contact with, ground, people, structures.
It us often caused by a high pressure dome, with air getting heated as it subsides.
Barry,
No, the atmosphere doesn’t warm the surface, even at night. There is no radiative flux from the atmosphere to the surface at night. The lapse rate increases with altitude, even at night, heat doesn’t flow both ways.
stephen,
The link to the text clearly stating conduction transfers heat from the atmosphere to the surface at night is from the University Corporation for Atmospheric Research (UCAR), the educational arm of the National Center for Atmospheric Research (NCAR). The text comes from their K-12 educational material.
The fact you deny the information they provide says everything. You are not just an AGW denier, you are a science denier. If it interferes even slightly with you’re narrative, you reject it.
This fact of diurnal inverted conduction does not even threaten your views on the GHE, but you are so partisan in your views, so automatically contrary, that you wind up being more ignorant than a 6th grader, whom the page at the link is targeted towards.
You’re not just ignorant, you’re determinedly ignorant.
Talking with determinedly ignorant people is utterly futile. Bye bye.
Barry,
Why don’t you post UCAR’s explanation of the lapse rate?
“A sphere of 255K emits 240W/m2 only if there is a constant 240W/m2 flow of heat from inner layers towards the surface.”
There is no material emitting that much.
https://www.engineeringtoolbox.com/emissivity-coefficients-d_447.html
It seems that Vournas does not know the difference between
– emissivity (a unitless factor)
and
– radiant flux density (power per area, expressed in Watt/m²).
*
Emissivity is a material’s effectiveness in emitting thermal radiation (infrared energy) compared to a perfect emitter, called a blackbody. It is represented by the symbol ε and is measured on a scale from 0 (perfect reflector) to 1 (perfect emitter)
*
Radiant flux density is the amount of radiant power (energy per unit time) passing through or hitting a specific surface area. Measured in Watts per square meter (W/m²), it quantifies how concentrated electromagnetic, thermal, or optical radiation is at any given location
Thank you, Bindidon, for clarification.
“It seems that Vournas does not know the difference between
– emissivity (a unitless factor)
and
– radiant flux density (power per area, expressed in Watt/m²).
*
Emissivity is a material’s effectiveness in emitting thermal radiation (infrared energy) compared to a perfect emitter, called a blackbody. It is represented by the symbol ε and is measured on a scale from 0 (perfect reflector) to 1 (perfect emitter)
*
Radiant flux density is the amount of radiant power (energy per unit time) passing through or hitting a specific surface area. Measured in Watts per square meter (W/m²), it quantifies how concentrated electromagnetic, thermal, or optical radiation is at any given location.”
–
–
It seems that Bindidon does not know there is not a material emitting 240W/m² at 255K.
–
https://www.cristos-vournas.com
” … there is not a material emitting 240W/m² at 255K. ”
1. Any real material with a high emissivity (close to 1.0) will emit almost exactly 239.76 W/m² (commonly rounded to 240 W/m²) at 255 K according to the Stefan-Boltzmann Law.
2. Despite its average emissivity of only up to 0.85, the atmosphere nevertheless emits 240 W/m² of thermal radiation to outer space from an altitude where the air temperature is approximately 255 K (somewhere in the troposphere at about 500 hPa, between 5 and 6 km above ground).
Ευχαριστώ πολύ που μάθατε πριν γράψετε!
Despite its average emissivity of only up to 0.85, the atmosphere nevertheless emits 240 W/m² of thermal radiation to outer space from an altitude where the air temperature is approximately 255 K (somewhere in the troposphere at about 500 hPa, between 5 and 6 km above ground).
This is Nikolov’s effective emission height based on his modified SB equation.
Should water at 255K (-18C) emit 240 W/m² ? What law says that?
–
–
240W/m²
–
–
https://www.cristos-vournas.com
There is not any Stefan-Boltzmann radiative energy absorption law.
The planetary effective temperature equation is a pure mathematical abstraction.
https://www.cristos-vournas.com
Christos,
If you look at the lapse rate approximately 6.5K/km wouldn’t that give you a temperature of approximately 255K? The effective emission height is about 5500 meters.
Stephen,
“If you look at the lapse rate approximately 6.5K/km wouldn’t that give you a temperature of approximately 255K? The effective emission height is about 5500 meters.”
Earth does not emit uniformly. Earth emits approximatelly from ~15 W/m² at lowest to ~50 W/m² at highest, and those might be overestimated numbers.
The instantaneous at the very instance of solar energy incidence IR emission cannot be considered as absorbed heat.
–
https://www.cristos-vournas.com
Vournas, you behave here like an incompetent, boastful braggart.
1. ” Should water at 255K (-18C) emit 240 W/m² ? What law says that? ”
*
No one claims that, Vournas. No law says that.
2. ” There is not any Stefan-Boltzmann radiative energy absorption law. ”
*
I repeat what I wrote above:
” Despite its average emissivity of only up to 0.85, the atmosphere nevertheless emits 240 W/m² of thermal radiation to outer space from an altitude where the air temperature is approximately 255 K (somewhere in the troposphere at about 500 hPa, between 5 and 6 km above ground).
*
Stefan-Boltzmann’s Emission Law: The power radiated by a surface is defined as
P = ε σ A T^4
ε: emissivity of the surface
σ: Stefan-Boltzmann constant
A: its area
T: its temperature
*
3. ” The planetary effective temperature equation is a pure mathematical abstraction. ”
*
Never would you ever be able to scientifically contradict it.
All what you were able to do until now was to invent your ridiculous Φ nonsense which has been debunked many times in the past – especially at Judith Curry’s Climate Etc blog.
*
4. ” Earth does not emit uniformly. Earth emits approximatelly from ~15 W/m² at lowest to ~50 W/m² at highest, and those might be overestimated numbers. ”
This is one of the most stupid allegations I have read from you.
Do you think tah ALL stations WORLDWIDE measuring IR radiation from both the surface and from the atmosphere give wrong data?
https://drive.google.com/file/d/10oZEK21bfTnPIFCdLf-4OTAeSQR7UOGh/view
If you think so, then you are exactly as ignorant as Robertson, Clint R, Anderson and all the people thinking like them.
Thank you, Bindidon, for your response.
It is amazing how much skeptical you still are after all these long years of scientific reasoning!
–
https://www.cristos-vournas.com
You see the immediate IR emission, Bindidon. don’t you?
https://drive.google.com/file/d/10oZEK21bfTnPIFCdLf-4OTAeSQR7UOGh/view
I read above, without any surprise:
” Heat is transferred from the surface by conduction, convection and latent heat mostly, very little radiant heat until the effective emission height which is about halfway up the troposphere according to Nikolov. ”
*
It’s hard to believe that people can be so incredibly brazen that they intentionally ignore facts known since decades.
*
Here is the monthly average of the data measured since 2000 by seven SURFRAD stations in the US:
https://drive.google.com/file/d/1jATtF_nsFH91UVKLQbxs4yldxYIc4wsd/view
This monthly data comes from averaging hourly data measured by each station, for example Fort Peck, Montana on 2025, July 1:
https://drive.google.com/file/d/10oZEK21bfTnPIFCdLf-4OTAeSQR7UOGh/view
If I well remember, Fort Peck started working in the 1990s.
*
Here is similar data measured by three stations associated to the Baseline Surface Radiation Network (BSRN):
https://drive.google.com/file/d/103bWbIPX7MwZwC42hfr15mcsO5Bu6c6h/view
*
The network’s head page:
https://dataportals.pangaea.de/bsrn/?q=LR0100
*
One must be completely dense to ignore such things.
Source of the monthly SURFRAD data for the single stations
https://gml.noaa.gov/aftp/data/radiation/surfrad/averages/
Bindidon,
I think they can measure SW solar radiation (downwelling) with a pyranometer. I think there are a lot of assumptions with the LW upwelling. I think it is a very small percent of the total surface flux.
It is kind of like the satellite images that are routinely posted here that are supposedly evidence of CO2 absorp-tion from the surface. Not.
Also, that’s not Nikolov. I don’t want to speak for him. In his paper he describes the surface flux as conductive, convective and radiative. I believe the radiative part is very small and the more we look into SURFRAD, the more assumptions we will find. My opinion.
Anderson
” I think… ”
” I think… ”
*
Typical pseuso-skeptic behavior: To doubt, discredit and deny instead of technically and scientifically contradicting.
This is incredible. You lack any technical let alone scientific knowledge and experience but allow yourself to put anything in question what does not fit your personal egocentric narrative.
You are not even able to post a link to an article scientifically disproving the SURFRAD and BSRN results!
*
” I believe the radiative part is very small and the more we look into SURFRAD, the more assumptions we will find. My opinion. ”
Belief, belief… that’s antiscience at its best.
Not your ‘opinion’ matters: only knowledge does.
You are a perfect duplicate of Robertson and Clint R – two posters who doubt everything and endlessly fill the blog with their unproven allegations.
*
Try to learn about how pyrgeometers and Fourier-Transform interferometers do their work – devices which are in use since decades – instead of arrogantly talking about ‘assumptions’.
n France for example, pyrgeometers are used – among several other contexts – even for the early detection of radiation frost on vines in high-value cultivation areas producing top-tier Burgundies, Bordeaux and Champagnes.
” It is kind of like the satellite images that are routinely posted here that are supposedly evidence of CO2 absorp-tion from the surface. Not. ”
*
This above best shows your paranoid CO2 Derangement Syndrome, and also how ignorant and devious you behave on this blog.
Never did I publish here any info intentionally pushing CO2.
I merely pöosted links to an old paper written by Joseph W. Chamberlain and another one written by the French scientist Jean-Louis Dufresne.
The contrary is the case: while people like you, Clint R, Robertson and a few other ‘specialist’s always reduce effects like backradiation to CO2 instead of widening that discussion up to its main cause, namely H2O, I never got tired to explain that H2O is the major gas with regard to IR interception in the atmosphere.
*
Recently, I even published numbers showing that CO2 accounts for maximally 15-25 % of the backradiation.
I also contradicted bloody claims that backradiation would warm the surface, what it does not at all.
*
And especially info about downwelling IR (which of course come from surface stations and not from satellites-borne devices) I never published with the intention you and others woefully insinuate.
Bindidon,
A heat flux sensor cannot differentiate between the different types of flux. You have to tell it what the flux is. Big problem with your SURFRAD argument. A lot of assuming going on.
I do acknowledge that you often point out that water absorbs IR and is in much greater abundance in the atmosphere so that if there is a greenhouse effect, it is mostly due to water.
” Big problem with your SURFRAD argument. A lot of assuming going on. ”
Why do you stalk me all the time with your imbecile allegations, Anderson, instead of informing yourself?
You are really even dumber and more ignorant than Robertson and Clint R taken together.
Are you even too lazy to look at what a SURFRAD station REALLY is and what kind of measurement devices it hosts?
Are you too dumb to search yourself for the huge difference between a heat flux sensor and a pyrgeometer?
*
There is only one BIG problem here, Anderson, and that is your ignorance due to your stubborn, opinionated behavior which keeps you assuming everything instead of learning.
*
No wonder by the way that the arrogant, incompetent twat who insulted me as ‘dense’ (and also woefully denigrated barry) 100 % endorsed you as ‘our friend stephen p anderson’.
You two perfectly fit together with your total lack of technical skills and scientific knowledge.
*
Again: Stop finally stalking me, you are wasting my precious time.
Bindidon,
OK, I read about a pyrgeometer. It is still a heat flux sensor. It is a thermopile, supposedly sensitive to IR energy. Other heat is still going to affect it. The lapse rate is a big problem for GHT, so it makes me question everything. Greenhouse gases are 0.4% of the atmosphere. The atmosphere is pressing against the surface. It makes sense that most of the heat is removed by conduction, convection, latent heat and not radiation until the atmosphere is less dense. The whole energy budget model is based on assumptions.
People like Anderson are absolutely incredible.
They don’t have even the least bit of competence to talk about devices like pyrgeometers but ‘know’ that:
” It is a thermopile, supposedly sensitive to IR energy. Other heat is still going to affect it. ”
*
He would never be able to write a valuable technical paper proving his beliefs.
*
” The whole energy budget model is based on assumptions. ”
Let alone would he be able to scientifically prove such absolutely superficial allegation.
Blindidon,
Explain every single flux in the NASA energy budget and where that number came from.
Anderson
” Explain every single flux in the NASA energy budget and where that number came from. ”
*
1. You can name call me ‘Blindidon’ as long as you want: you are way, way more ignorant than I am.
*
2. Are you really dumb enough to believe I would waste my time in infoming you? You would deny and discredit anything I would communicate.
One exception: the 240 W/m² observed by satellite-borne interferometers at TOA since 1979:
https://archive.data.noaa.gov/climatedatarecords#UMD_ESSIC/OLR_CDR/Daily/OLR-D-CDR_01B-21/
Unlike you who are at best able to insinuate about ‘assumptions’, I processed that data to understand from where the number came from:
https://drive.google.com/file/d/1oFCUviGRTwTpCrFWQPDFopFJI2PTGhMo/view
The red line is the average over the years.
*
But people like you are too obstinated to accept what they either dislike or don’t understand.
Search yourself, Anderson.
*
Bindi, I see you’re still confused about the “OLR”. As I’ve explained before they do NOT actually measure 240 W/m². That value is obtained through a maze of embarrassing manipulations, based on the fraud of an imaginary sphere.
I know this is all over your head, but let me present some things for you to think about.
How does Earth’s atmosphere emit 342 W/m² back to the surface while also emitting 240 W/m² to space?
If Earth’s surface is emitting 390 W/m² to the atmosphere, but the atmosphere only emits 240 W/m² to space, then you’ve got the atmosphere gaining 150 W/m².
Over a year, that results in a gain of 2.4 (10)^24 Joules. And of course, it does that every year, in your cult’s “science”.
See why I like to keep things simple? That way even kids can understand.
So if you’re not ashamed of your ignorance yet, I can mention your inability to describe a viable model of “orbiting without spin”….
My reply to Clint R’s incompetent, unscientific rambling
A. ” So if you’re not ashamed of your ignorance yet, I can mention your inability to describe a viable model of “orbiting without spin” “.
*
No one knows why Clint R is so deeply obsessed by his subcutaneous guess that the Moon does not spin about its axis, that he can’t stop writing this nonsensical crap.
His choice, however. Let’s watch his further nonsense…
*
B. “As I’ve explained before they do NOT actually measure 240 W/m². That value is obtained through a maze of embarrassing manipulations, based on the fraud of an imaginary sphere. ”
No one knows where Clint R got this 100% personal – and, as always, completely unsubstantiated by science- absolutely absurd allegation.
Let’s have a look at what current information sources tell us: after all, they should be at least trustworthy as is Clint R’s antiscientific blah blah, shouldn’t they?
Here it is:
” Polar-orbiting infrared (IR) observations are transformed into global Outgoing Longwave Radiation (OLR) fluxes like 240 W/m² by converting localized radiance or brightness temperatures into broadband radiative fluxes using multispectral regression models and radiative transfer physics.
The transformation from raw sensor data to OLR (measured in W/m²) follows these core steps:
1. Polar-orbiting satellites like NOAA-21 or Metop (carrying instruments like CrIS or IASI) capture spectral radiance (energy per unit area, solid angle, and wavelength). Using the inverse Planck function, these spectral radiances are converted into equivalent blackbody temperatures, known as brightness temperatures.
2. Because satellite instruments measure specific channels (narrow wavelengths) rather than the entire infrared spectrum, algorithms apply multispectral regression models. The specific algorithms rely on the correlation between certain channel temperatures (such as water vapor and window channels) to estimate the total emission over the full infrared spectrum (4 μm to 100 μm).
3. Satellites view the Earth at various angles (nadir to limb). Mathematical limb-darkening corrections are applied to account for the longer path length through the atmosphere at the edges of the sensor’s swath compared to directly below (nadir). This calculates the total upward-directed flux hemispheric emission.
4. Instantaneous local flux estimates are averaged over daily, weekly, or monthly timeframes. By integrating this data across all latitudes and longitudes, scientists arrive at the planetary average of approximately 240 W/m², which balances the energy Earth absorbs from the Sun. ”
*
Don’t imagine that the “360-degree denier” Clint R would ever be capable of refuting all of this on technical – let alone scientific – grounds!
He is not even able to post a link to a document authored by trustworthy individuals that provides the very refutation anyone quite rightly expects.
*
C. Now let’s come finally to Clint R’s most stupid nonsense:
” How does Earth’s atmosphere emit 342 W/m² back to the surface while also emitting 240 W/m² to space?
If Earth’s surface is emitting 390 W/m² to the atmosphere, but the atmosphere only emits 240 W/m² to space, then you’ve got the atmosphere gaining 150 W/m². ”
*
Ah well ah well. A few lines later, ignoramus Clint R writes:
” See why I like to keep things simple? That way even kids can understand. ”
Yeah.
*
The reality, however is that he is not even able to accurately read a simple chart:
https://i.postimg.cc/8zXQPdTj/Energy-Budget.png
which clearly explains that while the surface emits 390 W/m² of which 378 are absorbed by the atmosphere, the latter conversely emits 333 of them back to the surface.
*
Now I won’t hold my breath, as Clint R always writes, and won’t wonder that he replies some nonsense like:
” That value is obtained through a maze of embarrassing manipulations, based on the fraud of an imaginary sphere. ”
*
However, when you dowmload hourly data from BSRN, the Baseline Surface Radiation Network for various stations over various years, you see that while
– the Alert station (Canada, 82.5 N) measures on a yearly average 229 W/m² and that located at the South Pole (89.9 S) still 113,
– stations in the Tropics like Selegua (Mexico, 15 N) show 388 W/m²
and
– stations near the Equator like Kwajalein measure over a year 388 W/m² as well, and Nauru even 413.
Lauder (southern end of New Zealand, 45 S) still measures 306 W/m² on a yearly average.
*
Thus, except one ticks like the Anderson boy who insinuates without any proof that pyrgeometers measuring longwave radiation might be highly questionable, the 333 W/m² in the Energy Budget can’t be that wrong.
Bindi returns to prove me right, again!
I stated:
Bindi, I see you’re still confused about the “OLR”. As I’ve explained before they do NOT actually measure 240 W/m². That value is obtained through a maze of embarrassing manipulations, based on the fraud of an imaginary sphere.
So Bindi proves me right with:
“Polar-orbiting infrared (IR) observations are transformed into global Outgoing Longwave Radiation (OLR) fluxes like 240 W/m² by converting localized radiance or brightness temperatures into broadband radiative fluxes using multispectral regression models and radiative transfer physics.”
Cult kids will miss the “multispectral regression models”. But that’s why they’re cult kids….
And Bindi avoided providing his viable model of “orbiting without spin”, again.
I never get tired of being right….
I also noticed the “multispectral regression models” and together with the other steps described, the process is indeed rightfully named as a “maze of embarrassing manipulations”.
No educated scientist (whether skeptical of AGW or not) disagrees with the general principle that our atmosphere increases Earth’s temperature.
The above statement specifies “educated scientist,” which filters out the unscientific fringe theories of internet blogs and non-scientists who argue against the greenhouse effect.
Ark, the “general principle that our atmosphere increases Earth’s temperature”, is called the “atmospheric effect”.
You’re not confusing that with the undefined, nebulous “greenhouse effect”, are you?
The “atmospheric effect” refers to Earth’s “blanket” of nitrogen and oxygen that acts as insulation. But there are at least 3 different definitions of the “greenhouse effect”, but the bogus definitions have CO2 warming the planet.
So whenever you use the term “greenhouse effect”, you should state which definition you mean.
” … our atmosphere increases Earth’s temperature. ”
100 % correct.
But… between this correct statement and the illusion that
” Backradiation warms the surface ”
there is a gap no one with a functioning brain shall bypass. It is no more than one more of these ridiculous, misleading NOAA simplifications.
Measuring downward longwave radiation with a pyrgeometer provides evidence that the Earth would be cooler without infrared-absorbing gases (a category that, as is well known, does not include N2 and O2).
*
As a reminder:
Why Back-Radiation is not a Source of Surface Heating
Leonard Weinstein
July 18, 2012
https://noconsensus.wordpress.com/2012/07/20/why-back-radiation-is-not-a-source-of-surface-heating/
***
By the way, Clint R once more deliberately omitted to mention H2O on June 21, 2026 at 7:58 AM:
” … but the bogus definitions have CO2 warming the planet. ”
*
H2O warms the planet WAY more than CO2!
(That he often mentioned H2O together with the ‘HTE’ is of absolutely no interest here.)
Bindi is at it again, with his false accusations.
He claims I don’t know H2O is much more effective at warming the planet than CO2. So when I correct him, he says it doesn’t count!
If the cult kids had some maturity, they would know their constant false accusations only show they have NOTHING.
Bindi’s especially funny because he combines his immaturity and haughtiness, to make a complete ass out of himself.
Kids these days….
If CR had “some maturity” he could answer this simple question:
What is the difference between:
a CO2 15 micron photon
and
a H2O 15 micron photon
and
a 15 micron photon emitted by the sun
?
All 15 μ photons are the same.
You can explain this is to children, over and over, but they still can’t understand….
https://noconsensus.wordpress.com/2012/07/20/why-back-radiation-is-not-a-source-of-surface-heating/
Even a ‘skeptic’ website explains that backradiation is not a source of heat but a throttling of heat loss. They join Roy Spencer, John Christie, Richard Lindzen, Anthony Watts, and other experts in atmospheric sciences who are ‘skeptics’ regarding AGW.
Denying the GHE is not skeptic cannon, just as accepting it isn’t alarmist or leftist.
Denying the GHE is a view held by a tiny fringe group in the skeptiverse, commonly known as ‘cranks’.
And like a cult, they lambast ‘believers’ as alarmists, seemingly unaware that most of their AGW skeptic kin, especially those with expertise, side with the so-called ‘alarmists’ on the GHE.
They frequently cry appeal to authority when expertise is referenced, completely misunderstanding what the fallacy is.
What imbeciles.
Before you start assigning people to different beliefs, blackbody barry, you need to define the beliefs.
So what is your definition of the “GHE”? There are several different definitions, some valid, some invalid. In science, you need to clearly define things.
For example, some have used a car parked in full sun, with the windows rolled up, as the “GHE” . Well most adults would agree that the car is getting a lot warmer. But, that has NOTHING to do with CO2.
Sometimes you see the “GHE” defined as “trapping heat” by “greenhouse gases”, where water vapor is included as a GHG. Sometimes only CO2 is mentioned as “trapping heat”.
You need to be clear about what you mean by “GHE”. Especially before you start with your insults and false accusations.
“Before you start assigning people to different beliefs…”
I hear you, Clint – let you assign your own beliefs to yourself. Do YOU think atmospheric greenhouse gases keep the surface warmer than without them?
What description of the GHE do you think is ‘valid’, as you mentioned? Do you join Roy Spencer, John Christie, Richard Lindzen and other skeptics with expertise on the matter?
Sorry blackbody barry, but you got caught again.
Don’t try to weasel out.
What is your definition of the “GHE”?
You don’t have one that both fits your cult’s CO2 fetish and matches up with hard science.
Prove me wrong.
“All 15 μ photons are the same.”
Correct.
Therefore it is pointless talking about CO2 15 μ photons.
Agreed?
Clint,
I already provided a link to an explanation of the GHE in this thread – the comment you first replied to. I endorse it 100%.
https://noconsensus.wordpress.com/2012/07/20/why-back-radiation-is-not-a-source-of-surface-heating/
I’ll go one better just for you, and give you Roy’s description, seeing as I mentioned him.
https://www.drroyspencer.com/2015/06/what-causes-the-greenhouse-effect/
I think the first one is a bit more thorough, but you can pick either. Maybe go for Roy’s, as I’m wondering if you agree or disagree with this skeptic who is an atmospheric physicist.
So, which description of the GHE do you think is ‘valid’? I don’t want to misascribe any view to you, so pony up and explain. You’re not trying to weasel out of answering are you?
Sorry blackbody barry, but you’ve failed again.
One of those links claims it’s NOT “back-radiation”, and the other claims it IS “back-radiation”!
If you can’t come up with a consistent, succinct, viable definition/description of the GHE, and I’ll give you 100 words, then you’ve got NOTHING. And, you MUST use CO2 in any effort, since water vapor is as natural as rain.
I don’t have time for your usual nonsense, so you only get 3 tries. And you’ve already used one….
Clint,
Both descriptions agree that backradiation is not heat, but does provide thermal resistance to the loss of heat from the warmer object, causing it to warm further. Heat, as they posit is the NET transfer only.
1st link
“There is radiation energy both ways, but the radiation heat transfer is one way. This is not heating by back radiation, but is commonly also considered a radiation resistance effect. There is initially a decrease in net radiation heat transfer forcing the temperature to adjust to a new level for a given power transfer level.”
2nd link
“This absorption means the atmosphere also EMITS IR energy, both upward and downward. And it is that DOWNWARD flow of IR energy (sometimes called back radiation) which is necessary for net warming of the surface from the greenhouse effect.
(Technical diversion: This is where the Sky Dragon Slayers get tripped up. They claim the colder atmosphere cannot emit IR downward toward a warmer surface below, when in fact all the 2nd Law of Thermodynamics would require is that the NET flow of energy in all forms be from higher temperature to lower temperature. This is still true in my discussion.)”
Both sources note the ‘confusion’ that I have referred to many times:
1st link
“The misunderstanding of the distinction between energy
transfer, and heat transfer (net energy transfer) seems to be the cause of much of the confusion about back radiation effects.”
I’ve twice asked you what you think is a valid description of the GHE, and twice you’ve – what was your expression? – weaseled out of it. I gave you a link to my description before you asked for it. If anyone were keeping score, you are severely in deficit.
I sometimes try to deal with you as if you are not a troll. It is always a mistake. Up to you if you want to become an honest player in your next comment. If not, this is the last comment I’ll make in this subthread.
Your mission was to define/describe the GHE, blackbody barry. Your effort must be succinct (less than 100 words) and viable (not violate any laws of physics). You’ve now had two chances. Only one left. Don’t blow it on rambling and hand-waving.
I say you can’t do it. Prove me wrong.
The reason no educated scientist disputes the existence of the greenhouse effect is that it rests on well-established molecular physics.
The first rule of insulation is that the insulating material must interact with the energy being transferred. Earth’s surface cools primarily by emitting thermal infrared radiation, therefore, gases that absorb and emit infrared radiation can impede the rate at which energy escapes to space, while gases that are largely transparent to infrared radiation cannot.
The absorption of terrestrial infrared radiation by atmospheric gases depends on their concentration, molecular structure, and whether they possess vibrational modes that produce a changing electric dipole moment. Molecules such as CO2, H2O, CH4, O3, and NH3 readily absorb infrared radiation, whereas the dominant atmospheric constituents, N2 and O2, are largely transparent to it.
Because the atmosphere is composed primarily of N2 and O2, the greenhouse effect is controlled by relatively small concentrations of infrared-active gases. These gases absorb a portion of the thermal radiation emitted by the Earth’s surface and atmosphere.
The absorption occurs through quantized vibrational and rotational transitions, producing characteristic absorption bands across the infrared spectrum, particularly between about 5 and 100 μm, where Earth emits most of its thermal radiation.
This is not a controversial concept or an advanced climate-modeling assumption. It is well-established molecular physics and spectroscopy taught in introductory science and physics courses.
Ark, you mentioned both “absorp.tion/emission” and “insulation” in all that hand-waving, but failed to succinctly provide a viable definition/description of the GHE.
If you actually believe CO2 can raise Earth’s surface temperature, then just say it. You won’t because that’s easily shot down. So you have to beat around the bush….
Clint R:
Is someone holding you hostage and forcing you to read my posts?
Blink twice if you need me to call the police!
Ark, when you’ve finished with your childishness, maybe you could help blackbody barry. He’s got the same problem as you:
Clint R:
Is that a yes?
Yeah, that’s what I thought Ark.
So your “The reason no educated scientist disputes the existence of the greenhouse effect is that it rests on well-established molecular physics.” was just your usual cult blah-blah.
The hurricane season in the Atlantic is expected to be weak, unlike the one in the Pacific.
https://i.ibb.co/7xqZPpp2/eatlssta.png
Nikolov:
“While the average outgoing LW flux of a planet is an observable physical parameter, Te derived from it using Eq. (3) is a mathematical abstraction with no physical analogue at, below or above the surface. Thus, planetary effective emission temperatures are not compatible with measured physical temperatures regardless of the albedo they are based on. In other words, Te is a non-physical quantity with respect to a sphere. Consequently, comparing Earth’s observed global mean surface air temperature (287.6 K) to any Te is bound to produce numerically and theoretically misleading results. The conceptual distinction between Te on one hand and Tna or Ts on the other arises from the mathematical understanding that mean planetary temperatures cannot in principle be inferred from globally averaged radiative fluxes. In this regard, our analysis demonstrates that evaluating the strength of a planet’s ATE strictly requires the use of physical surface temperatures.”
Link: https://link.springer.com/article/10.1186/2193-1801-3-723
https://x.com/i/grok/share/57dfcec55ce9451b9f5f62a366a43024
Almost identical results from two completely different approaches.
For several weeks now, a significantly colder-than-average air mass has been present over Antarctica. In the coming days, temperatures there are expected to remain more than 20 °C / 40 °F below the long-term average (see the video). This mass of Antarctic air is concentrated mainly over the continent, where it has persisted for an extended period. In recent days, some of this cold air has also spread into South America, bringing below-average winter temperatures there as well: https://www.ventusky.com/temperature-map/anomaly-2m…
https://www.facebook.com/ventusky?locale=pl_PL
eldrosion…”The planet as a whole only loses energy through a net transfer to space. Radiation is the only form of energy transfer that can travel through a vacuum, so it is the only way energy can leave Earth.
Convection move energy within the atmosphere, and condition exchanges energy between the surface and the lower atmosphere.
Neither of these removes energy from Earth’s system. They just redistribute it internally”.
***
I beg to differ, convection related to rising, heated air parcels dissipates heat naturally with altitude.
You are regurgitating what you are taught by climate alarmists and misinformed text books and university professors who buy into the climate alarm hysteria. I am merely asking you to consider what actually happens, and what we know happens through experience.
In essence, I am asking you to considider what well established laws like the Ideal Gas Law tells us about the intimate relationship between gas mass, temperature, pressure, and volume.
We know that heat generated at sea level in the vicinity of Mt. Everest rises. However, by the time those parcels of air rise to the peak of Everest at 30,000 feet, all of that heat can be said to have dissipated. The loss of heat that initially came from the Sun, has literally disappeared.
***IT DOES NOT HAVE TO BE RADIATED BACK TO SPACE***
That’s my point, so prove me wrong. That in itself explains why we near sea level experience temperatures much higher than what we should and what some attribute to a mysterious greenhouse effect that in no way can be explained by the real mechanism that raises temperatures in real greenhouses.
It must be understood that the so-called energy budget comes from the mid 19th century when the idea was presented that energy can neither be created nor destroyed. That blind acceptance has lead to the current alarmist notion that any energy input by the Sun must be returned to space.
The Earth-Sun system is far more complex. It is true that if the Earth was cut off from solar radiation, it would rapidly lose most of its heat, however, the Sun injects enough energy each day to elevate Earth’s temperature to its current 15C average. That’s all the Sun is doing, injecting energy periodically, which is converted to heat, like a furnace does in our homes in winter. Since the Earth has internal means of distributing that energy, and dissipating it internally, we don’t have to return it all to space.
We have learned since that energy conservation is not necessarily true. The first law was presented as a conservation of energy law and I find that connection to be short-sighted. It is pretty well true for the equivalence of heat and work for which the 1st law is intended (conversion of thermal energy to mechanical energy and vice-versa) however it does not hold up for individual forms of energy that can be created or destroyed.
The idea that energy can neither be created nor destroyed comes from the mid-19th century some half century before atomic theory was developed. We still have no idea what energy is and we have broken it down into various forms according to what each form of energy interacts with mass. Based on heat as a form of energy involving atoms and their sub-particles, like electrons, we know that heat can be created and dissipated.
The idea was developed that energy must be converted to another form, hence conserved, but that is not always the case. I have described conditions in our atmosphere where heat is dissipated without being converted to another energy form based on the natural properties of our planet.
If we did in fact live in a real greenhouse environment with a glass roof extending out to our current atmospheric boundaries, and there was no gravity, there would be no negative pressure gradient. Temperatures near the roof would be the same as at the surface, and only then could your theory have meaning.
However, there is a catch. If all air molecules created a pressure against the roof glass, all air molecules would be involved in the radiation to space. That’s because all air molecules would be heating the glass and that heat would be converted to infrared radiation. We would not be hindered by the current meme that only so-called GHGs are capable of radiating to space.
The idea that nitrogen and oxygen cannot radiate energy to space, to me, is wrong-headed.
It is one of the silliest arguments I have encountered in science that trace gases are responsible for heating our atmosphere and transferring all energy input by the Sun back to space. By 30,000 feet, near the summit of Everest, the density of GHGs is 1/3rd the density at see level and to me it’s a case of 1/3rd of nothing is still nothing. By the time we reach the altitude of TOA, there are virtually no GHGs left to radiate anything.
So guess what? The alarmists have moved the goalposts and claim the radiation takes place at a much lower altitude. So, how do GHGs know at which level they should radiate, hence dissipate any heat left, which is essentially nothing at that altitude? And how many of them are radiating? Hardly any. So how do such scarce amounts of GHGs radiate all the energy input by the Sun?
You don’t seem to get it that 99% of surface heat at the effective altitude of radiation claimed by alarmists has already been dissipated due to a natural heat dissipation mechanism related to a natural negative pressure gradient. And that natural pressure gradient is due to our gravitational field that has a natural reduction in force due to the inverse square law.
Furthermore, the natural negative pressure gradient produces a natural negative temperature gradient due to the intertwined relationship between temperature and pressure in a gas. I have already gone through this so I will spare you the details. I can sum it up by pointing to the dependence of both P and T in a gas on the common kinetic energy of the molecules.
If the KE of air molecules reduces it affects both pressure and temperature equally. The KE is bound to be higher near the surface since air molecules gather heat directly from the surface wherever the Sun can heat the surface. Furthermore, near the surface, the gravitational field is strongest and the pressure is highest.
As altitude increases, the gravitational force decreases, pressure decreases, and with it, temperature decreases. It’s as simple as that. However, alarmists have bypassed the static conditions and focused only on rising, heated air parcels, which vary wildly at different locales on Earth. They have reasoned that the rising parcels of heated air are causing the lapse rate, which to me, is shear nonsense.
We know that heated air parcels in the Tropic travel poleward. That is a horizontal motion coupled with a vertical motion. How can that explain the lapse rate? And how about heat transported from the Tropics via the oceans? It must then augment heat created directly by solar energy at certain locales. No way that can be considered in a lapse rate theory.
“We have learned since that energy conservation is not necessarily true.”
Gordon, you cannot be serious about this.
Furthermore, the irony is that Gordon Robertson explicitly invokes conservation of energy reasoning in his other comment:
“Specifically, if we have a boulder at the edge of a cliff, the PE is maximum and KE is zero. If we push it off the edge, the KE increases as the PE decreases till it hits the ground where KE is max and PE is zero.”
norman…”You keep claiming an electron gains kinetic energy when it absorbs EMR”.
***
Norman…you are a piece of work. Your understanding of science is exactly backwards yet you use that backward understanding to criticize others.
If an electron absorbs a packet of EM of the proper frequency, the EM interacts electrically and magnetically with the same fields in the orbiting electron. The EM, if absorbed, causes the electron to increase its angular velocity, which leads to a higher angular frequency.
Since kinetic energy = 1/2 mv^2, if the velocity increases so does the KE, by the square of the velocity.
I think there may be a misunderstand as to the meaning of gaining KE. If an orbiting body gains KE, it means that it velocity has increased. Velocity is not a component of potential energy which is more concerned with the distance from a mass exerting a force.
Specifically, if we have a boulder at the edge of a cliff, the PE is maximum and KE is zero. If we push it off the edge, the KE increases as the PE decreases till it hits the ground where KE is max and PE is zero. Therefore the higher the cliff, the greater the PE and the greater the KEmax when the boulder hits the ground.
Obviously, the amount of gained KE determines, in an orbiting body, the new altitude of the orbit. With electrons, Bohr prescribed discrete orbits with no in-between orbits.
That may be why electrons require precise energy packets to move them with those packets having precise frequencies. Does not explain how heat affects electrons, or even, the meaning of heat as energy.
We also know that an excited electron in a higher orbital must lose energy in order to fall to a lower energy level. That means a loss of KE and that KE must be converted to EM.
Conversely, if an electron is in it ground state it is at its lowest possible energy level. If it absorbs energy like heat or EM, it becomes excited and jumps to a higher energy level.
With a planet, say the Moon, if you wanted to move it to a higher orbit, you’d have to increase its velocity, which is equivalent to increasing its KE. To move it back to its present orbit, you’d need to reduce its velocity, equivalent to reducing its KE.
An electron operates under s similar principle where it is attracted to the proton positive charge in the nucleus. The main difference is how the energy levels are depicted. With the electron, the energy levels are rated negatively with ground state in hydrogen being -13.2 eV, with 0 being rated at infinity. It means that the electron is no longer under the influence of the nucleus.
I think this may prove confusing to people analyzing the orbitals. On Earth, masses closest to the surface feel the greatest attraction. Same with electrons in ground state. If we had an aeroplane in a low orbit of the Earth, to move it to a higher orbit would require more thrust from the engines. That means the plane moves faster and can move to a higher orbit.
However, at the higher orbit level, the plane is covering more distance per orbit therefore, flying at the same speed as the lower orbital it can be claimed it is moving more slowly (speed, not velocity) since it travels more distance at the same speed. It can then be claimed its KE is lower at the higher orbital, which is not true wrt the plane itself, only to the greater distance covered.
To return to the lower orbit, the plane must give up KE. With an electron, that lost KE is converted to EM.
I think quantum theory has completely screwed a simple concept with their sci-fi mathematically-based logic. Feynman got it right, QM works but no one knows why. The math and logic are so convoluted that the human mind cannot visualize it.
All I am attemting here is to visualize an electron orbiting a nucleus based on a lifetime of studying electrons and their behavior in electronics theory.
It is clear that an electron must gain energy to become excited and move to a higher orbital. The only way it can gain energy as a moving particle is to gain it as kinetic energy. Potential energy is a non-factor here. Whereas it is true that total energy is the sum of KE and PE, we must be careful to associate KE with only a moving mass.
Gordo,
When molecules ab-sorb energy, their internal energy is increased. IR energy doesn’t involve electrons moving to a higher state, so the extra energy has to be realized in some fashion. It has to be kinetic or potential energy. The molecules are moving and the energy is dissipated by either radiative emission or thermalization which is conduction and convection. There is a lag between ab-sorbtion and emission so there is a lot of opportunity to lose energy due to thermalization. That is my point about no radiative flux from the surface. The atmospheric pressure is so high there are 100,000 potential collisions per emitted photon. A lot more opportunity for conduction and convection than radiant flux at the surface. That is why I believe radiant flux is very low to non-existent at the surface in spite of Bindidon’s SURFRAD. It doesn’t have time to radiate because it gets transferred by collision. It should be studied. Of course, they (Big Climate) won’t study because it goes against their narrative and would falsify SURFRAD and all the funds these government centers receive.
Stephen p anderson
With that total nonsense post not based on any valid science you need to turn in your A. You certainly did not earn it by mastering the topic of thermodynamics. With your total lack of any knowledge on the topic if you actually did get an A you cheated!! Want to prove how dumb your post really is? Borrow an IR thermometer and measure the temperature of an object feet away and come back and post IR is not moving through the atmosphere and has little impact on Earth Surface heat transfer! Is there no rational skeptics that no a little science?
Why are you doing this?
The entire comment is so wrong, and so dumb, it is amazing. Please, for the sake of humanity, just stop.
The IR energy becomes kinetic energy when a molecules abbysorbs a photon, similar to how a spring holds kinetic energy.
There is no lag between abbysorption and emmission.
The emmission is governed only by the concentration of excited states and their energy level. “Thermalization” better described as the relaxation of excited states works both ways.
When a CO2 molecule emits energy it most likely got that energy through collisions with other gas molecules or the occasional noble gas atom.
Of course there is surface flux, all matter emits thermal radiation based on its temperature.
Bob,
There is a lag between absorp-tion and emission.
Norman,
Have you ever used an IR thermometer? It tells you the temperature of the surface. So, if you have a pipe with a flowing liquid, you can get a reading with an IR gun, even a cold pipe. So, if you have a cold (40F) pipe entering a room that is 75F, one end of the pipe is 40F and the other end of the pipe is 42F. Did heat flow from the room to the pipe or pipe to the room and how did the heat transfer? Did any heat transfer from the pipe to the room?
Norman,
I have a radiant natural gas heater in my basement. When I turn it on it gets very hot. If you stand in front of it and feel its heat, is that heat conduction, convection or radiation? Is that EMR energy that is heating the room or is it conduction and convection? Radiators in an old house, are they EMR radiators or conduction convection? When you touch them are they hot? Is the air around them hot?
Norman,
Again, radiative heat transfer works well in space, in a vacuum. The Earth’s atmosphere isn’t a vacuum. From the Sun to the Earth, or to the Moon, or to Mars. Radiative heat transfer works well with high frequency waves like microwaves, uV, x-rays or gamma rays. There is no conduction or convection involved. With IR radiant energy it is converted at the surface to conduction and convection, or most of it is. An IR thermometer will detect temperature even when heat isn’t being radiated.
Norman,
Did you know the SB equation was based upon a black body in a vacuum? Why? I think it is because Stefan and Boltzmann knew that most of the heat transfer would be conduction and convection in an atmosphere under pressure. They were smarter than you Norman.
Stephen,
No, it does one or the other.
Bob,
If the cooling pipe was radiating heat, then at some point potentially, some temperature difference, it would cool down instead of warming up. According to Norman, and Blinny, the only type of heat transfer that they accept is radiative heat transfer. If something has a temperature then it is radiating heat, according to them. Radiative flux has to be very high relative to conduction and convection if it’s not in a vacuum, and still there is conduction and convection. You remember Bob, XX megawatt neutron flux.
stephen p anderson
Do not get confused by terms “heat” and energy exchange. The terms have different meaning in science. Heat is the net exchange of energy from a hot object to a cold one.
On your IR points. Air is a very good insulator of the conduction heat transfer.
https://www.engineeringtoolbox.com/thermal-conductivity-d_429.html
All the heat transfer mechanisms play out at the surface with even one more process, evaporation which would be the greatest total energy removal from the surface.
The surface is radiating a lot of energy and if not for the GHE would be the major energy transfer mechanism of heat away from the surface.
https://www.engineeringtoolbox.com/emissivity-coefficients-d_447.html
The amount of radiant energy lost by the surface is directly based upon its temperature and the emissivity of materials radiating at some temperature. Water is a very high emissivity radiator so it will radiate close to a blackbody at given temperature.
I think you get an “F” in heat transfer class!! You must have never did even one problem solving on heat transfer which incorporate all the heat transfer mechanisms.
Warm water at 80 F will radiate 435 Watts/m^2. You can go to a conduction calculator to see how much energy would conduct with an 80 F temp going 1 meter through air.
You also seem completely ignorant (is that by design or were you sleeping in your classes??) of air molecules hitting GHG molecules and getting them to a higher energy level so they will radiate. The process of thermalization works both ways. An excited CO2 molecule can give its energy to a lower energy air molecule but a air molecule hitting CO2 or H2O can cause them to go to higher vibrational states and they emit IR.
I have linked you to SURFRAD data. The air is warm near the surface and has lots of H2O and CO2 plus a few others. They will radiate to the surface based upon the temperature of the gas and the emissivities of each. The data in the link shows the DWIR intensity.
https://gml.noaa.gov/webdata/tmp/surfrad_6a3c9cc4989fe.png
Norman,
‘
I notice you didn’t answer any of my questions and came back with nonsense, regurgitating the Kool Aid. Stormin Norman. How many times did you have to take thermodynamics and still don’t get it? By the way, heat, work and energy are one in the same. The Equivalence Principle. I learned that in Physics too.
Norman,
How much heat does a cup of ice water radiate? You can read its temperature with an IR gun.
Stephen,
Conduction, convection, and radiation all work at the same time, radiators are designed to increase the radiation by using fins to increase the surface area, which also increases convection.
Most often, when a CO2 molecule emits, it got the energy from collisions with other atoms and molecules rather than abbysorbing a photon.
The radiant flux at the surface depends only on temperature and emmissivity, the pressure at the surface doesn’t matter.
Stephen p anderson
I would like you to provide a source for your statement that heat, work, and energy are the same. I can not find any supporting evidence that the Equivalence Principle makes that claim. There are many forms of energy with very different properties. The quantity of energy in each form, in joules, is the same and various forms of energy can be converted to other forms. I have not found suppory that claims heat, work, and energy are the same.
On your cup of water it totally depends on temperature.
I absolutely disagree. The pressure at the surface does matter or SB wouldn’t have specified a vacuum. Conduction, convection and radiation can all occur at the same time, but heat only flows from hot to cold. Also, the relative proportion of each is what is in question.
A vacuum is specified, so no conduction or convection would interfere with the measurement.
We finally agree. Definitely worth a couple of beers.
Gordon Robertson
You say i am wrong provide valid proof (not your thoughts that are based on nothing, fabrications of a crackpot) that an electron gains kinetic energy when it absorbs EMR. All sources I find clearly state Kinetic Energy goes down and potential energy increases.
I prefer to call it binding energy, or the energy of a standing wave.
Gordon Robertson
In your case of kinetic energy and orbits you can read anything to find you are wrong and correct it!! When energy is added to an orbiting object the kinetic energy goes down and its potential energy goes up
Read up on it and you will discover you are the backwards one not me. When you check it up you can then correct your misunderstanding! Posting things that are wrong need to be corre ted!!
A climate scientist could have saved the Reflecting Pool.
A climate scientist would have modeled the solar absorptivity of the dark blue liner and would have immediately warned that this paint would turn the 338,000-square-foot pool into a massive heat trap during a hot Washington, D.C. June.
Under identical midday sun exposure, the “American flag blue” paint features a solar absorptivity of 0.85 to 0.95, absorbing over 400% more solar radiation than white paint, which features an absorptivity of just 0.15 to 0.2.
A climate scientist who has studied how rising temperatures accelerate Harmful Algal Blooms, would have calculated that warming a stagnant, shallow water feature -which relies on untreated source water- would create the perfect incubation environment for rapid algae growth. They could have forecasted the “green explosion” before the first gallon of water was ever pumped in.
The green explosion is common. The problem they’re having is the contractor probably didn’t do the correct surface prep. Those epoxy liners are very robust if applied correctly. All the peeling sheets are an indication of improper surface prep. I hope the government is making the contractor redo.
Yep. This is why we dont give no-bid contracts to BFFs of the President, who promised to ‘drain the swamp’ in Washington but in fact has made it more swampy then ever.
Keep it simple, Stupid: Trump Says Vandals Sabotaged the Reflecting Pool.
And what Trump says counts.
Do I have to fix everything. The primary growth factor for algae is CO2… There. Now you folks have something to argue about.
Tim,
No, you don’t have to fix everything. The alga is easily fixable. The peeling liner isn’t. You can’t do anything about the alga with the liner peeling off in sheets.
Needs a creepy crawler.
Or several dozen.
stephen p anderson at 11:11 AM
“The green explosion is common.”
How dare you contradict the Dear Leader!
Trump said:
Left-wing media is failing to contextualise that the algae bloom always happens after renovation (and happens often enough regardless) because the water pumped out sits in pipes stagnating until it goes back in. This bloom seems to be worse than previous, though, but hardly unique.
However, in previous renovations the president didn’t brag like a 70s boxer that his reno is the best ever, finally fixing all the problems that others screwed up before. The problem is that people take his comments as if they are meaningful instead of slop that should be disregarded, and so Trump creates the conditions for criticism just by opening his mouth.
You remember when presidents didn’t pollute the airwaves with their thoughts every single day? His radio is always on.
Correction: The “President” is failing to contextualise that the algae bloom always happens after renovation. He says it was done by vandals.
“water pumped out sits in pipes stagnating until it goes back in.”
Sure, couldnt they have anticipated that and filled the pipes with chlorine, or flush out and remove the stagnant water ahead of time, etc?
In addition, the no bid contractor friends of POTUS did a sh*tty job.
Algae spoons are in the air.
Arrest the vandal algae spoons, that’ll do it.
Fook a bunch of auto correct, got to watch it like hawk.
Spores, not spoons.
“Sure, couldnt they have anticipated that and filled the pipes with chlorine, or flush out and remove the stagnant water ahead of time, etc?”
But you could make the same criticism of Obama when algae blooms followed the refill. Why didn’t they think of X?
Criticism is fine. I despise blatantly biased journalism on any side. The left-leaning news media is, once again, fuelling outrage instead of providing illumination.
“Correction: The “President” is failing to contextualise that the algae bloom always happens after renovation. He says it was done by vandals.”
Yes, he lies every time he opens his mouth. But my point is about poor journalism. Nothing Trump does will ever excuse the hyper partisan crap of news services like MSNBC (or Fox).
The polar vortex in the Southern Hemisphere is strong this year (as evidenced by its visible symmetry). Therefore, temperatures in Antarctica will be very low.
https://i.ibb.co/Kcsh3pvn/gfs-z50-sh-f00.png
Gordon, could you please estimate how much of the incident solar energy gets out to space and gets lost. How much of it warms surface first?
Wildfires in Greenland again: https://www.theguardian.com/world/2026/jun/23/scientists-alarmed-wildfires-greenland
Not very extensive, but they’re on peat soil so they probably represent a small increment in emissions.
What is the ice cover like in Hudson Bay on the first day of summer?
https://i.ibb.co/8nd7gGTr/masie-all-r10-4km.png
Bindidon:
“Do you think tah ALL stations WORLDWIDE measuring IR radiation from both the surface and from the atmosphere give wrong data?
https://drive.google.com/file/d/10oZEK21bfTnPIFCdLf-4OTAeSQR7UOGh/view ”
If what it says is true, why people still build conventional greenhouses?
–
https://www.cristos-vournas.com
There is a low probability of a hurricane forming in the cool tropical Atlantic.
https://i.ibb.co/ch9kdXYh/goes19-ir-atl.gif
Back in the real world, the bbc and met office go full on with climate hysteria, all because of a few hot days in June,they still do not know that weather is not climate,so much nonsense broadcast over so little, as they broadcast record June temperatures from junk stations in the South,only the met office would have a station surrounded by solar panels, meanwhile in the real world 300 miles north, in Northumberland temperatures peaked at 27c for about two hours this afternoon,
It is true that weather is not the same as climate.
However, hot summer days (TMAX) have been increasing in the UK (Met Office data):
https://www.metoffice.gov.uk/research/climate/maps-and-data/uk-temperature-rainfall-and-sunshine-time-series?
This increase in extremes is consistent with a rise in average temperatures, where the upper end of the temperature distribution shifts to the right:
https://petergardner.info/2017/03/heatwaves-normal-curves-and-climate-change/
In that sense, reporting increases in extreme heat is an objective reflection of underlying climate trends.
Modern global warming is scary and primarily driven by GHG concentrations. Deniers won’t accept that fact.
I am not going to be holding my breath waiting for that “junk weather stations” claim to suddenly turn into anything solid or well supported.
“Modern global warming is scary and primarily driven by GHG concentrations. Deniers won’t accept that fact.”
Eldro, there you go again!
What “fact” are you accepting? Do you have the science to support your false beliefs?
Yes.
Good answer, Eldro!
Of course, you’ve got NOTHING, so just fake it with one word. That’s much smarter than the 500-word blog-clogging that Bindi, Norman, and blackbody barry try.
They’re not fooling anyone either.
No, Clint R. I have scientific evidence I can share.
The problem is that your baiting is far too transparent. You routinely argue that your time shouldn’t be wasted on “cult children.”
I am now applying that same standard to you.
Now you are getting wordier, Eldro. But you’re caught. You’ve got NOTHING.
You’re not fooling anyone.
christos…how are you in Greece? Good to hear from you.
“Gordon, could you please estimate how much of the incident solar energy gets out to space and gets lost. How much of it warms surface first?”
***
Christos…I really don’t know. Energy flow does not interest me since most of it is based on consensus. My background is in electronics and computers and I know how difficult it can be to accurately measure broadband frequency spectra like solar energy. There are no electronic instruments that can measure such wide spectra since instruments are very sensitive to one frequency in particular. Also, no electronic detection device can possibly measure the entire solar spectrum with any degree of accuracy.
We are told that nitrogen and oxygen cannot radiate to space which is a monumental lie. I don’t think anyone has bothered to try measuring radiation from those elements simply because we lack the instruments. The satellites used by UAH to get their temperature series rely on oxygen emissions in the microwave band.
I do know that the so-called energy budget is full of inaccuracies. It shows more infrared energy leaving the surface than all EM injected by solar energy. Of course, it ignores how much solar is absorbed directly by the atmosphere and completely underestimates how much is dissipated directly bu conduction/convection.
Infrared from the surface is a relatively low power form of EM radiation whereas solar is a relatively high power input. If the input is in watts and the IR output is in milliwatts, where does the rest of the heat go?
Obviously, as Stephen has claimed most of the heat loss from the surface is via conduction/convection. And that heat gets dissipated within the atmosphere as the heated air rises.
Gordon!
You are rambling again.
Have you taken your tablets?
“And that heat gets dissipated within the atmosphere as the heated air rises. ”
Where does the heat go?
It is Thermodynamically impossible for it to just disappear.
In thermodynamics, “heat” is the transfer of energy from hot to cold.
Consider a closed system containing two bricks. At initial conditions, one brick has a temperature of 200°, and the second brick has a temperature of 100°. There is a flow of energy between the bricks. Heat is happening.
After a time, both bricks will be at the same temperature. There is no longer any heat.
“Heat” is not a “substance”, it is a “flow”, as in energy/time.
Ent,
It is lost in pV work. The system, the rising air does work on the surroundings, the atmosphere.
Thank you, Gordon.
Thank you, Clint.
Thank you, Stephen
For something uplifting, a reminder that the fastest, most distant object we ever made is still sending signals 50 years later, carrying a greeting through the galaxy that will last up to 5 billion years.
https://spacedaily.com/t-voyager-1-has-been-travelling-non-stop-since-1977-faster-than-a-speeding-bullet-every-second-of-every-day-and-it-has-not-yet-reached-the-distance-of-a-single-light-year-from-earth/
French nuclear plants have been shut down recently because the cooling water supply is too warm to work effectively:
https://www.technologyreview.com/2026/06/24/1139676/europe-heat-power-plants/
A bit of a confounding factor for those hoping for big-state solutions to emissions. Meanwhile renewables seem to have reached take-off.
In light of the United State’s president’s holding affordability to hostage with his desire to get a election bill signed that is based on no evidence of widespread voter fraud, let’s hear from his own administration and other Republicans on the 2020 election.
https://www.brennancenter.org/our-work/research-reports/its-official-election-was-secure
Confirming the 2020 election was free and fair are
Christopher Wray, Trump’s FBI Director
Bill Barr, Trump’s Attorney General
Trump’s Department of Homeland Security
Chris Krebbs, Director of Trump’s Cybersecurity and Infrastructure Security Agency
Benjamin Hovland, Commissioner of the U.S. Election Assistance Commission
Gabriel Sterling, Georgia’s Voting Systems Implementation Manager
Scott Schwab, Kansas Secretary of State
Kim Wyman, Washington Secretary of State
Lisa Posthumus Lyons, Kent County Clerk, Michigan
Ben Ginsberg, Veteran Republican Party Election Lawyer
Karl Rove, Former Senior Adviser and Deputy Chief of Staff to George W. Bush
31 Former Republican Members of Congress
Will Hurd, Representative of Texas’s 23rd District
Larry Hogan, Maryland Governor
Joni Ernst, Iowa Senator
Mitt Romney, Utah Senator
Bill Cassidy, Louisiana Senator
Pat Toomey, Pennsylvania Senator
As well as 60+ judges that unanimously confirmed no widespread (or any) election fraud.
As well as numerous recounts that confirmed the results, even by a pro-Trump outfit.
As well as Mike The Pillow Guy Lindell losing his ‘Prove Me Wrong’ contest to disprove he had terabytes of election fraud material. The disprover is a Republican who voted for Trump.
As well as numerous national and state reports on election fraud that have found no evidence of widespread fraud in US elections.
Why do MAGA conservatives believe there has been fraud?
Because Trump says there is, and Trump is the voice of God to them.
Fraud has been imbedded in several states like California. I just want to know why an Aussie is so damn interested in US politics?
Evidence?
Stephen p anderson is very gullible to lies and misinformation. Any sane person would not believe anything Trump says. He lies often. Anderson is a radical polarized right-wing lunatic that blindly believes every and all lies from the right without the ability to question anything. In the science world he blinly believes any crackpot theory that goes against established science. In his brain, rotted by rigt-wing media lies, he thinks (if that is possible for him) established science is left-wing.
Stormin Norm,
You guys were counting Trump’s lies during his first term. I think you counted over 25000 lies. How many lies this term? By the way, the lapse rate and Berry’s carbon cycle model both falsify GHT.
Norman, Barry,
How do you feel about the 100-year, 50-year, etc. prison sentences for your Antifa brethren?
Stephen p anderson
Does Trump even tell the Truth?? He lies so often that it would be difficult to tell.
On the GHT. Lapse rate forms because the surface is receiving much more solar energy than the atmosphere. It is a gradient thing which I attempted to explain to you. If you actually did study valid science at higher level I had thought you could inderstand it. As you stated, convection does not cause the lapse rate. It reduces it, convection moves heat to higher levels to reduce the gradient created by solar heated surface and radiant energy loss at TOA. If you research it, without convection the gradient would be much steeper! I gave you a very good link to lapse rate. Try and read it. During a clear day the surface can reach a super lapse rate since the surface and local air above warm much faster than air above.
Norman,
The lapse rate has nothing to do with solar radiation and everything with pressure. The derivation of the lapse rate is a differential using the chain rule. Remember those A’s I got.
dt/dz=dt/dp(dp/dz)
stephen p anderson
It is not caused by pressure. You do not get an A!! You can do an experiment to show that your heroes are zeroes with their pressure heating surface BS! Increasing pressure will initially heat a gas but it will not continue heating it and actually cool to ambient temperature. I think you believe it works by some voodoo magic that the solar heating and pressure create the enhanced surface warming (not a radiant reduction of energy flow to space which is scientifically accepted, measured and based upon valid and experimentally verified studies).
Set up your experiment with two identical tubes filled with air. Compress the air in one and not the other. The air in the compressed one will initially heat up but then it returns to ambient. Apply the same heat to both and demonstrate that the compressed air will reach a higher temperature. The theory is awful and based upon zero real physics. Some mumbo jumbo manipulation of math and adding some fudge factors and you fall for it.
Lapse rate is the same as any temperature gradient that exists when heat is applied at one location and not on the opposite side that is only losing energy to the environment.
Convection reduces the lapse rate by bringing surface heat to higher parts of the atmosphere.
In this link they talk about Super adiabatic lapse rate. Greater than 10 C/Km.
https://agriculturewale.com/lapse-rate-and-adiabatic-lapse-rate/
Now for a link that explains how super adiabatic lapse rates occur.
https://www.theweatherprediction.com/habyhints/31/
The super adiabatic lapse rate is a function of solar heating and occurs in deserts in summer time. The pressure is not changing to increase this lapse rate.
The solar heating of the surface sets the lapse rate. The TOA radiant loss creates the condition. Convection acts to lower the lapse rate by moving heat to upper layers and warming them. Convection occurs to balance and increasing lapse rate caused by solar heating. I do not know why you need to accept a few crackpots over well established science that has been going on for several years. I still do not accept you got an A in any college level study of heat transfer. You think emissivities are “fudge factors”??? That is a sign so someone who did not study any physics but is a right-wing lunatic that consumes crackpot ideas that go against established science. I do not know what happened in your life to create your current mind. I would be interested to know though.
Sorry Norman, the math is on my side.
Stephen p anderson
So you reject observation and logical thought to keep yourself ignorant?? I am not sure that is helpful
I do not know what math supports your ideas observation does not. Do you even take the time to read the links I post for you? In science it is not a shame to correct a wrong conclusion. Best scientists are humble and will follow evidence even if they have to change how they thought things worked. Science is not an end, it continues to move forward and advance as new information is aquired. Science always tries to correct for observations and experimentation.
Norman,
So, you do agree as hard as you are arguing this point that if the lapse rate was due to a change in atmospheric pressure, then it would falsify GHT? I think even you understand this.
Norman,
The differential equation F=ma was based on observations and explanations the same as the lapse rate. The lapse rate is based on a differential equation but a little more involved using the chain rule.
dt/dz= dt/dp(dp/dz)
“Imbedded” – Is that the new weasel word to suggest wide-scale election fraud without evidence?
Mike Johnson used words when asked for evidence:
“Some of these efforts are so diabolical and so far upstream that it’s impossible to prove, but I think everybody knows instinctively, something is wrong here, and that’s a concern.”
No difference between feeling and fact for this guy. Same goes for all useful idiots who believe Trump’s election propaganda.
“I just want to know why an Aussie is so damn interested in US politics?”
‘When America sneezes the whole world catches a cold’
Choices made in Washington affect billions.
The misbegotten war on Iran is only the most recent example.
It’s not just me, kiddo. Politically aware people worldwide pay attention. And even the sleepier ones wake up when the US drops bombs.
Barry,
The rules for registering and voting and mass mailing of ballots are designed to aid fraud. The Democrats have the machine to exploit this. Why, do you as an Aussie, care at all about our elections?
Troglodyte will troglodyte:
https://www.sdpb.org/politics/2026-06-23/state-senator-and-gop-delegate-faces-felony-election-fraud-charges
Evidence, stephen. Your last effort brought us a handful of fraudulent registrations for money that were never submitted as ballots. There was no political angle to this meagre assault on democracy.
There’s no evidence of widespread fraud bedevilling US elections. It’s as simple as that. This is Trump’s fever-dream.
The guy won twice when the president was Democrat, and lost when HE was president. Apparently elections are free and fair when Democrats own the Whitehouse…? Oh no, even when he wins he says he’s been cheated.
I followed the last Trump presidency wondering how bad this obvious grifter, this patent bullshit artist would make things, and ended up mostly amused at what he said and did. It became clear that career functionaries were holding him back. It was Survivor: Whitehouse, and entertaining. But now his worst impulses are projected by the people around him. Now he gets talked into a war by Netanyahu and there’s no one to tell him, “this is a bad idea.”
The guy trashes things. International partnerships, treaties, agreements, the US government, the DoJ, elections, the constitution, anyone and everyone who criticises him. His vendettas become administration attacks. The DoJ is breaking records on Grand Jury rejections and court losses.
You are in thrall to an extraordinarily narcissistic person, who likes to make his personal grievances national policy. By far the worst president ever, and a threat to national and global security and prosperity. You bet I pay attention.
Barry,
California is a complete disaster. That’s what you leftists want so you can come in and save the day. You can be kings of the pile of rubble. Trump is fantastic. He’s anti you and your ilk.
Barry,
What do you think about Obama judge blocking citizenship checks nationwide, or at least attempting to? Do you check for citizenship in Australia?
Barry,
Why is Australia cozying up to the Chinese? How many millions did Mao kill?
Where’s the evidence?
The evidence that Mao murdered millions?
That kind of evidence, Troglodyte:
https://www.yahoo.com/news/articles/trump-supporting-pastor-born-no-214717409.html
Please stop making Tom sad.
No evidence of widespread election fraud? Change the subject of course.
The system is the evidence. When you have tranches of ballots show up in the mail and 90% of the ballots are for the Democrat candidate that is evidence of fraud. Republicans are roughly 38% of the California electorate but the mail in ballots are 90% Democrat. That is evidence of widespread fraud. Their system is fraudulent. Anyone can register to vote in California. You don’t have to bring your birth certificate to register. You only have to say you are qualified. You don’t even have to say that. You just sign a document that you are an eligible voter. But I don’t have to explain this to you. You favor this. You’re an Australian but you are a globalist Marxist. That is why you are so interested in our elections. You support the fraud. By any means necessary. It is about your utopian agenda. You masterminds will run the world. You know better than nature. You want the US to fall like Australia, UK and Canada have fallen.
Fess it, Troglodyte:
https://www.scotusblog.com/2026/03/court-appears-ready-to-overturn-state-law-allowing-for-late-arriving-mail-in-ballots/
After Bush v Gore, that’s just great.
You don’t know how to post a link.
stephen p anderson
You should stop just blindly believing your fanatic right-wing sources on things. You are being lied to. To bad you are too lazy to research things on your own.
When you make claims I think it is wise for me to check since you are very gullible and tend to believe lies and are too lazy to check up on what your lying sources tell you to believe. What a sorry state of a mind you dwell in, like a mushroom “lives in the dark and fed S**t”
YOU: “Anyone can register to vote in California. You don’t have to bring your birth certificate to register. You only have to say you are qualified. You don’t even have to say that. You just sign a document that you are an eligible voter.”
Reality not right-wing lies!!
https://www.usvotefoundation.org/state-voter-information/california
From the link since you are too lazy to look for yourself.
“Voter Registration
To register to vote in California you should provide:
Your California Driver’s License or State non-driver ID Number
Last Four Digits of your Social Security Number
If you are registering to vote for the first time by mail, you will need to provide a copy of a valid ID. Acceptable forms of ID include:
Valid Photo ID
Utility Bill, Bank Statement, Government Check, or Paycheck that Shows your current name and address
Government Issued Document that shows your current name and address
You can alternatively show one of these documents when you vote to complete your registration.”
Norman,
So, you do agree as hard as you are arguing this point that if the lapse rate was due to a change in atmospheric pressure, then it would falsify GHT? I think even you understand this.
“When you have tranches of ballots show up in the mail and 90% of the ballots are for the Democrat candidate that is evidence of fraud.”
The few times you’ve brought some ‘evidence’ to the table we’ve seen it’s not what you say or just plain wrong. Dem candidate got all the votes in an update? I check it out, the Repub candidate got all the votes in an update a minute later. Rigged election? Nope, you just didn’t get the whole story.
So no wonder you spout this stuff without specifics. Even you have to suspect that you’re being fed fake news over and over.
I’m going to assume you get your ‘news’ off fracebook. That’s why you never supply a link, substance, or any of the evidence you are asked for over and over and over and over.
You live in a fact-free universe and expect to be taken seriously.
https://pressgazette.co.uk/news/climate-scientists-say-news-coverage-ignores-cause-of-uk-heatwave/
“There is also no doubt that temperatures will continue to increase, with further rises in extreme heat, until the world reaches net zero carbon dioxide emissions.”
That’s the belief, but beliefs ain’t science.
Ark, and his entire cult, have been unable to describe how CO2 can warm the planet. They have no science, only beliefs.
https://www.drroyspencer.com/2026/06/uah-v6-1-global-temperature-update-for-may-2026-0-53-deg-c/#comment-1747084
There’s an image doing the rounds on Bluesky which seems germane here. This should take you to it: https://cdn.bsky.app/img/feed_fullsize/plain/did:plc:ve4xx3a5imrrpzkmrw6sbv6v/bafkreidwl2deswjuwdbf4wl7f5chzoh4yxqmwzdaferhvkrz4fiyr7vi7e
The upper half is an image from French TV broadcast in 2014, showing a hypothetical weather forecast from 2050. The lower half is the actual weather forecast broadcast just two days ago. As Mike Mann points out, all they got wrong is that it’s a bloke wearing a suit and not a young woman in a dress.
The thought of the climate in the distant future depresses me greatly.
Eldro,
We don’t have a global warming problem, but we do have a global cooling problem. The next Glacial period won’t be fun for the people of planet Earth. However, nothing under the Sun will stop it.
Elliott Bignell at 8:08 AM
Yikes!
A heatwave that was portrayed in 2014 as representative of conditions that might occur in 2050 now resembles temperatures that can already occur during an extreme weather event in 2026.
While the maximum temperatures are the same at 43°C, mean visible temperature is about 1.3°C warmer, and the area above 40°C is larger on the 2026 map.
This is broadly consistent with the documented increase in the frequency and intensity of European heatwaves.
Elliot, Ark, and Eldro, the only safe place to hide is under your beds.
We’ll call you kids when it’s safe to come out….
spa – It’s already been stopped.
Arkady – Indeed. My neighbour has a garden thermometer out the front. Admittedly on the sunny side and not shaded. It read 40°C when I got in this afternoon. I’m on the shady side of the Alps. El Nino hasn’t even got started yet. I’m interested to see what the year will bring.
Elliott
You wrote “My neighbour has a garden thermometer out the front. Admittedly on the sunny side and not shaded. It read 40°C when I got in this afternoon. ”
No wonder you are struggling with things.
The air temperature is in the shade! So all those weather forecast are never talking about how hot it is in the sun it’s about air temperature in the shade, don’t believe me then check any of the met offices.
Elliott Bignell at 2:11 PM
Heatwaves are far more disruptive and dangerous in places not used to high temperatures.
I live in Houston, Texas, where high heat and air conditioning are both common and health risks don’t seem to increase much during heatwaves.
norman…you are a bit confused between the vertical relationship between potential and kinetic energy in a gravitational field and the kinetic energy of a moving body in an orbit. Certainly, if you raise a body vertically it has greater potential energy and the KE can be said to reduce wrt to the PE as the body is raised. However, it takes an increase in KE to raise a body in an orbit to a higher orbit.
An electron orbiting in ground state requires KE to raise it to a higher energy orbital. That’s because it is under the influence of the nucleus which is exerting a vertical force on it similar to the Moon orbiting the Earth. To raise the Moon to a higher orbit would require a force tangential to the orbital path and that would cause a rise in KE since the velocity must increase.
Similarly, to get the Moon to drop to a lower orbital, KE would have to be shed, just as with an electron orbiting a nucleus. As an electron drops to a lower orbital, it must shed KE and it does so by converting it to a quantum of EM.
Ergo, it makes no sense to claim a body loses KE while becoming excited. Exciting suggests energy has been added but you are inferring that energy is lost and the electron simply jumps to a higher orbital for the heck of it. Sorry, physics does not work that way.
It is not possible to make general statements about photon absorp.tion, as is often attempted. That’s because photons can be different, and targets can be different.
One major distinction is electrons versus molecules. In consideration of Earth’s infrared wavelengths, molecules can sometimes absorb. But infrared energies are typically not sufficient to raise electron orbital levels, so infrared photons are not absorbed. To keep it simple, infrared wavelengths go with molecules, much shorter wavelengths go with electrons.
If a photon has enough energy (short wavelength), it can raise an electron to a higher orbital. The electron’s potential is increased, but it’s kinetic energy may or may not be increased. Here the planet/moon analogy fails, as quantum physics takes over. Fpr example, in a simple hydrogen atom, if an electron moves from n=1 to n=2, its kinetic energy actually decreases. But in another example, if an electron receives too much energy from a photon, it can actually leave the atom, in an event called “ionization”. When that happens, the electron has greatly increases its kinetic energy.
Clint stubs his toe again.
If a photon has exactly enough energy to ionize an electron, it leaves the atom with zero kinetic energy.
Is boob droege just trying out his comedy routine, or is he really that dumb?
Here’s my words: “…if an electron receives too much energy…”
Here’s what boob must believe that means: “If a photon has exactly enough energy to ionize an electron…”
Only a boob would believe “too much” is the same as “exactly enough”.
Try “greatly increases the kinetic energy”
“If an electron move from n=1 to n=2, it’s kinetic energy decreases.”
And “it’s kinetic energy energy may or may not be increased”
Electrons in atoms don’t have any kinetic energy.
You can’t go from some to none and then to more just by using higher and higher amounts of photon energy.
boob can get so confused no one can help him.
That might be why he’s on a 30-day ban….
Stop with the insults Clint.
Do electrons bound within atoms have kinetic energy?
No insult, boob.
You falsely accused me at June 25, 2026 at 12:47 PM. I’m just supporting your comedy career.
Sorry Clint,
You claimed electrons inside atoms have kinetic energy.
Sorry they don’t, as they are not moving.
How can they move if we don’t know where they are inside the atom.
We can’t even tell an s-orbital electron from a p-orbital electron inside an atom.
You calling me confused is an insult.
Have you found an orbiting object with no spin yet?
boob, your false accusations aren’t working for you. They only prove me right. You have NOTHING, so you make up nonsense.
Keep proving me right. I can take it.
That’s good Clint, you claiming I post nonsense and I am confused means I am over the target and doing damage.
Yes boob, you likely do damage everywhere you go.
And again, that proves me right.
Gordon,
How come Mercury moves faster than all the other planets?
The closer an object is to the Sun the higher the gravitational force or space-time warp.
Earth’s atmosphere doesn’t act as a warming blanket covering planetary surface.
We do planets and moons surface temperatures comparison.
The presence of atmosphere doesn’t warm Earth’s surface.
It is the other reasons, not the presence of atmosphere, that make Earth warmer than the Moon by +68°C.
–
https://www.cristos-vournas.com
Earth’s atmosphere definitely acts as a blanket. It’s not an “electric” blanket, adding more energy to the system, but it’s insulation restricting the flow of energy to space. The insulation effect comes from oxygen and nitrogen, which make up 99% of the atmosphere. The radiative gases are like leaks in the blanket. If there were fewer radiative gases, Earth would be warmer.
The atmosphere and oceans are why Earth is much warmer than Moon.
Clint R
I am wondering if you can explain how this N2/O2 blanket works. Air is a great insulator so air will greatly reduce conduction of heated surface to atmosphere. Not sure how that in any way reduces the upwelling IR the surface is producing. Why is this blog have so many science ignorants who endlessly promote fictcious ideas and all think they are experts?? Are all science blogs tortured by arrogant deluded posters who think they know science but will never try to understand it.
Clint R you are only one of the many ignorants who torture valid science on a daily basis.
I might think you have some understanding if you explain how N2 and O2 stop the surface IR going straight to space and rapidly cooling the surface at night (which in reality does not take place).
I do not have any hope that you are capable of generating a well reasoned intelligent explanation. You just are not a smart person. Seems like you may have failed High School physics and have a grudge against people considerably more knowledgeable than you.
Norman, you keep forgetting the rules — No insults or false accusations allowed.
You’re welcome to revise and resubmit, when you grow up.
Clint R
We shall see. Here is the question for you. How do N2 and O2 stop the surface radiant energy from reaching space and drastically cooling the surface at night when no solar incoming is warming it??
Nitrogen and oxygen do not absorb infrared. So infrared emitted from Earth’s surface is slowed down on its way to space. That effect continues with or without direct solar.
“Nitrogen and oxygen do not absorb infrared. So infrared emitted from Earth’s surface is slowed down on its way to space.”
Talk about a non sequitur, Norman.
Clint R
Can you elaborate. Your post is not connecting logically.
YOU: “Nitrogen and oxygen do not absorb infrared. So infrared emitted from Earth’s surface is slowed down on its way to space.”
You make the statement that the two primary gases do not absorb infrared but somehow that slows down the infrared emitted from Earth’s surface on its way to space. I am not linking the two in a logical conclusion as you have done. What makes the infrared slow down if it is not absorbed? What mechanism is responsible for a slowdown?
If an infrared photon cannot be absorbed by nitrogen or oxygen, then it is reflected, refracted, or scattered. That means it must travel in another direction, slowing down its travel time to space, if that even happens.
Infrared photons from the surface likely spend a lot of time being bounced around and absorbed by radiative gases. Once absorbed, molecular collisions can reduce energy, resulting in change in frequency (pressure broadening) or mechanical losses.
That doesn’t fit with your cult beliefs, so based on your history, I expect some childish nonsense like blackbody barry is spewing below.
“If an infrared photon cannot be absorbed by nitrogen or oxygen, then it is reflected, refracted, or scattered.”
JDHuff*man forgets about transparency.
Clint R
Have you seen any satellite entire IR spectrum graph?
The spectrum shows same intensity of IR emitted by surface reaching TOA with no losses through the atmosheric window, region where GHG do not absorb much in those bands of IR (noted by you, there would be slight reduction from Inverse Square Law but not significant at 10 KM above surface). I do mot think your current understanding can explain observation. Your theory does not match real world observation an so is to be rejected! Surface IR given off in the bands that GHG absorb are significantly reduced. The most logical explanation that agrees with observation is that GHG greatly reduce Outgoing Longwave radiation, acting like an IR blanket. Not stopping all Emission, just greatly reducing it. This reduction of heat loss allows the solar input to drive the surface to a higher temperature.
No Norman, your cult beliefs cloud your mind. First, the images of Earth’s spectrum are computer generated. There are NO spectrum observed at TOA. Your cult can’t even agree on where TOA is! And certainly any such spectrum would NOT indicate “no losses”. That’s all in your imagination.
Of course you’re going to reject any science that counters your cult’s indoctrination. You have to reject reality to be in a cult. Look at how pathetic your beliefs are:
1. You have no viable, succinct definition/description of the bogus GHE.
2. Your cult’s K-T “energy” diagram is a complete science disaster, as discussed last month.
3. A surface can NOT be warmed by an incoming flux less than the flux the surface is emitting. Yet your cult tries to violate that.
4. The “plates” nonsense is completely debunked, yet your cult still clings to it.
5. You STILL have no viable model of “orbiting without spin”.
And instead of getting mad at the people who have misled you, you insult and falsely accuse the ones bringing reality to you.
Pathetic.
Clint R
This article states they like to use 20 km above the surface as the TOA reference point. They do understand the Inverse Square Law.
https://ceres.larc.nasa.gov/documents/cmip5-data/Tech-Note_rlut_CERES-EBAF_L3B_Ed2-6r_20121101.pdf
Note for you. I am not just expressing my opinion. I am doing research and giving you the information available.
Clint R
There are measured spectrum of outgoing longwave radiation. Here is some of the first measured values.
https://docserver.gesdisc.eosdis.nasa.gov/public/project/Images/IRISN4RAD_001.png
https://disc.gsfc.nasa.gov/datasets/IRISN4RAD_001/summary
Using this instrument.
For details on the whole study here is an article. Written long before Climate Change was an issue, you can read through to see how scientists think and how they consider all types of things when trying to get valid information.
https://ntrs.nasa.gov/api/citations/19650018039/downloads/19650018039.pdf
Not computer generated. Also in the spectrum you can see the radiation in the Atmospheric band is mostly getting through to space with minimal losses.
Clint R
On your point 1): Yes I just described the correct GHE to you in the post just above yours. The GHG reduce the heat leaving the surface and so allow Solar input to drive the surface to a higher temperature just as other forms of insulation will do. Most deal with conduction, this one reduces radiant heat loss and so solar input raises the surface temperature.
On Point 2). I do not agree with your assessment of the K-T diagram.
Clint R
YOU: “3. A surface can NOT be warmed by an incoming flux less than the flux the surface is emitting. Yet your cult tries to violate that.”
Okay this one is just observationally false. Claiming some cult is trying to violate a false notion is not a correct view.
I will give you clear evidence that you point is false. Made up and not based upon any reality. Making claims that are not supportable is NOT science. Do you understand this? Science is a system of information that is based upon observation, experiments, and logical rational thought…not belief no matter how strong yours might be!!
Here is the evidence your point is false! Look at consider it and humble yourself and learn. Or ignore it, up to you. I will provide it, what you do with valid information is up to you.
https://gml.noaa.gov/webdata/tmp/surfrad_6a3f46a5f2ae9.png
If this posts properly it shows solar in, how much the surface is emitting and temperature of air and case for UPIR. You can see that the temperature of both case and air increase as soon as solar energy is measured. It is below the emitted flux for a couple hours yet the temperature goes up even though the flux is less than the emitted flux. You claim is that can’t happen and yet I provide evidence that it does.
Clint R
On your point 4. You and DREMT believe the plates have been debunked. Your belief does not make it a fact or reality.
Your final point 5). How about consider another point. An orbiting object that continuously shows only one side to the Earth is rotating once per orbit. This is verified by the International Space Station and probably several other satellites that currently orbit the Earth but must maintain the same side continuously to face the Earth.
https://www.forbes.com/sites/quora/2017/10/03/how-does-the-iss-travel-around-the-earth/
This is one article.
https://space.stackexchange.com/questions/19718/does-the-iss-have-a-rotational-motion-in-addition-to-its-translational-motion
Another
and yet one more
https://www.smithsonianmag.com/air-space-magazine/how-things-work-space-station-steering-22912477/
The International Space Station rotates once per orbit (360 degree) in order to keep the same side continuously facing the Earth. Just like the Moon.
I know DREMT will not be able to grasp this. I doubt you will. Either way it does not matter. You are wrong on all counts. Sorry! Evidence and facts are proving your points are false. Will you humble yourself and realize that everything you thought was correct or true is false? Not an easy thing to do. Much easier to call everyone “Cult Kids”. Science is not about ego but about what evidence shows. I am sure the people who thought light objects will fall slower than heavier ones were crushed when Galileo used evidence to show their beliefs were wrong.
Dang Norman, you may have just set a record for blob-clogging! And you also demonstrated your addiction to your cult, but I’ll give you one thing, you started out without your usual childish insults and false accusations. I appreciate that.
At June 26, 2026 at 9:12 PM
You supplied a link and mentioned that the link referred to “20 km above the surface as the TOA reference point”. The problem is, there are many different interpretations of TOA, from ChatGPT, “11111” and “22222” indicate column breaks:
Worse yet, the ISS orbits at 400 kilometers (about 248 miles), and still experiences atmosphere effects.
There is no consistent definition for TOA.
At June 26, 2026 at 9:28 PM
You linked to what you believe to be OLR. But the graph has units of “radiance”, not “flux”. IOW, the collection method is flawed.
And you said it was ‘Not computer generated”, but the link says different (bold my emphasis):
“From theoretical radiative transfer calculations using a model that accounts for spherical geometry…”
“Since climate models generally use a plane-parallel model approximation to estimate TOA fluxes and the earth radiation budget…”
“…comparisons with plane-parallel climate model calculations are simplified since there is no need to explicitly correct plane-parallel climate model fluxes…”
At June 26, 2026 at 9:33 PM
NO, you did NOT “just described the correct GHE”. You described solar heating with insulation. If you’re going to stick with that description, fine. But that ain’t what your cult is claiming. Like I stated to blackbody barry: If you can’t come up with a consistent, succinct, viable definition/description of the GHE, and I’ll give you 100 words, then you’ve got NOTHING. And, you MUST use CO2 in any effort, since water vapor is as natural as rain.
And of course you don’t agree that the K-T “energy” diagram is bogus. You have no problem with all the flaws I indicated, such as the atmosphere emitting more flux to the surface than to space!
June 26, 2026 at 9:47 PM
Up to this point, you have avoided insults and false accusations. You just linked to things you don’t understand, and interpreted them incorrectly. But now you revert to your childish ways. Here, you combine all that in your failed attempt to violate 2LoT.
But, I’ll let you discredit yourself:
At June 26, 2026 at 10:13 PM
You don’t accept that the “plates” nonsense is completely debunked. That’s because you can’t come up with a correct diagram of the flows if the plates are in exact contact. And that’s because you don’t understand the relevant science.
And, it’s the same for the Moon issue. You have no viable model of “orbiting without spin”. You have avoided that issue for years.
Clint R
CERES uses 20 KM for TOA.
https://ceres.larc.nasa.gov/resources/faqs/
They have to account for things such as how high up a satellite is doing the measurements. They can use conversions to turn radiance into Watts/m^2 once you know some variables. They do use math to determine, from the actual measured values, what the energy would be at their TOA choice value. There are calculations. If you mean computer generated to put measured data into a computer program designed to convert it to use able information there is no problem with that. The term “computer generated” in current times might indicate totally fabricated like many AI images are. This would not be the case. The satellites have spectrometers on them that have varied signals at different wavelengths, frequencies or wave numbers and they convert this raw data into meaningful information. The raw signal is probably just some current generated by a phototube. The instrument has to be properly calibrated so this raw signal is converted to useful information.
YOU: “And of course you don’t agree that the K-T “energy” diagram is bogus. You have no problem with all the flaws I indicated, such as the atmosphere emitting more flux to the surface than to space!”
You should agree with the K-T on that point. The gases are the same but at different temperatures. The gases near the surface are much warmer than the gases above so of course the surface gasses would emit much more energy than those higher up in the cooler part of the atmosphere.
Clint R
So basically you will ignore observational evidence that directly contradicts your point that a surface emitting more flux cannot be warmed by a lesser flux. Not much I can do with you on that one. You go to your patent meaningless point of me not understanding a link. That is acceptable for you but it is not a valid point at all. You are protecting your ego. I showed clearly your point is wrong and you are not able to defend it with valid points so you divert to me not being able to understand the link. Not sure what you think I don’t understand. It has Watts/m^2 flux on the left and temperatures of air and case of measuring device below. Not too much to not understand. Explain what you think I am not getting correct. It would be interesting if you would do this. But your current method protects your ego, much easier for you to do this than admit everything you believe about heat transfer is wrong.
On the Moon thing. I have given you explicit facts of why the Moon shows the same side and has to orbit once per orbit to do this by giving you examples of real world orbits where ISS has to rotate once on its axis (360 degrees) in order to keep its instruments pointing at Earth. With some logic you can answer your own question of a viable model of rotation about an axis as it orbits with the ISS. The logical thought process is that the surface viewer would see all sides of the ISS and the instruments would would point away from the Earth every half orbit if they did not force the rotation.
Norman, you have cut down on the childish insults and false accusations. You’re doing much better, and I appreciate it.
Now, we need to work on your endless blah-blah. That’s a technique used by people who really have no science. You can see it used by several others here. So, it’s always best if you don’t have the science, then just don’t say anything.
For example, if you don’t have a viable model of “orbiting without spin”, just admit it, or keep quiet. You don’t need to ramble on and on with stuff like:
What all the blah-blah says is, if you only see one side of it, then it is spinning! That’s just restating your false belief. It ain’t science.
It’s the same with your “example” of the Surfrad instrument readings. If you drew a simple diagram of your beliefs there, I think you would see your mistakes. If not, draw a simple diagram, link to it, and I’ll help you with it.
And you’re still confused about the bogus K-T “energy” diagram. Somehow you believe it is okay for the atmosphere to emit more down than up. What you don’t see is the inconsistency with the rest of the CO2 nonsense. It is constantly claimed that layers of the atmosphere emit the same up as down. It can’t be both.
So I see much improvement, but there’s still work to be done. Unlike with several others here, I believe you can get there.
Clint R
YOU: “And you’re still confused about the bogus K-T “energy” diagram. Somehow you believe it is okay for the atmosphere to emit more down than up. What you don’t see is the inconsistency with the rest of the CO2 nonsense. It is constantly claimed that layers of the atmosphere emit the same up as down. It can’t be both.”
Each layer (probably not so thick) is at some temperature so it radiates the same up and down. Not too confusing. The lapse rate is between 6.5 and 9.8 C/km. So the change relative to thickness of so called layers is not significant. Each layer as you move up is slightly cooler than the layer below so it radiates slightly less energy up and down. When you go through the entire thickness of the atmosphere (we will use the 20 km CERES uses for TOA) it is considerably warmer at the surface than at the TOA so the GHG at surface will radiate more than the same molecules at much colder temperature. I see no confusion here at all. Simple basic physics. Emission is temperature dependent.
https://www.britannica.com/video/rotation-Moon/-207328
Viable model of what happens if the Moon did not rotate once on its axis per orbit. You would see the “Dark Side” of the Moon. All sides would be visible. That is the model of a non-rotating Moon.
Those are two more examples of your blah-blah, Norman.
In the first one, you’re trying to justify the inconsistency in your cult’s nonsense. You’re trying to cover up for them. If each layer is emitting the same up as down, then the entire atmosphere must be emitting the same up as down.
In the second example you’ve come up with a “model of a non-rotating Moon”, but you needed a “model of orbiting without spin”.
In neither example are you practicing science. You’re practicing fraud. That’s what you need to work on. I don’t think you really want to be fraudulent.
This Moon issue is very interesting, as it’s easier to understand than radiative physics and thermodynamics. Most people can understand spinning versus orbiting. But you see frauds like Bindi trying to cover up for the Moon cult. He has claimed that we couldn’t land on Moon if we didn’t understand it is spinning! The Moon cult has gone so far as to invent “tidal locking”, which is easily debunked with first year physics.
Remember, REAL science goes hand and hand with “reality”. I see you calling out the nonsense from people like gordon, but you need to also call it out from the frauds in your cult.
Clint R
I am not covering up anything. I do not know what your sources are actually saying about layers. If a layer is considered one meter thick the temperature within that meter is not changing. The next meter up is 0.01 C cooler. Not significant but cooler. If you go up 1000 meters the layer is 10 C cooler and will emit noticeably less IR
I do not see what your complaint is. A given layer will radiate same up and down. Yhe layer above will radiate a wee bit less up and down than the layer below. There won’t be much difference in the nearby layers but it becomes significant over many layers!
To see the errors in your beliefs Norman, make a simple diagram of 3-5 layers, with each upper level cooler. Show the temperature of each layer, and the associated flux up and down.
When you realize that’s impossible, you’re there….
“If there were fewer radiative gases, Earth would be warmer.”
True for ozone and SO2 (and reflective gases/particles), false for GHGs.
Reduce every radiative gas by 50% and the Earth would become drastically cooler.
Just look at the data for the last million years of ice ages and interglacials. 40% changes in atmospheric CO2 concentration tracked the rise and fall of global temperatures in opposite sign to the contention in the quoted sentence.
Gordon Robertson
You continue to post false information. You have zero shame! You lie with authority! Still wrong. If you were not so incredibly lazy you could quickly look up how kinetic energy goes down in an orbiting object when you add energy to it and it goes to a higher orbit. I am not at all confused or wrong. You are just so lazy you have no abolity to look things up. Sad as can be! Lazy and wrong and proud of it! You are not in a good place with your mind!! Look it up Gordon before telling me i am confused!!!
Gordon,
How come Mercury moves faster than all the other planets?
Centrifugal force proportional to velocity has to counteract gravitational force. There, no EMR to deal with.
What say you Stephen.
Do electrons orbit the nucleus?
I think there is so little we understand about nature we’re not much farther than Millikan’s oil drop experiment. It is all experimentation and conjecture.
What affects circulation in the tropopause and the blocking of zonal circulation?
https://i.ibb.co/0j29g90F/gfs-o3mr-150-NA-f000-2.png
https://i.ibb.co/5WB6V19G/SV-n-f.png
SOLAR MINIMUM UPDATE
Top: fictional forecast for August 2050, broadcast by French TV in 2014 to warn about the consequences of global warming.
Bottom: Real French forecast for yesterday, June 22, 2026.
https://bsky.app/profile/abbeyarletto.bsky.social/post/3moy4t7aljk2y
More likely a UHI effect. Unlike 1538 39 and 41 three years of blistering temperatures and devastating famine with major rivers drying up,parts of the Black Forest had shed their leaves by July, in Somerset men dangled their legs I huge cracks in the dry ground,the Thames, Avon ,and Trent were bone dry, many deaths were recorded,both human and animal.its a shame we have no temperature records for those years, before CET parish records show many short term heat events all across Europe, even during the little ice age temperatures were extreme at times,my friend who has studied temperatures for decades is convinced we have got the effect of emissions since the industrial revolution all wrong,he says humans have been cooling the planet not warming it,the clue is in the fact that all attempts to stop or slow the warming are failing,the closing of coal fired power stations have produced no result,the switch to EVs no result, the shipping revolution has changed nothing, the planet began warming at the beginning of the interglacial and with interludes of cooling has not stopped the LIA is a perfect example of emissions cooling the planet,many explosive volcanic eruptions during that period, to some respects the industrial revolution continued the trend
C’mon, Ian:
https://www.bbc.com/news/articles/cwy0pdq89zno
Please stop saying stuff.
Ian Brown
“More likely a UHI effect.”
Highly implausible.
Anthony Banton, a former meteorologist for the UK Met Office, posted the radiosonde sounding from Cornwall.
He notes that at 850 mb (roughly 1.5 km above sea level and well above the urban boundary layer), the air temperature was still an exceptional 22.8°C.
Here is the Skew-T diagram:
https://wattsupwiththat.com/2026/06/24/some-revealing-screen-dumps-from-the-uk-met-office-website/#comment-4210732
If you’re not familiar with Skew-T diagrams: the right hand black line is the air temperature and the left hand black line is the dew point.
The vertical axis is pressure, while temperature is read along the diagonal isotherms, not by moving straight across or straight down (as you would on a Stuve diagram).
You need to stop denying the seriousness of global warming.
P.S. I know the Camborne sounding only tells us about the air mass over southwest England. But given that this heatwave is covering much of Western Europe, I am inferring that France was also under an exceptionally warm lower tropospheric air mass, though the exact profile would vary by location.
Eldrosion,
So what the jet steam is very complex and is not behaving in a linear way. During the winter we get Jetstream loops that cause excessive cold and snow, but strangely the global warming fanatics did not seem to say anything other than more solar panels are needed.
These same jet stream loops are causing extra warmth and now all those fanatics are jumping up and down saying it’s run away global melting.
Even the IPCC have thrown away their worst case scenario as being impossible.
I have as poor view of the IPCC but compared to the activists the IPCC is mild in comparison.
Anon for Q-related reasons,
Are you sure you have an open mind?
Teh Donald is not the first narcissist to get trapped by a Reflection Pool.
Anon for a reason
The point was not that the jet stream doesn’t matter. Of course it does. Individual heatwaves require a favorable weather pattern.
The “so what” is that heatwaves in Western Europe are increasing in both frequency and severity.
That means heatwaves like the present one – and the one 23 years ago –
(where the death toll in France overwhelmed morgues and forced authorities to use refrigerated trucks and cold storage facilities to store bodies:
https://www.independent.co.uk/news/world/europe/french-heatwave-bodies-kept-in-temporary-storage-5353657.html?)
are unlikely to represent the upper limit of what the region could experience.
The worst has yet to come.
Willard
The astonishing thing about these temperatures in France is that it’s still only June, yet they are comparable to those recorded during the devastating European heatwave of August 2003.
https://www.nbcnews.com/world/europe/europe-heatwave-record-temperatures-france-uk-germany-eiffel-tower-rcna351525
Unfortunately, this is no surprise.
Berkeley Earth estimates France’s warming trend at 2.6°C/ century, ±0.21°C since 1960:
https://berkeleyearth.org/temperature-region/france
Stephen P. Anderson, this is getting really, really scary.
Contrary to your claim, the evidence points to a global warming problem, not a global cooling problem.
Eldro,
Our temperatures during this interglacial are within the natural variability of preceding interglacial periods. We can feed people during warm. We can’t feed people during cool.
Our current rate of change has very little to do with what started 12K years ago.
Yet the hysteria continues, it’s summer for God sake,deal with it like people of the past dealt with it,1976 19 days over 30 c , no hysteria just a few laughs, the first time in a court room barristers were allowed to remove their wigs.
Stephen, contemporary temperatures lie outside the range of natural variability observed during this interglacial:
https://www.pnas.org/doi/10.1073/pnas.1616287114
There’s something about “France records hottest day ever” that seems to escape our troglodytes:
https://www.nbcnews.com/world/europe/europe-heatwave-record-temperatures-france-uk-germany-eiffel-tower-rcna351525
“devastating European heatwave of August 2003.”
And to provide some additional context:
https://archive.ipcc.ch/publications_and_data/ar4/wg2/en/xccsc1.html?
Back then, 2003 was the Big One.
*worried gulp*
Meanwhile, the temperature at the North Pole is lower than the average for the years 1958–2002.
https://i.ibb.co/Xx78XVCx/daily-ts-2026.png
Will the whole summer in Europe be hot? I doubt it.
https://i.ibb.co/m5Z6Z4ph/cdas-sflux-sst-atl-1.png
Typical English summer in the North of England,3 fine days and a thunderstorm,storms began last night as temperatures fell away,now 21c and very heavy rain.
The algal blooms in Washington are a small but potent allegory of climate change. They were almost certainly boosted by the change in albedo of the pool bottom, causing the water to warm. They are also thereby a nice lesson in unintended consequences, as well as the first historic case of a “President” outwitted by a unicellular organism.
I might also mention that narcissists have what the British refer to as “form” where reflecting pools are concerned.
Elliot Bignall,
Are you sure that’s what happened?
In the UK canal restoration have been sabotaged by algae that are not native to Europe let alone the UK! The only way that type of algae occurs is if someone places it there. Then the UK puts a preservation order on the canal that stops the restoration.
I have an open mind about how the algal bloom occurred and why. Seems as if you know the answer without any further questions.
stephen…”When molecules ab-sorb energy, their internal energy is increased. IR energy doesn’t involve electrons moving to a higher state, so the extra energy has to be realized in some fashion. It has to be kinetic or potential energy. The molecules are moving and the energy is dissipated by either radiative emission or thermalization which is conduction and convection”.
***
Stephen… thanks for response. The problem with talking at the molecular level is that is misses a lot of the real action, which takes place at the atomic level, especially at the electron level.
What internal energy? The only internal energy in a molecule is the sum of the internal energies of the atoms that make up the molecule and the only variable really is in the internal energy of the electrons. Nothing in the nucleus varies a lot.
A molecule is simply a convenient name for describing different aggregations of atoms, and the atoms need to be joined in certain ways by valence electrons. Without electrons and the positive charges in the nucleus there can be no molecules.
Another major factor in molecules is electronegativity as defined by Linus Pauling back in the 1930s. Again, electronegativity is about electrons and the ability of certain atoms to have a higher propensity for electric charge than others. Electronegativity has a major impact on the shapes of molecules.
Example…co2…
O=====C=====O
A linear molecule made up of 2 oxygen atom and one carbon atom. However, a main property of the molecule is the dashed lines which represent electron bonds that hold the oxygen and carbon atoms together.
Here the higher electronegativity of both oxygen atoms acts to repel each other equally, producing a linear molecule. Also, the higher electronegativity of the O-atoms makes them relatively more negative than the C-atom, which in turn is relatively more positive than the O-atoms, creating a dipole effect. In other words, electrons in a bond tend to spend more time around atoms with higher electronegativity, producing a dipole action.
All EM, whether IR, UV, or light frequencies, are absorbed and emitted by those electrons making up the dashed lines. I mean, what else is there in an atom or a molecule that has the ability to interact with electromagnetic radiation? EM has an electric field orthogonal to a magnetic field, both with the same frequency, and both were produced initially by the electric and magnetic fields of electrons. Birds of a feather and all that.
Oxygen even radiates in the much lower microwave spectrum. The mistake made in textbooks is attributing this to molecular rotation and that is misleading. It is the nature of the diatomic bonds in O2 that cause the radiation and those bonds are electron bonds. Ergo, it is electrons radiating, not a molecule per se. There is nothing in a molecule that can radiate other than electrons.
Same with IR radiation/absorption. The hydrogen atom radiates in the IR spectrum naturally and it depends on how many orbitals an excited electron drops. If it is excited say to orbital level 7, and drops right back to ground state, it emits UV radiation. If it just drops to orbital 6, 5 or 4, it emits IR. Transitioning electrons are capable of emitting a broad range of frequencies from the microwave up to UV and beyond.
The governing equation for a photon frequency emitted is…
f = Rh.c(1/Nf^2 – 1/Ni^2)
f – photon frequency
Rh – Rydberg constant
c = speed of light
Nf = final orbital level number
Ni – initial orbital level number
If you work this out for hydrogen from orbital level 6 to orbital level 5 you get a photon emitted of 7460 nm which put the photon in the infrared region of the Pfund series. Note that 7460 nm is equivalent to 7.46 um and that would have to be converted from the calculated frequency, or by using 1/lambda rather than f, where lambda is wavelength.
I have no idea where the info came from that electrons cannot emit IR.
There is nothing else in a molecule that can do that, only electrons. The reason they can do it is their electric and magnetic fields which interact naturally with the electric and magnetic field of an EM wave. And, at that, the electrons can only interact at super-discrete frequencies, I presume, due to the resonant nature of their angular frequencies and the frequency of the EM.
Protons in the nucleus could theoretically emit EM however, they are generally not moving fast, as is an electron. That’s why, in a copper conductor, it is the electrons and their charges that emit EM from the conductor.
You won’t hear that from someone engaged in quantum theory since they use such convoluted mathematical-based theories which have convoluted the reality so much it cannot be recognized. That’s why Einstein objected to such QM theories even though he convoluted relativity theory in much the same way. He held out for a real physical explanation and e are still waiting.
There was a guy in my class in electrical engineering who was astounded to learn the ‘L’ in e = L.di/dt was a real coil of wire, an inductor. It would not surprise me if physics students studying quantum theory had no idea that the basis of the theory is electrons and their relationship with an atomic nucleus.
You are hearing it from someone who has specialized in electronics theory for decades and for whom the reality is closer to home. We, in the electronics field, cannot waste time with Schrodinger’s wave equations, which is based in probability theory, we have to understand how electrons work in a circuit and how they interact with electromagnetic radiation.
When you are trying to understand how electrons flow in a transistor circuit, it’s not at all helpful to get hung up on deep quantum theory. Simple Ohm’s Law, E = IR, tells us much more. It tells us that if you apply a voltage, E, across a resistor R, we can expect a current I to flow. That is far more valuable when analyzing a circuit than convoluted quantum theory. Of course, circuit design, requires a more in-depth understanding but quantum theory, which is the basis of electronics theory, is not at all helpful.
BTW…I took a course in organic chemistry in first year and what I studied there closely jives with what I am saying here. I am open to having my theories corrected but thus far all I have received is ad homs and insults. Your replies are the among the only sane replies I receive, most being of the insult variety, accompanied by zero scientific rebuttals.
Normally, I do not comment on your crap, but this one is just too rich. You have precisely misstated internal energy.
Your quote:
“What internal energy? The only internal energy in a molecule is the sum of the internal energies of the atoms that make up the molecule and the only variable really is in the internal energy of the electrons. Nothing in the nucleus varies a lot.”
That is precisely wrong. It could not be more wrong! It is the degrees of freedom in the atomic bonds which includes angles, lengths, and the relation to neighboring atoms, that determines the enthalpy contribution to the internal energy of a molecule at a given temperature. It is the flexing and vibration in those bonds that store energy. As I have tried to explain before, it is that same mechanism that produces the radiant spectrum. This is why small molecules that have high specific heat also have very active radiant spectra.
I do not need to look this up or provide you with a reference because I know the subject matter.
Do not reply. I am done with you.
Gordo,
Do you understand what magic is? It is technology so advanced that it appears as magic. That is our universe and everything in it. We will keep trying because that is our Creator’s purpose, but I don’t think we will ever comprehend. Also, ignore Tim S. He is a mental midget.
In the absence of an atmosphere, and without significant internal heat sources, it is straightforward to calculate the solar radiation absorbed by the surface of a planet and its re-emission as infrared radiation to space, and hence the surface temperature.
The daytime temperature on Mercury’s equator is about 800°F and emitted power ~23,000 W/m², while the temperature in the same place at night is -280°F and emitted power ~6 W/m², a difference of 1080°F and emitted power differs by a factor of ~3800.
The Moon at approximately the same distance from the Sun as Earth has a maximum equator temperature of 260°F and emitted power ~1450 W/m², while the temperature in the same place at night is −280°F and emitted power ~5.7 W/m², a difference of 540°F and emitted power differs by a factor of ~250.
If an atmosphere is present that contains infrared active molecules (which means, in general, those composed of different types of atoms, such as H2O and CO2) these control the amount of infrared radiation absorbed by the atmosphere, preventing it from escaping directly to space.
On Earth, the average difference between typical daytime and nighttime temperatures is vastly smaller. Typical desert daytime temperatures are 104°F and emitted power ~545 W/m², while nighttime temperatures are 68°F and emitted power ~418 W/m², a difference of 36°F and emitted power differs by a factor of only ~1.3.
An atmosphere serves to moderate surface temperatures on a planet. Planets with moderated surface temperatures are much less efficient radiators of energy.
The record high temperatures in Europe are due to a “heat dome”. That’s a blocking high-pressure system that maintains clear skies and prevents moisture from moving in. That means even higher temperatures due to reduced albedo.
It’s a weather event on top of a natural global warming trend verified by UAH, hence the record high temperatures.
The best forecasts show the “dome” moving east in the next few days. Central Europe should see cooling by first week in July.
“It’s a weather event on top of a natural global warming trend ..”
I invite you to analyse the UAH time series and demonstrate it is “natural”. I am assuming that you know how to analyse a time series and determine if the trend is statistically significant or not.
However, I will not hold my breath.
Done!
It’s all natural.
Now you can hold your breath.
“It’s all natural”
is like saying:
“It’s all magic”
Very scientific (not).
What’s magic? It is technology so advanced it appears as magic.
Good grief, Troglodyte:
https://en.wikipedia.org/wiki/Clarke%27s_three_laws
Technology isn’t magic. Magic isn’t technology.
It’s “any sufficiently advanced technology is indistinguishable from magic”.
Your private school did not teach you how to read?
Williard,
Good grief, “sufficiently advanced” is vague and I didn’t want to use that.
SOLAR MINIMUM UPDATE
Researchers from Sweden, Denmark, the United States, the Netherlands, Ireland and the United Kingdom collaborated to assess to what extent human-induced climate change altered the likelihood and intensity of the extreme heat in Western Europe. The analysis focuses on the 3 hottest days and nights over the most affected area (red outline, Figure 1), and additional analysis of the 19 capitals of the affected countries.
[…]
This summer shows that at 1.4°C of global warming, extreme heat is already reaching the limits of our societies’ ability to cope. Our analysis here shows that intense heat is increasing rapidly even in living memory, with such events tens to hundreds of times more likely since only 2003 and virtually impossible just 50 years ago. A rapid phase-out of fossil fuels is critical if we are to avoid even higher temperatures and their consequences in the future.
https://www.worldweatherattribution.org/fossil-fuel-emissions-have-rapidly-worsened-european-heatwaves-in-just-a-few-decades/
“A rapid phase-out of fossil fuels is critical if we are to avoid even higher temperatures and their consequences in the future.”
It’s almost like they’re getting paid to spread such crap, huh?
It’s as if you finally acknowledge that you never had any argument, Puffman. Riddle me this:
Who wrote that, and when?
I have sympathy for people who are suffering, but this story is just dripping with irony. Most of Europe already has Socialism well in place, but it is not working for them. They cannot even control their own carbon emissions, while the rest of the world just keeps on emitting poisonous carbon emissions that actually kill plants according to one very humorous study I read.
The UN IPCC RCP estimates are very clear that carbon emissions will continue to increase, not decrease for the foreseeable future. In the US, the Democrat Party is in the process of officially denouncing Socialism whether it is democratic or not. This movement is being led by none other than James Carville. Remember him?
Anyone who does not see that “the Climate Crisis” is being used as an excuse to implement Socialism is not really paying attention. Sometimes a person just needs a good laugh.
The US has had socialism for almost 100 years now. We pay a few hundred dollars a month while we work and when we reach a specified age we get several thousand a month for the rest of our lives along with subsidized health care.
> Socialism
With a capital S, no less.
Imagine if Tom honestly frowned upon misplaced political commentary.
Bob,
You don’t get the subsidized healthcare. You and your wife at a minimum will pay about $200 per month each for Medicare when you turn 65. You can apply for subsidized payments that can reduce your monthly payment. If you have TFL it will be your secondary. Also, social security can be taxed up to 85% of it. I hope Medicare is as far as we go to socialized medicine. I don’t want doctors and nurses working for the national health system.
Stehen,
Well, no because the 200 dollars is deducted from my social security payment.
With Healthcare roughly 16% of GDP, 200 doesn’t go very far, so yes my Healthcare is subsidized.
And with the current standard deduction as high as it is, I pay about 10% of our combined social security and pension in taxes.
tim s…” It is the degrees of freedom in the atomic bonds which includes angles, lengths, and the relation to neighboring atoms…”
***
This is a general reply to the statement of Tim S. He is in a snit and no longer wants anything to do with me.
Great science!!!
Yes…Tim…and the bonds to which you refer are electron bonds. The bonds are electrical orbitals!!! Any changes in the bond activity are changes in electron energy levels. The angles and lengths to which you refer are also due to electronegativity (electron charges) and variations in electron KE.
Of course, the electrons are interacting with the nucleus as well via differences in electrostatic charges, but the only variable element are the electrons, especially those in the bonding orbitals. It is the gain and loss of KE in electrons that account for all internal energy changes in atoms, hence in molecules.
The reason why you are wrong does not matter. Whether you are playing your game, or you are genuinely confused is not important. You are still completely wrong. This has nothing to do with orbital energy levels. The bonds involve orbitals, but the energy storage and the effect on enthalpy are a different matter that involves vibrations and oscillations of the entire atoms relative to each other in the molecule.
stephen…”Do you understand what magic is? It is technology so advanced that it appears as magic. That is our universe and everything in it. We will keep trying because that is our Creator’s purpose, but I don’t think we will ever comprehend. Also, ignore Tim S. He is a mental midget”.
***
I agree wholeheartedly, Stephen. The universe and life are miraculous and the more I experience either the more I am in awe of the creation. We are in good company, Isaac Newton agreed and had not the slightest compunction about giving credit to his Creator.
I have no idea why anyone can observe the universe with its inherent intelligence and think it all happened by chance. Even life based on the intelligence in DNA, is amazing. I am limited in that I gave up on belief systems a while back, so I live in the question.
Speaking of electrons, the entire universe is made up of different arrangements of electrons, protons, and neutrons…all mass and energy come from those arrangements. Yet, we know virtually nothing about why electrons zip around a nucleus…if they do…or why atom and molecules in gases, liquids, and solids are constantly in motion. We know there are constant collisions, but what causes their velocity and momentum in the first place.
If Bohr is right, why do electrons accept only precise amounts of energy to jump up to a higher orbital level. There is a super intelligence behind it all yet we don’t even know what intelligence (or energy) is.
Amazing stuff.
eldrosion…”“devastating European heatwave of August 2003.””
***
The 1930s decade in the US and Canadian prairies suffered a 10 year heat wave. Google AI summed it up as…” Unusually high sea surface temperatures in the Pacific and Atlantic Oceans disrupted normal atmospheric circulation”.
What caused a 10 year heat wave where records were set that have never been exceeded? Alarmist get around that today by basing their claims from 1960 onward.
Natural weather variations, folks. Tsonis et al did a study of the interaction of the Atlantic Multidecadal Oscillation, the Pacific Decadal Oscillation, ENSO, and other oscillations, concluding that when the oscillations acted in phase global temperatures rose and when out of phase the temps dropped.
Oscillations like the AMO and PDO were only discovered recently and little has been documented on them. We are so flooded with climate change propaganda and hysteria no decent scientist can get anything printed.
The problem today is the outright hysteria of those who believe this trash about a trace gas causing catastrophic global warming (CAGW) and catastrophic climate change. Time after time, alarmists have predicted the end of the world only to be forced to eat their words.
For CONUS, recent decades are warmer than the 1930s.
In fact, 1934 (the warmest year of the Dust Bowl decade) is only the 11th warmest year on record.
The top 10 warmest years have all occurred within the last 30 years.
https://www.ncei.noaa.gov/access/monitoring/climate-at-a-glance/national/time-series/110/tavg/12/12/1895-2026
Here is the same time series with a 10 year moving average applied to better visualize any potential cyclic variability:
https://tinyurl.com/2pmbydcb
Lots of drownings in France during the heatwave. 4 toddlers and 55 total, according to the Grauniad.
I’d frankly be astonished if the heatwave lasts much into July. The forecast is for storms and cooling starting tomorrow. The pattern in the recent ten years or so in Switzerland has been a partly or mostly glorious Spring and Autumn bracketing a wet and dismal Summer. For this weather to be sustained right through until October would represent a huge increment in heat for the whole year and a climatic step-change. I’m not fully au fait with the implications of el Nino for Western Europe, but my money’s on a couple of cooler months and an overall warmer year.
To illustrate how erratic the Alps can be, we had fresh snow on the Churfirsten about ten days ago, down to about 1500m, while yesterday there was not a trace to be seen, even in the shadowed gorges. The locals are saying you need to get above 3,000m to experience any cooling benefit at all.
I wouldn’t put any money on Iberia or Italy being cooler over Summer. Using that double weather forecast I linked to further up as illustration, it seems to me that the heatwave represents a pace of change that the science failed to anticipate, so any bets are really just from the gut at this point. Maybe the overall global trends are predictable, but not detailed regional effects.
Elliot Bignall,
Look at where the jet stream is at the moment as nd has been over the last couple of weeks. A few years ago in the USA had a lot of snow over some of their states causing no end of chaos. Their weather was exceptional, whereas ours in the UK was mild.
The jet stream is causing records to be broken at both ends of the spectrum at only some locations. The rest of the world is not being affected and if any thing a tiny bit milder.
The jet stream can be affected by many inputs and has never been steady.
I am getting some erratic behaviour from this blog. It is as though I am blocked, but the site forgets from time to time. I can post for a day or so, and then suddenly I start getting “403 Forbidden”. Then I wander off to annoy people at Bluesky for a few weeks, and when I come back here it works again for a day or so. Dr. Roy, have I been blocked? If so, it’s not working consistently. And if I haven’t, there’s a really annoying bug in the blog. Don’t worry, I won’t just crop up again calling myself “Anon something something” if I’m not welcome. I just need the monthly graphs for my fix.
Cheers, Elliott.
It is very much different on Venus…
Earth’s atmosphere is a thin and a transparent both ways – in and out – atmosphere doesn’t act as a warming blanket covering planetary surface.
We do planets and moons surface temperatures comparison.
The presence of atmosphere doesn’t warm Earth’s surface.
It is the other reasons, not the presence of atmosphere, that make Earth warmer than the Moon by +68°C.
–
https://www.cristos-vournas.com
6 Facts About Europe and Air Conditioning.
1/ Only about 19% of European homes have air conditioning. That’s less than the United States, of course. But it’s also less than Canada, which has a more comparable climate. Nearly 70% of Canadian homes have air conditioning or equivalent equipment.
2/ The United States doesn’t have the world’s highest rates of air conditioning penetration, by the way, although 88% of us do have some form of AC. The number one spot is held by Japan, where 91% of homes have cooling.
3/ Only 0.8% of European household energy use goes to space cooling. Again, for comparison, that’s about half the share of energy that goes to space cooling in Canada. (In the U.S., about 6% of household energy use goes to space cooling -and despite our warmer climate, far more energy on average goes to space heating in the winter.)
4/ That said, Europe is catching up fast, particularly in warm countries. Air conditioning penetration has more than doubled in Europe since 1990. More than half of Italian households now have air conditioning. That rate has nearly doubled since 2013, and it has grown much faster in southern Italy than northern Italy.
5/ The further north you go, the more the rates fall. About 28% of French homes and 13% of apartments have some kind of air conditioning. Only about 6% of German homes have AC.
6/ Just over 4% of British homes have air conditioning. What’s most striking to me, though, is that the elderly are most susceptible to heat-related death -and only 3% of households with someone over 75 in the UK have AC.
Arklady,
Your comparisons are virtually useless. Europe and north America are large and can be sub divided into many different climate systems. Trying to compare New England with Arizona is daft. Trying to compare Greece with Scotland is pure Willard.
On your point 6 about the UK, we don’t tend to have AC units in homes due to the building stock and planning regulations. Places like London have had air con units but are now being forcibly removed by the climate activists in the councils.
Do you think it’s right that in a place like London, which is known to be a huge urban heat island, air con units are being removed?
“Do you think it’s right that in a place like London, which is known to be a huge urban heat island, air con units are being removed?”
–
No, it is not right! They are life safers. They produce much less heat than vehicles. Much less than ambulances.
Whem heat wave strikes keep the windows closed, not to let sun in and use air condition unit.
–
https://www.cristos-vournas.com
Not Gordon Robertson promoting the trace gas argument….
Eldro,
It is a trace gas. The trace gas is a good argument. Water and CO2 are approximately 0.3-0.4% of the atmosphere. Don’t you think the Master Designer knew we would discover fossil fuels? Don’t you think he put them there for us? So, you think he put them there so we could destroy ourselves? The planet is very resilient, as designed.
Bordo would never go “but trace gas”.
Except once a month or so in 2025, e.g.:
https://www.drroyspencer.com/2025/09/the-hottest-summer-days-in-the-u-s-have-barely-warmed-in-the-last-40-years/#comment-1716070
And in 2024, e.g.:
https://www.drroyspencer.com/2024/10/nc-floods-ca-drought-and-the-role-of-randomness/#comment-1693441
In 2023 too, e.g.:
https://www.drroyspencer.com/2023/06/epic-fail-in-americas-heartland-climate-models-greatly-overestimate-corn-belt-warming/#comment-1502811
And in 2022, e.g.:
https://www.drroyspencer.com/2022/11/canadian-summer-urban-heat-island-effects-some-results-in-alberta/#comment-1400492
He did the same before that, but his rants are now harder to retrieve.
April 2009:
https://jennifermarohasy.com/2009/04/role-of-water-vapour-in-climate-change/#comment-93085
I think the Bank of England might be the start of a fissure in the banking system.
Is the US becoming an Oligarky like Russia?
“Trump Cut a Billion-Dollar Mining Deal. His Sons Stand to Profit”
“An agreement between the U.S. and Kazakhstan has given a group of American investors with ties to the president and the commerce secretary access to one of the world’s largest untapped reserves of tungsten.”
“Within weeks of the St. Regis negotiations, investors with a firm called Dominari Securities, which is housed at Trump Tower in New York and partly owned by the president’s two eldest sons, Donald Trump Jr. and Eric Trump, joined with other partners to take a 20 percent stake in the Kazakhstan project.”
“Around the same time, Cantor Fitzgerald, an investment company controlled by Mr. Lutnick’s family and overseen by his sons Brandon and Kyle Lutnick, helped one of the lead investors working with Dominari on the Kazakh deal raise $210 million in new capital for a related entity. Such rounds of fund-raising typically net Cantor millions of dollars in fees”
“The arrangement is hardly an outlier. One or both families have financial ties to at least 14 companies that are actively working with the federal government on critical mining deals, including the Kazakhstan project, according to federal filings examined by The New York Times.”
NYT 6-27-26
That Dominari Securities is probably a pretty good group to be with.
NatWest,
Did you keep track of all the deals that the Clintons, Biden , and of course Obama were involved with?
Do you know how much fraud against the American tax payers increased due to the democrats? Or is it that you benefit from the fraud yourself,?
How about the way the democrats keep the poor in poverty due to enabling open borders?
Perhaps you need to look at your own side first
Anon for a reason
I can agree with you both Parties have issues and it is the responsibility of the American Citizens to end it when it occurs by voting out those involved and not allowing them back in positions of power.
The issue is also Republican Party is considerably more corrupt than the Democratic Party (which is a very sad thing).
https://rantt.com/gop-admins-had-38-times-more-criminal-convictions-than-democrats-1961-2016
Another thing to consider is most Presidents, when caught at some scheme, backed off. They were concerned how things looked and would shift course. Not with Trump. He is corrupt as can be out in the open and his Worshipers (at least one on this blog, stephen p anderson seems to glorify him) let all this slide and are okay with all of it. He does not care that his actions cause anger or upset. He does what he wants regardless. He acts as a Tyrant not a President. It is really sad he has such brain dead loyal followers. I know Mr Anderson is a fanatic and does not seem to possess rational thought. He is just pure emotion fed by right-wing lies. Are you also of this type of mind. Unable to see Trump and MAGA are totally against everything the Founders set against??? Trump has enriched himself and family considerably during his Presidency.
Norman,
Until the dust settles and it’s agreed what constitutes as fraud then it’s opinion & feelings that one side has committed more fraud & corruption than the other side.
Personally I find the Democrats use of USAID and not wanting to audit any social programmes or allowing non citizens of USA to vote is beyond reasonable.
The odd business deal that the media has focused on might or might not be an issue. As we don’t have all the details it becomes back to opinions. There is the letter of the Law which meant that Trump was found civilly guilty of New York tax code but some argue that it was within the spirit of the law.
“Did you keep track of all the deals that the Clintons, Biden , and of course Obama were involved with?”
Anon
What you are doing here is called Whataboutism.
Its excusing corruption happening right now in front of our eyes, on the regular, because somebody in the past supposedly did some bit of that, which got them in political doo doo or worse.
And that makes it OK.
And you can’t figure out where that attitude leads us?
Nate,
It’s not called whataboutism it called highlighting the hypocrisy of those like yourself.
Can you point to o even a single post of yours that called out Obama, Clinton or Biden.
Can you point to one of your posts that actually condems the democrats for their corruption and their facilitating Hugh fraud both monetary and voting?
You are on par with Bindy for gaslighting.
Anon,
These two, Nate and Norman, are a couple of Marxists. There are many others here. Their propaganda is about advancing their agenda, not science. Thank you for your posts. Keep it up. They will continue to try to silence you.
Troglodyte and Anon for Q-related reasons are making Tom sad:
https://abcnews4.com/news/nation-world/welcome-but-be-good-trump-shares-new-us-passport-rendering-president-of-the-united-states-250-250th-anniversary-celebration-commemorative-design-america-traveling-flying-fourth-of-july-4-independence-day-president-donald-trump
Why would it say “welcome” when passports are for US citizens??
Nate has outdone himself with this one. This comment is so bizarre it appears to be satirical, but Nate is not joking. In order to criticize Capitalism, one must first understand Capitalism.
An investment of capital involves a risk for which the investor expects to make a profit. When that involves a foreign country, that country is also expecting a benefit. In this case, the benefit is access to technology and engineering experience. Everyone benefits including the workers who will be employed by the project.
This is in contrast to the Biden Crime Family with their 20 shell companies to hide their corruption. And then there is Hunter and his famous laptop. By the way, the laptop is real as verified by his pro bono attorney. It was not “Russian disinformation” as claimed by all of the liberal media without one bit of research or verification. That research was done by Tucker Carlson on FOX who interviewed the guy who verified everything in the emails. None of the other networks attempted to interview Tony.
We could also discuss “the most traveled Secretary of State” in the history of the US and her private server to conceal the deals made, or at least offered for contributions to the Clinton Foundation. Other than providing Chelsea with a high paying job, and luxury travel for the Clintons, what was achieved by the foundation?
Well this comment isn’t at all biased. The Trump family is making money off the presidency, and Trump himself is doing it openly and flagrantly, and not a whisper from self-described neutral Tim.
If you want to credibly complain about government corruption, then you have a trove of examples from the current presidency to include in your example set. These transgressions are glaring and well-reported.
Because you don’t, you exhibit such extreme partisanship that you just can’t be taken seriously. Not to mention that your view of Biden Jrs’ laptop is also heavily slanted.
Let me show you what neutrality looks like. I queried an AI:
The Case For: Evidence Suggesting Profiteering
Proponents of this argument claim that Hunter Biden’s entire career was built on selling access to his father, and that Joe Biden was a willing participant in creating the impression of influence.
The “Big Guy” Email: A May 2017 email on the laptop from Hunter’s business partner, James Gilliar, outlined equity stakes in a joint venture with Chinese energy company CEFC. It noted that 10% of the equity would be “held by H for the big guy.” Tony Bobulinski, another former business partner, testified under oath that “the big guy” was an explicit reference to Joe Biden.
The Burisma Timing: Hunter Biden joined the board of Ukrainian energy firm Burisma in 2014, earning up to $50,000 a month, despite having no experience in the energy sector. At the exact same time, Vice President Joe Biden was the Obama administration’s point man on U.S. policy toward Ukraine, creating a severe appearance of a conflict of interest.
The Shokin Ouster: In 2016, Joe Biden successfully pressured Ukraine to fire its top prosecutor, Viktor Shokin, by threatening to withhold $1 billion in U.S. loan guarantees. Shokin had been investigating Burisma. Critics argue this was a direct intervention to protect Hunter’s employer.
Business Dinners and Phone Calls: Testimony from another former partner, Devon Archer, revealed that Hunter placed his father on speakerphone during business dinners around 20 times over a decade. Additionally, Hunter brought foreign business associates to a dinner with his father at Washington’s Café Milano in 2014 and 2015. Critics argue this was Joe Biden providing the “brand” and access his son was selling.
The Case Against: Evidence Showing No Profiteering
Opponents of this argument maintain that while Hunter Biden may have been sleazy in using his last name for leverage, there is zero evidence that Joe Biden ever altered U.S. policy, took a bribe, or financially benefited.
No Financial Linkages Found: Despite multi-year investigations by the House Oversight Committee—which subpoenaed over 150 suspicious activity reports from banks and thousands of pages of private bank records—investigators failed to find a single bank account or wire transfer showing Joe Biden receiving money from foreign entities.
The “Big Guy” Deal Never Happened: The 2017 Chinese venture discussed in the “big guy” email collapsed completely. No money or equity was ever distributed under those terms, and Joe Biden was a private citizen in May 2017, meaning he held no public office to abuse at that time.The Consensus on Shokin: International institutions, European allies, and anti-corruption activists in Ukraine all demanded Viktor Shokin’s firing because he was not investigating corruption, including at Burisma. Joe Biden was carrying out official, bipartisan U.S. and Western foreign policy, not a personal vendetta.
The “Illusion of Access”: In his congressional testimony, Devon Archer explicitly stated that Joe Biden never discussed business on those speakerphone calls, which were limited to casual pleasantries about the weather or geography. Archer stated that Hunter was merely selling the “illusion of access” to appease his foreign benefactors, without his father’s active participation.
The “H for the Big Guy” Alternative Explanation: Hunter’s defense and personal text messages on the laptop suggest he routinely used his father’s name to inflate his own worth to foreign tycoons while keeping his father entirely in the dark. Hunter often complained in texts to his daughter that unlike other political families, he had to pay for everything himself and that his father did not help him financially.
To balance your post, here is a list of profiteering from the most recent president. (AI – I asked for only the most well-verified instances)
——————————————————–
The question of the Trump family profiting from the presidency focuses on the intersection of Donald Trump’s private business empire and his family’s official roles. Unlike previous presidents, Donald Trump did not divest from his businesses; instead, he placed them into a revocable trust managed by his sons, allowing him to retain ownership and profit from them while in office.
The most well-verified instances of the Trump family profiting from the presidency, corroborated by federal spending records, congressional investigations, and mandatory financial disclosures, include the following:
1. Government Spending at Trump Properties
Because Donald Trump frequently spent weekends and vacations at his own commercial properties, the federal government spent millions of dollars of taxpayer money directly at his businesses.The Secret Service Charges: According to records obtained via Freedom of Information Act (FOIA) lawsuits and congressional probes by the House Oversight Committee, the Secret Service was charged up to $1,185 per night for rooms while protecting Trump and his family at properties like Mar-a-Lago and the Trump National Golf Club in Bedminster. In total, taxpayers paid the Trump Organization over $1.4 million for room rentals, golf cart rentals, and resort fees.
The Turnberry Stopover: In 2018, a U.S. Air Force crew stayed at the Trump International Turnberry resort in Scotland during a routine refueling stop, sparking a congressional inquiry into why military personnel were routed to a president-owned luxury resort.
2. Foreign Government Spending
The Constitution’s Domestic and Foreign Emoluments Clauses prohibit a president from accepting gifts or money from foreign states without congressional approval. However, foreign governments frequently spent money at Trump properties.The $7.8 Million Report: A comprehensive 2024 report by the House Oversight Committee minority, using documents obtained from Trump’s former accounting firm, Mazars USA, proved that at least 20 foreign governments spent a combined $7.8 million at Trump-owned properties during his presidency.
Top Spenders: The largest spender was China, which spent over $5.5 million renting space at Trump Tower in New York and booking rooms at the Trump International Hotel in Washington, D.C. Saudi Arabia, Qatar, Kuwait, and Malaysia also spent hundreds of thousands of dollars hosting diplomatic events and booking blocks of luxury suites at his D.C. hotel.
3. Domestic Special Interest Spending
Domestic political groups, lobbyists, and trade associations frequently moved their annual galas, fundraisers, and conferences to Trump properties to curry favor with the administration.Political Spending: According to OpenSecrets data, the Republican National Committee (RNC), Republican campaigns, and conservative political action committees (PACs) spent more than $20 million at Trump properties over the course of his presidency.
Corporate and Trade Groups: Groups like the T-Mobile corporate executive team booked large blocks of rooms at the Trump International Hotel in D.C. in 2018 while actively lobbying the executive branch to approve a high-stakes corporate merger with Sprint.
4. Kushner & Ivanka: Intellectual Property and Foreign Investment
Donald Trump’s daughter, Ivanka Trump, and son-in-law, Jared Kushner, served as senior White House advisers. Because they did not fully divest from their private financial ventures, their official actions faced intense scrutiny.
Chinese Trademarks for Ivanka: In 2018, while Ivanka Trump was serving as a White House adviser and participating in official trade negotiations, the Chinese government granted her fashion brand approval for multiple valuable commercial trademarks. Critics noted the unusually fast approvals coincided directly with diplomatic concessions made by President Trump to Chinese telecom companies.
Affinity Partners ($2 Billion Saudi Investment): In 2021, immediately after leaving his White House role—where he oversaw U.S. foreign policy in the Middle East and maintained a close relationship with Saudi Crown Prince Mohammed bin Salman—Jared Kushner secured a $2 billion investment from the Saudi Arabian sovereign wealth fund for his newly formed private equity firm, Affinity Partners. A panel of Saudi financial advisers initially rejected the investment due to Kushner’s lack of private equity experience, but the fund’s overarching board, led by the Crown Prince, overrode them to deliver the funds. Kushner’s firm has collected tens of millions of dollars in annual management fees from this arrangement.
5. The Washington D.C. Hotel Sale
The Trump International Hotel in Washington, D.C., located in the government-owned Old Post Office building, served as the primary hub for foreign diplomats and lobbyists seeking access to the administration.In 2022, after Trump left office, the Trump Organization sold the lease to the hotel for $375 million.
An independent investigation by the House Oversight Committee concluded that the sale price was significantly inflated due to the brand value built up by the hotel while Trump was in office, netting Donald Trump a personal profit of approximately $100 million from the transaction.
I’ve now read through the comments above. So you were ‘balancing the books’, too, huh?
If you genuinely carry outrage against government corruption – instead of simply carrying a partisan blowtorch – then you should currently be livid about the Trump family, as they have broken all US records for abusing power for gain.
But I suspect you see it happening and merely tut-tut, while the bulk of your moralising has a very particular bent.
I was very explicit, but somehow it did not sink it with barry. I am actually not surprised. Here it is. Study it:
“In order to criticize Capitalism, one must first understand Capitalism.”
Investment is a risk that benefits everyone if it is done competently. Money is given, not taken. The foreign governments benefit greatly. Criticizing Trump’s family members for being competent at business is just really dumb.
Let that sink it!
Oh I’m well aware what you started with, but then you veered into your favorite hobby-horse and became incoherent. Trump’s family has 5000 shell companies. Does that make him a good businessman or do they use them to “to hide their corruption,” as you put it for the Biden family?
Once again, if shell companies make you aghast, you should be livid about the Trump family businesses, as well as Trump profiteering from the presidency. But your moral compass seems to be affected by a political magnet.
Kynqora wrote above:
” For CONUS, recent decades are warmer than the 1930s.
In fact, 1934 (the warmest year of the Dust Bowl decade) is only the 11th warmest year on record. ”
This is absolutely correct.
The pseudoskeptic ignoramuses a la Robertson always claim that the 1930s were warmer than today.
*
But… this is true only when you look at the warmest monthly temperatures only. Then you see that some Julys in the 1930s are on top of a descending TMAX temperature sort (exceptionally expressed in F cuz 38 °C outside)
1936 07 90.81
1934 07 90.52
2012 07 89.92
1901 07 89.92
2006 07 89.55
1980 07 89.49
1931 07 89.49
1954 07 89.26
2022 07 89.22
2011 07 88.86
Only three, however.
But all these Mount Stupid climbers intentionally ‘forget’ that in the 1930s, there were also very cold winters at work, what you see when sorting TMIN in ascending order:
1977 01 12.54
1979 01 12.58
1963 01 12.97
1918 01 13.30
1930 01 13.33
1940 01 14.11
1912 01 14.14
1936 02 14.22
1899 02 14.67
1937 01 14.76
*
And this impression is even heavily accentuaded when you collect the yearly sums of daily maxima reported by CONUS stations, following a scheme introduced in 2020 by John Christy:
https://web.archive.org/web/20210112005636/https://www.drroyspencer.com/wp-content/uploads/Record-Temperatures-in-the-United-States.pdf
which I exactly replicated by using GHCN daily instead of USHCN (see the red line)
https://drive.google.com/file/d/1rno0fot3CYmeaNFk8W-ekGtRvtCAeXi4/view
because I wanted to know how it looks for the Globe as a whole:
https://drive.google.com/file/d/1pExxoH5V2t-BK2xuijU1thtmuoj-VSES/view
Aha.
CONUS is CONUS, and the Globe is the Globe, n’est-ce pas?
The whole 1930s meme / early 20th-century comparison is becoming increasingly obsolete as time marches forward.
The early 20th-century U.S. warming (1910–1945) was about 0.17°C/decade over 35 years.
The modern warming (1980–2025) has now lasted 45 years and is warming at about 0.28°C/decade.
For modern warming, there is also no indication so far of a coming multidecadal reversal comparable to the cooling and relative stagnation that followed the 1940s.
If one interprets the record in terms of a multidecadal oscillation, then either (1) the oscillation is strongly aperiodic, with varying periods, amplitudes, and warming/cooling rates from one cycle to the next, or (2) the record does not contain a coherent multidecadal oscillation.
And even if a multidecadal oscillation exists, it cannot by itself explain the long-term upward trend.
Europe’s climate has already changed significantly because of anthropogenic global warming, and continued greenhouse-gas emissions will make extreme heat even more frequent and intense.
Researchers emphasize that the question is no longer whether climate change is affecting European summers, but how rapidly the new climate regime will continue to evolve.
Natural weather variability still determines when heatwaves occur, but the baseline climate has warmed enough that record-breaking heat has become far more likely.
Key points include:
1/ Heatwaves that were once exceptionally rare are becoming common.
2/ The 2026 heatwaves are consistent with long-term warming trends.
3/ Human-caused climate change is the dominant driver.
4/ Europe is warming faster than the global average.
5/ Dry soils amplify heat.
6/ Future warming depends on emissions.
1/ Yes, we’re in a natural warming trend.
2/ Yes, we’re in a natural warming trend.
3/ False. That’s a belief, and beliefs ain’t science.
4/ Or it could be other areas have better cooling mechanisms.
5/ Not really. Dry soils have less moisture to evaporate and thereby cool the surface.
6/ False. That’s a belief, and beliefs ain’t science.
“3/ Human-caused climate change is the dominant driver.”
“3/ False. That’s a belief, and beliefs ain’t science.”
Humans cause UHI effects. Ants also cause some warming, but not as much as humans.
But the average temperature of Earth’s ocean is the temperature of a refrigerator.
And average temperature of ocean is a dominating effect upon global temperature.
“it’s all a natural warming trend”
The equivalent of “patriotism being the last refuge of the scoundrel”.
G,
Glad to see you back posting. Your posts are tidbits of wisdom although I don’t always agree I like them. No doubt the oceans are the planet’s thermostat. The Creator is a great designer. It took all the energy in the universe to create this one place. We are so blessed with this gift, staggers the imagination.
Stop guessing, why would it not warm ? It always has in the past, many times ,we are first civilization in history to consider a warm regime yo be a problem, all past civilizations thrived during warm periods.
Gbaikie at 10:18 PM:
Your reply is a collection of disconnected facts that never actually addresses the point.
Yes, humans produce urban heat islands. No one disputes that. But UHI is a local effect, whereas the warming of the global oceans is a global phenomenon measured far from cities and extending thousands of meters below the surface. UHI cannot warm the oceans.
Likewise, “average temperature of Earth’s ocean is the temperature of a refrigerator” is a complete non sequitur. Nobody claims the oceans are hot. The question is whether they are gaining energy.
They are.
More than 90% of Earth’s excess heat from the current radiative energy imbalance is being absorbed by the oceans. That is one of the strongest pieces of evidence that the planet is accumulating energy. The oceans are acting as Earth’s primary heat reservoir.
Ironically, your own comment helps explain my key point #5.
The oceans can absorb enormous amounts of heat because they contain vast quantities of water. Much of the incoming energy goes into evaporation (latent heat) rather than immediately raising temperature.
Land behaves differently.
When soils become dry, evaporation declines dramatically. The solar energy that would have powered evaporation is instead converted into sensible heat, causing the land surface and the air above it to warm much more rapidly. That is precisely why dry soils amplify European heatwaves.
So the physics is internally consistent:
1/ The oceans absorb most of Earth’s excess energy.
2/ Ocean evaporation buffers temperature rise by storing energy as latent heat.
3/ Dry land lacks that buffering capacity.
4/ Therefore, drought-stricken regions experience much larger temperature spikes during heatwaves.
None of this supports your implication that AGW is unimportant. Quite the opposite. The warming oceans are one of the clearest fingerprints that Earth is accumulating energy because GHGs have reduced the efficiency with which the planet loses heat to space.
The ant analogy is also misplaced. Ants don’t produce a measurable global radiative forcing. Humans do. We have increased atmospheric CO2 by about 50% since the Industrial Revolution, and satellites, surface observations, ocean heat content, glacier loss, and sea-level rise all independently confirm the resulting planetary energy imbalance.
The evidence isn’t a metaphor. It’s measured!
Arklady,
You do seem to read Gbaikie post with green tinted glasses.
Europe might be hotter for a number of reasons from poor quality sites, urban heat island, change in use of the land etc or it may be climate change which might be natural or man made.
The likelihood that it is all mans fault is pure Willard. Have you already forgotten that the IPCC has removed it’s most fire scenarios due to being impossible.
And just think Arklady, G’s disconnected facts make more sense than anything you post. But you keep trumpeting Al Gore’s movie, and Oscar, and Nobel Prize. It keeps me laughing.
When skeptics can’t address the evidence, they often resort to irrelevant distractions and/or personal belittling instead.
Eldro,
This skeptic does address the evidence. The lapse rate and Ed Berry’s Carbon Cycle Model both separately falsify GHT. The math is not on your side. That’s the evidence.
How is a model evidence again, Troglodyte?
Eldrosion wrote this:
“When skeptics can’t address the evidence, they often resort to irrelevant distractions and/or personal belittling instead.”
That is a wrong answer because stephen p anderson is not a skeptic. He is a complete clown fantasizing about being a skeptic. As a genuine skeptic who is also skeptical of other skeptics, I denounce him. He has demonstrated that he is completely incompetent. Further, he refuses to take advice, so I have zero sympathy with his crap.
Williard,
Have you read Berry’s papers? They are based on the differential equation
dCO2/dt= Inputs – Outputs (Continuity equation for carbon dioxide)
Anything wrong with that?
Williard,
Daniel Jacobs, who wrote the text, Introduction to Atmospheric Chemistry, introduces this differential equation in his textbook, however, he doesn’t like what the solution implies and rejects it. He rejects the math that falsifies GHT. Why?
Why can’t you post any link, Troglodyte: are you still technology illiterate?
Here is evidence:
https://science.nasa.gov/climate-change/evidence/
Here is a model:
https://ugc.berkeley.edu/background-content/carbon-cycle/
Learn the difference.
Tim S
Mostly agree with you on fanatic stepen p anderson. He makes claims that he got an “A” in Thermodynamics but he thinks pressure somehow can maintain a hotter surface. I linked him to several articles on lapse rate
He ignores them. He now is calling postets Marxist. Guy is lost in his total love and devotion of the biggest liar Donald Trump. He is vety gulible to any idea that is not based on rational thought or science. He ignores all information except yhr lies of right-wing mefia
His mind is broken, not sure it is fixable.
Williard,
Math falsifies both of those claims. You’re only linking propaganda. You don’t debate anything. You link propaganda then insult. That’s your modus operandi. That’s what Marxists do.
Norman,
Do you agree that if the lapse rate is due to pressure then it falsifies GHT?
The problem you Marxists are having is the math. You can’t do anything about it. It is difficult to debate math because it’s there, like a trumpet.
Williard,
So, I have to provide a link to the derivation of the lapse rate? That’s not something you can find yourself? If it is derived from pressure, it falsifies GHT. That’s an immutable fact.
dt/dz = dt/dp(dp/dz)
Chain rule using ideal gas law and hydrostatic pressure.
I can give you a link if you need one. It will be devastating, something you can’t come back from.
Do you really need a silly rhetorical question to try to pretend nobody noticed that you confused model and evidence, Troglodyte?
Here, FYEO:
https://www.france24.com/en/trump-mocked-for-posting-tacky-ai-golden-eagle-on-white-house-balcony-1
I can concede that echoing Nazi stuff might appeal to closet fascists like you.
“Why can’t you post any link, Troglodyte: are you still technology illiterate?”
I thought you’d run away.
You’d think, Troglodyte?
I doubt you ever do:
https://www.cnn.com/2026/06/25/politics/fema-official-gregg-phillips-ousted-agency
Perhaps don’t apply to lead FEMA.
Not just another summer
“When it comes to temperature in Europe, there is absolutely no doubt — unless you are a complete idiot or outright liar (or both) — that this is not “just summer.” Europe is sweltering through its worst heat wave ever.”
https://tamino.wordpress.com/2026/06/28/not-just-another-summer/
History proves you wrong, would you like some dates, the past is a treasure trove of extreme heat in Europe with thousands of deaths over the centuries, every Summer we get the same nonsense, yet just like other years people are still flocking to Europe to laze in the sun,did you not find it a little silly that the French government told people not to drink alcohol because it was a warm day.
Yes, I would be very interested in analyzing the dates you have.
From there, we can examine how frequently these extreme heat events occurred and compare them with the present. That is exactly the kind of analysis Tamino is presenting for Bordeaux, and I would be interested to see whether your examples tell a different story.
We can certainly discuss your evidence here, but I am curious whether you’d be interested in moving this conversation to Tamino’s comment section. Would you be willing to tell Tamino that “history proves you wrong”?
If you are, I would enjoy following that discussion. Just be warned: he isn’t exactly known for handling weak arguments gently.
https://tamino.wordpress.com/2026/06/28/not-just-another-summer/#comment-109275
I bet your “Tamino” would not be able to come up with a consistent, succinct, viable definition/description of the
“greenhouse effect”. Especially one that keys on CO2.
See, that would be science….
Eldrosion,
You promote a very amusing site. Complaining about people saying it’s business as usual about summer heat is classic. Does that site call out all the $billions spent on researching the extreme scenarios which they refer to as “business as usual”. You know the scenarios that the IPCC have dismissed as impossible.
And the fact that you promoting a website that pushes the solar constant as basis for comparison is not really being honest. Or is he yet another Willard?
Sadly I haven’t the time to spend on his little echo chamber.
So not only our Anon for Q-related reasons do not know whataboutism, he doesn’t know Tamino. As a token of appreciation:
https://www.ft.com/content/e6372589-0015-4b91-b2b6-6581c3937c5a
We definitely need better contrarians.
Anon for a reason,
“And the fact that you promoting a website that pushes the solar constant as basis for comparison is not really being honest.”
????
The post is about observed changes in the frequency of extreme heat days in Bordeaux over the instrumental record. There is no discussion of the ~1361 W/m^2 of solar irradiance at the TOA in that blog post.
And even if some of the highest emissions scenarios are now considered less likely than they once were, that does not mean human caused climate change ceases to be a problem.
The observations speak for themselves. European heatwaves have become more frequent and more intense under the warming we have already experienced. That is evidence of a serious problem regardless of whether the most extreme scenario comes to pass.
Clint R does not appear to recognize the connection between back radiation and insulation, which may explain why he concludes that different definitions of the greenhouse effect are inconsistent with one another:
https://www.drroyspencer.com/2026/06/uah-v6-1-global-temperature-update-for-may-2026-0-53-deg-c/#comment-1746795
Upthread, he initially acted as though he didn’t understand what I meant by “lose heat.” However, his later comment suggests that he did understand the point after all (trolling):
https://www.drroyspencer.com/2026/06/uah-v6-1-global-temperature-update-for-may-2026-0-53-deg-c/#comment-1746840
More concerning is that he was trolling even after being shown Dr. Spencer’s blog post explaining why denying the greenhouse effect harms the skeptic case:
https://www.drroyspencer.com/2026/06/uah-v6-1-global-temperature-update-for-may-2026-0-53-deg-c/#comment-1746760
If he understood both my point and Dr. Spencer’s position, then his continued behavior gave the impression that he is unconcerned about whether it undermines the broader skeptic cause.
I prefer to respond to skeptics with facts and scientific evidence rather than create confusion. If Clint R intends to undermine skeptics through chaos, that is his choice.
I continually point out that the cult kids have no science. They fill up the blog with insults and false accusations.
So Eldro must have spent hours composing that comment, all in an effort to prove me right, again.
On the surface, I know how ridiculous my 10:35 am comment sounds, but…
you’ve been banned twice for insulting Roy Spencer:
https://web.archive.org/web/20200421231416/http://www.drroyspencer.com/2018/04/new-lewis-curry-study-concludes-climate-sensitivity-is-low/#comment-299107
https://web.archive.org/web/20170105023619/http://www.drroyspencer.com/2016/08/suggested-backyard-experiment-to-measure-the-greenhouse-effect-of-more-carbon-dioxide/#comment-220289
Yes Eldro, your comment was ridiculous, as well as bringing up someone that was apparently banned. I’ve actually been accused of being him before. So, get in line.
I can only assume you’re enraged because your cult hero “Tamino” has failed you.
You need a hero that understands the science….
“We definitely need better contrarians.”
Exactly:
“tamino // December 12, 2007 at 3:44 pm
That’s why the word “denialist” and its variants are necessary. Ordinary citizens need to know that MOST of the anti-global warming argument presented in the news and in the blogosphere is not just “disagreement” — it’s denial, with absolutely no more basis in truth than the claim that the cryosphere shows no sign of change other than an increase in SH sea ice. Well, there’s a huge difference between honest skepticism and denial: the former merits consideration, the latter deserves only scorn.”
http://web.archive.org/web/20080417025947/tamino.wordpress.com/2007/12/12/denial/#comment-10415
Eldro, since you’re so infatuated with this “Tamino” character, maybe you could get him to come up with a consistent, succinct, viable definition/description of the “greenhouse effect”. Especially one that keys on CO2.
Or is he just another windbag for your cult?
Eldro, I agree.
This list, in order of merit, may help distinguish amongst the contrarians;
1.Sceptical scientists (those who undestand physics)
2.Half educated scientists (including chemists and engineers)
3.Poorly educated members of the public
4.Uneducated armchair critics
5.Deliberately stupid people
6.MAGA types
7.Tied for last place: GR and CR
studentb, I think Gordon is my favorite one :-).
It is not every day you meet someone who challenges 1LOT:
https://www.drroyspencer.com/2026/06/uah-v6-1-global-temperature-update-for-may-2026-0-53-deg-c/#comment-1747060
I too, admire the effrontery of GR.
Unlike CR, he regularly comes up with new ways to astound us all.
Eldrosion,
The solar constant was mentioned on the website that you were promoting. If a person doesn’t understand the limits of the solar constant then they are just expressing their views, they certainly aren’t arguing from a scientific base.
You wrote ”
And even if some of the highest emissions scenarios are now considered less likely than they once were, that does not mean human caused climate change ceases to be a problem.”
Try rereading your comment. The IPCC worst case scenarios would have been a problem if they occurred. The milder scenarios are not really an issue other than those who are prone to hypochondria or paranoia. Im more worried about the Willard’s of the world wanting to geo-engineer their way out of the extreme scenarios that the IPCC have abandoned.
It is very much different on Venus…
Earth’s atmosphere is a thin and a transparent both ways – in and out – atmosphere doesn’t act as a warming blanket covering planetary surface.
We do planets and moons surface temperatures comparison.
The presence of atmosphere doesn’t warm Earth’s surface.
It is the other reasons, not the presence of atmosphere, that make Earth warmer than the Moon by +68°C.
–
Please ask AI the mechanism by which the -55°C air above could ever rise surface temperature from -19°C to +15°C ?
–
https://www.cristos-vournas.com
I really enjoying going to your website. There’s a lot to learn there.
Thank you, Stephen.
Venus’ atmosphere has 280.000 (two hundred eighty thousands) times more CO2 molecules on the ground level than Earth’s atmosphere has.
Whatever influence the CO2 on the surface temperature, it is 280.000 times less on the Earth’s surface compared to Venus’ surface.
–
https://www.cristos-vournas.com
christos…the temperature of Venus has nothing to do with the amount of CO2 in the atmosphere. The surface temperature of Venus is about 450C and if the atmosphere was causing the high temperatures it would need to have a temperature hotter than 450C (2nd law).
The 450C surface temperature has to come from inside the planet.
Gordo,
The lapse rate on Venus is derived and calculated exactly like the lapse rate on Earth. We assume the atmosphere of Venus behaves like an ideal gas. So dt/dp(dp/dz) is the chain rule differential. We do it for a hydrostatic column of air behaving as an ideal gas. The lapse rate on Venus is much higher than on Earth because the pressure is much higher. It has nothing to do with CO2 or a greenhouse effect.
Timely…
Reuters News Agency’s new climate tool to document the unprecedented conditions in real time.
https://www.reuters.com/graphics/CLIMATE-AUTOMATED/MONITOR/akpeykqqapr/
In a moment of sheer desperation, Ark resorts to the news agency Reuters for more climate propaganda.
“How today’s temperatures compare to the historic average”.
Of course, the historic average is taken from the NOAA/GISS propaganda machine based on the 1960 – 1990 average. Not a mention that the data is fudged, having been amended retroactively to what both thought it ‘should’ be.
Then Reuters go on to present forecast temperatures which could only come from unvalidated climate models, or toys.
Sheer propaganda.
Gordon Robertson at 9:33 PM:
Calling a global news dashboard “propaganda” simply because you dislike the reality it visualizes is a textbook ad hominem attack designed to mask a total lack of substantive argument.
Your desperate attempt to discredit the tool completely unmasks your lack of scientific grounding and total absence of analytical ability. You are attacking the messenger because you cannot honestly challenge the data.
Let me break it down for you:
1/ Using the 1961-1990 period as a baseline is a standard, globally accepted scientific convention established by the World Meteorological Organization (WMO). A baseline is simply a consistent benchmark used to measure anomalies, not a “fudged” trick to manipulate data. Shifting the baseline period changes the raw anomaly values but does absolutely nothing to alter the undeniable, upward trajectory of global temperatures.
2/ What you conspiratorially call “retroactive amendments” is actually the rigorous scientific process of data homogenization. Scientists must adjust historical records to correct for known, non-climatic biases, such as changes in weather station locations, shifting observation times, and the transition from liquid glass thermometers to electronic sensors. These adjustments are transparent, documented, peer-reviewed, and publicly available -the exact opposite of a clandestine propaganda operation.
3/ Conflating real-time weather forecasts or near-term temperature projections with century-long, unvalidated “toys” reveals your fundamental ignorance of atmospheric science. The Reuters tool monitors unprecedented conditions in real time, meaning it relies heavily on direct, observational data from satellites, ocean buoys, and ground stations, not just simulations.
4/ If you want to challenge the reality of real-time climate monitoring, try bringing peer-reviewed data and actual atmospheric physics to the table next time, rather than a collection of tired old, debunked denier myths.
July in Europe will be beautiful and very warm.
eldrosion…re Tamino, aka Grant Foster…
Tamino is a mathematician who specialized in analyzing fudged data from NOAA and GISS. In other words, his analysis is meaningless. Furthermore, his background in hard science is flawed.
His criticism of skeptics is also invalid since it consists of fabrications from climate alarmists who are intent on discrediting skeptics. A far more scientific blog is climateaudit dot com.
I think Tamino’s point is illustrated by this very thread:
#1) Several people here have been downplaying or denying the connection between the exceptional European heat wave and climate change.
The high pressure systems associated with these events generate southerly winds that advect hot air from the Sahara desert into Europe.
Because both the source region and Europe itself are now significantly warmer than they were historically, the air masses transported northward are warmer as well, contributing to more intense heat extremes than would have occurred in the past.
Deniers can’t admit this. They are so afraid of global warming (and rightly so – it undoubtedly is scary) that they have to pretend it’s just summer.
#2) Alongside this, of course, is this blog’s recurring and REDUNDANT denial of the greenhouse effect – a position that even the skeptic Tim S has denounced:
https://www.drroyspencer.com/2026/06/uah-v6-1-global-temperature-update-for-may-2026-0-53-deg-c/#comment-1747581
JFY:
“Message from Santer
December 17, 2009
Eli Rabett has posted the text of a statement made by Ben Santer at the recent AGU meeting (reproduced with Santer’s permission). I’ll assume that Santer wants his message made more public and that he won’t object to my also reproducing it here.
But first my opinion: we’ve wasted enough time listening to the objections of those who raise doubts rooted in ignorance. For a time, it was valid — even necessary — to consider all dissenting views. But the “doubters” have had far more than their fair share of attention. They’ve been trying to tear down climate science for a decade or more, and have failed utterly.
Further argument from those who have nothing new to add or insightful to contribute is wasted time in the face of impending trouble. They no longer add to understanding, just obfuscation. They have had their “day in court” — and then some — now the jury is in.”
http://web.archive.org/web/20100104072201/http://tamino.wordpress.com/2009/12/17/message-from-santer/
I want to edit my reply:
Because the source region is now significantly warmer than it was historically, the air masses transported northward are warmer as well, contributing to more intense heat extremes than would have occurred in the past.
El Drosion…the Spanish alarmist…
“studentb, I think Gordon is my favorite one :-).
It is not every day you meet someone who challenges 1LOT:”
***
I made the challenge based on an inappropriate interpretation of the 1st law which is partly based on the work of Clausius (internal energy component).
It is abundantly clear that the 1st law addresses only the relationship of work, heat, and internal energy, which, according to Clausius, has an internal heat and work component.
Only a major ijit would try to apply this law as a generalized conservation of energy law when the only energies addressed are heat and work. How, for example, can you apply it to the relationship between EM and heat, or electrical energy and heat? And how can the 1st law tell you anything about what happens to heat when it disappears into a colder air mass as air heated at a surface conducts and convects as it rises?
Ergo, the 1st law is a specific law that addresses the ***EQUIVALENCE*** of heat and work and is not intended as a statement of equality. Clausius makes that clear, if you care to read him on the equivalence.
It would be helpful if you’d sate your objection to my objection so we know what you are on about.
As for listening to studentb (aka stupidb) give yourself 100 demerit points. He refers to people like me as contrarians when in fact we represent real, hard science to which current climate alarm theory is the contrarian.
Gordon Robertson
“Only a major ijit would try to apply this law as a generalized conservation of energy law when the only energies addressed are heat and work. How, for example, can you apply it to the relationship between EM and heat, or electrical energy and heat?”
Then your criticism appears to apply equally to your own boulder example. As Kynqora pointed out, you explicitly invoke conservation of energy when you describe GPE being converted into KE:
https://www.drroyspencer.com/2026/06/uah-v6-1-global-temperature-update-for-may-2026-0-53-deg-c/#comment-1747091
If one accepts that potential energy can be converted into kinetic energy while conserving energy, then there is no conceptual obstacle to electromagnetic energy being absorbed and converted into internal energy.
El Nino?
http://tropic.ssec.wisc.edu/real-time/mtpw2/webAnims/tpw_nrl_colors/samer2/mimictpw_samer2_latest.gif
That’s not indicative. Try these.
https://www.bom.gov.au/climate/enso/?ninoIndex=nino3.4&index=rnino34&period=weekly#tabs=Overview
https://www.bom.gov.au/climate/ocean/outlooks/?index=nino34#tabs=Graphs
https://www.cpc.ncep.noaa.gov/products/analysis_monitoring/lanina/enso_evolution-status-fcsts-web.pdf
https://ds.data.jma.go.jp/tcc/tcc/products/elnino/elmonout.html
https://cmdp.ncc-cma.net/eng/index.php?channel=87
Irene,
Barry has his propaganda sources.
Idiot
Too bad your GHT is falsified you psychopath Marxist.
The links are to the bureau of meteorology of 4 different countries on 4 different continents, for a variety of views on the state of ENSO using different metrics, simpleton.
Wow, how enlightening.
“you psychopath Marxist”
A very interesting retort which you don’t expect to find on a blog site dealing with climate science.
There are 4 types of psychopaths. One of them is referred to as a Secondary Psychopath with the following traits:
“Impulsive, risk-taking, defiant, and prone to volatile emotional outbursts.”
I suggest Mr/Ms Anderson have a good look in the mirror.
As to the term “Marxist”, this is nowadays regarded as a badge of honour by many given the widening disparity between the rich and the poor.
Professor P,
Does the disparity between rich and poor need you master minds to fix it?
Professor P,
Name one good Marxist. Name a Marxist who isn’t a psychopath. Barry is anti US, anti-West. He is a globalist Marxist. By the way, those Marxists have accumulated a lot of wealth.
Here’s a good marksist:
https://abovethelaw.com/2026/02/above-the-law-is-in-the-epstein-files-let-us-explain/
Elon is very good at being bad.
Zohran Mamdani comes to mind.
He’s a democratic socialist, not a Marxist.
As far as he’s popped up in the news, he is a democratic socialist who advocates taxing billionaires and large corporations more heavily to fund a bigger social safety net. He doesn’t to my knowledge advocate for a one-party state or the abolition of democracy as seen in (failed) Marxist polities.
I see no evidence that Mamdani wants to abolish capitalism, a fundament of Marxism.
Prof P and other comrades
Marxism has the support of those who pay little tax but are happy to tell people who do pay tax how they want the money to be spent.
Marxism has been the root of much of the evil on the last century.
Marxism delight in dividing people.
Exactly:
https://taxpolicy.org.uk/2026/05/20/farage-5m-gift-tax/
Anoother marketsist.
Anon,
Which US government program supports the Marxist ideal of giving the proletariat the ownership of the means of production?
Easy answer 3 numbers and a letter.
Barry,
Ooops. Make sure you get Professor P back in line. He said what everybody knows in spite of your propaganda.
Bob,
I haven’t a clue to the reference to our made. I don’t live in the USA.
“Marxism has the support of those who pay little tax but are happy to tell people who do pay tax how they want the money to be spent.”
Another example of mindless conservatives labeling any criticism at all as Marxist.
barry
Anderson is so ignorant and one-sided that
– he fails to recognize in the image above that Coolista Palmowski is skillfully and deviously obscuring the very area where ENSO (El Niño and La Niña) actually develops;
– he believes that anyone showing a strong El Niño is engaging in global warming propaganda.
More stupid you die, as Frogs love to say.
*
A few years ago, we experienced the fourth-strongest La Niña event of the last hundred years, with 35 consecutive months below the La Niña threshold—see the graph I posted at the time:
https://drive.google.com/file/d/1OFB3GczUOmJ-T1IwbmVFa3NuRaWpSIaO/view
*
But as the pseudoskeptics always wrongly link La Niña to a cooling Earth, showing this was of course no propaganda at all, he he.
*
Strange to me is, even though I know NOAA’s MEI is based on much more complex data, how strong it has disconnected this time from all others:
https://psl.noaa.gov/enso/mei/data/meiv2.data
It has still not bypassed the El Niño treshold of +0.5!
Ireneusz posts here all the time. He doesn’t need correction from a Marxist propagandist.
Thanks for the link, Bindidon. There’s been a few dead links at NOAA and the BoM for ENSO and other stuff, and I lost the path to MEI. Looks like it’s completely the odd one out.
https://www.climate.gov/enso
https://www.cpc.ncep.noaa.gov/products/analysis_monitoring/enso_advisory/ensodisc.shtml
https://cpc.ncep.noaa.gov/products/analysis_monitoring/enso/roni/strengths/
https://www.cpc.ncep.noaa.gov/products/analysis_monitoring/enso_advisory/figure06.gif
Thanks, Tim. Just noting the insert at the top of the 1st link.
“This website is an ARCHIVED version of NOAA Climate.gov as of June 25, 2025.
Content is not being updated or maintained, and some links may no longer work.”
As far as I’m aware, the other links are to material included in this regularly updated pdf.
https://www.cpc.ncep.noaa.gov/products/analysis_monitoring/lanina/enso_evolution-status-fcsts-web.pdf
The NOAA NCEP doc is the most comprehensive ENSO update in a single document that I know of. I like to check the other groups to get a variety of views.
“he fails to recognize in the image above that Coolista Palmowski is skillfully and deviously obscuring the very area where ENSO (El Nino and La Nina) actually develops”
Yes, stephen is a complete dunce. Ren is forever posting weird graphs that have little or nothing to do with what he’s (possibly) talking about. The region above 5 degrees Sotu is missing from the top of the graph – the very region where ENSO shows up. Total precipitable water is a very oblique metric to measure ENSO. Perhaps ‘coolista’ Ren hunted down any S America map of anything he could find that had blue colours in it?
Typically strange stuff.
barry
” There’s been a few dead links at NOAA and the BoM for ENSO and other stuff… ”
No idea what you mean here; after all, the NCEP link you posted actually is the best information one could obtain about ENSO:
ENSO: Recent Evolution, Current Status and Predictions
https://www.cpc.ncep.noaa.gov/products/analysis_monitoring/lanina/enso_evolution-status-fcsts-web.pdf
*
” … Looks like it’s completely the odd one out. ”
At a first glance: yes.
But… we have to consider that MEI’s designer Klaus Wolter wanted from the beginning to create a time series
– encompassing the entire equatorial Pacific basin (30S-30N – 70W-100E versus 5S-5N – 170W-120W for NCEP 3+4), thus including all ENSO areas up to NINO 1 and 2;
– integrating pressure and wind data
and last not least
– less dependent from sea surface temperatures, going so far that the final result is regressed against the inverted Outgoing Longwave Radiation local to the measurement area.
The result you can see in my MEI vs NCEP comparinson I updated in last March:
https://drive.google.com/file/d/1KoNIqs-16AUzO91cA_-NZTtRJbWTKWIb/view
The reduction of temperature influences in either direction you can observe when comparing for example the 1982/83 resp. 2015/16 El Ninos.
MEI’s 1982/83 looks stronger because the effect of El Chichon was extracted; the same in inverse direction for 2015/16.
This is best documented with Japan’s Met Agency’s global grid temperature data:
1982
https://ds.data.jma.go.jp/tcc/tcc/products/gwp/temp/map//gridtemp/y1982/gridtemp1982ane.png
2015
https://ds.data.jma.go.jp/tcc/tcc/products/gwp/temp/map//gridtemp/y2015/gridtemp2015ane.png
*
No idea why all these pseudoskeptic ignoramuses identify El Nino with warming and La Nina with cooling.
El Nino phases merely evacuate huge amounts of heat from oceanic regions up into the lower atmosphere; conversely, La Nina phases drop huge amounts of heat from the lower atmosphere into the same oceanic regions.
*
Anderson and his UK friend Q Anon are dumber as imaginable: they are only able to insult and discredit.
Me, a Marxist? Ha ha ha…
Bindy Goebells.
So was the leaders of Germany and Italy during the second world war. Both were Marxists and evolved it.
Adolf was a bit like Nigel, but Nigel is a little subtler:
https://encyclopedia.ushmm.org/content/en/article/the-nazi-party-1
Anon,
Blinny is a hard-core leftist. He sure acts like a Nazi. But Nazis and Marxists differ little. They are all sociopaths or psychopaths. Again, there’s little difference. All of these Marxists are agglomerating here and other sites to advance their ideology. They look at climate science as a way to defeat capitalism and ultimately the US. If they could have kept Obama, Biden or Harris in power, they saw that as a way to achieve their goals. Harris is their next candidate. She will do whatever they want. That is why they hate Trump. He won’t do anything they want and try to take them out as he should. The only way to defeat these lunatics is to take them out and Trump knows it. They know Trump knows it. Could you imagine a world ruled by Marxism? What a horrible place it would be.
The insane world of the post-conservative movement holds that anyone who disagrees with them or Trump is a socialist/Marxist/anti-capitalist.
Stephen,
Well aware of what Bindy Goebells is and how is blinded to history, science and critical thinking.
Its amusing that Bindy claims to be an engineer but can’t clarify what type. Seems to be very defensive at times, I wonder why.
What these Marxist forget is that there are numerous videos of democrats or independent voters being encouraged to engage with the right, whereas the left only hurl abuse and shout down any comments that they don’t like.
Their belief in climate change is disproportionate as they never seem to accept any other plausible reasons without frothing like a rabid dog. Or in Willard’s case that’s just normal thinking
Binny,
You might like:
https://www.newsweek.com/kroger-executive-admits-company-gouged-prices-above-inflation-1945742
Damn Marketsists!
Gordon Robertson at 9:33 PM:
I’m increasingly convinced that you can’t read, won’t read, and if you do somehow manage to puzzle out a few lines you are utterly incapable of comprehension at anything above the most basic of concepts.
Let me spell it out for you:
Scientific reasoning depends on a layered structure of shared prior knowledge and methods.
Productive disagreement can occur between scientists, or between scientists and informed non-specialists only when both sides: accept evidence-based reasoning, are willing to revise beliefs, and share common factual foundations.
Debate is impossible if there is no agreed starting point. If one person accepts spectroscopy, radiative transfer equations, satellite measurements, and statistical inference, while another rejects these foundations entirely, discussion cannot proceed normally.
You can’t argue with a zealot. You can’t reason with a fanatic. Their world is black and white with no room for gray. They are right and you are always, and forever, wrong -even if you agree with them. Their extremism is an addiction and for them there is only “The Cause.” Without that purpose, without their dogmatic creed, they are nothing. They don’t exist.
It is The Argument that gives them life, purpose, meaning, existence. Because of that, they can never change.
“Logic and ethics are fundamentally the same, they are no more than duty to oneself.” Otto Weininger.
Fearless guess for June results:
Polar Vortex is organized and healthy, but oceans are hot, and HTE continues to lessen.
Still expect warm, but not a big change, say +0.5C to +0.58C?
+0.67C
SOLAR MINIMUM UPDATE
Socialism for the oil industry but capitalism for AISH recipients in Alberta.
https://www.theglobeandmail.com/business/article-alberta-west-coast-oil-pipeline-major-projects-office
There is culmination phase of millennias long orbitally forced warming trend.
It is not caused by human activities, fossil fuels burning and etc…
The global temperatures will rise for many years, the temperature rise will accelerate. It is a natural process.
–
https://www.cristos-vournas.com
“You have to respect the president. If you don’t respect the president, you’re gonna have a problem”
DJT
Anti-constitutional as well as hypocritical.
He’s talking like a mob boss, using the presidential pulpit to threaten and bully citizens. As if he didn’t mock Biden and Obama incessantly.
Every day is a new perfidy, and often enough there are screaming howlers like this one.
Barry,
In the military you salute the rank not the person.
A concept that you struggle with.
Barry,
Submission to hierarchical figures they worship is a dominant trait among troglodytes.
Trump was referring to the person, not the office in this speech.
Military allegiance is to the constitution. Because of this, many vets despise Trump. And for many other reasons. Trump has received more condemnation from retired generals and senior officers than any other sitting president.
Senior military who worked closely with him have publicly stated he is unfit for the office, fascistic and scornful of the constitution. It’s a long list, unprecedented in American history.
Barry,
The flip side of the coin is that a lot of military like Trump because he is not pandering to mental illnesses and DEI wokeness.
The Secretary of War fired a bunch of generals who were trans, not skilled or actively expressed anti Commander in Chief comments bordering on sedition.
I’m sure many military members are anti-woke.
“The Secretary of War fired a bunch of generals who were trans”
Name one.
“not skilled or actively expressed anti Commander in Chief comments bordering on sedition.”
Why do you lie? Is it because you are repeating other peoples’ lies unchecked?
Please name the trans generals that have been fired by the Trump administration. Let’s get your credibility sorted with your first claim.
There is no flip side for the sheer number of generals, including those who worked personally with Trump, that have been public about his complete unfitness for the office they salute.
You can let me know which of these generals were trans.
Anon, you’ve posted in the wrong thread. This isn’t about the news, this is about who said those quotes and in what context. Feel free to play.
What President famously said this:
“when the President does it, that means that it is not illegal, by definition”
What is the context?
Here’s another for the game:
“When somebody is the president of the United States, the authority is total. And that’s the way it’s got to be… It’s total.”
Barry,
It’s such a shame that the View & CNN don’t report the facts.
Isn’t it strange how the left were blind to Biden lack of ability but have suddenly been able to see the president is never liked 100%.
Bzzzt! No, Biden never made those quotes.
Want to try again?
ark…”Scientific reasoning depends on a layered structure of shared prior knowledge and methods.
Productive disagreement can occur between scientists, or between scientists and informed non-specialists only when both sides: accept evidence-based reasoning, are willing to revise beliefs, and share common factual foundations.
Debate is impossible if there is no agreed starting point. If one person accepts spectroscopy, radiative transfer equations, satellite measurements, and statistical inference, while another rejects these foundations entirely, discussion cannot proceed normally”.
***
We students of science call it the scientific method. In a non-convoluted since it is about…
1)Stating a proposition, such as what you intend to prove, or even examine.
2)stating your method of examination
3)list your apparatus
4)make observations
5)draw conclusions
In other words, you are laying out a recipe for other to follow to either prove you right or disprove you. That’s the standard, universal scientific method and any scientist or layperson can refute the conclusions by performing their own experiment hence proving the conclusion wrong.
Now comes the corruption from those not happy with plain, simple science who want to use perversions to formulate their own theories.
First there is peer review where journal editors can reject your paper outright, or farm it out to one reviewer whose opinion, right or wrong, can cancel your paper. The Journal of limate has lone been run by climate alarmists so good luck to anyone skeptical of the paradigm. Ask Roy Spencer, John Christy or Richard Lindzen about their experiences.
At one time peer review was an honourable process aimed at keeping laymen from posting rubbish. However, these days it is used with journals to prevent anyone publishing who does not agree with the status quo. It also prevents legitimate laymen from publishing science even if the science is accurate.
Example. Michael Faraday was a pioneer in magnetic theory but could not get published because he lacked the mathematical skills required by the poobahs running the scientific communities. Maxwell came to his aid, offering to translate his electromagnetic theories into the required math. Guess what…Maxwell got the credit for Faraday’s stuff.
Then there is the current chicanery of using consensus as a valid form of science. That is all alarmist climate scientists have at their disposal, that and unvalidated climate models programmed with pseudo-science.
Beliefs have no business in science, only proofs are valid. That omits 99% of alarmist climate propaganda. Fact is a collection of thoughts in the distorted human mind. We talk about energy as if we know what it is as a fact, but we have no idea what it is.
Some fact may be close to the truth but other facts are sheer rubbish. Fact is nothing more than a limiting ego trip from the human mind. Once you think you ‘know’ something you shut off all avenues of finding anything new on that subject.
The IPCC is a great example. It has a mandate only to find evidence of anthropogenic warming and it stops at nothing to offer utter propaganda in that effort. It has completely rejected any natural causes for current warming, dismissing the Little Ice Age as a phenomenon local to Europe only. Complete rubbish. There is no way Europe alone could cool by 1C to 2C for 400+ years while the rest of the planet remained untouched.
Same with gravity. Atomic structure is the same as well. We have not the slightest idea what makes up an atom, yet we pontificate about electrons and protons as if we have seen an electron orbiting a nucleus of protons. Rutherford demonstrated circa 1900 there is a mass at the centre of an atom but in the ensuing century no one has elaborated on what it is. We know it has a positive charge since he fired protons at it and the protons were deflected.
Yes…we can agree that electrons are there but we cannot stop one long enough to examine it. So, we settle for Schrodinger’s mathematics re wave equations to estimate a probability of finding an electron.
In some cases, we have the temerity to claim gravity is not a force but a property of a space-time continuum, even though that theory makes absolutely no sense. So, we bypass the forces and masses of Newton with thought experiments by Einstein, and anoint him the new guru of physics.
Much of modern science is about major ego trips and rejecting anything that does not jive with the ego trip.
I’ll go you one further, debate is impossible when people insist on creating artificial worlds that cannot be tested then claiming any other scientific examination is flawed based on the imagined science.
I am describing AGW theory here. We already have well-established science in the Ideal Gas Law and the 2nd law that proves AGW theory is nonsense yet no one here has proved either is wrong. All you do is wave your arms in the air while claiming the IGL is a state function therefore cannot be applied in the atmosphere.
Based on that argument, the lapse rate is a state function as well therefore is invalid based on such logic. Using arguments like state functions and frames of reference as red herring arguments serves no purpose in science. The atmosphere is a collection of gases and must obey the IGL. However, what it reveals about a trace gas does not sit well with alarmists so they attack the law rather than examine their pseudo-science.
Phew!
A round of applause for GR please.
That post is a doozy.
GR: “Ask Roy Spencer, John Christy or Richard Lindzen about their experiences.”
Also GR: ” We already have well-established science in the Ideal Gas Law and the 2nd law that proves AGW theory is nonsense yet no one here has proved either is wrong.”
Well, if we asked Roy Spencer, John Christy, and Richard Lindzen, they wouldn’t say that the Second Law of Thermodynamics or the Ideal Gas Law proves AGW is nonsense.
GR can’t even stay consistent with his own argument.
Gordon,
You made me burn all my Melville books.
Good words Gordo. These nitwits hate any evidence against their precious GHT. The lapse rate and Ed Berry’s model have falsified their precious theory. Also, Studentb and Eldrosian are sycophants and myrmidons. They want to please their masters.
Gordon Robertson at 11:11 PM:
I laid out a perfectly coherent, epistemological point about how debate requires a shared foundation of reality, and you responded with a rambling, pseudo-intellectual manifesto that essentially proves my point: you are entirely divorced from the foundational rules of modern science.
You are trapped in a Dunning-Kruger loop, weaponizing half-baked history and high school physics to justify your denial.
It is genuinely impressive how you managed to write so many words just to completely validate my point. I argued that you lack a foundational understanding of how science operates and are driven purely by dogmatic denial. In response, you gave a masterclass in exactly that.
Let’s dismantle this bizarre, historically illiterate Gish gallop you’ve assembled.
1/ You present a caricature of “the scientific method” as if it begins and ends with a grade-school baking soda volcano recipe from 1950. “List your apparatus”? “Perform their own experiment”?
We are talking about global climate systems, astrophysics, and macro-economics. You cannot put the planet into a test tube in your garage to “perform your own experiment.”
Because we cannot build a second Earth as a control group, climate science relies on observation, massive data assimilation, satellite telemetry, and computational physics (models). Dismissing these because they don’t fit into your five-step recipe isn’t a critique of the science; it’s an admission that you don’t understand how any of it functions. Hypothesis testing, statistical inference, uncertainty quantification, model evaluation, independent replication, instrumentation, peer review, and continual revision, that’s the recipe.
2/ Your comically inaccurate science history anecdotes are embarrassing given how confidently you parade them.
Faraday is universally revered as one of the greatest experimentalists in human history. He published prolifically despite having little formal mathematics. Maxwell did not “translate Faraday so he could get published.” Maxwell mathematically unified Faraday’s experimentally discovered field concepts decades later, and explicitly credited Faraday. That is called scientific progress, not theft.
You claim that in the century since Rutherford, “no one has elaborated on what a nucleus is.” Are you serious? Have you never heard of the strong nuclear force, quarks, gluons, or the entire field of quantum chromodynamics? We have smashed atoms open for decades. Just because you stopped reading about physics in 1911 doesn’t mean the rest of human civilization did too.
3/ Then your argument devolves into “We don’t even know what gravity or energy or facts really are, man,” doing a bad impression of a stoned freshman in a philosophy seminar.
Einstein’s General Relativity accurately predicts the behavior of black holes, gravitational lensing, and literally makes the GPS on your smartphone function. If a theory works, makes highly precise predictions, and matches every single empirical test thrown at it for over a century, rejecting it because you personally find it confusing is a “you” problem, not an Einstein problem.
4/ Then you return, as always, to your favorite pseudo-scientific shield: the Ideal Gas Law (IGL) and the 2nd Law of Thermodynamics.
You have been told repeatedly why neither disproves the greenhouse effect.
The IGL is an equation of state. It relates pressure, density, and temperature. Climate scientists use the IGL constantly because the atmosphere does obey it. However, it says absolutely nothing about radiative transfer or how that gas interacts with electromagnetic radiation.
Nitrogen and Oxygen don’t absorb infrared radiation; CO2, H2O, and CH4 do. That is quantum mechanics and spectroscopy.
The 2nd Law does not prohibit a colder atmosphere from radiating infrared energy toward a warmer surface. Every body above absolute zero emits thermal radiation irrespective of the temperature of its surroundings. The 2nd Law constrains the net exchange of energy, not the direction of individual photons. The warmer surface emits more radiation than it receives from the colder atmosphere, so the net radiative heat transfer remains upward.
5/ Your conspiracy theory about peer review is most exquisitely laughable. Roy Spencer, John Christy, and Richard Lindzen have all published extensively in mainstream journals. Their papers were not “suppressed.” Many of their claims were subsequently examined, tested, and in several notable cases shown to be inconsistent with later observations. That is exactly how science is supposed to work.
6/ Your description of the IPCC is simply false. The IPCC does not conduct research and it certainly does not have a mandate “only to find evidence” for anthropogenic warming. Its mandate is to assess the published scientific literature. The reports contain extensive discussions of natural variability, volcanic forcing, solar variability, internal variability, paleoclimate, uncertainties, confidence levels, and competing hypotheses. If you had ever read one instead of repeating internet folklore, you would know that.
7/ You claim that “once you think you ‘know’ something, you shut off all avenues of finding anything new.” Take a look in the mirror.
8/ You aren’t a “student of science.” You are a contrarian hobbyist desperately trying to justify a conclusion you chose before you ever looked at a single piece of data. I said you couldn’t argue with a fanatic. Thank you for proving me entirely right.
“We are talking about global climate systems, astrophysics, and macro-economics. You cannot put the planet into a test tube in your garage to “perform your own experiment.”
Not really Arklady. We are talking about simple mathematics. If the mathematics doesn’t agree with the theory, then the theory is wrong. The lapse rate and Ed Berry’s math falsify the theory. There’s nothing under the Sun that can change that simple fact. In order to challenge Newton’s Law, you have to show this little differential, F=ma, is incorrect. In order to challenge the lapse rate, you have to show this little chain rule differential, dt/dp(dp/dz), is incorrect. No amount of global climate monitoring, astrophysics, or macro-economics can change that. GHT is foundationally wrong.
Huh?
Tell me again how/why the lapse rate is involved.
Studentb,
If you have to ask that question, what are you even doing here? You’ve spent a lot of time opposing and insulting anyone who doesn’t believe in GHT and promoting GHT and you don’t understand it.
Central England Temperature
“Like most of Europe, England has suffered through extreme heat this June. This is unsurprising, given what we know about global warming. But there are still those who wonder, has summer heat in England really gotten worse — not just this year, but over time? Does it show a trend (and is it statistically significant)? What does history have to say about it?”
…
“I do know that the prognosis for future heat waves, in Europe, here in America, and around the world, is frightening.”
https://tamino.wordpress.com/2026/06/30/central-england-temperature/
Eldro, you keep mentioning this “Tamino” character. Is he really such a clueless alarmist?
You should explain to him what you’ve learned here, that the CO2 nonsense ain’t science because there’s not even a consistent, succinct, viable definition/description for it.
You have learned that, right?
What is “clueless” about applying statistical analysis to observed data and drawing conclusions from the results?
“Clueless” is believing a trend will last forever. Earth is in a natural warming trend. You don’t need any advanced “statistical analysis” to know that.
Your cult believes CO2 is causing it. But they don’t have enough science to know that’s wrong.
And, they can’t learn….
It is certainly absurd to think warming will continue forever.
The warming will ONLY continue for centuries as Earth equilibrates to the current and ongoing radiative perturbation from elevated CO2 concentrations.
There are also slow feedbacks, including ice albedo feedback from retreating ice sheets and carbon cycle feedbacks from Arctic permafrost thaw:
“The atmospheric release of a massive store of sequestered carbon is one possible hitherto-unanticipated feedback in the climate system, one which may quite literally be disastrous, not just for the Arctic but for the entire planet; CO2 is a well-mixed atmospheric gas and the extra CO2 from permafrost loss will reach to all corners of the globe. We simply can’t afford an extra 4 Gt/yr carbon emissions which will sustain long enough to double the atmospheric CO2 load. It’s an example of how our present actions may lead to unanticipated and very unpleasant consequences. It also emphasizes the importance of drastic reductions in human greenhouse-gas emissions now, not later. If we can eliminate our own climate-changing activities, we can delay and/or reduce, or possibly even avoid, a very nasty feedback in the carbon cycle due to permafrost. If we continue to drag our feet, sacrificing the long-term good for short-term comfort, we may well be headed for a future which is far worse than even the most dire predictions of the doomsayers.”
https://web.archive.org/web/20080731114610/tamino.wordpress.com/2008/06/12/the-big-thaw/
But these feedbacks are NOT enough to prolong warming forever.
So yes, you are absolutely right about that.
Glad we finally found some common ground: a shared disdain for misinformation.
Yes, your cult is clueless.
Eldrosion,
You mentioned CET as if it’s the holy grail of proof.
Do you know the Oxford Site?
Suggest you review it and then describe the surrounding area and views.
My bet is you will struggle
The lower troposphere over the UK is also warming, Anon—by at least +1.5°C/century. That warming occurs well above the influence of urban heat islands or surface station siting issues, so those factors are unlikely to explain the trend.
Source:
https://www.nsstc.uah.edu/data/aosc/Global_Temperature_Report/archive/2025/GTR_202512.pdf
See Fig. 4.
Eldrosion,
Where did I say that the earth is not warming?
What I have said repeatedly is that the there is a lot of natural warming from a large range of naturally occurring sources I have also stated that heat islands, not just urban, is corrupting the data tends upwards.
What you and others do is latch onto some genuine research and spin it into some catastrophic prediction of Armageddon. You rely on a lot of poor data to bolster your position.
One aspect of Dr Roy Spencer comments I do disagree with is how reliable the UK met office is. Dr Roy is limited by professional conduct, I’m not as I can call a spade an actual spade without caring about professional grudges and restrictions to data.
As I asked you before do you know anything about the Oxford Site used for CET?
My bet is you don’t cause of your whataboutism reply!
Suggest you use Google maps if you can’t visit the site in person.
ark opens his rebuttal of my post with the usual paragraphs of ad homs and insults, a sure sign that what follows will be the same kind of nonsense. Ark does not disappoint.
“1/ You present a caricature of “the scientific method” as if it begins and ends with a grade-school baking soda volcano recipe from 1950. “List your apparatus”? “Perform their own experiment”?”
***
Ark seems to have a problem with the simple elegance of the scientific method as I defined it. I presume he opts for the more convoluted definitions which allow scoundrels to bypass the process, the ultimate bypass being science by consensus and unvalidated climate models, the basis of the current AGW theory.
——-
“Because we cannot build a second Earth as a control group, climate science relies on observation, massive data assimilation, satellite telemetry, and computational physics (models). Dismissing these because they don’t fit into your five-step recipe isn’t a critique of the science;”
***
The scientific method, as I laid it out, not only serves as a critique it also serves as proof that AGW pseudo-science is wrong. There is not one scientific paper that demonstrates how a trace gas in the atmosphere can produce the claimed catastrophic global warming/climate change predicted by the theory. However, applying the scientific method via the IGL proves the reverse, that it is not possible for a trace gas to warm the atmosphere to a significant degree.
——-
“Maxwell did not “translate Faraday so he could get published.” Maxwell mathematically unified Faraday’s experimentally discovered field concepts decades later, and explicitly credited Faraday. That is called scientific progress, not theft”.
***
I did not claim that Maxwell stole anything, in fact, he worked collaboratively with Faraday. It is not Maxwell’s fault that the scientific community credits him with Faraday’s finding, it is an indictment of the snobbery related to science that others have credited Maxwell with everything related to Faraday.
That is my point in part. Science has become riddled with egotism, and more recently, an all out effort to discredit anyone who disagrees with popular paradigms.
I have a soft point in my soul for Maxwell since he is a fellow Scot who endured the typical Scottish childhood of his day. In his days at school he was called ‘Daftie’ Maxwell since his intelligence-driven penchant for math and science seemed foreign to his peer group.
——
“Have you never heard of the strong nuclear force, quarks, gluons, or the entire field of quantum chromodynamics? We have smashed atoms open for decades. Just because you stopped reading about physics in 1911 doesn’t mean the rest of human civilization did too”.
***
And I suppose you have fallen for all that theoretical claptrap. Ask any physicist of repute to demonstrate a muon, a quark, or any sub-atomic particle and prepare for a mathematical load of nonsense such as one expects from the Big Bang theory. They can’t even demonstrate higher level particles like individual electrons and protons.
The BB theory, that the entire current mass of the universe appeared suddenly on a foggy Friday out of nothing is backed only by two seriously inane theories. One is the Doppler shift in light from stars and the other is a theorized background radiation believed by some ijits to represent about 4 degrees K of heat left over from the Big Bang. The latter theory is a clear misunderstanding of the difference between radiation and heat.
I am sure your criticism is well intended however your naivete precedes you.
———
“Einstein’s General Relativity accurately predicts the behavior of black holes, gravitational lensing, and literally makes the GPS on your smartphone function”.
***
Einstein’s relativity theory has nothing to do with GPS systems. I have decades of direct experience in this field and I can assure you that relativity a la Einstein is not involved. The only relativity required is straight Newtonian relativity which does not depend on Einstein’s fudged redefinition of time. There is no speed of light in time, it was defined only on the Earth’s orbital period, hence a relative constant.
With a GPS system, a satellite is orbiting the planet. The satellite has a system of time independent of the ground stations to which the sat receives and transmits data. The sat has it’s own independent atomic clock as do any ground stations. Since the sat is moving at considerable speed wrt any ground station, there is a relativity component. Since it takes time for EM waves to move between the sat and the ground station, relative motion becomes an issue.
However, that relativity can be addressed using straight Newtonian relativity. It does not require the fudged time component used in Einstein’s theory. Besides, Louis Essen, who invented the atomic clock was a serious critic of Einsteinian relativity. He claimed it is nothing more than a thought experiment and that Einstein did not understand measurement.
That is obvious when Einstein introduced an elaboration of the Lorentz theory, that time can dilate as a mass approaches the speed of light. That is absolute nonsense since time, the second, is defined upon the relatively constant speed of the Earth in its orbit. It is clear, as claimed by Essen, that Einstein was confused about measurement systems, especially those using time.
He was also seriously confused about the application of kinematics. He began his analysis using acceleration, a phenomenon that has no meaning without a reference to mass and force. The study of kinematics presumes a basic understanding of that relationship yet Einstein continually omitted any reference to force and mass.
His reference to a space-time continuum is absolute nonsense without the relevant masses and gravitational forces. Yet ijits today go right along with it based on the unwarranted reputation of Einstein.
——–
“The IGL is an equation of state. It relates pressure, density, and temperature. Climate scientists use the IGL constantly because the atmosphere does obey it. However, it says absolutely nothing about radiative transfer or how that gas interacts with electromagnetic radiation”.
***
The IGL does not have to address radiation since it proves that radiation is a minor player in the heat dissipation at the Earth’s surface. Only climate alarmist have introduced the concept that radiation is essentially everything in the dissipation of heat. Omitting the dissipation of heat from the surface via conduction and subsequent convection reveals an utter naivete of the related thermodynamics.
Since the IGL limits CO2 to a warming factor of 0.06C per 1C warming in the atmosphere, something else is responsible for dissipating heat. I claim that something else is conduction/convection, a major factor reduce by the energy budget theory to a trivial amount.
The beauty here is that our own atmosphere dissipates the heat within itself. If we have a forced air furnace heating a home in winter, the heat does not have to be returned to the furnace. It gets dissipated to the cooler air in the home and then to the cooler air outside the home. When the air cools significantly in the home, a thermostat turns the furnace back on to reheat the home.
I visualize the Sun-Earth-atmosphere system in the same way. The Sun delivers the heat via an EM to heat conversion, and the heat gets dissipated largely in the atmosphere, mainly after being absorbed by the surface and conducted/convected to the atmosphere where it is largely dissipated naturally.
The idea that all solar energy must be returned to space is based on the same old conservation of energy theory formulated between 1700 and 1850. Whereas it is true in general it does not apply to our Sun/Earth system. That’s because gravity has arranged the molecules in our atmosphere in such a manner that heat from the surface can be dissipated within the negative pressure gradient created by gravity.
The theory that needs to be investigated is along the lines of what Christos talks about. It is about gravitational fields coupled with the rotational speeds of planets. Our planet has a perfect rotational speed and gravitation field for enabling heating by the Sun and subsequent heat dissipation within the atmosphere.
Radiation is a factor, obviously, but it is not the determining factor. The idea that a trace gas is responsible for warming the planet plus radiating away all solar heating is plainly wrong-headed.
—–
“The 2nd Law constrains the net exchange of energy, not the direction of individual photons”.
***
The 2nd law is not defined based on a net energy exchange, it is defined only as indicating the direction of a heat transfer from a hotter body to a cooler body. Clausius makes it clear that heat cannot be transferred cold to hot without external means being involved. Even at that, the 2nd law is not contradicted in a transfer from cold to hot since in order to make that happen, a gas must be compressed to a liquid where its temperature becomes hotter than the venting atmosphere due to the compression of the gas to liquid.
———-
“Your conspiracy theory about peer review is most exquisitely laughable. Roy Spencer, John Christy, and Richard Lindzen have all published extensively in mainstream journals. Their papers were not “suppressed.” Many of their claims were subsequently examined, tested, and in several notable cases shown to be inconsistent with later observations. That is exactly how science is supposed to work”.
***
You are spouting pure bs. In the Climategate emails. Phil Jones of Hadcrut, a Coordinating Lead Author on IPCC reviews, bragged that he and ‘Kevin’ would ensure that a paper co-authored by John Christy would not reach the review stage. That is outright corruption and part of the IPCC process.
Roy reported having a paper rejected at peer review by a reviewer who did not seem to understand his paper. That is plain wrong. How can one reviewer be expected to understand new theories proffered in a paper? The idea of review is not to deem if a paper is right or wrong, supposedly it is to filter out irrational science. I hardly think Roy is guilty of that.
Richard Lindzen reported submitting a paper and after a lengthy wait, contacted the journal editor to see why his paper had not been accepted. He was told it was being held up due to his skeptical views. If you agree with such chicanery you are much an ijit as the journal editor.
———-
“The IPCC does not conduct research and it certainly does not have a mandate “only to find evidence” for anthropogenic warming. Its mandate is to assess the published scientific literature”.
***
I wonder if there is a cure for terminal naivete? From Wiki…
“The United Nations endorsed the creation of the IPCC in 1988. The General Assembly resolution noted that human activity could change the climate. This could lead to severe economic and social consequences. It said increasing concentrations of greenhouse gases could warm the planet. This would cause the sea level to rise. The effects on humanity would be disastrous if timely steps were not taken”.
***
See the bit about human activity, aka anthropogenic.
The IPCC has no interest in an science that is not related to human causes of global warming. They are so into denial of an other contributors that they relegated the Little Ice Age to a phenomenon related only to Europe.
John Christy, who has served as a lead author and reviewer on several IPCC reviews reveals many reviewers as sycophants who were converts to the IPCC meme before being chosen. There sole purpose during reviews is to uphold the anthropogenic meme.
It was revealed a long time ago that the IPCC operates through chicanery. 2500 reviewers are selected to review submitted papers, which are generally from the converted (skeptics need not reply), however, before the review from the 2500 are admitted, 50 Lead Authors write the Summary for Policymakers which is released before the final report is in. Then the report from the 2500 is amended to suit the Summary.
———
“You claim that “once you think you ‘know’ something, you shut off all avenues of finding anything new.” Take a look in the mirror”.
***
I learned the difference between knowledge and intelligence a long time ago. Knowledge is a collection of thoughts in the human mind and when one relies on that knowledge, one becomes stuck. Intelligence operates in the human mind only when it is free of accumulated thought. Intelligence operates through insight and awareness, both of which are blocked by thought.
You know, we go about our daily activity driven largely my crap related to knowledge. It has its place in technology or even the daily grind where recognizing danger becomes imperative. However, knowledge is the basis of racism, hatred, culture, etc., as well. Only when you allow your mind to be quiet can intelligence appear.
However, under the hood, extremely intelligent processes keep as alive despite our often idiotic conscious minds interfering. We are created from two tiny cells via intelligence stored in the DNA in those cells. Yet, after birth we are conditioned with major bs that belies that intelligence. Thankfully, much of the conditioning proves harmless but the result is a lack of intelligence as a whole in the way we behave.
I don’t know you from Adam, nor you me, yet you are willing to insult me for no known reason. That’s cool, I have dealt with such behavior in fellow humans much of my life and have grown used to it. Still, I wonder why people cannot communicate based on intelligence.
Love, compassion, and empathy are related to intelligence and awareness, whereas violence, hatred, anger, and so on are related to knowledge (eg. culture). The moment we encounter something different, the human mind resorts to its vast accumulation of knowledge to decipher what is observed, and if that knowledge bank is distorted, biased, or is just plain wrong, it affects how we interact with what is new.
The only way around that is to empty the mind of accumulated thought, which thankfully we can do, albeit for brief periods, and look with a fresh perspective. I have tried to do that the past 20 years re AGW theory and still I am baffled by what people see in it. Same with a good deal of so-called established scientific fact.
We seem to have lost the ability to be skeptical, in fact, more recently we have been encouraged not to be skeptical. More recently, we are being conditioned to believe that good science is misinformation.
—-
“You aren’t a “student of science”.
***
I have been a student of science since grade school. Circa grade 7, we were required to do an aptitude test and I scored high in science and journalism, of all things. By grade 10, I was studying electronics, not because an aptitude test told me to do so but due to my inquisitive nature.
My dad had given me a gift at Christmas which I had to assemble and it was a small crystal set that could receive certain radio stations. I went on to study electronics in high school and it has been my life long study.
Of course, electronics is an important branch of physics based in quantum theory. I had no idea at the time that the basis is quantum theory but when I started to read on quantum theory I immediately recognized it as basic electronics theory.
I am most definitely a student of science and it is my deep interest in and love of science that drives me. If someone like me cannot question science, who can?
You right to question the science is not an issue, it’s your ability that is being criticised.
“Intelligence operates in the human mind only when it is free of accumulated thought. Intelligence operates through insight and awareness, both of which are blocked by thought.”
Ah, I see. You put no thought into that comment. Enlightenment!
An even more astounding effort!
Another round of applause for GR.
Gordon Robertson at 10:11 PM:
So, you are aware of the following engineering facts about GPS:
1/ The onboard satellite clocks are pre-corrected before launch to run slower on the ground by approximately 38.6 μs/day.
2/ The 38.6 μs/day adjustment is composed of a Special Relativity correction of -7.2 μs/day and a General Relativity correction of +45.9 μs/day, to account for the dual effects of the satellite clock moving at approximately 3.87 km/s relative to Earth and operating in a weaker gravitational field, respectively.
3/ Without the pre-launch adjustment and continuous relativistic corrections, GPS position errors would grow by roughly 10 km per day.
If you doubt these truths, then your “decades of experience” have quite literally led you astray.
Gordon Robertson at 10:11 PM:
I have been convinced by these facts:
1/ Quarks accurately predict experimental results.
2/ Muons are detected routinely, e.g. Cosmic Ray Mouns.
3/ Individual electrons and protons are manipulated and imaged in laboratories every day.
As a true “student of science” I hold that Particle Physics is accepted because the equations predict what experiments repeatedly observe. That’s how science works.
Gordon Robertson at 10:11 PM:
You’re blind to the fact that you’re not questioning science. You’re questioning a version of science that exists only in your own imagination, a collection of straw men that scientists themselves don’t hold.
Gordo,
I enjoy reading your posts. The stuff about Maxwell and Faraday was interesting. It made me go look it up.
It is Academia’s narrative atmosphere = blankit. More CO2 = warmer blankit.
-–
https://www.cristos-vournas.com
Gordon Robertson:
You keep insisting that the Ideal Gas Law explains atmospheric temperatures while radiative transfer is only a “minor player.”
Fine. Then demonstrate it.
Use only the Ideal Gas Law to calculate the approximately 50 K warming of the stratosphere that produces its well-known temperature inversion.
The gas responsible is ozone, whose concentration in the ozone layer peaks at only about 10 ppmv.
Arklady,
The lapse rate due to pressure still applies even in the stratopause however UV heating of the ozone overwhelms and controls temperature. The chain rule differential of a hydrostatic column of air behaving as an ideal gas governs (dt/dz) the lapse rate, until pressure gets so low that something else takes over. Now if you can show where the ideal gas law, or the physics of a hydrostatic column of air don’t apply, then be my guest.
P.S. Arklady,
The purpose of the ozone is to shield life from harmful uv rays. Of course it is going to heat. If it didn’t do that then we wouldn’t be here.
Ozone doesn’t shield, it is a part of the narrative.
–
https://www.cristos-vournas.com
Ozone doesn’t shield? OK, it absorbs UV.
The solar b-b curve is theoretical. There is no measured uv absorbed.
OK Christos,
I know a lot of this science is theoretical. Describe what you believe happens to uV radiation when it impacts Earth’s atmosphere.
OK Christos,
I think I follow you. You believe the atmosphere is too thin to impact uV radiation, correct?
steph p Anderson at 12:02 PM:
You’ve confused the chain rule, a mathematical identity, with a physical mechanism. The chain rule only changes variables, it does not establish causation.
That’s the reason you erroneously concluded that “The lapse rate on Venus is much higher than on Earth”.
It isn’t:
Earth= 9.8 K/Km
Venus= 7.8 K/Km.
Arklady,
Yes, correct about the lapse rates of Venus and Earth. They are about the same and as I look at how it is derived, they should be. The higher atmospheric pressure wouldn’t translate to a higher lapse rate. However, you are incorrect about the chain rule derivative. It describes how the lapse rate is derived, from pressure. It shows what is causative, pressure. Just like the derivative F=ma shows what is causative, F/m. The lapse rate is derived from a hydrostatic column of air behaving as an ideal gas.
steph p anderson at 6:37 PM:
By the chain rule: a=dv/dt=(dv/dx)(dx/dt)
So, by your logic, position causes acceleration.
Idiot!
Venus is a little lower because the specific heat capacity at constant pressure (Cp) is a little bit higher on Venus resulting in a slightly lower lapse rate.
P.S. Arklady, that Venus lapse rate that you quoted is estimated using the chain rule derivative: dt/dp(dp/dz).
Arklady,
With F=ma, the product rule is used.
F= d(mv)/dt, so it is the derivative of momentum and velocity. Or the second derivative of position. It would be silly to say the derivative isn’t causative. It describes how it is derived, where it comes from. Silly argument.
Arklady,
I don’t mind admitting when I say something incorrect. But the main point was not what the lapse rate of Venus is but how it is calculated. It is calculated exactly the same way as the lapse rate on Earth. YOU proved that.
steph p anderson at 6:57 PM:
You accept that Venus’ higher cp gives it a lower lapse rate than Earth’s.
Yet your “chain rule” lapse rate equation “dt/dp(dp/dz)” makes no mention of cp.
Your argument is utter B.S.
Arklady,
Acceleration is determined by the second derivative of position. Who’s the idiot?
You’re not a Marxist. You’re just confused. My son’s sixth grade teacher showed Gore’s film, “An Inconvenient Truth” to all his classes. During the parent-teacher conference I asked him what subject he taught and he told me Social Studies. I asked him if that was part of the curriculum and he said no. His sole intent was to indoctrinate his students. Virtually nothing Al Gore predicted in his film has come to pass but he got an Oscar and a Nobel Prize. Why let them lead you by the nose Arklady?
The fact is these two differential equations, dt/dp(dp/dz), and dCO2/dt = Inputs – Outputs, falsify GHT. There’s nothing you can do to change that.
Oh, for crying out loud Ark, I found a physicist on YouTube who goes through the proof for the lapse rate using the chain rule derivative.
Watch it.
https://www.youtube.com/watch?v=wal9PGqyEyw
TROGLODYTE POSTED A LINK!
\O/
There is hope.
Williard,
I did it just for you. Oh, and Ark too of course.
steph p anderson at 9:30 AM:
WTF does Marxism have to do with any of this?
You have a kid in the 6th grade? You’re just a child yourself; I have trousers in my closet that are older than you!
My youngest son is already planning for his life after retirement.
Go take a long walk off a short pier.
Ark,
Don’t get so angry because I burst your GHT bubble. This is what Barry and his ilk want (and what it has to do with Marxism):
-Radical Green New Deal
-War on Fossil Fuels (Capitalism)
-Open Borders
-No deportations
-No deportations for criminally convicted
-Cut the defense budget
-Defund the police
-Institutionalize diversity, equity and inclusion
-Institutionalize incidental affiliations such as Tran, etc.
-Have groups of the victimized with the white males being the victimizer class
-anti-white, anti-Israel, pro-Palestinian
All of these left-wing Democrats are being wiped out in their primaries by Marxists.
If you want your son to have a retirement, you better reconsider supporting these psychopaths.
Ark,
Also, this youtube vide shows that adiabatic expansion of convective air currents is a polytropic process. The internal energy of the convective rising parcels of air is dissipated through PV work. Sorry to burst your bubble.
https://www.youtube.com/watch?v=apjPWnS7HPs
Ark,
Why the anger at me? Your anger should be directed at these psychopaths who have lied to you since May 24, 2006.
Steph at 12:29 PM:
No anger. I’m still ROTFL.
“Go take a long walk off a short pier.”
Who are you lying to, yourself or me?
Steph at 5:47 PM:
ROTFL. Speak of lying to yourself!
You keep insisting that the chain rule, a mathematical identity, is a physical mechanism.
You even doubled down that position causes acceleration because “Acceleration is determined by the second derivative of position”! Pro-tip: force causes acceleration.
P.S.: steph p anderson
The discussion is not about if “the ideal gas law, or the physics of a hydrostatic column of air don’t apply”. The question is whether the Ideal Gas Law somehow “limits” the effect of trace gases.
The STRATOSPHERE exists as it does because of radiative transfer.
Arklady,
That isn’t the question. The question is whether the GHE causes the temperature difference between the surface and TOA. This is the lapse rate. From classical physics we know it doesn’t. We know there is no radiative component to the lapse rate as it is derived. It is entirely due to pressure.
That’s simply untrue. Pressure determines the rate at which parcels of warm air convect upward and lose their heat, which modifies the positive lapse rate that exists because of the GHE.
“We know” – who is we? You are contradicting standard knowledge in meteorology and atmospheric physics.
“Radiation alone leads to convective instability; the surface becomes sufficiently warmer than the air above it as to lead to convection”
Richard Lindzen, atmospheric physicist, anti-‘alarmist’, knows that the radiative dynamics of the troposphere “alone” is responsible for the positive lapse rate, which leads to convection.
He also says of the no-feedback response to doublong CO2:
“It turns out that the warming is logarithmic in CO2 (because the absorption bands of CO2 are almost saturated, and absorption is associated with line wings), so that each doubling is associated with the same warming. The contribution is about 3.5 W/m2, or of the order of 2% of the normal flux, and leads to warming of about 1C. This result is not considered controversial.”
This guy has been downplaying AGW for years, and is the grandfather of the skeptic movement. You think he’s lying? You think he’s a marxist? Does he want to change the world economy?
No, he knows what he’s talking about and you don’t.
A recent report submitted to the US government by John Christie, Roy Spencer, Judith Curry, Ross McKitrick and Steve Koonin, all firmly AGW ‘skeptics’ with expertise says the same thing.
“the equilibrium warming effect of a doubling of atmospheric CO2 is slightly more than 1C”
The report was commissioned by the Trump administration’s DOE, and these scientists were chosen because of their ‘skeptic’ credentials.
If these ‘skeptics’ agree with me on the basic physics of the GHE and what causes the tropospheric lapse rate, then why are they not also ‘lying’, or ‘marxists’?
No, I’m not lying or a Marxist, you simply have swallowed a crank position, and you have nothing to say about people politically aligned with you on AGW, but have actual expertise and disagree with you on the GHE.
I said the same thing to DREMT – how is the mainstream understanding of the GHE politically or ideologically biased if these guys agree with it?
He didn’t have an answer, and neither will you. Because it doesn’t make sense.
That’s simply untrue. Pressure determines the rate at which parcels of warm air convects upward and lose their heat, which modifies the positive lapse rate that exists because of the GHE.\\\
Lord Kelvin disagrees with you, and Lindzen, and Spencer, and Currie, and Christie, et. al. Also, if you are not a lying Marxist stop acting like one.
Anyone who doubts that radiative dynamics produce inverted temperature gradients at each layer of the atmosphere is free to provide their own model that explains:
a positive lapse rate for the troposphere and mesosphere
a negative lapse rate for the stratosphere and thermosphere
Radiative dynamics provide a plausible and well-verified explanation.
Other explanations, such as ‘pressure’, fail to explain why two layers of the atmosphere contradict the explanation.
No, they don’t. When you get into the upper parts of the atmosphere where pressure is very low (o.75mmHg) or doesn’t exist, and ozone and uV are dominant, it doesn’t contradict anything. When you get above the effective emission height you are talking about different physics. Stop trying to deflect and obfuscate.
You brought up lapse rate (yet again) and when I talk about it I’m ‘deflecting’?
Do you even think about what you write?
Now you’ve adjusted your theory to ‘pressure-dependent temperature applies only in the troposphere’.
Except it doesn’t, because average atmospheric pressure is static, just like the intense pressure near the bottom of the sea doesn’t make it hot there, and like scuba tanks are at ambient temperature with their surroundings.
The positive lapse rate of the troposphere is entirely caused by radiative dynamics (the GHE), as Roy Spencer has stated here numerous times. The purely radiative lapse rate is reduced by the moist adiabatic process, bringing warm parcels of air aloft.
This is basic stuff, empirically observed in numerous ways.
You keep asking why it’s colder up a mountain than below. The answer is that the optical properties of the troposphere make it weakly absorbing of sunlight and strongly absorbing of upwelling infrared radiation.
Don’t know if you are familiar with the ‘skeptic’ cannon, but if you are you will know that upwelling 15um radiation (near Earth’s peak emission intensity) is absorbed almost to complete saturation in the first few metres of the surface. THIS is why it’s warmer nearer the surface than higher in the troposphere. Convection moderates this effect, it doesn’t cause it.
Barry,
Here you go again with your lies. I didn’t adjust anything. It is dominant, due to pressure, in the troposphere. The rise in the lapse rate in the stratosphere is due to uV heating of ozone. Simple. The lapse rate dt/dz = dt/dp(dp/dz) gives a solution of
dt/dz= -g/Cp for Earth Cp=1004J/kg K (Roughly close to water)
which gives a lapse rate of -.0098K/m
There’s nothing you can do about it or deflect. That is how our lapse rate is derived, from pressure.
On Venus Cp is estimated to be 1160J/kg K
which gives a lapse rate of 0.0084K/m
It is determined and derived exactly the same way.
Radiative dynamics, yeah, uV heating of the ozone.
I want to know the answer to my question here, stephen. If I’m saying exactly what Roy Spencer says, does that mean he’s lying, too?
“the decrease in temperature with height in the troposphere is ultimately caused by the greenhouse effect itself.”
– Roy Spencer : https://www.drroyspencer.com/2015/06/what-causes-the-greenhouse-effect/
“The tropospheric temperature lapse rate would not exist without the greenhouse effect. While it is true that convective overturning of the atmosphere leads to the observed lapse rate, that convection itself would not exist without the greenhouse effect”
– Roy Spencer : https://www.drroyspencer.com/2013/01/misunderstood-basic-concepts-and-the-greenhouse-effect/
“The combination of solar heating of the surface and IR absorption and emission by the surface and atmosphere ALONE, WITHOUT ANY CONVECTIVE OVERTURNING would result in an extremely steep tropospheric lapse rate”
– Roy Spencer : https://www.drroyspencer.com/2026/05/pressure-causes-temperature-its-time-to-climb-down-from-mount-stupid/
If you don’t think Roy is lying, why do you think I am? If you do, I’m at a loss to imagine what he gains, as an AGW ‘skeptic’.
When you answer this question, I’ll explain what’s wrong with your use of the Chain Rule.
The math disagrees with Roy Spencer. dz/dp(dp/dt) disagrees with Roy Spencer. Dr. Spencer doesn’t understand that the adiabatic expansion of gas is a polytropic process. The energy is dissipated through work. That doesn’t invalidate convective overturning of the air whose internal energy is lost through work.
Listen I respect Dr. Spencer. But that doesn’t override what math is telling me. That lapse rate is due to pressure. That’s an immutable fact.
What amazes me about AGW fanatics is that if the math disagrees with the theory, then the math must be wrong. Staggers the imagination.
I don’t really care about this. I was willing to accept Dr. Spencer’s position that there is some warming due to man, and there still might be, but it isn’t due to a greenhouse effect. Maybe it’s due to what the stupid Europeans believe that we have too many air conditioners. That’s a joke by the way. We really need to be spending our resources understanding the natural climate cycles. Not using it to kill capitalism.
You can use the chain rule to prove the change in the number of Pirates causes global warming.
NOT
“When you get above the effective emission height you are talking about different physics”
Shorter answer: yes, stephen, the pressure-induced temperature hypothesis falls apart when you test it against the whole atmosphere.
Shorter answer: yes, stephen, the pressure-induced temperature hypothesis falls apart when you test it against the whole atmosphere.
Reply
Yes, it does fall apart. It is because you’re not talking about a hydrostatic column of air behaving as an ideal gas. The physics only apply with a hydrostatic column of air and the ideal gas law. And it does falsify the GHE. It would be like making an argument that gravity doesn’t exist in space therefore the whole idea of gravity is wrong.
They (physicists) use that math to calculate the lapse rate and yet you still deny it. I showed you how the math calculates the lapse rate and it gives you the answer to the lapse rate and you still deny it. Incredible. That is what Marxists do. Deny, deny, deny, obfuscate. Rules for radical’s playbook.
But Stephen,
You don’t have a hydrostatic column of air, so your argument is a house of cards.
barry…”a positive lapse rate for the troposphere and mesosphere
a negative lapse rate for the stratosphere and thermosphere
Radiative dynamics provide a plausible and well-verified explanation.
Other explanations, such as ‘pressure’, fail to explain why two layers of the atmosphere contradict the explanation”.
***
Barry…you can have a negative lapse rate in the troposphere during winter in the Arctic or Antarctic. It’s caused by a lack of solar input proving that the sign of the lapse rate depends entirely on the input of solar energy of some sort. In the stratosphere it is solar UV that causes warming.
In winter, no solar energy reaches parts of the Arctic, therefore the ground becomes colder than the atmosphere and a negative lapse rate occurs for up to a kilometre above the surface. However, The Sun does warm parts of the Arctic atmosphere directly even though it cannot reach the surface. That means air above 1 km gets warmed and the lapse rate become positive again beyond 1 km or so.
In the stratosphere, oxygen molecules gather heat directly from solar UV and warm. The warming is trivial since as Stephen pointed out, the air density is approaching that of a vacuum and there simply are not enough O2 molecules to warm the stratosphere significantly.
Stratospheric temperatures are still well below zero C, so if you want to call that warming, be my guest. That is the only reason the lapse rate declines in the stratosphere.
In essence, the alterations in the lapse rate are due to external heat sources interfering.
With regard to temperature, as pressure reduces, temperature must reduce as well. There is nothing magical going on here, the IGL is not a mysterious entity. As I tried to explain before, at the atomic level, both pressure and temperature in a gas have kinetic energy in common. If KE reduces then both P and T must reduce in a constant volume scenario.
If you inflate a tire, the pressure and temperature will rise in step inside the tire. However, given time, heat will bleed off through surfaces and T will drop. Where can the heat go in the atmosphere due to the same pressure-temperature relationship. It can’t bleed of anywhere hence the constant P-T decline with altitude.
That is not enough in itself, however, without solar input there would be no heat to talk about re human survival. What I am trying to say is that the Sun heats the atmosphere and the surface and the surface then heats air molecules directly, so they rise into a cooler less dense atmosphere. As they rise into a progressively less dense atmosphere they lose heat naturally due to those conditions, as specified in the IGL, and that lost heat does not have to be returned to space since it is no loner thermal energy. It has simply ceased to be at anywhere near the level it was injected into the Earth’s system.
It’s right there in Gay-Lussac’s law, one of the elements of the IGL, …P1/T1 = P2/T2. If that relationship is true in a static environment (equation of state) then it has to be true in a dynamic environment in the long run. Weather systems will average out in the long term.
Even though our atmosphere is turbulent, and often extremely turbulent, it does not affect the fact that if you start at sea level and climb to 30,000 feet, you will have 1/3 of the air pressure at the top than at the bottom. Overall, the atmosphere does not care about turbulence, it averages out so the lapse rate is constant in a certain context.
Focusing AGW on radiation alone, and trace gases, was a serious mistake. I think it was likely done by early modelers who were dependent on differential equations like Navier-Stokes. They seemed to ignore the importance of conduction/convection, likely because they could not figure it out mathematically.
That is why we have turbulent weather patterns. You cannot divorce weather from the IGL since one is the cause of the other. If you live on the Canadian prairies, and it feels hot and muggy in summer, you can almost bet that violent weather is just around the corner. The heated, rising air causes that turbulence and the only reason the air rises is because of the pressure gradient and its close-knit relationship to temperature.
If you had no pressure gradient, and the atmosphere was topped by a glass dome, vertical convection would not be an issue. Temperature and pressure would be totally even throughout the dome.
You simply cannot ignore the uniqueness of our situation here on Earth. We have the perfect atmosphere and the perfect rotational speed for our needs. Without gravity and its dependence on the inverse square law we’d have no negative pressure gradient. In fact, we’d have no atmosphere at all.
ark…the Ideal Gas Law limits nothing. It is simply documented relationships, based on observation, in a gas between pressure, temperature, volume, and the number of molecules of each gas.
The limitation is in the gas properties themselves. If you have CO2 at 0.06% mass, it lacks the number of molecules to change the average KE significantly of the other 99.94% of the other molecules.
CO2 can only transfer heat through collisions. At 0.04% by volume it means each CO2 molecule is surrounded by about 2500 other molecules.
The heat diffusion equation deals with that directly. It covers how much heat can be diffused into another gas by a gas carrying heat to be transferred. The heat diffusion equation agrees with the IGL and that is far more than coincidence.
Climate alarmists have addressed this through the pseudo-science of thermalization, a theory based in imaginary quantum theory by which a trace gas can magically spread immense amounts of heat to other gas molecules. One can infer great science through black magic, the problem being that no one can demonstrate it in a lab.
Gordon Robertson at 2:40 AM:
Here you wrote that “…the IGL limits CO2 to a warming factor of 0.06C per 1C warming in the atmosphere…” Now you say that “the Ideal Gas Law limits nothing.”
Then I asked you to use the Ideal Gas Law to explain the stratospheric temperature inversion. You couldn’t.
Now you move the goalposts to molecular collisions and thermalization as pseudo-science and black magic. Typical.
Your “2500 surrounding molecules” argument is completely empty. Ozone reaches only about 10 ppmv in the stratosphere, yet it absorbs solar UV radiation so effectively that it warms the stratosphere by roughly 50 K and creates the temperature inversion. By your own reasoning, ozone should be incapable of doing this.
Your denial of thermalization is equally sad. Thermalization is standard molecular physics that has been measured in laboratories for generations and agree with theory to remarkable precision. It is the basis of infrared spectroscopy, combustion diagnostics, atmospheric remote sensing, gas lasers, and many other radiative transfer applications validated against observations.
Invoking the heat diffusion equation does not help your argument either. Diffusion describes how energy already present moves through matter, it doesn’t explain where the energy came from. In the stratosphere, the source is ozone absorbing solar radiation, and in the troposphere, GHGs affect IR radiative transfer. Diffusion is not an alternative to radiation; it operates after radiation deposits energy.
I challenged you to derive the stratospheric temperature inversion using only the IGL.
You failed.
Discussion over.
Gordon,
There are 4 quadrillion CO2 molecules in a cubic centimetre of air at sea level. This isn’t some sparse population, but a dense fog, which is why 15 um radiation is saturated near the surface. There are enough CO2 molecules to gobble all of that spectrum up. Even the other 99.94% of O2 and N2 (and water vaour) colliding with other molecules 7 billion times a second cannot unsaturate CO2 in the layer near the surface. There’s not enough neighbouring gases to take that energy away from CO2 fast enough.
CO2 doesn’t give off heat, it gives off energy. It takes a second for a CO2 molecule to emit IR it has absorbed. In that time it has had a billion collisions and transferred its energy 65,000+ times (only a fraction of collisions result in energy transfer).
The energy transfer increases the speed of the collided N2 or O2 molecule. Increasing the kinetic speed of a gas molecule is, by definition, raising its temperature. This isn’t magic; it’s standard thermodynamic energy conversion.
If more infrared radiation is absorbed by higher, thinner, not saturated layers of atmosphere, then there is more energy to be transferred to the other 99% of the atmosphere, increasing the kinetic speed of the molecules and raising the temperature.
Finally, the whole atmosphere can’t shed the energy it gains from the surface (or the sun) by collision. It can only shed that energy to space via radiation. That’s where you determine the energy budget.
There are approximately 100,000 collisions with an excited CO2 molecule for every photon that it could emit. (Tyndall’s experiments were with pure CO2 gas.) These collisions are with all of the atmospheric gases. IR radiation is emitted from the Earth’s surface, not from below the Earth surface. The atmosphere is in contact with the Earth’s surface. There are 2.7 x 10^19 molecules in a cubic centimeter of air of the atmosphere. This is much higher than a quadrillion. There is much higher probability of conduction and convection at the surface and not radiative transfer. Is it possible the amount of radiative transfer from the surface has been way over estimated? The satellite spectrum that continues to be linked by many including Nate is not radiative absor-ption of CO2 in the atmosphere. It is OLR.
By the way, this model would fully conform to the correct mathematical derivation of the lapse rate. What is the percentage of conduction, convection and radiation from the surface? Don’t know but it appears due to the lapse rate that radiation has been way over estimated.
The lapse rate is negative (temperature decreases with altitude) until about 11000 meters where it becomes zero and then becomes positive in the stratosphere. The effective emission height where OLR originates appears to be substantially below 11000 meters, so the radiative forcing does not affect the lapse rate on up to 11000 meters. All of the evidence points to no or very little greenhouse effect and most of that would be from water vapor.
Stephen p anderson
Reading your post confirms you are not honest about your grades. You seem to have zero knowledge or understanding of any valid thermodynamics. You can’t understand your lapse rate is not a confirmation of pressure heating the surface but a calculation of the amount of drt adiabatic lapse rate. It is the rate a parcel of dry air expands into the surrounding air cooling as it does work against the surrounding air. The lapse rate is caused by the surface receiving bulk of solar energy and radiative cooling at TOA. It is the same as any temperature gradient. The lapse rate is lower than pure radiative lapse rate because when lapse rate steepens past the dry adibatc spontaneous convection reduces the steeper gradient formed by solar heating of surface. You are very prone to false information. Find a link to real science and not right-wing fanatics that would validate your crackpot thought process that a steady pressure can increase energy at a surface. Pressure changes ate required to change temperature. Once a pressure is constant it does not change tperature. Another example of a temperature gradient is the solid part of the Earth. The core is quite hot but the temperature drops from core to surface. Ocean has reverse gradient. Solar energy absorbs at top and temperature goes down as you decend. Your mind is mush accepting any false information from right-wing sources. You no longer think, just react! Some fanatic told you Climate Change is Mew World Order Left Conspiracy and you lack enough critical thought to evaluate this on a scientific basiis and just accept any counter idea no matter how bad it is on a purely science level. Are you a fan of the lying grifter Alex Jones who just makes up stuff to see who is gullible enough to buy the items he peddles. I wonder if you drank bleach during Covid. You are not an intelligent person. At least i can see why people still support lying grifter Trump who is using the power of President to enrich himself and family. Trump supporters do not seem to have thinking ability.
Norman,
I posted a link of a physicist providing a proof of the lapse rate using the chain rule of a column of air behaving as an ideal gas. Then I showed how that proof gives you our lapse rate that we use. Nowhere in the proof does radiative forcing appear in the proof, and still you deny. The difference in temperature from the surface to the TOA does not cause the lapse rate. That would be like saying the difference in altitude from the surface to the TOA causes acceleration. Pressure doesn’t cause the heating, gravity does. Gravity causes the pressure. The moist lapse rate is smaller than the dry lapse rate because of the specific heat capacity of water. There’s a guy on YouTube who derives the moist lapse rate. All you have to do is look it up. But you won’t do that. (If it were due to radiative forcing it should be higher, shouldn’t it?) The moist lapse rate is a function of the dry lapse rate which is due to pressure. But you wouldn’t understand that because your math and logic skills suck.
Stephen 8:31 am, nowhere in the troposphere lapse rate proof does radiative forcing appear in the proof because the air parcel is at the same temperature as its surroundings at all altitudes so there is no radiative forcing on the parcel.
The parcel is always at the same pressure as its surroundings also so there is no work done on, or by, the parcel along that lapse rate curve either.
B4,
You’re right. Radiative forcing has no role in the lapse rate. That’s why it falsifies the greenhouse effect.
stephen 11:59 am, the planetary greenhouse effect (stephen term) has been reasonably measured non-zero (at least since NIMBUS) so it’s evidently not falsified at all.
The lapse rate can vary by orders of magnitude near surfaces and where water vapor is condensing to liquid or ice thus the lapse rate cannot be used to falsify the effect of varying atm. optical depths more commonly known as the GHE.
It staggers the imagination on how little you know about the theory you champion. The NIMBUS program does nothing to falsify the pressure induced lapse rate. You repeat the same mantra as your sycophants all in direct opposition to the mathematical proof of the lapse rate. If the temperature difference from the surface to the effective emission height isn’t due to the GHE but is mathematically shown that it is due to pressure, then GHT is false. Repeating a lie does not eventually make it true.
stephen 3:54 pm, the NIMBUS program did nothing to falsify the pressure induced lapse rate as you write because it was intended to measure the global, annualized magnitude of the Earth system brightness temperature at the satellite’s altitude which it did reasonably well over its long enough observation period.
I just gave you a couple of assumptions in the mathematical proof of the troposphere lapse rate so I am not at “all in direct opposition to” it as stephen erroneously writes.
The global, annualized thermometer temperature at the base of the troposphere starting point (z=0) for the lapse rate is determined by Earth’s atm. thick optical depth where the lapse rate in temperature above the surface up to the tropopause (far enough from surfaces both with condensation and without) is commonly measured in close agreement with theory.
Above the tropopause, the lapse in temperature in the midlatitude tropics becomes zero on avg. for about 9km of height where the atm. pressure continues to reduce so you are wrong that the temperature(z) difference only “is due to pressure”.
This all means stephen’s 3:54 pm comment is essentially wrong that “then the GHT is false.”
stephen p anderson
I believe the chain rule for the lapse rate determines the value but is not the cause. Pressure is the critical factor since a rising air parcel will cool based upon how much work it does not the surrounding air and the rate it expands and cools.
Here is what actual physics experts say on the topic.
https://van.physics.illinois.edu/ask/listing/19799
Hope you read the link.
Here is a quote from it: “So everybody knows there are big gradients in the temperature of the atmosphere, although they aren’t monotonic. Only crackpots think that gravity makes temperature gradients in equilibrium.”
Another issue is with your relentless belief that Edwin Berry found a flaw in GHT. He is just a higher level BS’er than your average. He can make a convincing argument with gibly-gook math and convince a gullible person, like you, that he is on to something.
Mr. Anderson, if your mind was rational and able to think (now you are a right-wing lunatic that is emotionally driven and posses no logical thinking ability, which I think is really sad) that Berry’s idea is nonsense on the most fundamental basis.
Here is why. You won’t agree with me but try to use what little mind you have left to consider it.
Facts. The CO2 mankind is producing all goes into the atmosphere, they are not pumping it into the ocean sink. Humans put 38 gigatons of CO2 into the air a year.
“1 ppm of CO₂ in the atmosphere = ~7.8 gigatons of CO₂
38 gigatons of CO₂ = ~4.87 ppm”
“While 38 gigatons of human-made emissions is mathematically equal to about 4.87 ppm, the amount of CO₂ that actually stays in the air is different. Because natural carbon sinks (oceans, soil, and plants) absorb roughly half of our yearly emissions, an emission of 38 gigatons usually increases Earth’s atmospheric concentration by about 2.2 to 2.5 ppm in a given year.”
So the ocean and land still have to act as CO2 sinks and NOT producers of atmospheric CO2. Logic for you, if the oceans were the source of the increased CO2 observed in our atmosphere, then the amount we are adding would be above 4.87 because the ocean increase would add to what humans add. That is why Edwin Berry is a crackpot and why no valid science person confirms it is a good idea. It is flawed with the most basic of logic. If humans and sinks are both adding to the atmosphere the amount humans are adding would not decrease. Most your sources are just right-wing lunatics not valid science. They gave up critical logical thought and become BS’ers to manipulate gullible people like you to create the lunatic MAGA cult mentality based on lies, emotion, and very little thinking.
The IGL allows the transfer of energy between CO2 molecules and the rest of the atmosphere.
Thermalization is one of the assumption in the IGL.
This is covered in first year college Chemistry, which you had to have taken in order to take Organic Chemistry.
Not usually an elective in any Engineering program. Though a requirement for Chem engineering.
“Earth’s atmosphere is actually the sole reason why Earth has a higher average global temperature (+15°C) than the Moon (-19°C), representing 100% of this 34°C baseline difference. ”
Why the Moon (-19°C), (254K)?
https://simple.wikipedia.org/wiki/Moon
Surface temp. min mean max
equator 100 K 220 K
85°N[3] 70 K 130 K 230 K
–
https://www.cristos-vournas.com
Christos,
You came to the conclusion with spin. However, either method falsifies GHT.
Gordon Robertson at 10:11 PM:
I have been a student of science since grade school. Circa grade 7, we were required to do an aptitude test and I scored high in science and journalism, of all things. By grade 10, I was studying electronics, not because an aptitude test told me to do so but due to my inquisitive nature.
My dad had given me a gift at Christmas which I had to assemble and it was a small crystal set that could receive certain radio stations. I went on to study electronics in high school and it has been my life long study.
Cool story.
My dad was a Chemical Engineer, the best I’ve ever known. All my childhood friends were the children of engineers and/or scientists.
I think Engineering and scientific careers tend to run in families, not because there is a “gene for engineering,” but because children inherit a combination of cognitive traits, are exposed to STEM from an early age, benefit from a science-oriented home environment, and often follow educational and career paths modeled by their parents.
ark…”My dad was a Chemical Engineer, the best I’ve ever known. All my childhood friends were the children of engineers and/or scientists”.
***
Thanks for sharing about your dad and your friends. My hat goes off to your dad since I know a chemical engineering degrees is one of the toughest to achieve. Good for him.
I think I was driven by an insatiable curiosity, a lot of which came from my dad. I still have that curiosity and it is often mistaken for arrogance or being a know it all. Part of that is my fault since I tend to pose questions as statements of fact, knowing full well that I really don’t have a corner on answers.
Growing up in a small Scottish village, centred around a coal mine and surrounded by farms, I had an uncle who lived just around the corner. He had a large workshop full of machines and large yard full of junk that I was allowed to explore. That drove my imagination as well, just being around that stuff.
The more I hang around this life the more I realize how much I don’t know and the more I am impressed with what I don’t know. I regard the universe as a wonderful place to live and I wish I knew more about its secrets.
By the way, the lapse rate is negative in the lower atmosphere.
bob…it’s actually negative in the Arctic and Antarctic winter for the first kilometre or so above the surface. Without solar heating, the surface becomes colder than the atmosphere and there is essentially no heated air to rise. However, even in the dark of winter, solar energy can reach the atmospheric gases a km or more above the surface and warm it. Then the lapse rate becomes positive again.
Gordon,
That would be a positive lapse rate.
If temperature increases with elevation.