
 Home/Blog
The Version 6.1 global average lower tropospheric temperature (LT) anomaly for October, 2026 was +0.69 deg. C departure from the 1991-2020 mean, up from the September, 2026 value of +0.61 deg. C.
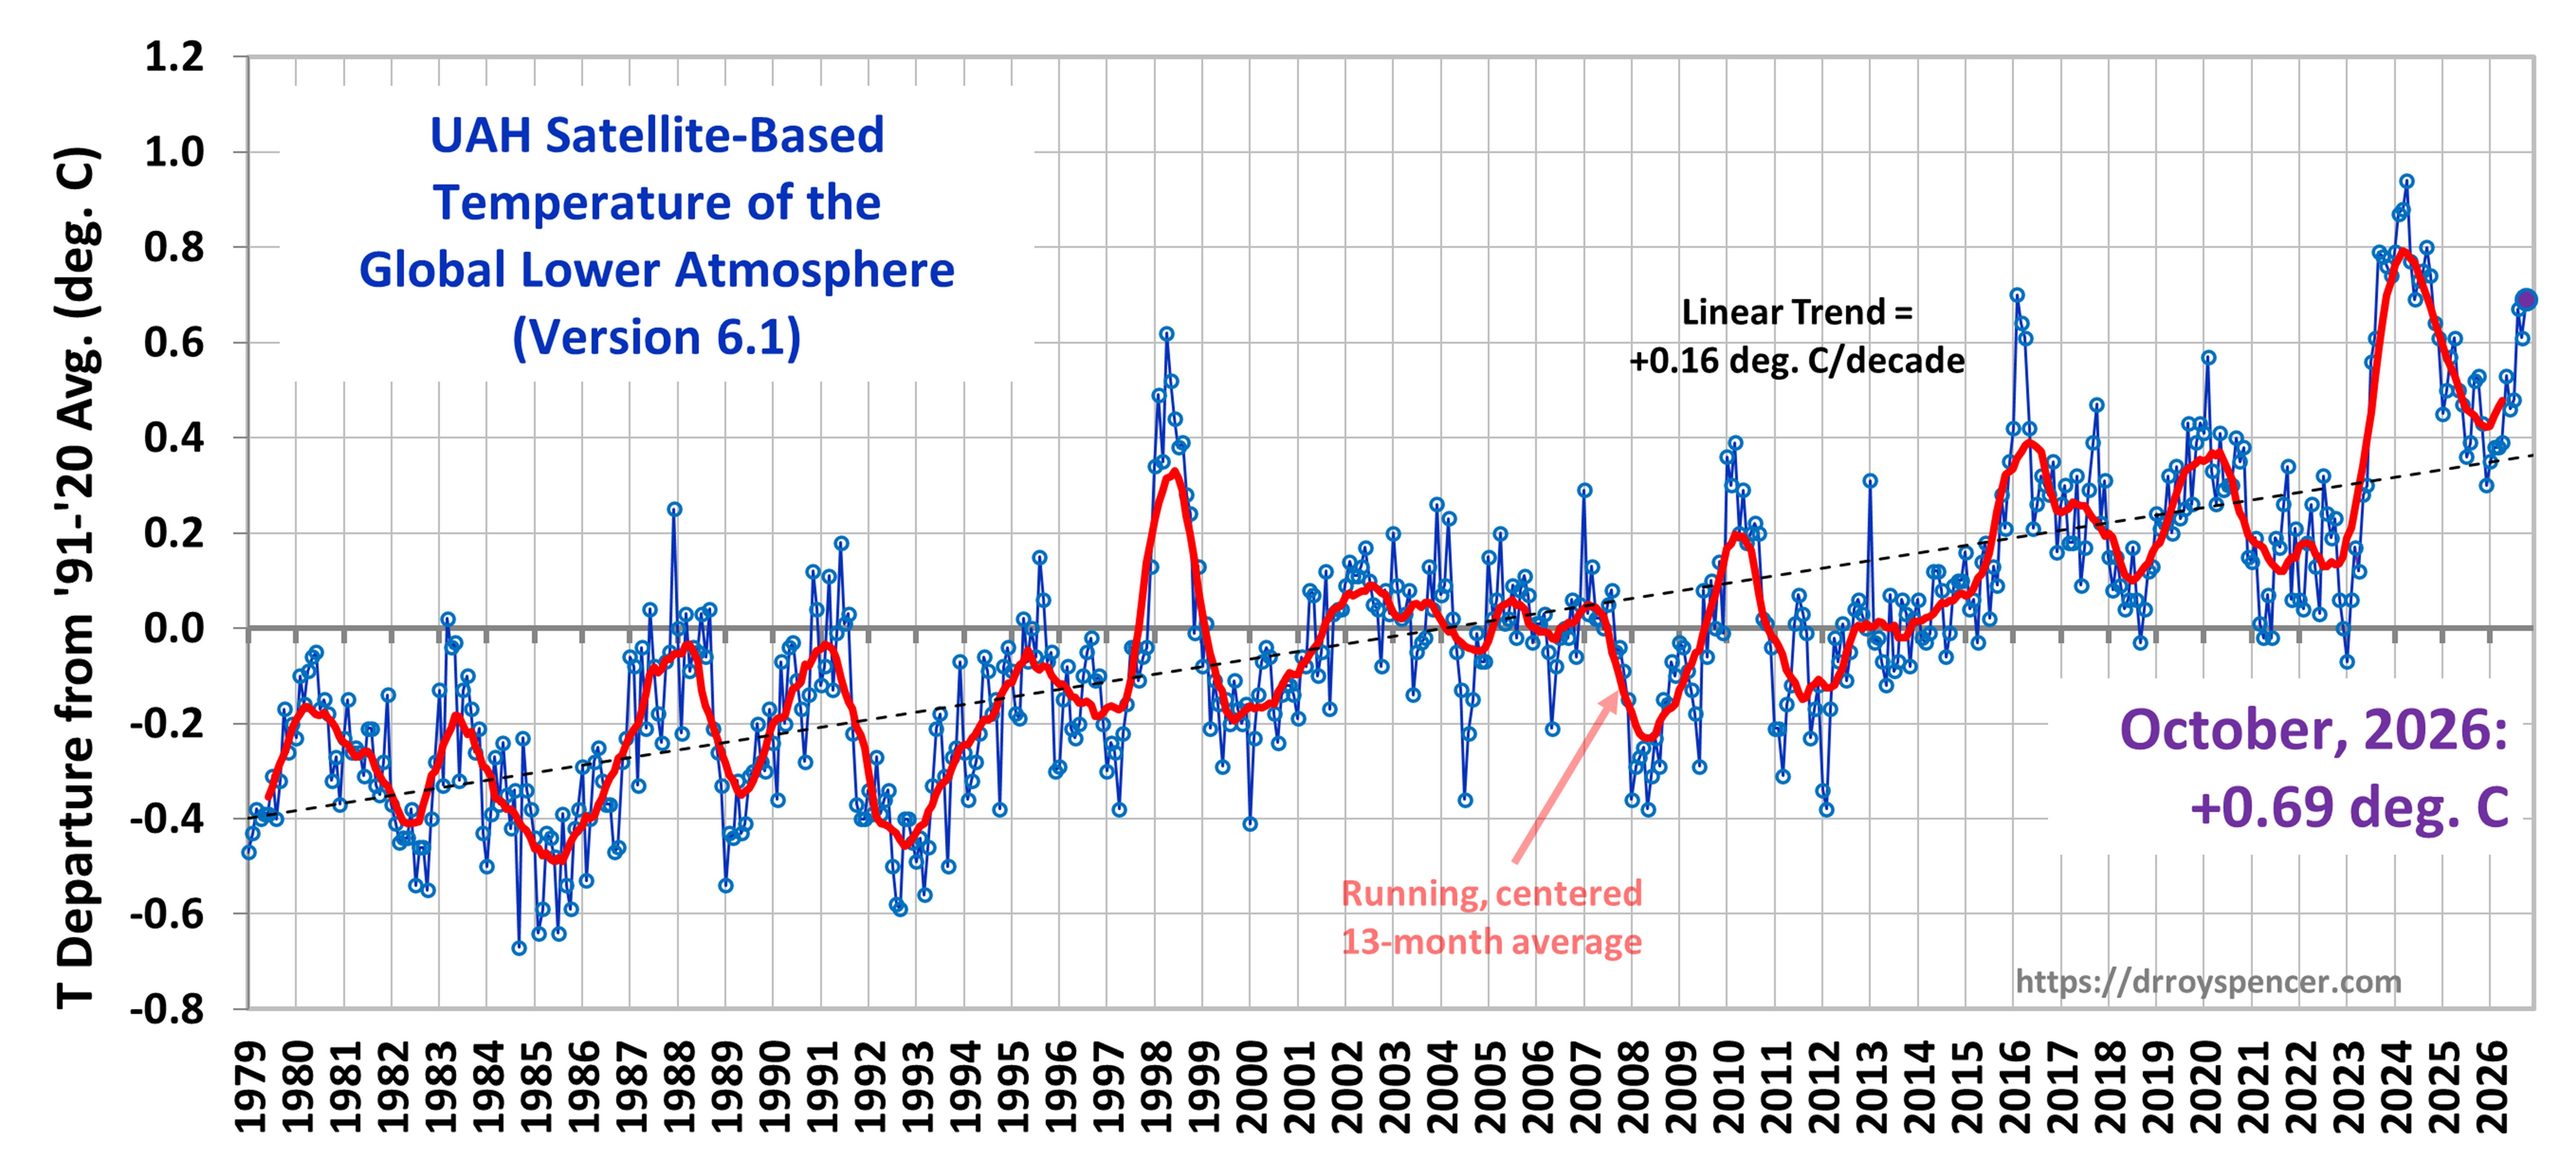
The Version 6.1 global area-averaged linear temperature trend (January 1979 through October 2026) remains at +0.16 deg/ C/decade (+0.22 C/decade over land, +0.13 C/decade over oceans).
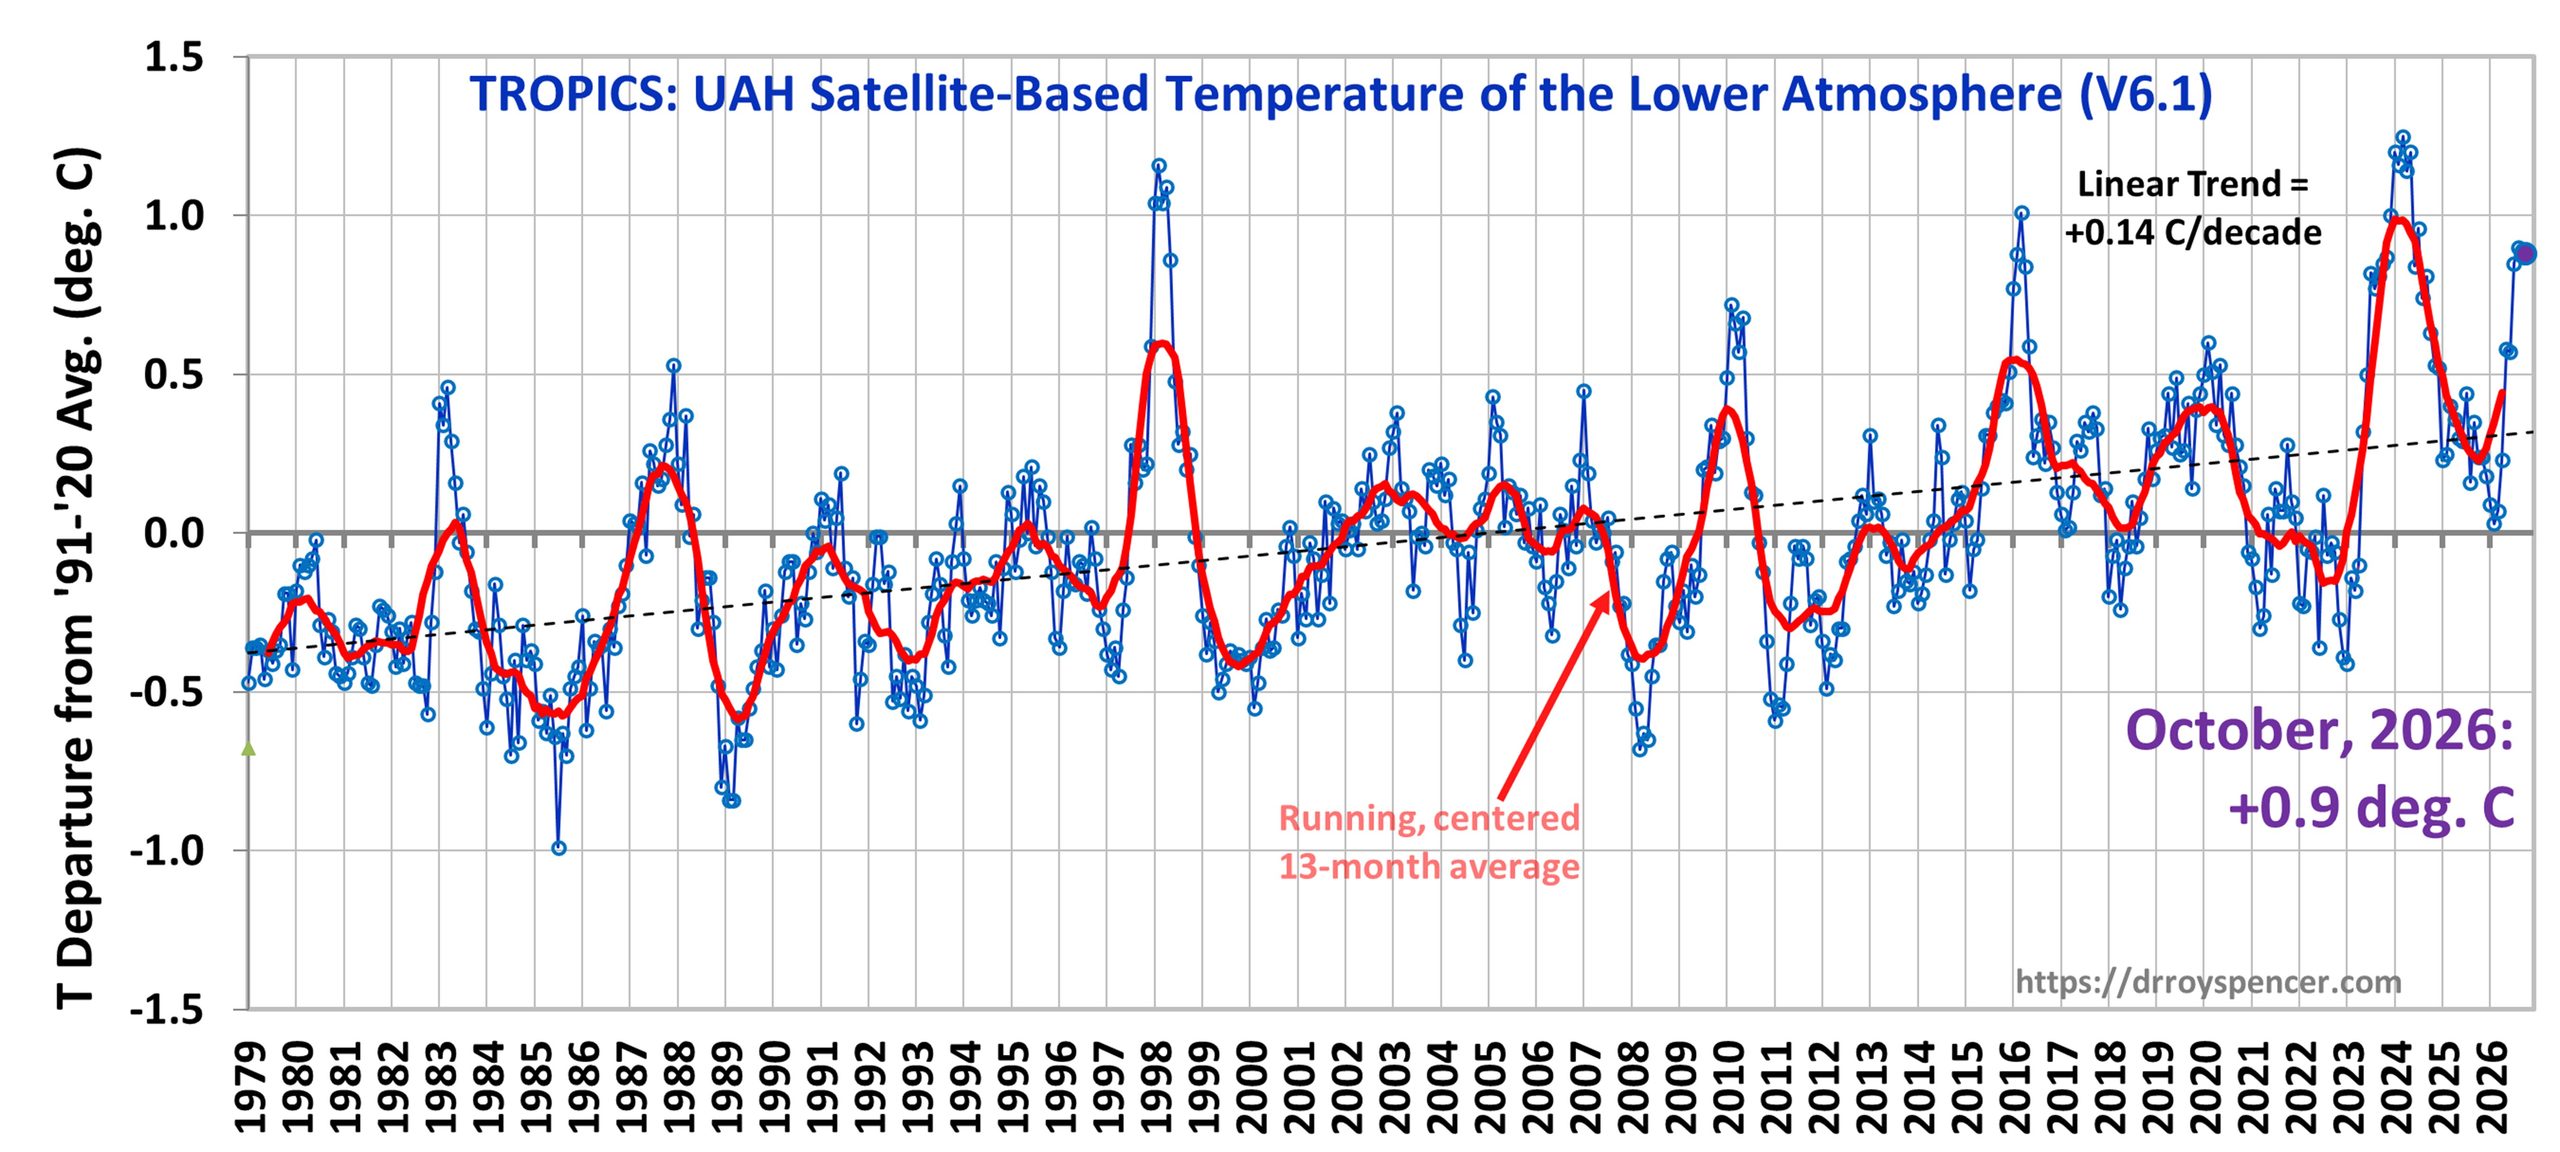
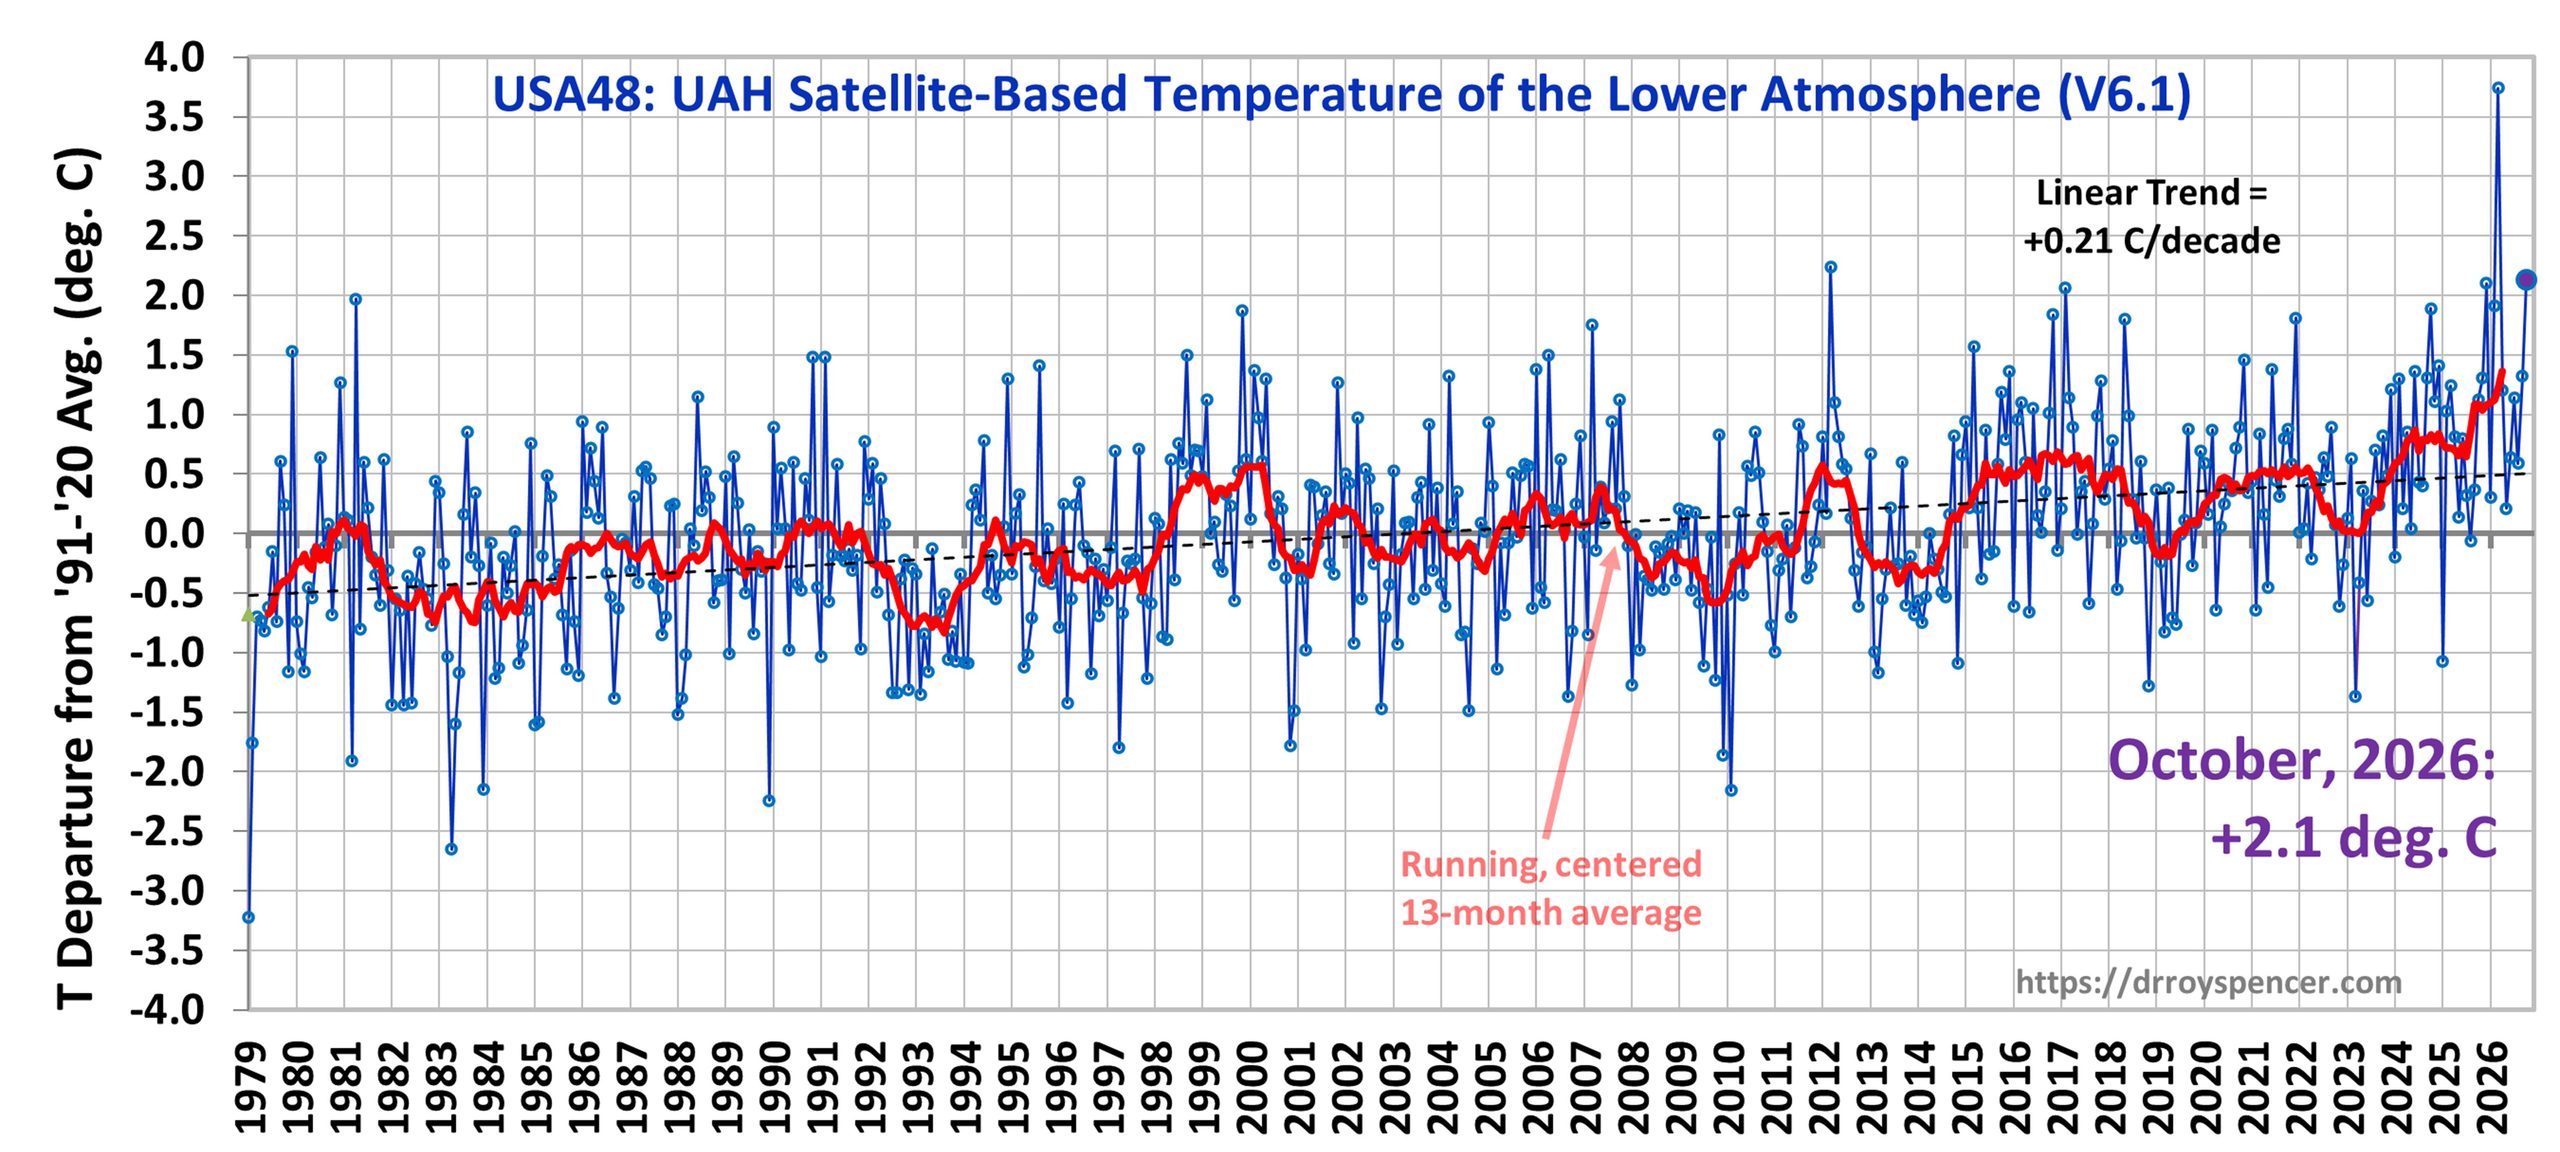
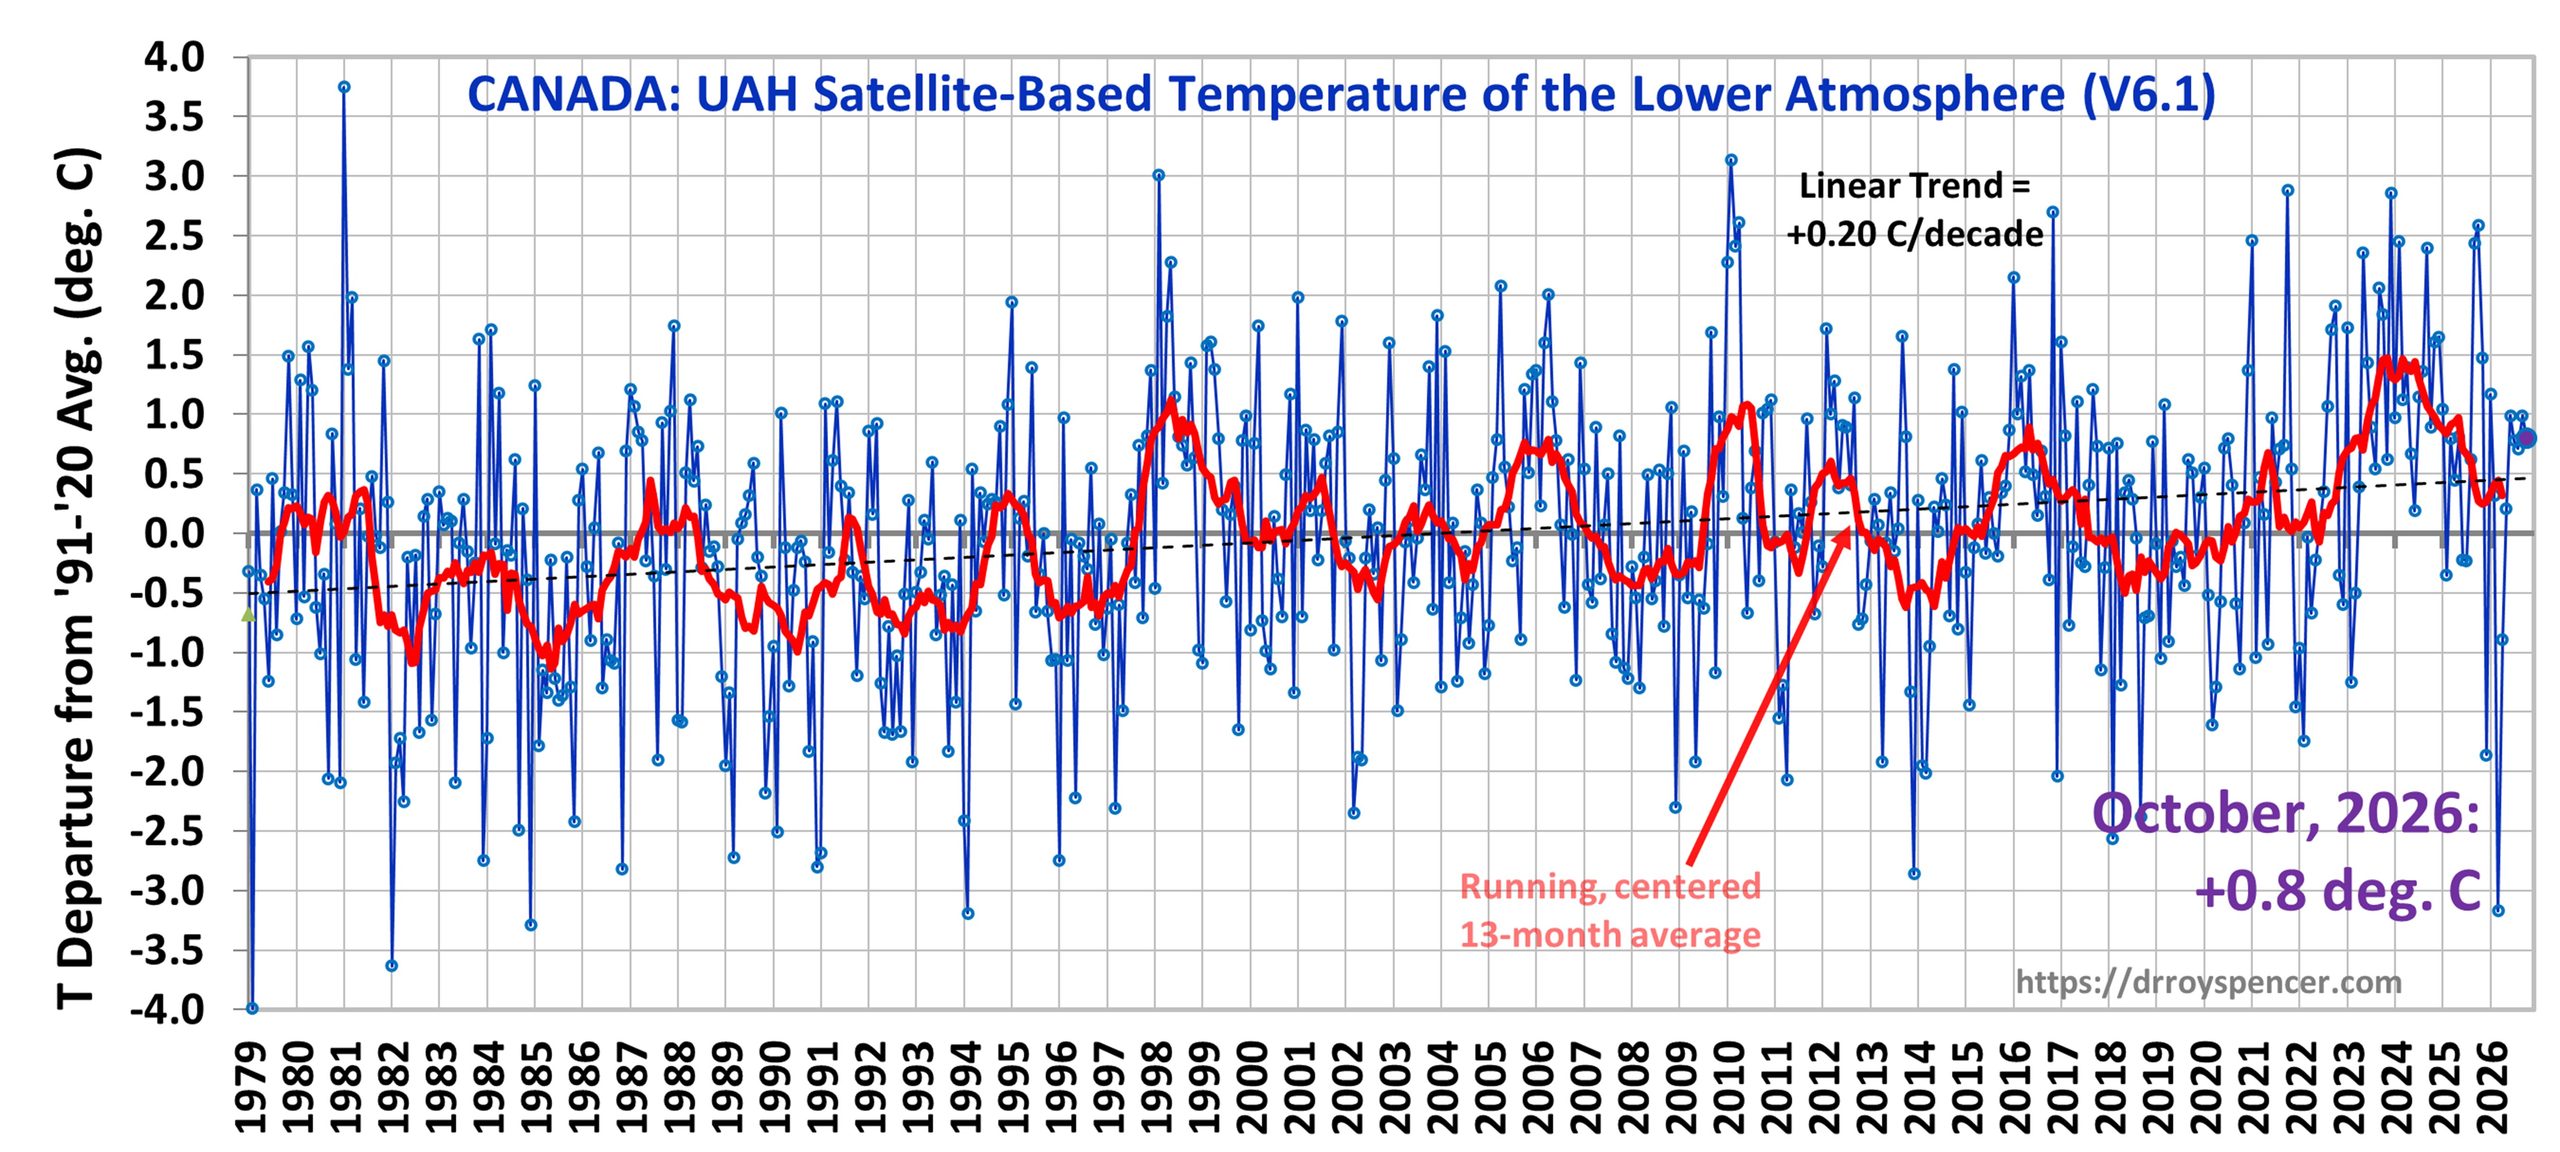
The following table lists various regional Version 6.1 LT departures from the 30-year (1991-2020) average for the last 34 months (record highs are in red).
| Year | Mon | Globe | NHem | SHem | Tropic | US48 | Arctic | Aust. | Can. |
| 2024 | Jan | +0.79 | +1.02 | +0.57 | +1.20 | -0.20 | +0.40 | +1.11 | +0.97 |
| 2024 | Feb | +0.87 | +0.94 | +0.81 | +1.16 | +1.30 | +0.86 | +1.15 | +2.45 |
| 2024 | Mar | +0.88 | +0.95 | +0.80 | +1.25 | +0.21 | +1.05 | +1.33 | +1.12 |
| 2024 | Apr | +0.94 | +1.11 | +0.76 | +1.14 | +0.85 | +0.88 | +0.53 | +1.39 |
| 2024 | May | +0.77 | +0.77 | +0.78 | +1.20 | +0.04 | +0.20 | +0.52 | +0.67 |
| 2024 | June | +0.69 | +0.77 | +0.60 | +0.84 | +1.36 | +0.64 | +0.90 | +0.19 |
| 2024 | July | +0.73 | +0.85 | +0.61 | +0.96 | +0.43 | +0.56 | -0.07 | +1.15 |
| 2024 | Aug | +0.75 | +0.81 | +0.69 | +0.74 | +0.40 | +0.88 | +1.74 | +1.36 |
| 2024 | Sep | +0.80 | +1.04 | +0.57 | +0.81 | +1.31 | +1.48 | +0.97 | +2.40 |
| 2024 | Oct | +0.74 | +0.89 | +0.60 | +0.63 | +1.89 | +0.81 | +1.08 | +0.89 |
| 2024 | Nov | +0.64 | +0.87 | +0.40 | +0.53 | +1.11 | +0.79 | +0.99 | +1.61 |
| 2024 | Dec | +0.61 | +0.75 | +0.47 | +0.52 | +1.41 | +1.12 | +1.53 | +1.65 |
| 2025 | Jan | +0.45 | +0.69 | +0.20 | +0.23 | -1.07 | +0.74 | +0.47 | +1.04 |
| 2025 | Feb | +0.50 | +0.55 | +0.45 | +0.25 | +1.03 | +2.10 | +0.86 | -0.35 |
| 2025 | Mar | +0.57 | +0.73 | +0.41 | +0.40 | +1.24 | +1.23 | +1.20 | +0.80 |
| 2025 | Apr | +0.61 | +0.76 | +0.46 | +0.36 | +0.81 | +0.85 | +1.21 | +0.45 |
| 2025 | May | +0.50 | +0.44 | +0.55 | +0.30 | +0.14 | +0.75 | +0.98 | +0.81 |
| 2025 | June | +0.47 | +0.48 | +0.47 | +0.29 | +0.80 | +0.05 | +0.38 | -0.22 |
| 2025 | July | +0.36 | +0.49 | +0.23 | +0.44 | +0.32 | +0.40 | +0.52 | -0.23 |
| 2025 | Aug | +0.39 | +0.39 | +0.39 | +0.16 | -0.06 | +0.82 | +0.11 | +0.62 |
| 2025 | Sep | +0.52 | +0.55 | +0.49 | +0.35 | +0.37 | +0.77 | +0.30 | +2.44 |
| 2025 | Oct | +0.53 | +0.52 | +0.55 | +0.24 | +1.12 | +1.42 | +1.66 | +2.59 |
| 2025 | Nov | +0.43 | +0.58 | +0.27 | +0.24 | +1.31 | +0.78 | +0.36 | +1.47 |
| 2025 | Dec | +0.30 | +0.45 | +0.15 | +0.18 | +2.10 | +0.32 | +0.37 | -1.86 |
| 2026 | Jan | +0.35 | +0.51 | +0.19 | +0.09 | +0.30 | +1.40 | +0.95 | +1.17 |
| 2026 | Feb | +0.38 | +0.54 | +0.23 | +0.03 | +1.91 | -0.48 | +0.73 | +0.32 |
| 2026 | Mar | +0.38 | +0.33 | +0.42 | +0.07 | +3.74 | -0.48 | +1.14 | -3.17 |
| 2026 | Apr | +0.39 | +0.43 | +0.34 | +0.23 | +1.20 | +0.30 | +0.70 | -0.89 |
| 2026 | May | +0.53 | +0.46 | +0.60 | +0.58 | +0.21 | +0.34 | +0.10 | +0.21 |
| 2026 | June | +0.46 | +0.54 | +0.38 | +0.57 | +0.64 | +1.01 | +0.38 | +0.99 |
| 2026 | July | +0.48 | +0.68 | +0.27 | +0.85 | +1.14 | +0.53 | -0.22 | +0.78 |
| 2026 | Aug | +0.67 | +0.76 | +0.59 | +0.90 | +0.59 | +0.80 | +0.39 | +0.71 |
| 2026 | Sep | +0.61 | +0.78 | +0.44 | +0.89 | +1.32 | +0.80 | +1.13 | +0.99 |
| 2026 | Oct | +0.69 | +0.82 | +0.57 | +0.88 | +2.13 | +1.18 | +0.46 | +0.80 |
| Year | Mon | Globe | NHem | SHem | Tropic | US48 | Arctic | Aust. | Can. |
Time Series Plots for Tropics, USA48, Canada, and Australia
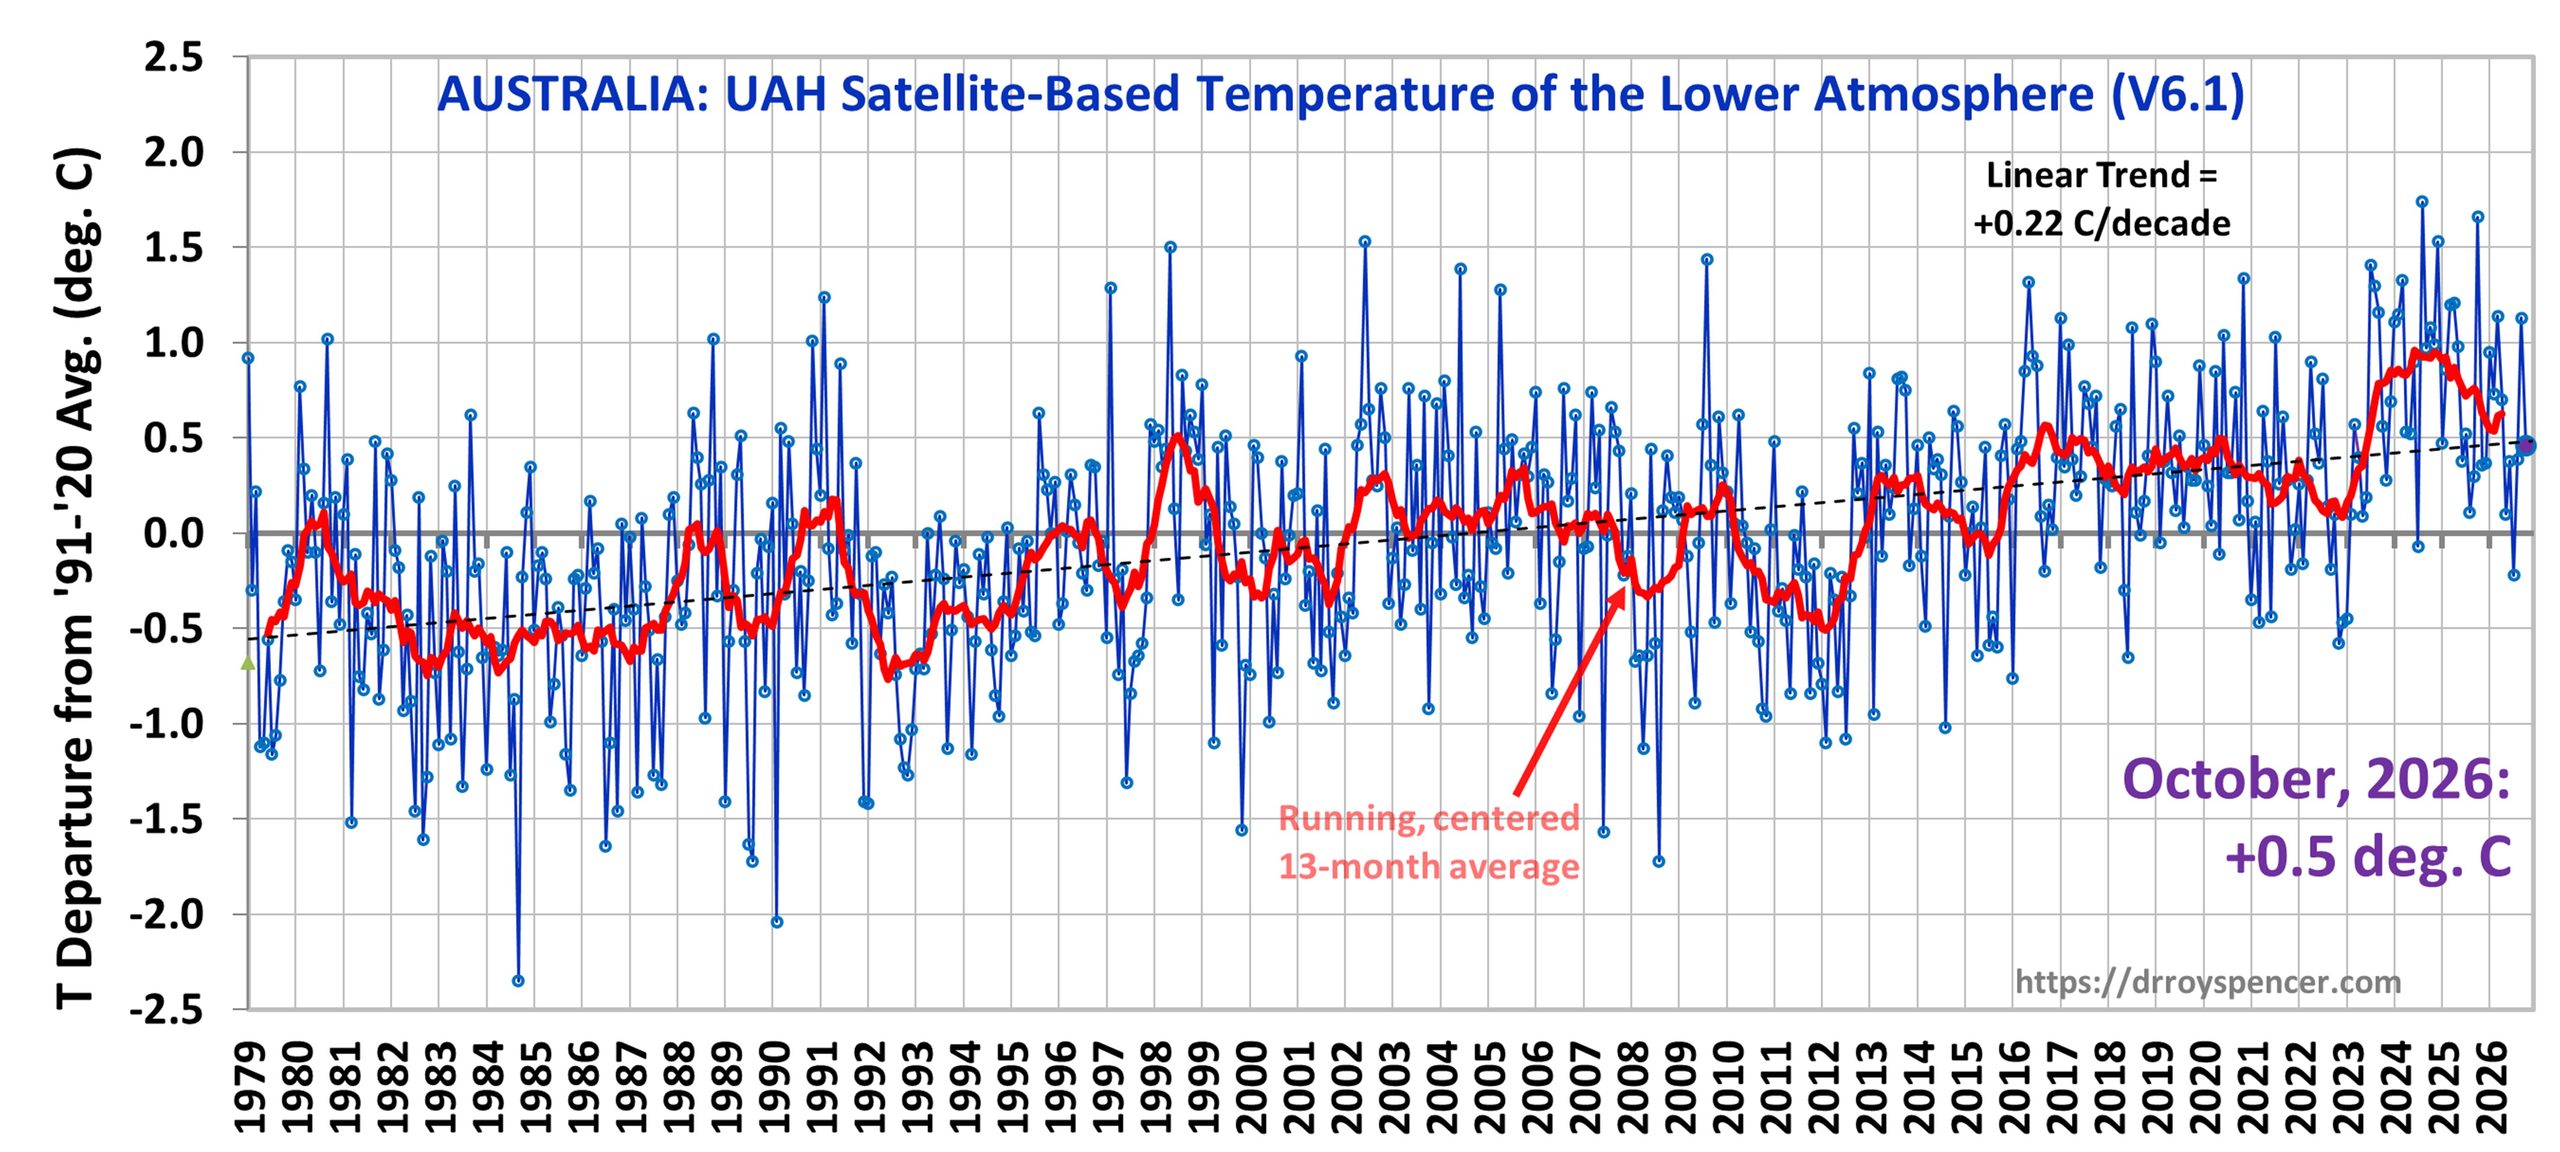
The full UAH Global Temperature Report, along with the LT global gridpoint anomaly map for October, 2026 and a more detailed analysis by John Christy, should be available within the next several days here.
The monthly anomalies for various regions for the four deep layers we monitor from satellites will be available in the next several days at the following locations:





Seems to be a pause in the recent warming, yet that trend is pretty obvious on the graph. So, is the warming accelerating? Maybe. I am curious what the graph will look like, say, 5-6 years out after this El Niño has come and gone and we have experienced another La Niña.
The discussion at the beginning of last months’ blog was interesting to me. It revolved around whether a linear or polynomial description was the best way to represent this data. Maybe slightly concave upwards? The slope of the line has been increasing. If someone has earlier rates of increase, that would interest me. I suppose you should probably take equal slices of time (20 yr or 30 yr) to make a good comparison.
Also, is the measurement error deemed to be much smaller than 0.01 deg. C? I don’t see anything on the graph about this.