
 Home/Blog
The Version 6.1 global average lower tropospheric temperature (LT) anomaly for September, 2026 was +0.61 deg. C departure from the 1991-2020 mean, down from the August, 2026 value of +0.68 deg. C.
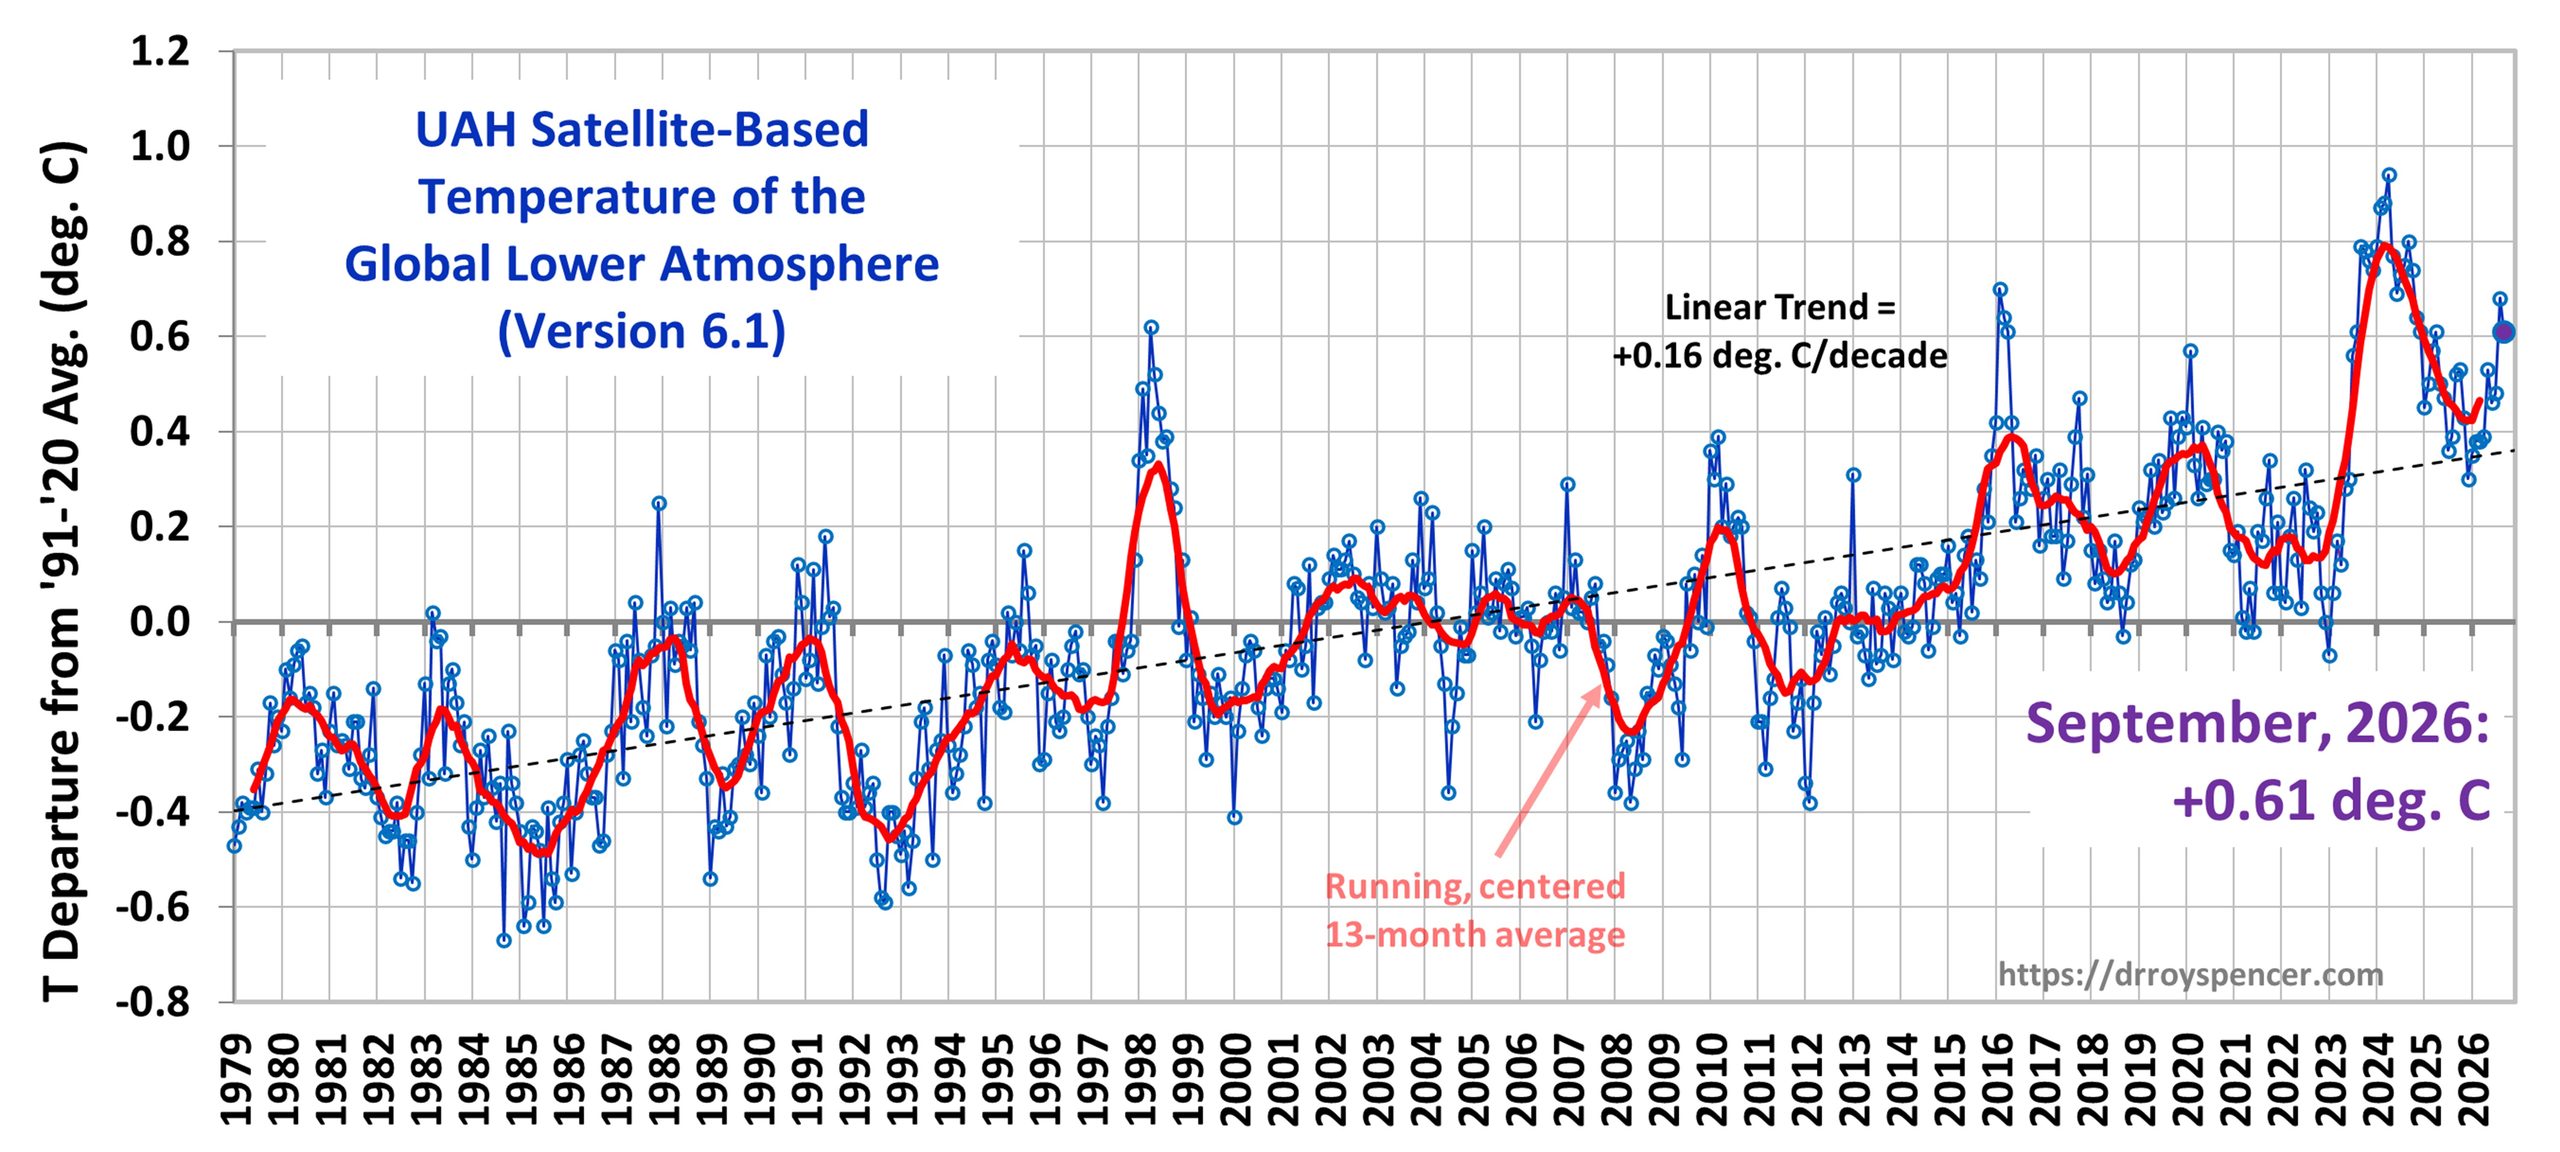
The Version 6.1 global area-averaged linear temperature trend (January 1979 through September 2026) remains at +0.16 deg/ C/decade (+0.22 C/decade over land, +0.13 C/decade over oceans).
The following table lists various regional Version 6.1 LT departures from the 30-year (1991-2020) average for the last 33 months (record highs are in red).
| Year | Mon | Globe | NHem | SHem | Tropic | US48 | Arctic | Aust. | Can. |
| 2024 | Jan | +0.80 | +1.02 | +0.57 | +1.20 | -0.19 | +0.40 | +1.12 | +0.97 |
| 2024 | Feb | +0.88 | +0.94 | +0.81 | +1.16 | +1.31 | +0.85 | +1.16 | +2.45 |
| 2024 | Mar | +0.88 | +0.96 | +0.80 | +1.25 | +0.22 | +1.05 | +1.34 | +1.12 |
| 2024 | Apr | +0.94 | +1.12 | +0.76 | +1.15 | +0.86 | +0.88 | +0.54 | +1.39 |
| 2024 | May | +0.77 | +0.77 | +0.78 | +1.20 | +0.04 | +0.20 | +0.52 | +0.67 |
| 2024 | June | +0.69 | +0.78 | +0.60 | +0.85 | +1.36 | +0.63 | +0.91 | +0.19 |
| 2024 | July | +0.73 | +0.86 | +0.61 | +0.96 | +0.44 | +0.56 | -0.07 | +1.15 |
| 2024 | Aug | +0.75 | +0.81 | +0.69 | +0.74 | +0.40 | +0.88 | +1.75 | +1.36 |
| 2024 | Sep | +0.81 | +1.04 | +0.58 | +0.82 | +1.31 | +1.48 | +0.98 | |
| 2024 | Oct | +0.75 | +0.89 | +0.60 | +0.63 | +1.89 | +0.81 | +1.09 | +0.89 |
| 2024 | Nov | +0.64 | +0.87 | +0.40 | +0.53 | +1.11 | +0.79 | +1.00 | +1.61 |
| 2024 | Dec | +0.61 | +0.75 | +0.47 | +0.52 | +1.41 | +1.12 | +1.54 | +1.65 |
| 2025 | Jan | +0.45 | +0.70 | +0.21 | +0.24 | -1.07 | +0.74 | +0.48 | +1.04 |
| 2025 | Feb | +0.50 | +0.55 | +0.45 | +0.26 | +1.03 | +2.10 | +0.87 | -0.35 |
| 2025 | Mar | +0.57 | +0.73 | +0.41 | +0.40 | +1.24 | +1.23 | +1.20 | +0.80 |
| 2025 | Apr | +0.61 | +0.76 | +0.46 | +0.36 | +0.81 | +0.85 | +1.21 | +0.45 |
| 2025 | May | +0.50 | +0.45 | +0.55 | +0.30 | +0.15 | +0.75 | +0.98 | +0.81 |
| 2025 | June | +0.48 | +0.48 | +0.47 | +0.30 | +0.80 | +0.05 | +0.39 | -0.22 |
| 2025 | July | +0.36 | +0.49 | +0.23 | +0.45 | +0.32 | +0.40 | +0.53 | -0.23 |
| 2025 | Aug | +0.39 | +0.39 | +0.39 | +0.16 | -0.06 | +0.82 | +0.11 | +0.62 |
| 2025 | Sep | +0.53 | +0.56 | +0.49 | +0.35 | +0.38 | +0.77 | +0.30 | +2.44 |
| 2025 | Oct | +0.53 | +0.52 | +0.55 | +0.24 | +1.12 | +1.42 | +1.67 | +2.59 |
| 2025 | Nov | +0.43 | +0.59 | +0.27 | +0.24 | +1.32 | +0.78 | +0.36 | +1.47 |
| 2025 | Dec | +0.30 | +0.45 | +0.15 | +0.19 | +2.10 | +0.32 | +0.37 | -1.86 |
| 2026 | Jan | +0.35 | +0.51 | +0.19 | +0.09 | +0.30 | +1.40 | +0.95 | +1.17 |
| 2026 | Feb | +0.39 | +0.54 | +0.23 | +0.03 | +1.91 | -0.48 | +0.73 | +0.32 |
| 2026 | Mar | +0.38 | +0.33 | +0.42 | +0.07 | +3.74 | -0.48 | +1.14 | -3.17 |
| 2026 | Apr | +0.39 | +0.43 | +0.34 | +0.23 | +1.20 | +0.30 | +0.70 | -0.89 |
| 2026 | May | +0.53 | +0.46 | +0.60 | +0.58 | +0.21 | +0.34 | +0.10 | +0.21 |
| 2026 | June | +0.46 | +0.54 | +0.38 | +0.57 | +0.64 | +1.01 | +0.38 | +0.99 |
| 2026 | July | +0.48 | +0.68 | +0.27 | +0.85 | +1.14 | +0.53 | -0.22 | +0.78 |
| 2026 | Aug | +0.68 | +0.76 | +0.59 | +0.90 | +0.60 | +0.80 | +0.39 | +0.71 |
| 2026 | Sep | +0.61 | +0.78 | +0.44 | +0.89 | +1.32 | +0.80 | +1.13 | +0.99 |
| Year | Mon | Globe | NHem | SHem | Tropic | US48 | Arctic | Aust. | Can. |
Time Series Plots for Tropics, USA48, Canada, and Australia
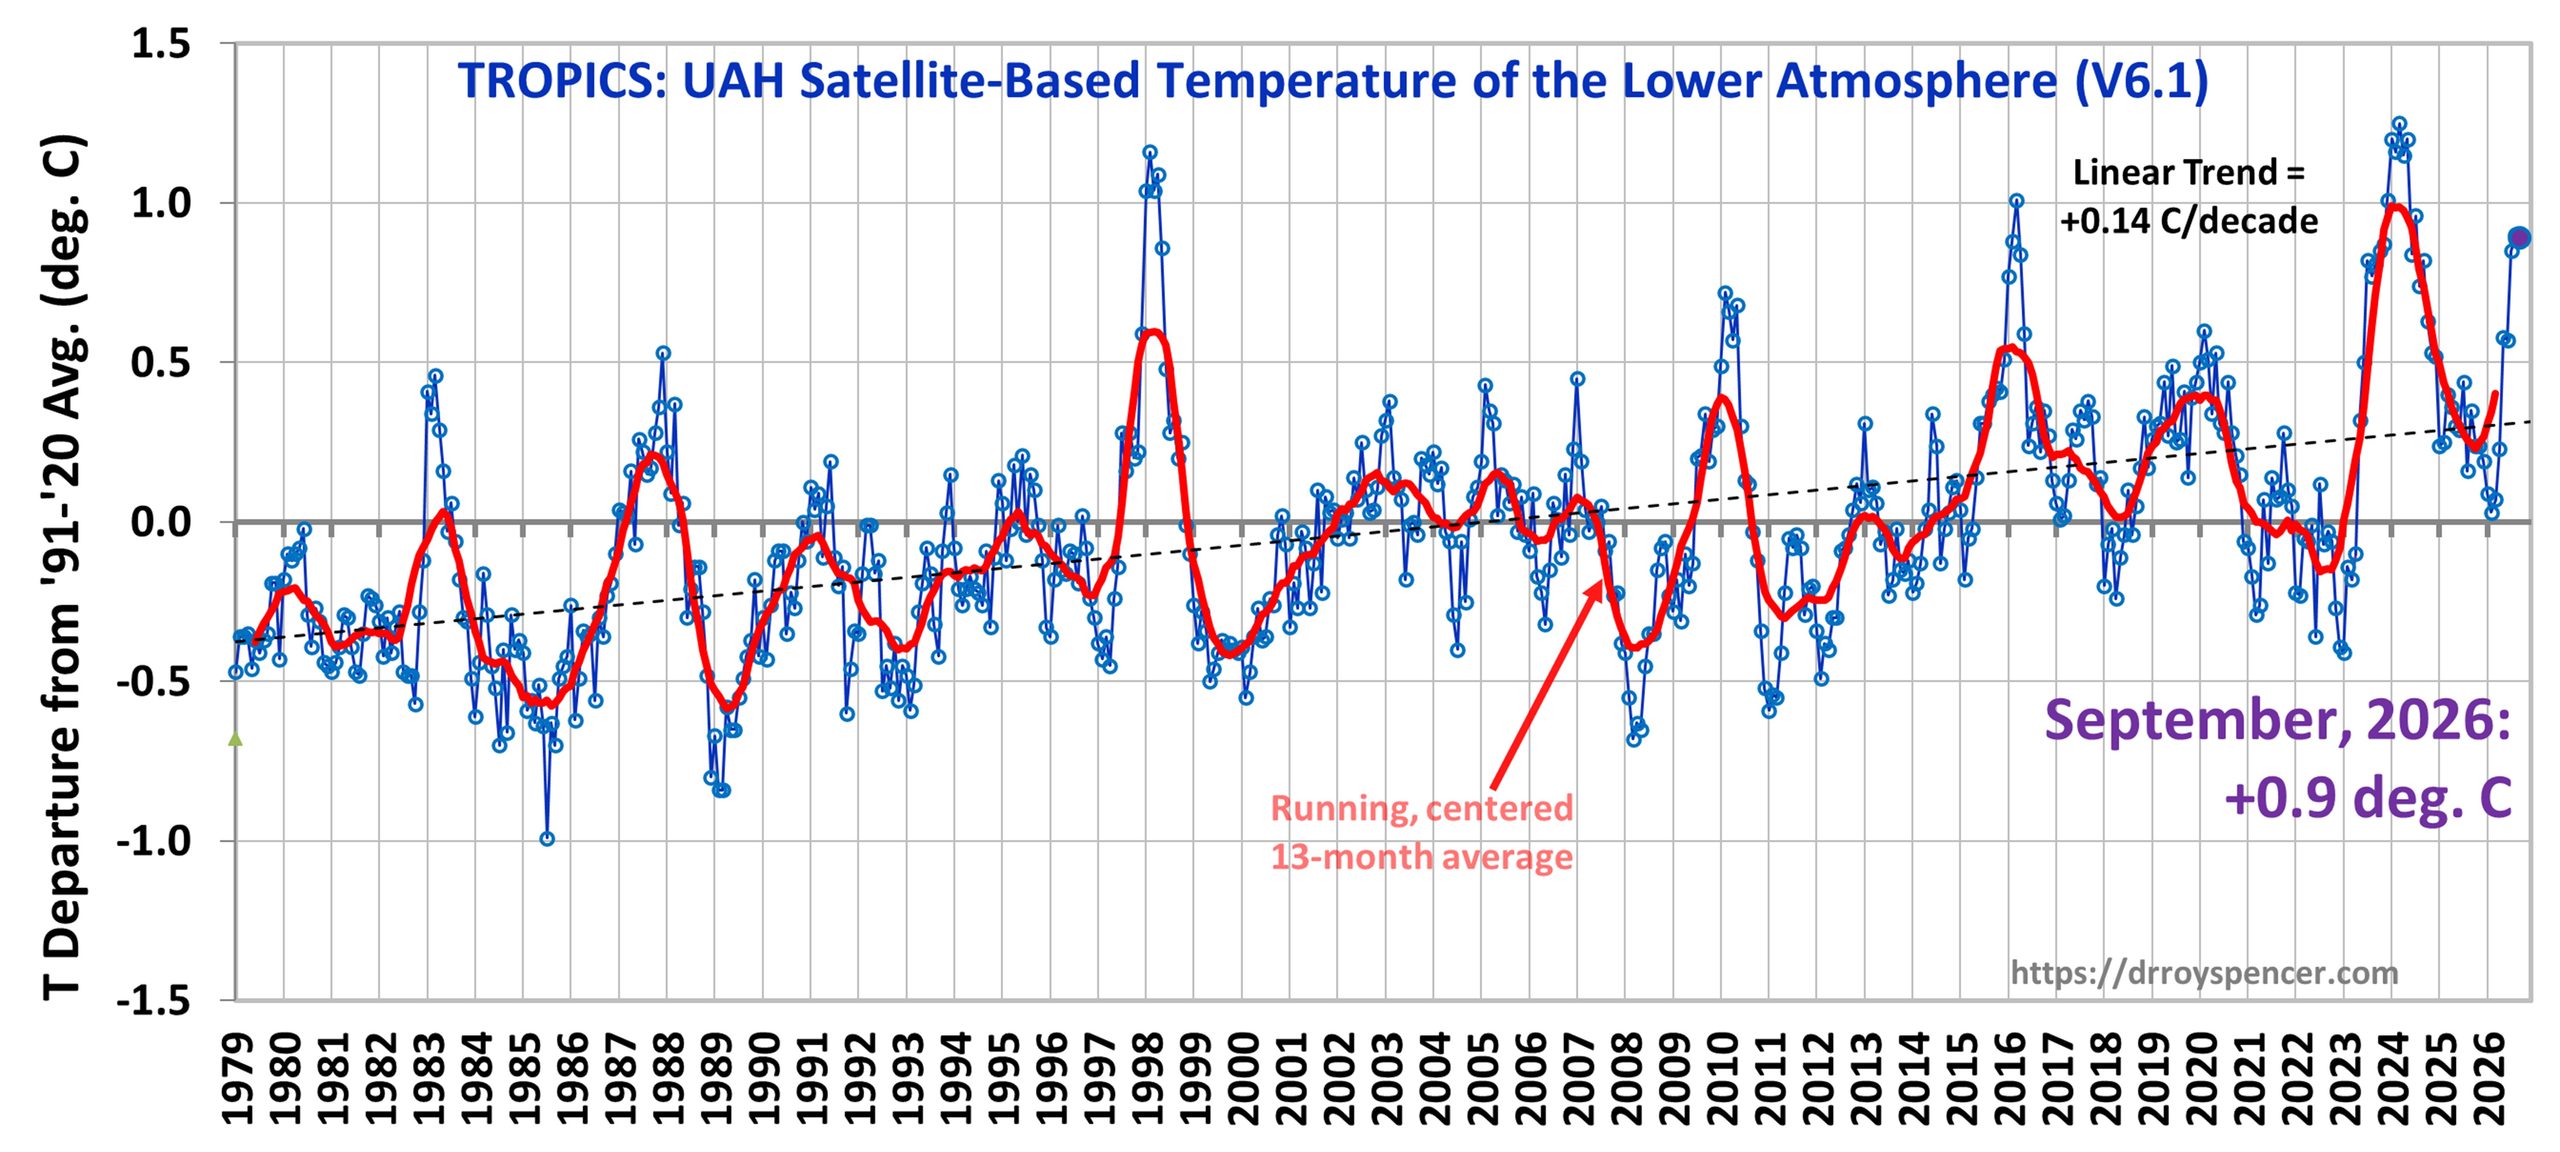
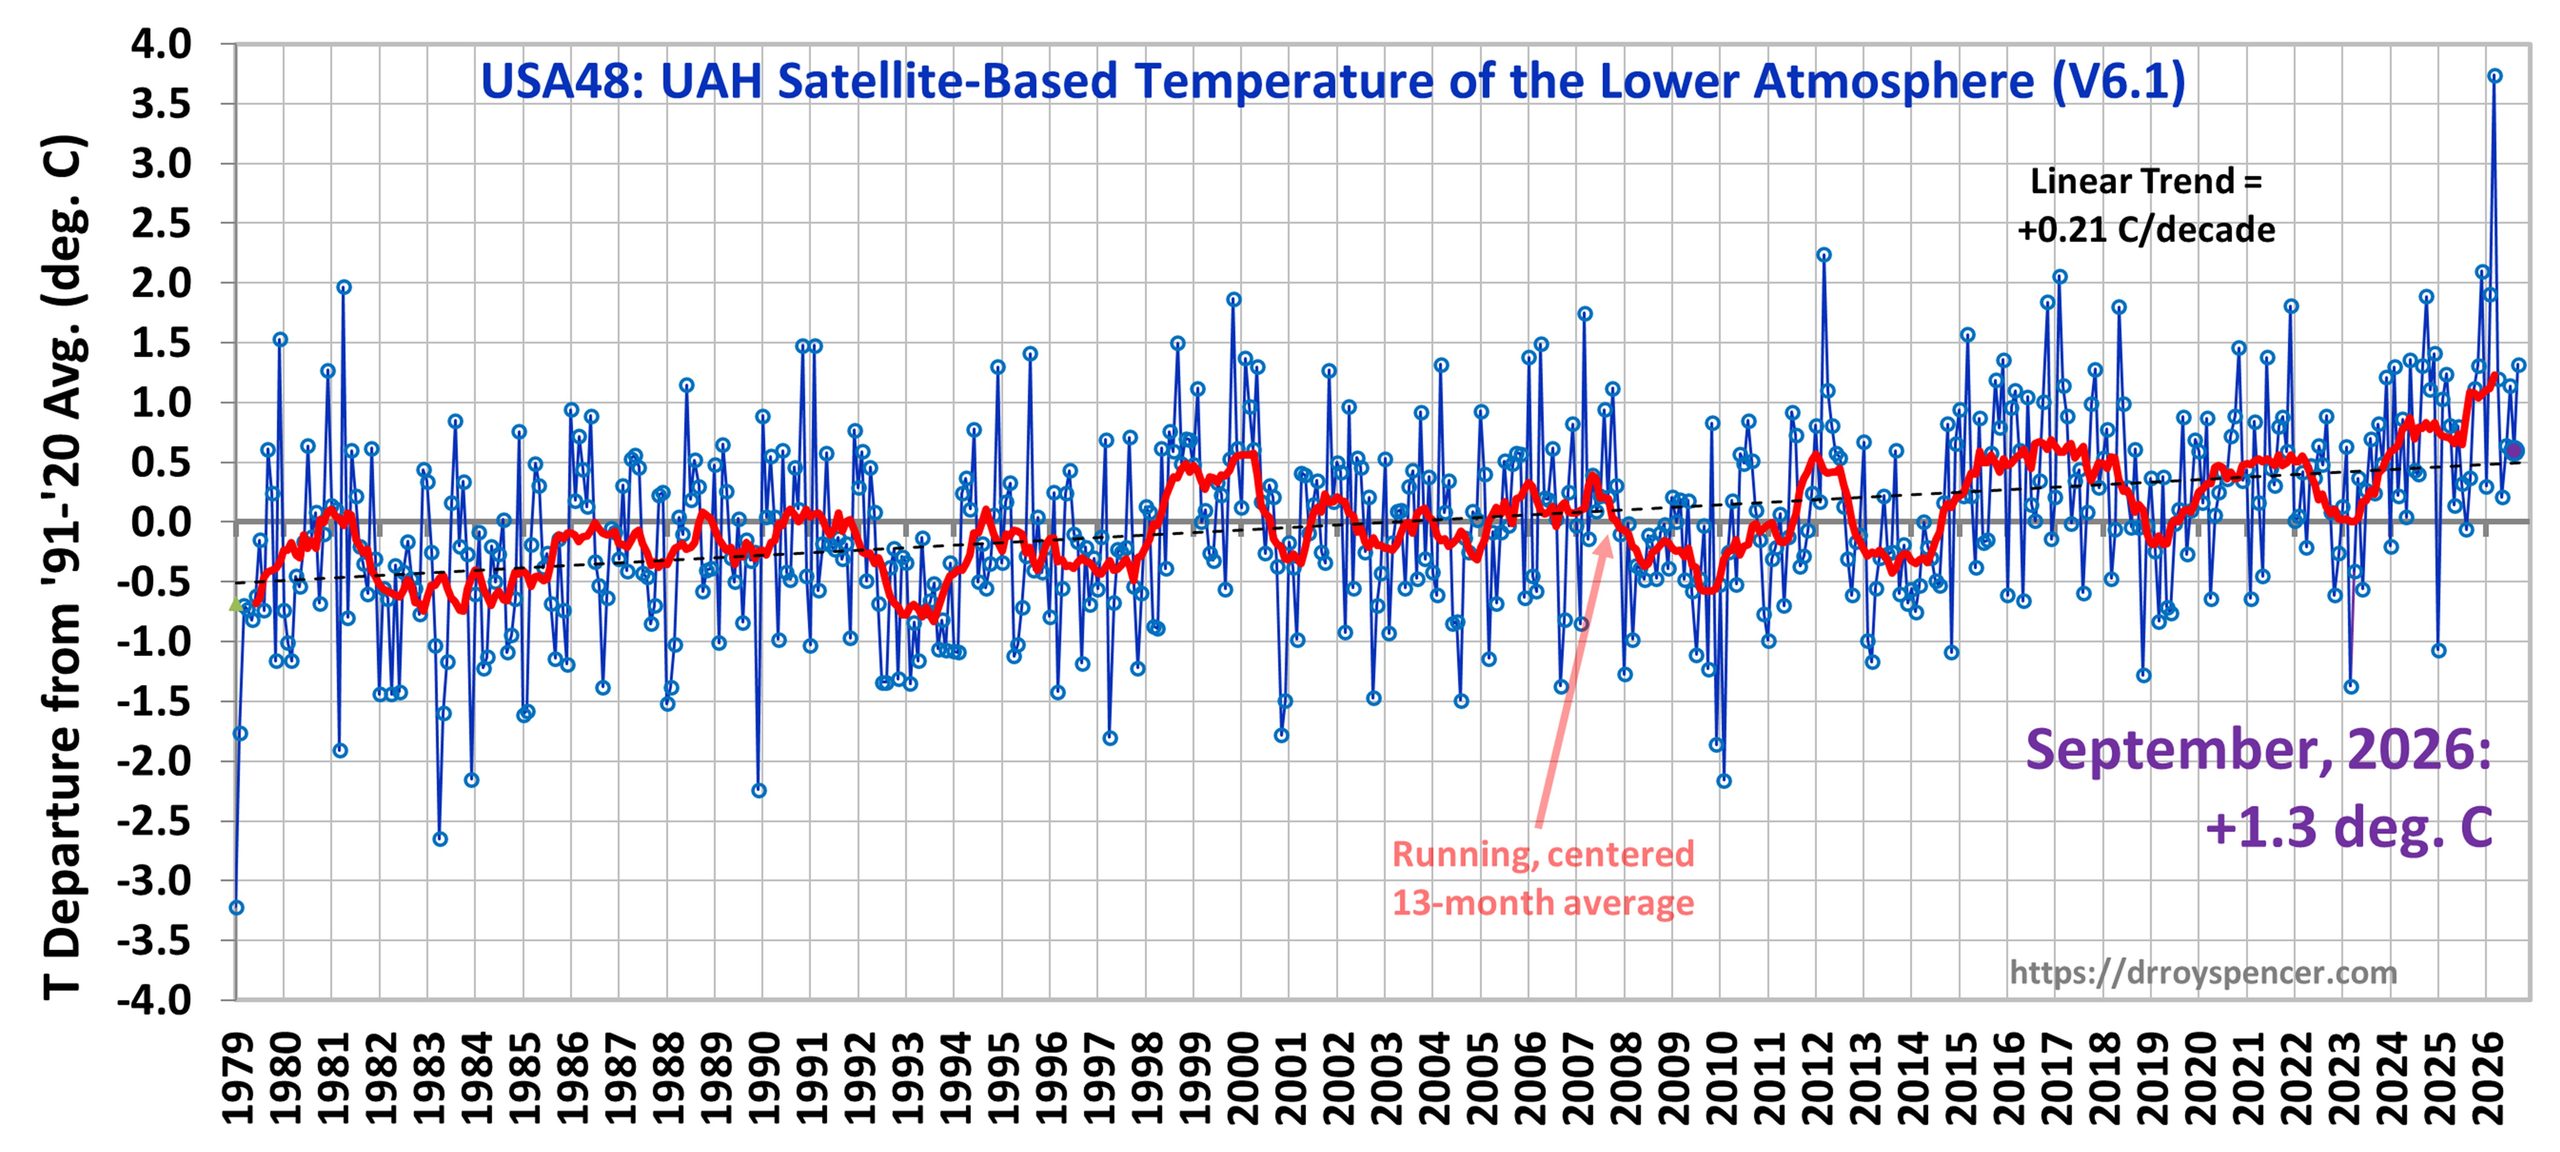
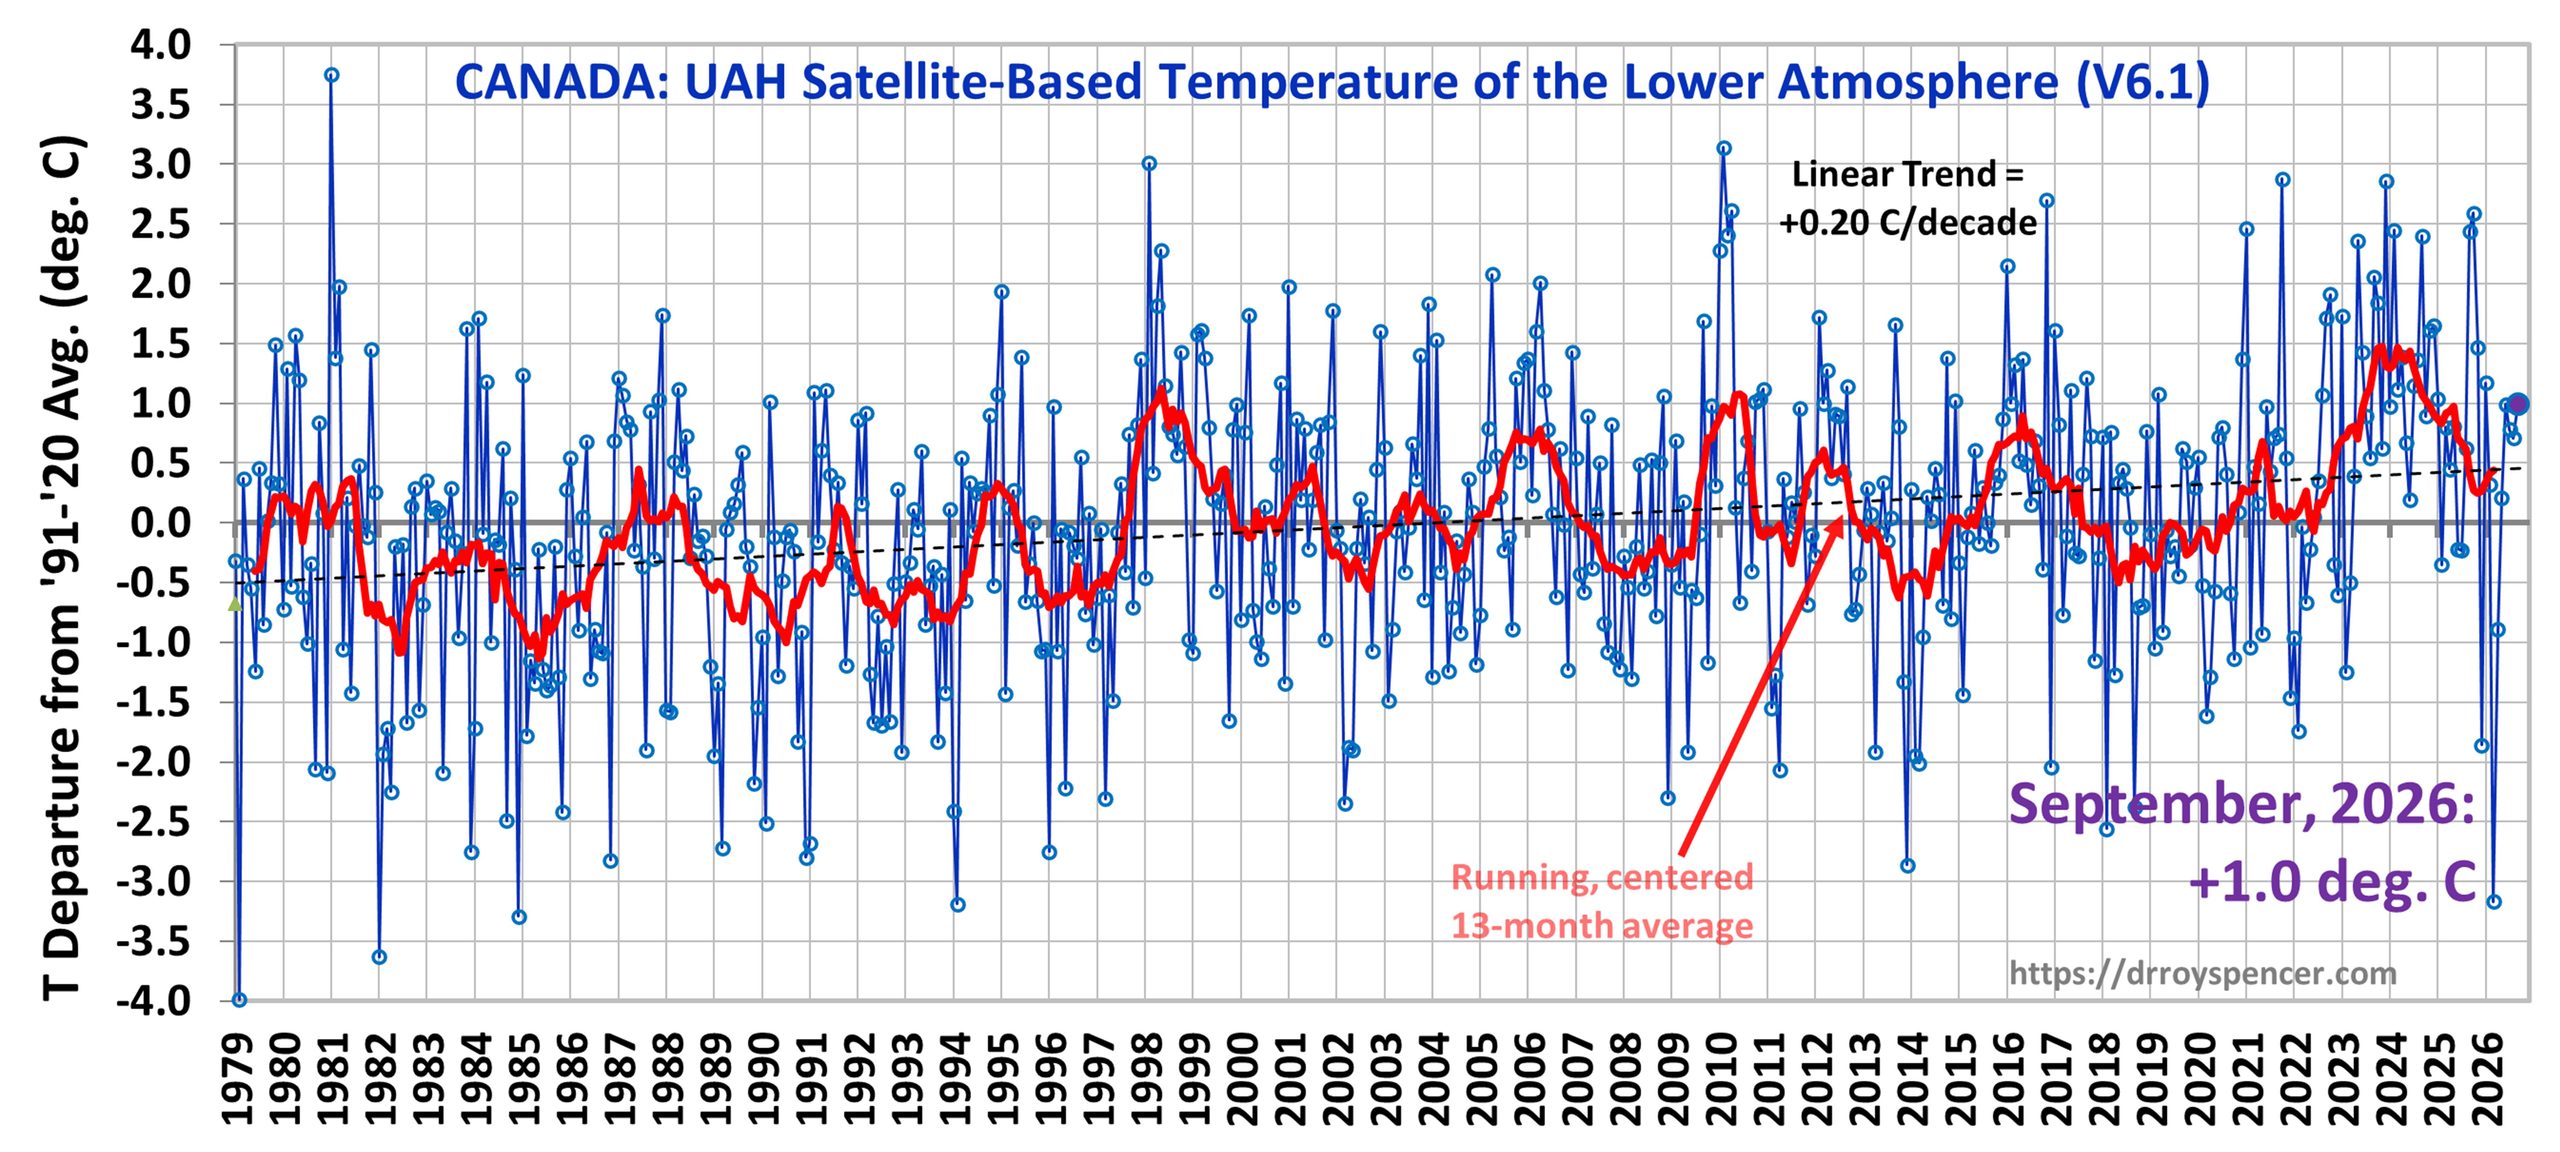
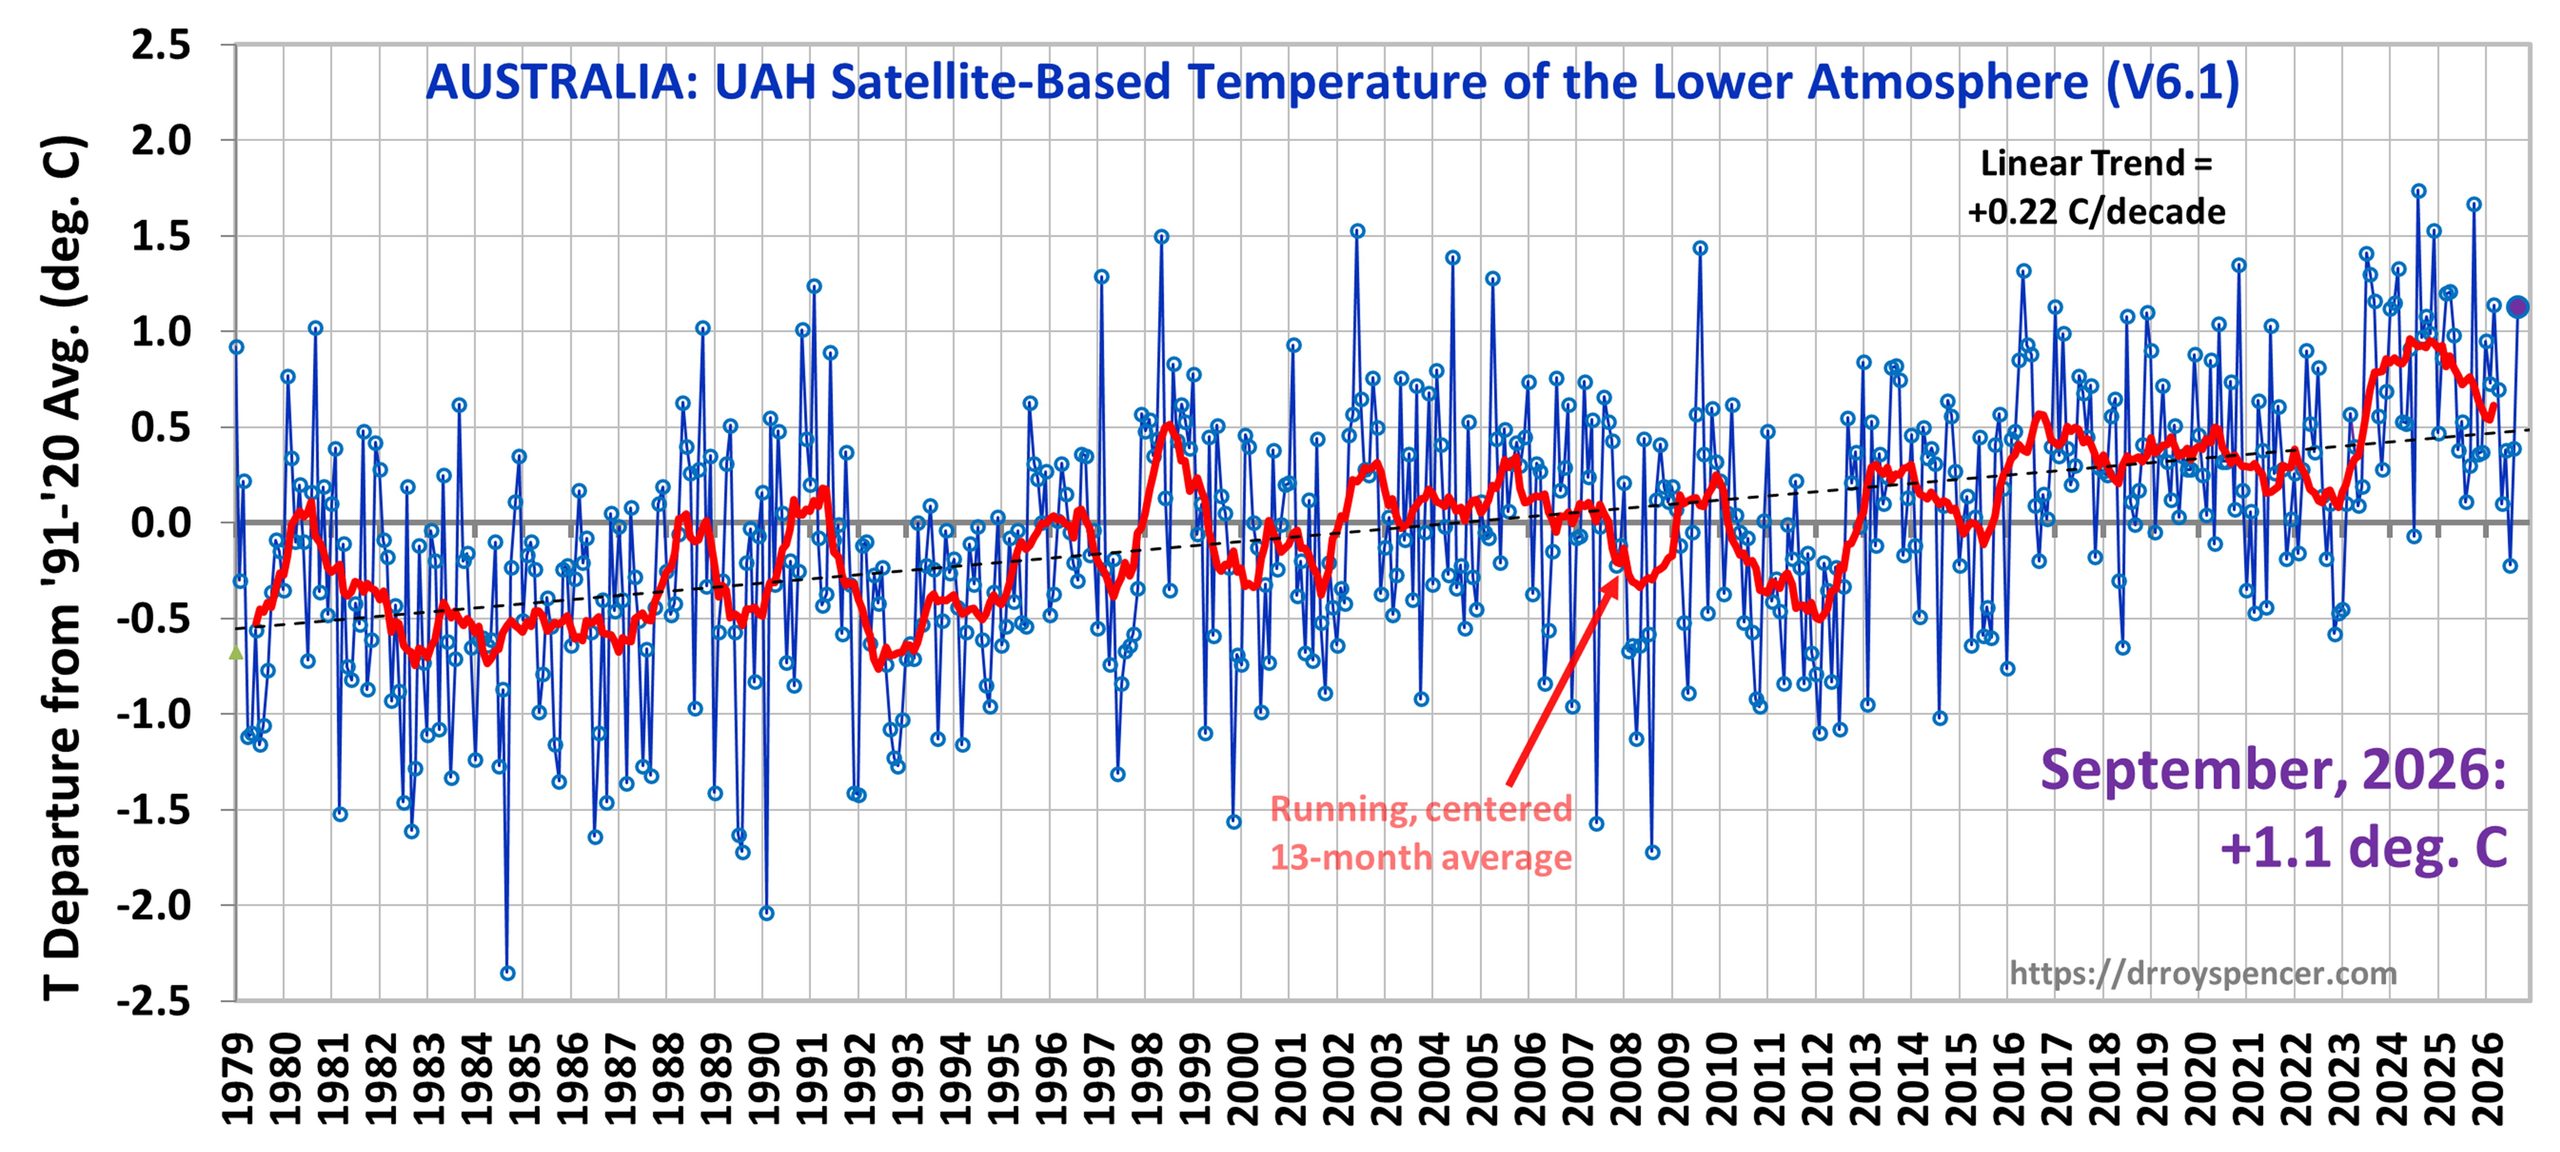
The full UAH Global Temperature Report, along with the LT global gridpoint anomaly map for September, 2026 and a more detailed analysis by John Christy, should be available within the next several days here.
The monthly anomalies for various regions for the four deep layers we monitor from satellites will be available in the next several days at the following locations:





A second-order polynomial fits the observation than a a linear model; the slope of the polynomial is currently 0.29 C per decade.