I just found out that Ron Bailey at Reason.com published an article a few days ago entitled, “What Evidence Would Persuade You That Man-Made Climate Change Is Real?”
I’ve spent some time with Ron, and he is a very sharp guy. That’s why I’m a little disappointed that he would publish this mixture of straw man arguments and uncritical thinking. He is the only deep thinker I know of who switched from being a skeptic about the causes of global warming to a believer…an epiphany which occurred in 2005, according to the article. (Hmmm…I wonder if he was fooled by all those major hurricanes that hit the U.S. that year? It’s now almost 10 years later, and we haven’t had one since.)
The first problem I have is with his premise: that skeptics believe humans have no role in climate change. I don’t know of any serious skeptics who hold such a view. Now, maybe he is addressing people who deny any human involvement in global warming. His article is vague, and maybe he can clarify his intent for us.
The second problem I have is with Ron’s list of a variety of evidences of global-average warming, which (again) no skeptic worth their salt disputes. The science dispute is over how much of the warming is manmade versus natural. Like too many others, Ron conflates climate change with human-caused climate change, which are not the same thing.
Regarding his list, he seems to believe they are independent evidences of manmade warming. Wrong. To the extent warming occurs, even if it is entirely natural, warming would occur in the atmosphere and deep ocean; it would cause an increase in atmospheric water vapor, as well as precipitation; the warming would be stronger in the upper troposphere than the lower troposphere; and stronger over land than over the ocean.
These things would all occur together anyway, no matter the cause of the warming, Ron. And causation is, indeed, the question which science so far cannot answer.
Since climate models cannot even hindcast what has happened (let alone forecast), they clearly have no handle on multi-decadal temperature changes brought about by natural effects. There does not even need to be any forcing — e.g. the sun, volcanoes, etc. — in order for climate to change because the ocean-atmosphere system is nonlinear and dynamical — in a word, chaotic. It can change all by itself. For example, it this plot we see that global warming (and cooling) has been the rule, not the exception, for the last 2,000 years:
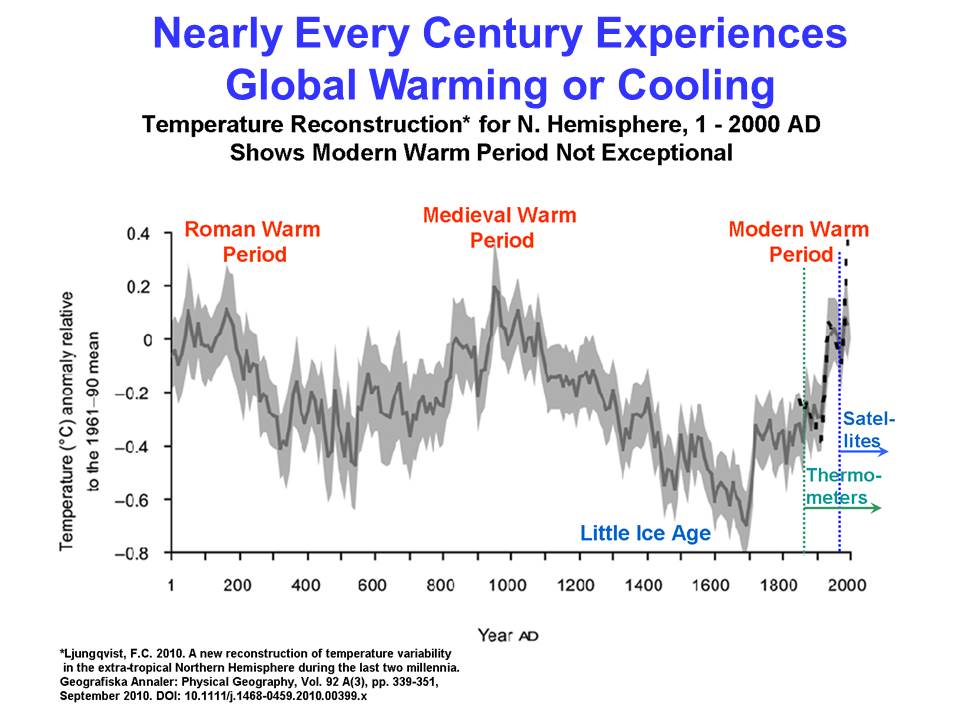
If the above graph is anywhere close to what has actually happened, then most centuries have experienced global warming or cooling. So, what would it take to predict global warming (along with all of the correlated changes, listed above) due to any cause you’d like to invoke?
Basically, all it takes is a flip of a coin.
If you wonder, how could so many scientists be wrong? Well, the medical community had millions of peptic ulcers to study, and it took decades (and two brave Australian researchers) to finally convince them of a bacterial basis for ulcers.
The Earth, in contrast, is a single subject, and we can’t easily or quickly test its response to various treatments. It would be very easy for group think to dominate the scientific community, especially when continued funding depends on a continued climate crisis.
A third problem I have with Ron’s article: he uses “falsifiable predictions” of the future as evidence supporting his case! Really? Well, we’ve already had abundant predictions of what would happen by now from modelers like James Hansen that have turned out to be wrong. There you go, skeptics have real falsified predictions they can point to….not predictions of what might happen 10 years from now.
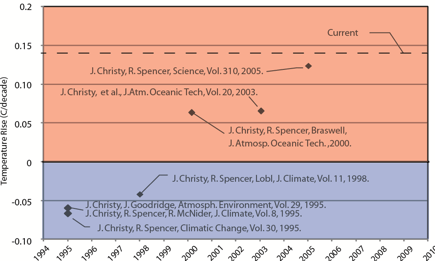
Why didn’t he mention the recent increase in papers (our APJAS paper included) with evidence that recent warming has been partly natural? Yes, as he says, natural variability can work both ways (warming OR cooling), but the available evidence is that recent warming was partly due to nature. Significantly, that warming occurred during the period when climate modelers developed their models, and since they assumed all warming was manmade, they had to increase the models’ sensitivity. Now, they are between a rock and a hard place, continuing to publish overly-sensitivity models they know are wrong (based upon both surface AND deep ocean warming rates).
Such a travesty would never be allowed in a hard discipline that uses physics, like engineering. An impartial judge with any cajones wouldn’t even allow climate models as evidence in a court of law since they have, so far, largely failed in their predictions.
Does Ron know that the deep-ocean warming since the 1950s is so weak (if it is even real from an observational error perspective) that it represents only a 1 part in 1,000 imbalance between incoming and outgoing energy? Do we really believe that chaotic changes in the circulations of the ocean and atmosphere cannot create such a tiny imbalance? The above graph (along with historical evidence of the Little Ice Age and Medieval Warm Period) suggests such small changes are fairly routine.
So, Ron asks what evidence would convince me that recent warm was manmade? Well, how about knowledge of how much natural climate change would have occurred without human influence? Then we would know the remainder was human-induced. Except, there is no way to know the natural component. If there was, climate models would have reasonably replicated the temperature changes since the 1950s rather than looking like a bowl of spaghetti.
And since I already believe manmade climate change (to some non-zero extent) is real, maybe I can ask Ron: What evidence would persuade you that your original question is nothing more than a straw man argument?
I hate to impute motives, but I really have to wonder if he is succumbing to peer pressure, since believing anything that smacks of denial-ism is really frowned upon in the intellectual circles I’m sure Ron is part of.
Yes, I believe that adding CO2 to the atmosphere has probably caused some warming, even though there is no way to prove it. Just how much human-caused warming is the question. And, as Ron correctly notes, it says nothing about what if anything should (or even can) be done about it anyway.

 Home/Blog